Variation of magnetic properties of Sr2FeMoO6 due to oxygen vacancies
Abstract
Oxygen vacancies can be of utmost importance for improving or deteriorating physical properties of oxide materials. Here, we studied from first-principles the electronic and magnetic properties of oxygen vacancies in the double perovskite Sr2FeMoO6 (SFMO). We show that oxygen vacancies can increase the Curie temperature in SFMO, although the total magnetic moment is reduced at the same time. We found also that the experimentally observed valence change of the Fe ions from to in the x-ray magnetic circular dichroism (XMCD) measurements is better explained by oxygen vacancies than by the assumed mixed valence state. The agreement of the calculated x-ray absorption spectra and XMCD results with experimental data is considerably improved by inclusion of oxygen vacancies.
1 Introduction
Double perovskites O6 ( = alkaline earth or rare earth metal atoms and = heterovalent transition metal atoms such as = Fe, Cr, Mn, Co, Ni; = Mo, Re, W) often demonstrate intrinsically complex magnetic structures and a wide variety of physical properties (see [1] for a review article on these materials). In order to understand the complex properties, experiments on SFMO included numerous methods like photoemission spectroscopy (PES) [2, 3, 4], Mössbauer spectroscopy [5, 6], neutron scattering [7, 8, 9], x-ray absorption spectroscopy (XAS), and x-ray magnetic circular dichroism (XMCD) measurements [10, 11, 12]. Since the XAS and XMCD spectroscopy is very sensitive to the electronic structure and the local environment, comparing calculated spectra to the available experimental results can provide important information about the chemical composition, the ionic valency, and the degree of electronic correlations in the system. Thus, we simulated the XAS and XMCD spectra with our method and found a better agreement than previous density functional calculations [13]. Our results indicate as well a mixed valency of the Fe ion (Fe2+ or Fe3+) observed by experiments [6, 7, 10, 11], but we can also conclude from our study that the mixed valency is mainly caused by oxygen vacancies.
In addition, several experimental and theoretical studies have demonstrated that the double perovskite system Sr2FeMoO6 (SFMO) and other related materials exhibit a ferrimagnetic (FiM) half-metallic ground state with a high Curie temperature of [14, 15, 16, 17]. The physical origin of the magnetoresistance in SFMO is half-metallicity [18], i.e., the material is an insulator in one of the spin channels, but a metal in the other. This leads to a complete spin polarization at the Fermi level, which immediately suggests their application as a source of spin polarized charge carriers in spintronic devices. Therein, SFMO will be used mainly as a thin film, and many attempts were made to grown high quality films [19, 20, 21, 16, 17]. But all these films yield a reduced Curie temperature, which is up to smaller than for bulk samples [16, 17]. Even for bulk SFMO the theoretical magnetic moment of was rarely experimentally observed [8]. Such variations were attributed to lattice defects like grain boundaries or point defects. In particular, swapping of Fe and Mo ions, antisite disorder (ASD), [22, 23, 24, 25, 26, 27, 28] and oxygen vacancies (V) [25, 26, 29, 30] were shown to reduce the magnetization of SFMO.
Nevertheless, no study addressed explicitly the variation of the Curie temperature, , with oxygen vacancies (V). We deploy therefore the Korringa-Kohn-Rostoker Green’s function (KKR-GF) method with the coherent potential approximation (CPA). We calculated magnetic coupling constants using the magnetic force theorem[31] and used it with a classical Heisenberg model in order to calculate the Curie temperature similarly done as in Refs. [32, 33]. A similar approach handling ASD from first-principles was beyond the scope of this work, since the distribution of those antisite defects has to be studied carefully. A simple random distribution might be ruled out by Ref. [34] showing a tendency for antiphase patches, which makes the study of the magnetic coupling of antisite defects a work on its own.
In the following section, we describe the lattice structure of SFMO used in our calculations and give details about the calculation techniques. In Sec. 3, we present the XAS and XMCD calculations for the SFMO compound and demonstrate that oxygen vacancies have to be present in SFMO samples. The influence of oxygen vacancies on the electronic structure and magnetic properties is then discussed in Sec. 4.
2 Numerical Details
For our calculations of SFMO, we adopted the experimentally found double perovskite structure, where the oxygen atoms provide an octahedral environment around the Fe and Mo sites. The FeO6 and MoO6 octahedra alternate along the three cubic axes, while the Sr atoms occupy the hollow site formed by the corners of the FeO6 and MoO6 octahedra at the body-centered positions (figure 1).
SFMO was found to be cubic () in the paramagnetic phase, but changes into a tetragonal-type structure below a critical temperature [9]. The Sr atoms occupy the 4 Wyckoff positions (0, , ). The Fe atoms occupy the 2 Wyckoff pos. (0, 0, 0) and Mo the 4 Wyckoff pos. (0, 0, ). There are two types of oxygen atoms with Oz at the 4 Wyckoff pos. (0, 0, ) and Oxy at the 8 Wyckoff pos. (, , 0) (figure 1). Their positions is not definite and varies between different studies. They occupy either the site exactly between Mo and Fe, which gives the body centered tetragonal structure type (; No. 139 [35, 36]) or the oxygen octahedra are slightly distorted (, No. 87 [37, 38]). We used for simplicity the more symmetric body centered tetragonal structure type and the lattice constant an internal parameters from [36] as input for our study.
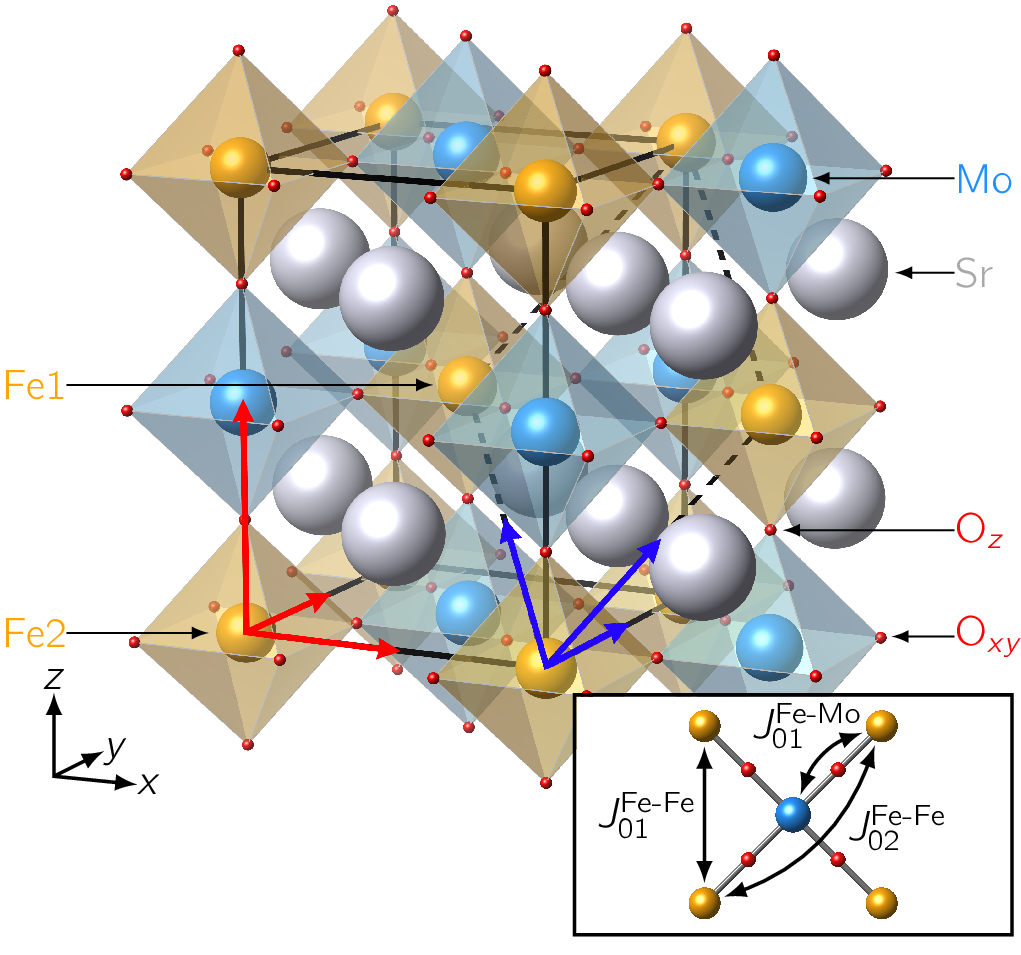
We note as well that the slight tetragonal distortion is lifting the degeneration of the states. The crystal field at the Fe (Mo) site (now point symmetry) splits the Fe (Mo) 3 (4) orbitals into three singlets (), (), and () and a doublet ( and ). Since the deviation from the ideal ratio is only small, the states and , as well as the states , and , form two groups of states, which showed an almost similar density of states (DOS). Those are considered as and in accordance with other publications.
For the microscopic understanding of the SFMO compound, we combined the theoretical results of three computational methods, namely the multiple scattering KKR-Green’s function method HUTSEPOT [40, 41], the spin-polarized fully relativistic linear-muffin-tin-orbital (SPR-LMTO) method [42, 43, 44] and the Vienna ab initio simulation package (VASP) [45, 46]. The main investigation of the electronic and magnetic properties were conducted with HUTSEPOT, whereas the XAS and XMCD spectra were calculated within the SPR-LMTO, and necessary structure relaxations were achieved with VASP. All relevant input parameters and the discussion about the correct treatment of the electronic structure of SFMO are provided in the Supporting Information (SI).
3 X-ray absorption and XMCD spectra
The valency of the Fe ions is not finally resolved. Experimental studies find a mixed valency state of Fe2+ and Fe3+ [6, 7, 11, 10] but theoretical calculations result a ground state with Fe3+ [23, 47, 26]. In order to solve this discrepancy, the x-ray absorption and XMCD spectra at the L2,3 absorption edges can be used in a complex transition metal ionic compound such as SFMO as fingerprints of the ground state.
We used a supercell approximation with a cell of two functional units of SFMO (see red arrows in figure 1). This supercell was relaxed with VASP including a single oxygen vacancy close to Fe2. The relaxation with VASP for a single oxygen vacancy led to a distance of between Fe2 and the vacancy – an increase by . The correspondent distance between the Fe1 ion and the oxygen vacancy was reduced by to . In order to crosscheck effects of ASD on the calculated spectra, we included also one antisite defect into the supercell. We found, similarly as in [26], no significant internal relaxations.
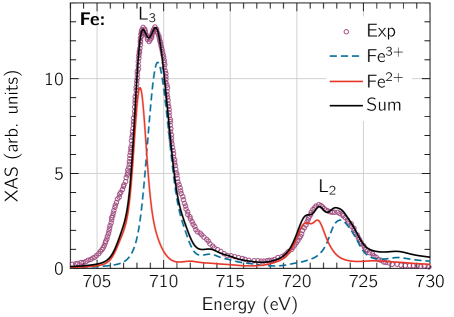
The experimentally measured Fe L2,3 absorption spectrum of the SFMO single crystal (Ref. [10], average of left and right circularly polarized light) displays at both absorption edges a weak lower-energy shoulder together with a doublet structure at the white line position with almost the same magnitude (figure 2). The complex fine structure of the Fe L2,3 XAS is not compatible with a pure Fe3+ valency state, since we observed only one peak – similar to [13] – instead of a double peak structure. In order to provide a quantitative description of the spectral features, we took into account both Fe valencies and , separately, using a primitive unit cell. The theoretically calculated Fe L2,3 XAS agrees most closely with the experimental data by using those results in a linear combination of Fe3+ and Fe2+ (figure 2), which is opposite to the calculated proportion found in Ref. [10] using the framework of the ligand-field atomic formalism.
Considering that the correct Fe valency in the SFMO ground state is 3+ as concluded in many theoretical studies, the mixed valency state might follow again from lattice defects as speculated in [13]. We investigated the influence of the two types of defects in the tetragonal supercell (figure 1). For the antisite defects, we observed only the Fe3+ solution. This can be connected with the high defect concentration modeled within the supercell. However, a single vacancy among twelve oxygen atoms models a more realistic concentration. Self-consistent calculations in the tetragonal supercell produce the valency of the Fe ions being equal to 2.9+ and 2.4+ at the Fe1 and Fe2 sites, respectively. Therefore, the existence of the vacancy shifts the valency of the nearest Fe ion (Fe2) towards 2+. This valency change could be also observed below in the CPA calculation of the DOS including oxygen vacancies (figure 5).
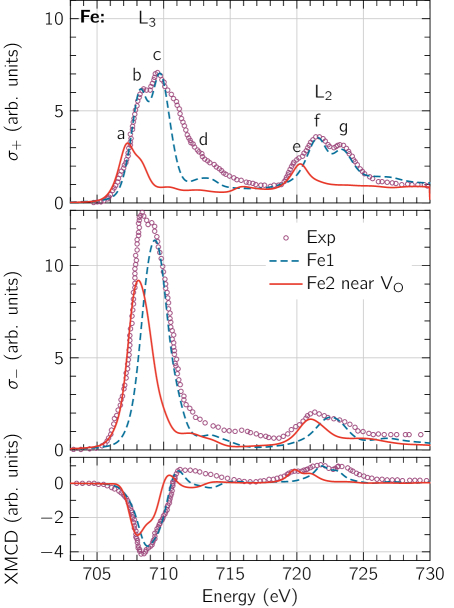
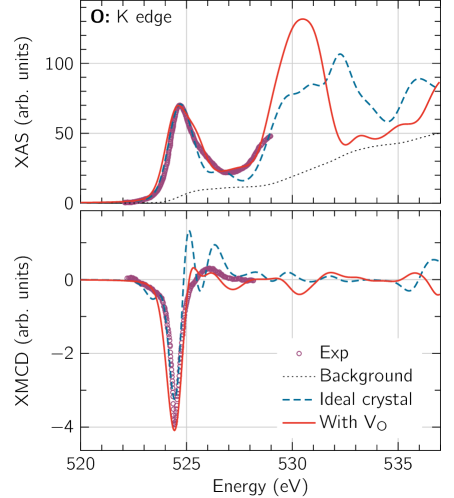
Indeed, the full explanation of the experimental spectra is only possible by taking into account these crystal imperfections. The Fe L3 x-ray absorption spectrum for left circularly polarized light () possesses four major fine structures a, b, c and d (figure 3). We found that the calculations for the ideal crystal structure with the Fe3+ ground state solution (dashed blue line) provides the x-ray absorption intensity only at the major peaks b, c, and d and do not reproduce the low energy shoulder (peak a) as well as the low energy peak e at the L2 edge. The calculations with the Fe3+ solution produce only one high energy peak structure in the L3 spectrum (middle panel). However, the experimental measurements exhibit a double-peak structure. The x-ray absorption from the Fe2 atoms with the oxygen vacancy nearby (solid red line) contributes to the low energy peak of absorption (figure 3). The relative intensity of the peaks depends on the relative concentration of the Fe1 and Fe2 ions in SFMO, in other words, the concentration of defects such as oxygen vacancies. It is similar for the oxygen K edge. The calculations including an oxygen vacancy are in better agreement with the experimental measurements in the x-ray absorption as well as in the XMCD (figure 4).
The XAS and XMCD spectra at the Mo L2,3 and M2,3 edges are less sensitive for the crystal defects. For both edges the agreement with the experimental measurements [13] is quite good and independent from the concentration of oxygen vacancies (see SI, figures S4 and S5).
4 Electronic and Magnetic Properties with Randomly Distributed Oxygen Vacancies
We saw above that oxygen vacancies are certainly present in most samples of SFMO, while their impact on electronic and magnetic properties should be studied in detail. The KKR-GF method combined with the coherent potential approximation (CPA) allows the study of arbitrary concentrations of randomly distributed oxygen vacancies as done before for SrCoO3-δ [33]. The oxygen vacancies were simulated inside the primitive unit cell with one functional unit of SFMO (see blue arrows in figure 1). The internal lattice positions had to be kept static [36]. We introduced a certain percentage of empty spheres at the lattice sites of the oxygen ions, which are modeled as randomly distributed via CPA. The typical oxygen-deficiency ranges between 0.006 to 0.36 [29, 48, 24]. This represents of the total oxygen amount in defect-free SFMO.
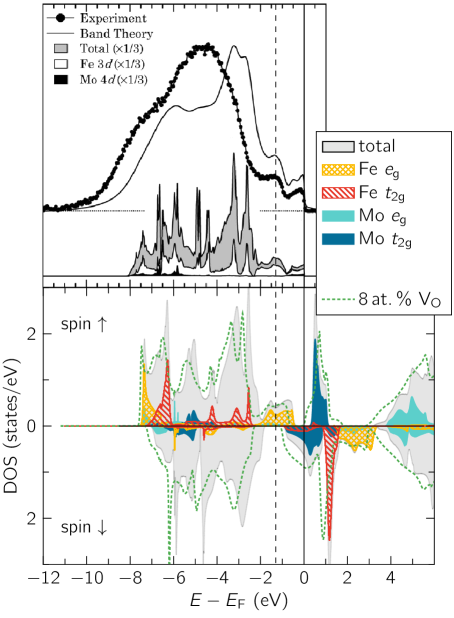
We obtained for defect-free SFMO the half-metallic ground state by applying correlation corrections following Refs. [47, 49, 26] (figure 5). Although the half-metallic ground state would be well represented within the self-interaction correction (SIC) [47], the Fe states localize too much. Hence, we applied an parameter on the states of Fe with as a compromise, because we are aware that the correct treatment of the electronic structure is very sensitive to the structural [23] and methodological differences [18, 50, 28] (see SI). Following optical [51] and photoemission spectroscopy (PES) [2, 3, 4] measurements, the band gap should be , and should open between the Mo states and the Fe states.
Of course, a direct comparison of calculated DOS and experimental spectra is very complicated, since thermal broadening and defect levels can easily reduce the ideal band gap. Saitoh et al[2] noticed for example possible ASD in their samples (up to ) but could not account for defects in their theoretical interpretation. ASD inside SFMO deteriorate the DOS at the Fermi energy because new states appear in the majority spin channel [23, 25, 26, 28] and reduce the spin polarization, which was indeed observed experimentally [52]. In contrast, a low concentration of oxygen vacancies does not alter the half-metallic character of SFMO [25, 26, 30], but additional Fe and Mo states become occupied [26]. This indicates a lower valency of the Fe and Mo ions. Electrons of the removed oxygen atoms occupy states of Fe and Mo ions. A similar qualitative behavior was observed within our calculations of oxygen-deficient SFMO with CPA (green dashed line in figure 5). The averaging within the CPA broadens all states.
-
1XMCD measurement
-
2Neutron diffraction experiment
-
3Theory
Even more interesting is the effect of oxygen vacancies on the magnetic properties of SFMO. As a starting point, we compare briefly the numerically obtained magnetic properties for defect-free SFMO with measured results and introduce then oxygen vacancies again. The expected ferrimagnetic (FiM) ground state of defect-free SFMO was always energetically favorable when comparing possible magnetic configurations. The Fe spin and orbital moments in FiM are parallel, whereas the spin and orbital Mo moments are antiparallel to each other, in accordance with Hund’s third rule (table 1). We obtain a good agreement for the orbital Fe magnetic moment () with the FPLMTO result of Jeng and Guo [54] () and the LMTO results of Kanchana et al[13] (). The calculated spin and orbital moments of the Mo atom are always larger in comparison with earlier calculations [55, 18, 53, 54, 13]. Also, the Fe spin moment of is in a good agreement with the experimental neutron diffraction measurements [8] and the theoretical ideal value for the Fe3+/Mo5+ or Fe2+/Mo6+ valency configuration (table 1). However, typical values for the magnetization reported in experimental studies are smaller than . This reduction was always attributed to point defects [22, 56, 10, 29].
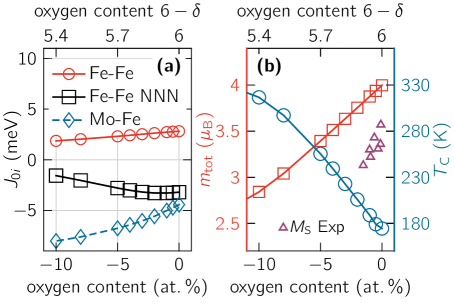
We used the CPA to simulate randomly distributed defects and indeed an almost linear decrease of the total magnetic moment agreeing qualitatively with an experimental study by Kircheisen et al[29] was observed (figure 6(b)). The offset of the measurement at will result from other point defects like ASD [22]. Surprisingly, the Curie temperature is increasing with more oxygen vacancies, while the total magnetic moment is reduced at the same time (figure 6(b)). We obtained the Curie temperature by calculation of the magnetic exchange interactions and consider them up to a distance of in a Monte Carlo simulation with a classical Heisenberg model [32]. Thoses result agree also with the mean-field approximation (MFA) or the random-phase approximation (RPA) considering that MFA usually overestimates .
Although for defect-free SFMO is below the range of experimental values , we are interested in the relative variation of with the amount of oxygen vacancies, which is roughly per of oxygen vacancies. Experimental results might therefore be enhanced by tens of kelvin due to oxygen vacancies.
The reasons for this increase in can be understood from the magnetic exchange interactions. The most prominent coupling constants of the order of several have only a very restricted range up to (figure 6(a)). This includes only the interactions up to the next nearest neighbor Fe ions (see inset in figure 1). Due to the tetragonal structure, all magnetic exchange interactions show a small asymmetry with respect to those with a component in direction. For clarity, only the coupling constants in the --plane are shown (figure 6(a)).
The calculations of were performed in the FiM reference state. We observe for defect-free SFMO a strong antiferromagnetic (AFM) coupling between Fe and Mo ions and a ferromagnetic coupling between nearest neighbor Fe–Fe, . The next nearest Fe–Fe coupling constants, , have also an AFM character but are not enough to destabilize the FiM ground state of SFMO (see figure 6(a) for ). Introducing now the oxygen vacancies in a random fashion reduces the oxygen mediated exchange between the Fe ions but favors the AFM exchange between Fe and Mo ions (figure 6(a)). This behavior resembles a stronger orbital localization as observed with an increase of electron correlation parameter (see SI). The stronger localization of the orbitals leads to a decrease of the electron hopping and, thereby, to a decrease in the magnetic coupling strength. Together, the total magnetic moment will be indeed reduced but the stronger AFM coupling between Fe and Mo sites will at the same time mediates an additional FM coupling and increases .
5 Conclusions
We focused our study on the impact of oxygen defects on the magnetic properties of SFMO and made two crucial findings:
Our simulated x-ray absorption spectra (XAS) and x-ray magnetic circular dichroism spectra (XMCD) show a better agreement with experimental spectra [6, 7, 10, 11] than previous density functional calculations [13]. This indicates that the experimentally observed mixed valency of the Fe ion (Fe2+ or Fe3+) is mainly caused by oxygen vacancies.
Second, we could explain the experimentally observed reduction of the total magnetic moment of SFMO by an increasing amount of oxygen vacancies following from a variation of the FM and AFM magnetic coupling between the Fe and Mo ions. At the same time, the Curie temperature shows a strong increase of roughly per of oxygen vacancies.
Since the growing conditions of SFMO samples could be influenced by the oxygen partial pressure, oxygen vacancies could be a tool to improve the magnetic properties of SFMO, in particular, because the half-metallic band gap is not influenced by oxygen vacancies.
References
References
- [1] Serrate D, De Teresa J M and Ibarra M R 2007 J. Phys.: Condens. Matter 19 23201 URL http://stacks.iop.org/0953-8984/19/i=2/a=023201?key=crossref.c682812d9d899d156577e366cddf1dbd
- [2] Saitoh T, Nakatake M, Kakizaki A, Nakajima H, Morimoto O, Xu S, Moritomo Y, Hamada N and Aiura Y 2002 Phys. Rev. B 66 035112 URL http://link.aps.org/doi/10.1103/PhysRevB.66.035112
- [3] Kang J S, Kim J H, Sekiyama A, Kasai S, Suga S, Han S W, Kim K H, Muro T, Saitoh Y, Hwang C, Olson C G, Park B J, Lee B W, Shim J H, Park J H and Min B I 2002 Phys. Rev. B 66 113105 URL http://link.aps.org/doi/10.1103/PhysRevB.66.113105
- [4] Kim J H, Wi S C, Yoon S, Suh B J, Han S W, Kim K H, Sekiyama A, Kasai S, Suga S, Hwang C, Olson C G, Park B J, Lee B W and Introduction I 2003 J. Korean Phys. Soc. 43 416
- [5] Sarma D D, Sampathkumaran E V, Ray S, Nagarajan R, Majumdar S, Kumar A, Nalini G and Guru Row T N 2000 Solid State Commun. 114 465 URL http://www.sciencedirect.com/science/article/pii/S003810980000079X
- [6] Lindén J, Yamamoto T, Karppinen M, Yamauchi H and Pietari T 2000 Appl. Phys. Lett. 76 2925 URL http://scitation.aip.org/content/aip/journal/apl/76/20/10.1063/1.126518
- [7] Kapusta Cz, Riedi P C, Zajac D, Sikora M, De Teresa J M, Morellon L and Ibarra M R 2002 J. Magn. Magn. Mater. 242-245 701 URL http://www.sciencedirect.com/science/article/pii/S0304885301009982
- [8] García-Landa B, Ritter C, Ibarra M R, Blasco J, Algarabel P A, Mahendiran R and García J 1999 Solid State Commun. 110 435 URL http://www.sciencedirect.com/science/article/pii/S0038109899000794
- [9] Moritomo Y, Xu S, Machida A, Akimoto T, Nishibori E, Takata M, Sakata M and Ohoyama K 2000 J. Phys. Soc. Jpn. 69 1723 URL http://journals.jps.jp/doi/abs/10.1143/JPSJ.69.1723
- [10] Besse M, Cros V, Barthélémy A, Jaffrès H, Vogel J, Petroff F, Mirone A, Tagliaferri A, Bencok P, Decorse P, Berthet P, Szotek Z, Temmerman W M, Dhesi S S, Brookes N B, Rogalev A and Fert A 2002 Europhys. Lett. 60 608 URL http://iopscience.iop.org/0295-5075/60/4/608/fulltext/
- [11] Kuepper K, Balasz I, Hesse H, Winiarski A, Prince K C, Matteucci M, Wett D, Szargan R, Burzo E and Neumann M 2004 Phys. Status Solidi A 201 3252 URL http://doi.wiley.com/10.1002/pssa.200405432
- [12] Koide T, Sekine T, Miyauchi H, Manaka H, Asakura D, Fujimori A, Kobayashi K I, Tomioka Y, Kimura T and Tokura Y 2014 J. Phys.: Confer. Ser. 502 12003 URL http://stacks.iop.org/1742-6596/502/i=1/a=012003?key=crossref.25c2e44b1ac9a2eaab026c4034ecf93d
- [13] Kanchana V, Vaitheeswaran G, Alouani M and Delin A 2007 Phys. Rev. B 75 220404 URL http://link.aps.org/doi/10.1103/PhysRevB.75.220404
- [14] Kato H, Okuda T, Okimoto Y, Tomioka Y, Oikawa K, Kamiyama T and Tokura Y 2004 Phys. Rev. B 69 184412 URL http://link.aps.org/doi/10.1103/PhysRevB.69.184412
- [15] Rubi D, Navarro J, Fontcuberta J, Izquierdo M, Avila J and Asensio M 2006 J. Phys. Chem. Solids 67 575 URL http://www.sciencedirect.com/science/article/pii/S0022369705005561
- [16] Paturi P, Metsänoja M and Huhtinen H 2011 Thin Solid Films 519 8047 URL http://dx.doi.org/10.1016/j.tsf.2011.06.059
- [17] Saloaro M, Deniz H, Huhtinen H, Palonen H, Majumdar S and Paturi P 2015 J. Phys.: Condens. Matter 27 386001 URL http://stacks.iop.org/0953-8984/27/i=38/a=386001?key=crossref.b36a7568061928ddb9fd3377cbab54d2
- [18] Kobayashi K I, Kimura T, Sawada H, Terakura K and Tokura Y 1998 Nature 395 677 URL http://www.nature.com/nature/journal/v395/n6703/pdf/395677a0.pdf
- [19] Venimadhav A, Sher F, Attfield J and Blamire M 2004 J. Magn. Magn. Mater. 269 101 URL http://dx.doi.org/10.1016/S0304-8853(03)00570-5http://linkinghub.elsevier.com/retrieve/pii/S0304885303005705
- [20] Westerburg W, Reisinger D and Jakob G 2000 Phys. Rev. B 62 R767 URL http://arxiv.org/abs/cond-mat/0001398http://link.aps.org/doi/10.1103/PhysRevB.62.R767
- [21] Kumar D and Kaur D 2010 Physica B 405 3259 URL http://www.sciencedirect.com/science/article/pii/S0921452610004254http://linkinghub.elsevier.com/retrieve/pii/S0921452610004254
- [22] Ogale A S, Ogale S B, Ramesh R and Venkatesan T 1999 Appl. Phys. Lett. 75 537 URL http://link.aip.org/link/APPLAB/v75/i4/p537/s1&Agg=doi
- [23] Solovyev I V 2002 Phys. Rev. B 65 144446 URL http://link.aps.org/doi/10.1103/PhysRevB.65.144446
- [24] Colis S, Stoeffler D, Mény C, Fix T, Leuvrey C, Pourroy G, Dinia A, Panissod P and Meny C 2005 J. Appl. Phys. 98 033905 URL http://scitation.aip.org/content/aip/journal/jap/98/3/10.1063/1.1997286
- [25] Stoeffler D and Colis S 2005 J. Phys.: Condens. Matter 17 6415 URL http://stacks.iop.org/0953-8984/17/i=41/a=012http://stacks.iop.org/0953-8984/17/i=41/a=012?key=crossref.c42bbe9d47f773889dfddbfb0a0d4d6d
- [26] Muñoz García A B, Pavone M and Carter E A 2011 Chem. Mater. 23 4525 URL http://dx.doi.org/10.1021/cm201799c
- [27] Erten O, Meetei O N, Mukherjee A, Randeria M, Trivedi N and Woodward P 2011 Phys. Rev. Lett. 107 257201 URL http://link.aps.org/doi/10.1103/PhysRevLett.107.257201
- [28] Reyes A M, Arredondo Y and Navarro O 2016 J. Phys. Chem. C 120 4048 URL http://pubs.acs.org/doi/abs/10.1021/acs.jpcc.6b00100
- [29] Kircheisen R and Töpfer J 2012 J. Solid State Chem. 185 76 URL http://www.sciencedirect.com/science/article/pii/S0022459611005858
- [30] Wu H, Ma Y, Qian Y, Kan E, Lu R, Liu Y, Tan W, Xiao C and Deng K 2014 Solid State Commun. 177 57 URL http://www.sciencedirect.com/science/article/pii/S0038109813004560
- [31] Liechtenstein A I, Katsnelson M I, Antropov V P and Gubanov V A 1987 J. Magn. Magn. Mater. 67 65 URL http://www.sciencedirect.com/science/article/B6TJJ-46X4JHV-HX/2/a198d5cc2fb553863753292eb0284561
- [32] Fischer G, Däne M, Ernst A, Bruno P, Lüders M, Szotek Z, Temmerman W M and Hergert W 2009 Phys. Rev. B 80 014408 URL http://link.aps.org/doi/10.1103/PhysRevB.80.014408
- [33] Hoffmann M, Borisov V S, Ostanin S, Mertig I, Hergert W and Ernst A 2015 Phys. Rev. B 92 094427 URL http://journals.aps.org/prb/abstract/10.1103/PhysRevB.92.094427http://link.aps.org/doi/10.1103/PhysRevB.92.094427
- [34] Meneghini C, Ray S, Liscio F, Bardelli F, Mobilio S and Sarma D D 2009 Phys. Rev. Lett. 103 046403
- [35] Park S I, Ryu H J, Kim S B, Lee B W and Kim C S 2004 Physica B 345 99 URL http://www.sciencedirect.com/science/article/pii/S0921452603010366
- [36] Burzo E, Balasz I, Valeanu M and Pop I G 2011 J. Alloys Comp. 509 105 URL http://dx.doi.org/10.1016/j.jallcom.2010.08.126
- [37] Nakamura S and Oikawa K 2003 J. Phys. Soc. Jpn. 72 3123 URL http://journals.jps.jp/doi/abs/10.1143/JPSJ.72.3123
- [38] Azad A K, Eriksson S G, Khan A, Eriksson A and Tseggai M 2006 J. Solid State Chem. 179 1303 URL http://www.sciencedirect.com/science/article/pii/S0022459606000442
- [39] Momma K and Izumi F 2011 J. Appl. Crystallogr. 44 1272
- [40] Lüders M, Ernst A, Temmerman W M, Szotek Z and Durham P J 2001 J. Phys.: Condens. Matter 13 8587 URL http://stacks.iop.org/0953-8984/13/i=38/a=305
- [41] Lüders M, Ernst A, Däne M, Szotek Z, Svane A, Ködderitzsch D, Hergert W, Györffy B L and Temmerman W M 2005 Phys. Rev. B 71 205109 URL http://link.aps.org/doi/10.1103/PhysRevB.71.205109
- [42] Andersen O K 1975 Phys. Rev. B 12 3060 URL http://link.aps.org/doi/10.1103/PhysRevB.12.3060
- [43] Nemoshkalenko V V, Krasovskii A E, Antonov V N, Antonov Vl N, Fleck U, Wonn H and Ziesche P 1983 Phys. Status Solidi B 120 283 URL http://doi.wiley.com/10.1002/pssb.2221200130
- [44] Antonov V N, Perlov A Ya, Shpak A P and Yaresko A N 1995 J. Magn. Magn. Mater. 146 205 URL http://linkinghub.elsevier.com/retrieve/pii/0304885395010831
- [45] Blöchl P E 1994 Phys. Rev. B 50 17953 URL http://link.aps.org/doi/10.1103/PhysRevB.50.17953http://prb.aps.org/abstract/PRB/v50/i24/p17953_1
- [46] Kresse G and Joubert D 1999 Phys. Rev. B 59 1758 URL http://link.aps.org/doi/10.1103/PhysRevB.59.1758
- [47] Szotek Z, Temmerman W M, Svane A, Petit L and Winter H 2003 Phys. Rev. B 68 104411 URL http://link.aps.org/doi/10.1103/PhysRevB.68.104411
- [48] Yamamoto T, Liimatainen J, Lindén J, Karppinen M and Yamauchi H 2000 J. Mater. Chem. 10 2342 URL http://pubs.rsc.org/en/content/articlehtml/2000/jm/b003640o
- [49] Stoeffler D and Etz C 2006 J. Phys.: Condens. Matter 18 11291
- [50] Sarma D D, Mahadevan P, Saha-Dasgupta T, Ray S and Kumar A 2000 Phys. Rev. Lett. 85 2549 URL http://link.aps.org/doi/10.1103/PhysRevLett.85.2549
- [51] Tomioka Y, Okuda T, Okimoto Y, Kumai R, Kobayashi K I and Tokura Y 2000 Phys. Rev. B 61 422 URL http://link.aps.org/doi/10.1103/PhysRevB.61.422http://prb.aps.org/abstract/PRB/v61/i1/p422_1
- [52] Panguluri R P, Xu S, Moritomo Y, Solovyev I V and Nadgorny B 2009 Appl. Phys. Lett. 94 012501 URL http://scitation.aip.org/content/aip/journal/apl/94/1/10.1063/1.3058441
- [53] Fang Z, Terakura K and Kanamori J 2001 Phys. Rev. B 63 180407 URL http://link.aps.org/doi/10.1103/PhysRevB.63.180407
- [54] Jeng H T and Guo G Y 2003 Phys. Rev. B 67 094438 URL http://link.aps.org/doi/10.1103/PhysRevB.67.094438
- [55] Saha-Dasgupta T and Sarma D D 2001 Phys. Rev. B 64 064408 URL http://link.aps.org/doi/10.1103/PhysRevB.64.064408
- [56] Balcells L, Navarro J, Bibes M, Roig A, Martínez B and Fontcuberta J 2001 Appl. Phys. Lett. 78 781 URL http://scitation.aip.org/content/aip/journal/apl/78/6/10.1063/1.1346624
See pages 1-10 of SI_SFMO_theory