Electronic structure and transport properties of CeNi9In2
Abstract
We investigated CeNi9In2 compound, which has been considered as a mixed valence (MV) system. Electrical resistivity vs. temperature variation was analysed in terms of the model proposed by Freimuth for systems with unstable 4f shell. At low temperature the resistivity dependence is consistent with a Fermi liquid state with a contribution characteristic of electron-phonon interaction. Ultraviolet photoemission spectroscopy (UPS) studies of the valence band did not reveal a Kondo peak down to 14 K. A difference of the spectra obtained with photon energies of low and high photoionization cross sections for Ce 4f electrons indicated that 4f states are located mainly close to the Fermi energy. The peaks related to f5/21 and f7/21 final states cannot be resolved but form a plateau between -0.3 eV and the Fermi energy. X-ray photoemission spectroscopy (XPS) studies were realized for the cerium 3d level. The analysis of XPS spectra within the Gunnarsson-Shönhammer theory yielded a hybridization parameter of 104 meV and non-integer f level occupation, being close to 3. Calculations of partial densities of states were realized by a full potential local orbital (FPLO) method. They confirm that the valence band is dominated by Ni 3d states and are in general agreement with the experiment except for the behavior of f-electrons.
keywords:
A. Cerium intermetallics D. Electronic structure D. Transport properties1 INTRODUCTION
Various fascinating physical phenomena may arise when electrons from conduction band hybridize with weakly localized f-electrons [1]. The phases which are realized in the system, methodized on a Doniach diagram [2], depend on a strength of the hybridization, determined by exchange integral or equivalently by a location of 4f cerium atomic level with regard to the conduction band. If the hybridization is weak, it may allow for a long range magnetic ordering. A stronger hybridization results in a Kondo state. Finally, in a case of a very strong hybridization the f-electrons become delocalized and form heavy fermions, mixed valence (MV) state or even participate in a metallic valence band with lighter effective masses.
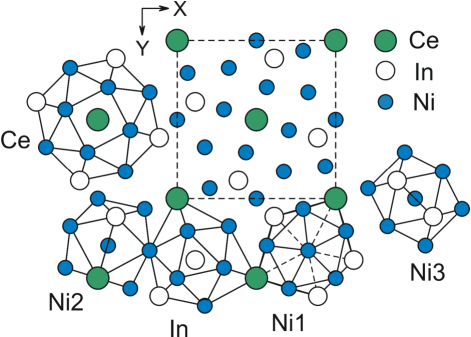
Crystal structure of CeNi9In2 (Fig. 1) belongs to the YNi9In2 type with lattice constants a=b=8.2340(16) Å and c=4.8310(9) Å. The structure is characterized by large coordination numbers (CN) for all the atoms [3]. Namely, we have 20 vertices coordination polyhedron (CP) for Ce atoms, icosahedral CP with CN equal 12 for all Ni atoms and 15 vertices CP for In. In this structure pairs of In atoms have very short interatomic distances (2.639 Å for CeNi9In2 as compared to a double radius of In equal 3.252 Å [4]), therefore a strong In-In interactions can be expected. Each In-In pair is surrounded by 4 Ce and 19 Ni atoms.
Physical properties of CeNi9In2 have been reported before [3, 5, 6]. A specific heat of CeNi9In2 is well described by the sum of electronic and lattice contributions [6]. A Sommerfeld coefficient equals 72 mJ/(molK2), while Debye temperature reaches a value of 139 K [6]. Previous studies revealed a concave shape of electrical resistivity vs. temperature curve, which was supposed to originate from MV state present in the system [5, 3]. Furthermore, an absence of magnetic ordering was reported even at low temperatures. Magnetic susceptibility collected at a high magnetic field (1 T) is nearly temperature independent [5]. On the other hand, magnetic susceptibility at low magnetic field (50 Oe) reveals a broad maximum typical of MV state [6]. However, further studies of the magnetic susceptibility (unpublished) revealed that its values are too high to follow the model proposed by Sales and Wohlleben [7] for MV state. In fact, a presence of ferromagnetic impurities in a specimen may be a source of the enlarged value of susceptibility.
Electronic structure of CeNi9In2 was probed by means of XPS [6] at room temperature. The authors assigned mainly Ni 3d character to the valence band. In order to describe mixing between localized and conduction electrons Gunnarsson-Shönhammer theory was employed [8, 9]. It yielded the value of hybridization equal to 105 meV and the mean occupation of 4f level equal 0.84. This non-integer value of the valence supports the presence of MV state in the CeNi9In2 intermetallic.
In this paper we present studies of transport properties and electronic structure of CeNi9In2, which were realized by electrical resistivity measurements, ultraviolet photoemission spectroscopy (UPS), x-ray photoemission spectroscopy (XPS) and density functional theory calculations. The obtained results are compatible with MV state, which has been proposed for this compound.
2 EXPERIMENTAL
A synthesis and characterization of polycrystalline CeNi9In2 samples were described elsewhere [6]. Electrical resistivity was measured with physical property measurement system (PPMS, Quantum Design) with the application of a four probe method. The measurements were realized in the temperature range of 2 - 300 K.
The samples were studied by XPS and UPS using VG Scienta R4000 photoelectron spectrometer. UPS measurements were conducted with He I (21.2 eV) and He II (40.8 eV) radiation and energy resolution of 25 meV at the temperature of 14, 100, 200 and 300 K. XPS studies were realized by MgKα (1254 eV) radiation without a monochromator at 295 and 14 K. Sample surface was prepared by scratching with a diamond file in ultra-high vacuum of 510-10 mbar. The base pressure during the experiment was 510-11 mbar. Energy calibration was based on the measurements of Au 4f states and the Fermi energy () on Cu for XPS and UPS, respectively.
Density of states (DOS) for the CeNi9In2 compound was calculated using full potential local orbital (FPLO) code in the scalar relativistic version [10]. For the calculations the Perdew – Wang exchange - correlation potential was applied [11, 12]. The local spin density approximation LSDA+U in around mean field scheme was used in order to involve additional correlations [13]. The value of Coulomb repulsion U in 4f cerium shell was set equal to 6 eV as it is typically assumed [14].
3 RESULTS AND DISCUSSION
3.1 ELECTRICAL RESISTIVITY
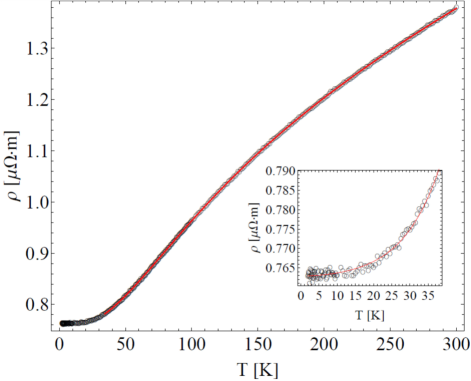
Electrical resistivity presented in this paper varies with temperature in the way consistent with the previous study [5]. A typical metallic shape with a small concavity (Fig. 2) is clearly seen. It resembles the results obtained for classical f-electron compounds with intermediate valence [15]. Therefore, for higher temperatures (35 K - 300 K) we have fitted the model proposed by Freimuth [16] for the systems with unstable 4f shells. This model takes into account the scattering between s, d electrons from conduction band and f-electrons forming a narrow band. The electron phonon interaction is represented by a linear term. The formula for the resistivity reads:
| (1) |
where is effective energy width for scattering. As fit results we obtained residual resistivity = 7.3810-7 m, a coefficient in the phonon term = 1.0910-9 m/K, average f-electron position with respect to the Fermi energy = 355 K, temperature characteristic of the fluctuations between 4f0 and 4f1 states (fluctuation temperature) = 157 K and the parameter related to the strength of hybridization between s,d- and f-electrons = 45.2 10-5 mK, where is the overlap of s, d- and f-electron wave functions, while b is defined as [16]. The values of , and are relatively high when compared to previous applications of the Freimuth’s model [16, 17] but all of them are within the same order of magnitude. Also the Grüneisen - Bloch - Mott [18, 19] formula was fitted to the resistivity data. However, the fit yielded a weaker agreement with the experiment, what was reflected in lower correlation coefficient - .
At low temperatures, namely in the range of 2 - 38 K, we have fitted the formula:
| (2) |
so as to describe the system in terms of the FL theory. Indeed the term with coefficient ( = 7.710-12 m/K2) is dominating, which is characteristic of FL but the term with ( = 2.110-16 m/K5) is also important, signifying that the contribution originating from dissipation on the lattice cannot be neglected. We have obtained a large value of residual resistivity that equals 7.610-7 m, hence a residual resistivity ratio (RRR) reaches the value of 1.8.
Another verification of FL behavior [20] comes from the Kadowaki – Woods (KW) ratio calculated as , where is a Sommerfeld electronic heat capacity coefficient taken from Ref. [6]. The obtained KW ratio amounted to 1.510-9 mmol2K2/J2. According to the reference [21] KW ratio in heavy fermions is equal to 10-7 mmol2K2/J2, while in transition metals ought to reach the value of 410-9 mmolK2/J2. The value estimated for CeNi9In2 is of the same order of magnitude as for transition metals. The deviation from the exact value corresponding to transition metals may be due to the fact that real calculated KW ratio should take into account corrections for material specific parameters [21]. The other possibility could be a breakdown of FL theory. On the other hand, the proximity of CeNi9In2 and transition metals KW ratio is not startling for us, as the valence band is dominated by nickel 3d electrons [6], what is also discussed further in the text.
3.2 VALENCE BAND PHOTOEMISSION SPECTRA
Manifestations of a Kondo effect and heavy fermion physics may be visible in electronic structure, especially around [22, 23]. So as to examine how many body interactions impact on density of states we collected photoemission spectra (UPS) of the valence band. The spectra recorded with the application of He I (21.2 eV) and He II (40.8 eV) radiation at the temperature T=14 K are presented together with their difference in Fig. 3. Each spectrum is normalized to area in the region from -3 eV to .
The first important fact is that an intensive coherent peak near called a Kondo peak was not found. Such a peak, representing the final state with Ce f configuration was also not resolved in the spectra normalized by the Fermi-Dirac distribution (not shown). UPS spectra obtained for the valence band at different photon energies have generally similar shape (not shown). He I spectrum (Fig. 3) has two maxima: the first, more intensive, at about -0.67 eV and the second smaller and blurred at about -1.8 eV. Below the energy of -3 eV one observes a contribution from inelastic background, therefore it is not shown. The spectrum obtained with He II radiation also has two maxima: at -0.6 eV and at about -1.8 eV. The maxima in the He II spectrum are better separated than those in the case of He I. The low energy peak for He II is broader and has increased spectral weight in a vicinity of . This can originate from Ce f electrons, which very often contribute to a spectrum near with the f1 final state [22].
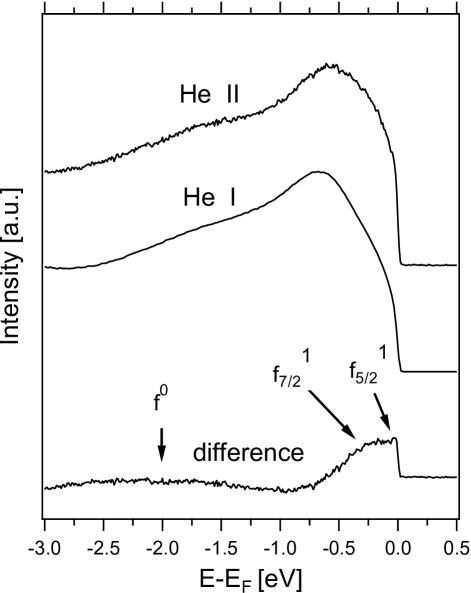
It was proved both theoretically [24] and experimentally [22, 25] that Ce 4f electrons exhibit a higher photoionization cross section for He II radiation when compared to He I. The theoretical cross section is 3.25 times higher for He II [24] but the real increase of this factor according to the experiment may be much larger as in many cases a sharp and intensive Kondo peak is observed near the photon energy h= 40 eV, while it vanishes at h = 20 to 25 eV [22, 25, 26]. Therefore, we interpret the difference between He II and He I spectra as originating from Ce 4f electrons (Fig. 3). Such a difference (Fig. 3) shows low intensity in the range from -3.0 eV to -0.6 eV with a broad maximum centered at about -2.3 eV. For low binding energy one observes a high intensity in the range of -0.3 eV to EF. The difference resembles a typical spectral function obtained from the single impurity Anderson model for a Kondo system [25] but does not show sharp peaks. A high intensity near EF should accommodate both a f peak observed at and a spin orbit partner f located in the region of -0.28 meV [22, 26]. Despite a very high energy resolution of our UPS study the peaks f and f are not resolved but form a broad maximum or rather a plateau between 0.3 eV and . According to the calculations based on Anderson model [27, 28, 29] the Kondo peak is broadened in the case of non-integer f-level occupation, which takes place in MV state. Such a situation is reflected in our spectra. Kondo peak would also be absent or much broadened, if the spectra are collected at the temperature considerably higher than the Kondo temperature (). However, we do not favor such a hypothesis, as a very low value of (much below 14 K) is not in agreement with the valence fluctuation scenario in CeNi9In2. A broad peak in the region of -2.3 eV of the difference spectrum may be attributed to the f0 final state [22, 26]. UPS studies were conducted in a series of temperatures between T=14 K and room temperature but no clear differences have been found. It is known from theoretical calculations (discussed further in the text) that the valence band of CeNi9In2 is dominated by Ni 3d and Ce 4f electrons. According to what has been written, the spectrum obtained by He I may be treated as originating mainly from the Ni 3d electrons.
3.3 XPS ON 3D CERIUM LEVELS
Holes, which are created in 3d or 4d cerium levels as a consequence of a photoionization, strongly interact with 4f electrons. This effect gives us an opportunity to characterize a hybridization between strongly correlated f electrons and a conduction band. The aforementioned interaction between a hole and electrons affects the peaks related to f0, f1 and f2 final states. Thus, each peak in the d-electron doublet is split into three components. While the 4d level spectrum has a complex structure, peaks in the 3d cerium spectrum can be resolved with the application of Doniach-Šunjić theory [30].
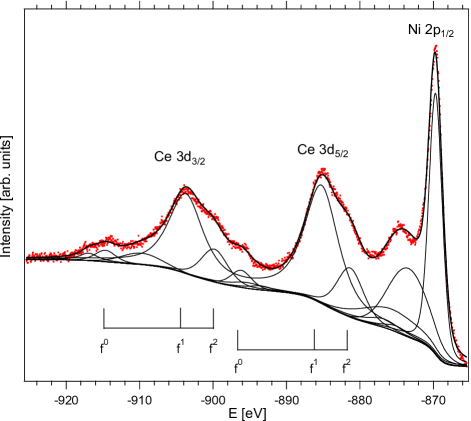
The XPS spectrum of Ce 3d level for CeNi9In2 is shown in the Fig 4. Features observed at low binding energy side originate from nickel 2p states. These are 2p1/2 nickel main peak at about 869.70 eV and satellites at 873.40 eV and 875.70 eV [31]. The spectrum of 3d cerium consists of spin-orbit partners separated by 18.5 eV. Each spin-orbit partner has three distinguishable components. The main peak corresponding to the f1 final state is accompanied by f2 and f0 satellites. Locations of particular peaks are given in table 1. Non-zero intensity of f2 satellite is a corollary of screening and corroborates that f states hybridize with a Fermi sea. In order to obtain values of hybridization strength and f level filling the Gunnarsson-Shönhammer theory was employed [8, 9]. We have calculated the following intensity ratios: and . Subsequently, we have used in the formula: , and then we have deduced the value of the hybridization from , according to the reference [8, 9]. We obtained the hybridization =104 meV and f-level occupation = 0.94. The parameters and slightly differ from that determined before [6]. Actually, different circumstances should be counted, like differences in sample preparation or in approach to spectra fitting. Previously [6] the samples were fractured, while in this study surface was cleaned using a diamond file. XPS spectra collected at 295 K and 20 K do not exhibit any considerable difference.
| 3d5/2 | |||
| f0 | f1 | f2 | |
| 896.16 | 885.22 | 881.32 | [eV] |
| 132 | 1758 | 485 | [arb. u.] |
3.4 THEORETICAL CALCULATIONS
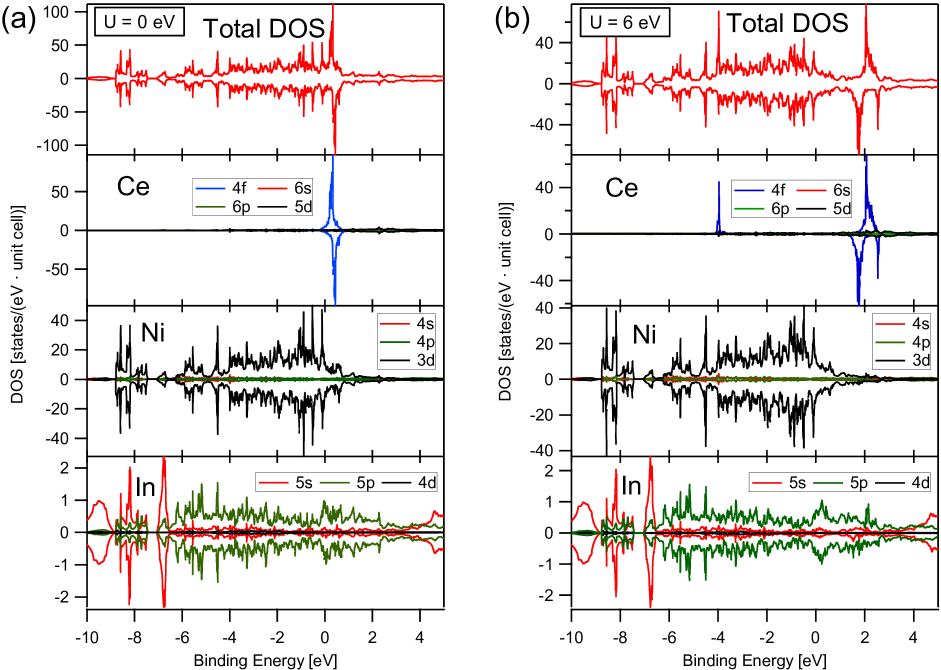
In order to provide a comparison between the experimental results and theory, we have performed FPLO calculations of DOS. Here we present DOS obtained for non-correlated f level (U=0) and for f electrons interacting with effective Coulomb repulsion that equals U=6 eV (Fig. 5). As expected, the spectral density for U=0 is roughly spin independent. According to the calculations, the total density of states in the valence band region is mainly built up of nickel 3d states and cerium 4f states. While the former cover the whole valence band, the latter form a narrow peak next to . Indium gives a small contribution, mainly from 5p and 5s states. While 5p partial DOS reaches a reasonable value in the range from about -6 to 2 eV, 5s states give contribution for energy below -6 eV or above energy. In the case of U= 6eV a situation is different. Total DOS depends on spin, because of a broken symmetry in cerium partial DOS. The contribution from indium and nickel atoms is the same as in U=0 case. 4f partial DOS, which only plays a role for cerium atoms, forms two peaks for each spin. Peaks for up spin are located at -4 eV and 2 eV, while those for down spin at about 1.7 and 2.5 eV. DOS calculated for Ni 3d states is in a reasonable agreement with the experiment, while it is not a surprise that DOS obtained within the used theoretical approach for Ce 4f electrons does not model the real spectral function. The Sommerfeld coefficient was calculated using the obtained theoretically value of DOS at . It amounts to 40.8 mJ/(molK2) and 33.5 mJ/(molK2) for the cases with U=0 and 6 eV, respectively. Thus, the experimental value of 72 mJ/(molK2) [6] indicates the presence of correlations in the system.
4 SUMMARY
We presented the studies of electrical resistivity, UPS, XPS and theoretical calculations for MV compound CeNi9In2. The electrical resistivity was analyzed within the model for unstable valence 4f systems. Low temperature behavior of resistivity is described by a quadratic function characteristic of a Fermi liquid with a contribution originating from the dissipation on the lattice. UPS studies did not reveal a Kondo peak down to 14 K. f-electron spectral function was obtained by a subtraction of He I spectrum from the He II one. The peaks for the f5/21 and f7/21 final states form a plateau between 0.3 eV and , what should be related to their broadening. This is a symptom of MV state in CeNi9In2. According to band structure calculations the valence band is dominated by Ni 3d electrons. The analysis of Ce 3d level by XPS allowed to determine the hybridization between conduction band and f-electrons as well as f-level occupation parameters. The obtained Ce valence is non-integer but close to 3.
5 ACKNOWLEDGMENTS
R.K. and P.S. acknowledge fruitful discussions with V. H. Tran. This work has been supported by the Ministry of Science and Higher Education in Poland within the Grant no. N N202 201 039. J.G. acknowledges the financial support from the National Science Centre (NCN), on the basis of Decision No. DEC-2012/07/B/ST3/03027. The measurements were carried out with the equipment purchased thanks to the European Regional Development Fund in the framework of the Polish Innovation Economy Operational Program (contract no. POIG.02.01.00-12-023/08).
REFERENCES
References
- [1] R. D. Parks (Ed.), Valence Instabilities and Related Narrow Band Phenomena, Plenum Press, New York, 1977.
- [2] S. Doniach, Physica B 91 (1977) 231.
- [3] I. Bigun, M. Dzevenko, L. Havela and Ya. Kalychak, Eur. J. Inorg. Chem. 16 (2014) 2631 – 2642.
- [4] J. Emsley, The Elements, Clarendon Press, Oxford, 1991.
- [5] O. Moze, S. Mentink, G. Nieuwenhuys, K. Buschow, Journal of Magnetism and Magnetic Materials 150 (1995) 345 – 348.
- [6] A. Szytuł a, S. Baran, B. Penc, J. Przewoźnik, A. Winiarski, Y. Tyvanchuk, Y. Kalychak, Journal of Alloys and Compounds 589 (2014) 622 – 627.
- [7] B. C. Sales, D. K. Wohlleben, Phys. Rev. Lett. 35 (1975) 1240–1244.
- [8] J. C. Fuggle, F. U. Hillebrecht, Z. Zołnierek, R. Lässer, C. Freiburg, O. Gunnarsson, K. Schönhammer, Phys. Rev. B 27 (1983) 7330–7341.
- [9] O. Gunnarsson, K. Schönhammer, Phys. Rev. B 28 (1983) 4315–4341.
- [10] K. Koepernik, H. Eschrig, Phys. Rev. B 59 (1999) 1743–1757.
- [11] J. P. Perdew, Y. Wang, Phys. Rev. B 45 (1992) 13244–13249.
- [12] D. M. Ceperley, B. J. Alder, Phys. Rev. Lett. 45 (1980) 566–569.
- [13] V. I. Anisimov, I. V. Solovyev, M. A. Korotin, M. T. Czyżyk, G. A. Sawatzky, Phys. Rev. B 48 (1993) 16929–16934.
- [14] U. Paramanik, Anupam, U. Burkhardt, R. Prasad, C. Geibel, Z. Hossain, Journal of Alloys and Compounds 580 (2013) 435 – 441.
- [15] D. Wohlleben, B. Wittershagen, Adv. Phys. 34 (1985) 403.
- [16] A. Freimuth, J. Magn. Magn. Mat. 68 (1987) 28.
- [17] V. H. Tran, H. Flandorfer, C. Godart, P. Rogl, J. Solid State Chem. 161 (2001) 63.
- [18] N. F. Mott, H. Jones, The Theory of the Properties of Metals and Alloys, Oxford University Press, London, 1958.
- [19] G. Grimvall, The Electron-Phonon Interaction in Metals, North-Holland Pub. Co., Amsterdam, 1981.
- [20] K. Kadowaki, S. Woods, Solid State Communications 58 (1986) 507 – 509.
- [21] A. C. Jacko, J. O. Fjaerestad, B. J. Powell, arXiv:0805.4275v4 [cond-mat.str-el].
- [22] D. Malterre, M. Grioni, Y. Baer, Advances in Physics 45 (1996) 299–348.
- [23] J. W. Allen, J. Phys. Soc. Jpn. 74 (2005) 34–48.
- [24] J. J. Yeh, I. Lindau, At. Data Nucl. Data Tables 32 (1985) 1.
- [25] D. Ehm, S. Hüfner, F. Reinert, J. Kroha, P. Wölfle, O. Stockert, C. Geibel, H. v. Löhneysen, Phys. Rev. B 76 (2007) 045117.
- [26] P. Starowicz, R. Kurleto, J. Goraus, H. Schwab, M. Szlawska, F. Forster, A. Szytuła, I. Vobornik, D. Kaczorowski, F. Reinert, Phys. Rev. B 89 (2014) 115122.
- [27] B. Horvatić, D. Sokcević, V. Zlatić, Phys. Rev. B 36 (1987) 675–683.
- [28] M. T. Glossop, D. E. Logan, J. Phys.: Condens. Matter 14 (2002) 6737.
- [29] G. Czycholl, Phys. Rev. B 31 (1985) 2867–2880.
- [30] S. Doniach, M. Šunjić, J. Phys. C: Solid State Phys 3 (1970) 285.
- [31] S. Hüfner, Photoelectron Spectroscopy, Springer-Verlag, Berlin 2003.