Localizing the rays from blazar PKS 1502+106
Abstract:
Blazars are among the most variable objects in the universe. They feature energetic jets of plasma that launch from the cores of these active galactic nuclei (AGN), triggering activity from radio up to -ray energies. Spatial localization of the region of their MeV/GeV emission is a key question in understanding the blazar phenomenon.
The flat spectrum radio quasar (FSRQ) PKS 1502+106 has exhibited extreme and correlated, radio and high-energy activity that triggered intense monitoring by the Fermi-GST AGN Multi-frequency Monitoring Alliance (F-GAMMA) program and the Global Millimeter VLBI Array (GMVA) down to 3 mm (or 86 GHz), enabling the sharpest view to date towards this extreme object.
Here, we report on preliminary results of our study of the -ray loud blazar PKS 1502+106, combining VLBI and single dish data. We deduce the critical aspect angle towards the source to be , calculate the apparent and intrinsic opening angles and constrain the distance of the 86 GHz core from the base of the conical jet, directly from mm-VLBI but also through a single dish relative timing analysis.
Finally, we conclude that rays from PKS 1502+106 originate from a region between 1–16 pc away from the base of the hypothesized conical jet, well beyond the bulk of broad-line region (BLR) material of the source.
1 Introduction
Ever since rays from AGN were detected, the exact location of their production site remains still unclear. It has been proposed that high-energy emission may originate close to the central engine—believed to be a supermassive black hole—within the broad-line region (BLR), or several parsecs (pc) downstream the jet (cf. [5] and references therein).
PKS 1502+106 is a powerful blazar classified as a flat spectrum radio quasar (FSRQ), with its central engine having a mass of at redshift 111With , and at , 1 mas pc.[1]. It underwent a period of pronounced flaring activity starting early in 2008, that triggered high-cadence mm-VLBI and filled-aperture, multi-wavelength observations. The wealth of available single-dish data in addition to high-frequency Global mm-VLBI Array (GMVA) observations at 86 (and 43) GHz evince that PKS 1502+106 is a unique case towards a detailed understanding of flux density outbursts and subsequent structural variability. The powerful combination of single-dish monitoring and mm-VLBI allows us to better constrain the -ray production site in PKS 1502+106.
2 Observations and data reduction
Our mm-VLBI observations with the GMVA222http://www3.mpifr-bonn.mpg.de/div/vlbi/globalmm comprise 6 epochs obtained between 2009 and 2012 with observations of PKS 1502+106 twice per year. The following stations were included. Europe: Effelsberg (100-m), Onsala (20-m), Pico Veleta (30-m), Plateau de Bure (615-m), Metsähovi (14-m), Yebes (40-m); USA: all VLBA stations with 86 GHz capability (825-m). The data obtained in dual polarization mode were correlated at the MPIfR. Uncalibrated data were analyzed with NRAO’s AIPS. We performed an a priori visibility amplitude and phase calibration within AIPS, using standard procedures [7, 11]. For subsequent imaging and analysis we used DIFMAP, where CLEANing and visibility phase and amplitude self-calibration cycles were performed.
Single-dish data employed here were obtained within the framework of the F-GAMMA program333 http://www3.mpifr-bonn.mpg.de/div/vlbi/fgamma/fgamma.html, a coordinated effort for simultaneous observations at 11 bands in the range between 2.64 to 345 GHz [4, 2, 12]. After initial flagging, pointing offset, opacity, gain-curve, and sensitivity corrections were applied to the data. From the broad F-GAMMA frequency coverage, here we employ the 86.24 GHz band, matching our mm-VLBI monitoring. We also use data from the SMA submillimeter calibrator list444 http://sma1.sma.hawaii.edu/callist/callist.html at 226.5 GHz [6].
3 Results
Jet kinematics:
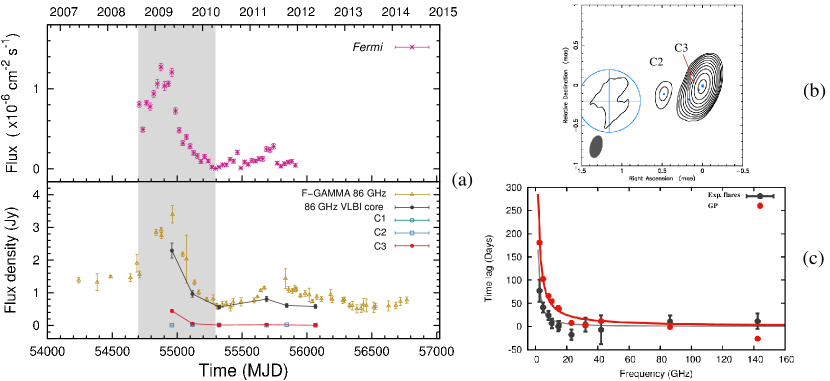
As shown in Fig. 1b, PKS 1502+106 exhibits a compact, core-dominated morphology at 86 GHz with a one-sided parsec-scale jet, owing to relativistic beaming. The jet can be decomposed into 3 modelfit components (C1 to C3). A linear fit to their radial separation from the core, yields their apparent speeds within the jet flow. The most extreme superluminal motion of about at GHz555In addition to 43/86 GHz GMVA data, we have reanalyzed VLBI data at 15 GHz obtained within the MOJAVE program [10]. These are not shown here; we only report the highest speed of 22 we obtain. The full VLBI analysis for PKS 1502+106 will appear in a forthcoming article. constrains the critical viewing angle towards the source to be .
Apparent and intrinsic jet opening angles:
In estimating the apparent and intrinsic jet opening angles of PKS 1502+106, we employ two methods. First, we use all modelfit components at all 3 available frequencies (15, 43, and 86 GHz) and perform a single linear fit to their deconvolved effective size with respect to radial separation from the core. In the second method the opening angle is calculated for each resolved feature separately, at each component’s separation and according to the critical angle constrained by its superluminal speed. Finally, we take the average as the nominal opening angle for the jet. Resulting de-projected opening angles are and , respectively. For a discussion on de-projecting blazar apparent opening angles we refer to [3].
Distance between the 3-mm VLBI core and the cone vertex:
Under the assumption that the core takes up the entire jet cross section, the de-projected distance of the 3-mm core from the vertex of a hypothesized conical jet can be estimated by .
With an average size for the core mas and a nominal opening angle between –, the 86 GHz core is placed 12–18 pc away from the vertex.
Single dish findings:
Fig. 1a shows the monthly-binned Fermi -ray light curve, the 3-mm F-GAMMA light curve along with those of VLBI knots C1, C2, C3 and the core. For the extraction of relevant flare parameters we perform a fit with two methods. We employ a decomposition into exponential flares and a non-parametric Gaussian process (GP) regression. We fit each light curve separately, extracting the flare amplitude , time scale and time of maximum flux density, . Based on the different per frequency we gain insights into the opacity structure of the jet. The method provides an alternative to VLBI core-shift measurements (cf. [8, 9]). Our relative timing analysis for with respect to yields a time lag of 10 days, translating into a distance between the single dish, 3-mm surface to the vertex of the conical jet of 3 pc. Results of our preliminary relative timing are shown in Fig. 1c. Additionally, a discrete cross-correlation function (DCCF) analysis between the 3 mm and the -ray light curves reveals that the radio flare lags behind its high-energy counterpart by days, at a significance level above , thus placing the -ray production site pc upstream of the 3-mm surface (see [5] for details).
4 Conclusions and discussion
We explored PKS 1502+106’s extreme and significantly correlated variability in radio and rays employing both, single dish and VLBI methods. Our study leads to the following preliminary conclusions:
1. PKS 1502+106 is a fast superluminal source, whose fastest constrains the critical aspect angle towards it, to . It features an intrinsic jet opening angle –.
2. Based on VLBI images at 3 mm, the core is situated 12–18 pc away from the jet base.
3. The same calculation from single dish, relative timing analysis yields a smaller value of . This is to be further investigated. Possible explanations may include the fact that the VLBI core at 86 GHz is an unresolved feature, thus the distance reported above, represents only an upper limit. The discrepancy could also hint that the filling factor in the core region could be smaller. In any case, inferring from VLBI when the core is unresolved must be done with caution.
4. A DCCF analysis between the 3-mm and the -ray light curves places the -ray production site at 2.1 pc upstream of the 3-mm, single dish surface [5].
5. Even taking the extreme values for , coming from single dish and VLBI (3 as opposed to 18 pc) and combining with the DCCF findings, we localize the rays at 1–16 pc away from the base of the jet and at least the same distance from the black hole itself. In both cases they originate downstream of the bulk BLR material in the source (pc [1]) with important consequences for the reservoir of target photons, available for inverse Compton up-scattering and subsequent production of rays.
References
- [1] A. A. Abdo et al., PKS 1502+106: A New and Distant Gamma-ray Blazar in Outburst Discovered by the Fermi Large Area Telescope, A&A 710, 810 (2010).
- [2] E. Angelakis et al., The F-GAMMA program: multi-wavelength AGN studies in the Fermi-GST era, in proc. ”Fermi meets Jansky - AGN in Radio and Gamma-Rays”, T. Savolainen et al. (eds.), (2010).
- [3] E. Clausen-Brown et al., AGN jet physics and apparent opening angles, in proc. \posPoS(11th EVN Symposium)014 (2011).
- [4] L. Fuhrmann et al., Simultaneous Radio to (Sub-) mm-Monitoring of Variability and Spectral Shape Evolution of potential GLAST Blazars, AIPCS 921, 249 (2007).
- [5] L. Fuhrmann et al., Detection of significant cm to sub-mm band radio and -ray correlated variability in Fermi bright blazars, MNRAS 441, 1899 (2014).
- [6] M. A. Gurwell et al. Monitoring Phase Calibrators at Submillimeter Wavelengths ASPCS 375, 234 (2007)
- [7] S. G. Jorstad et al., Polarimetric Observations of 15 Active Galactic Nuclei at High Frequencies: Jet Kinematics from Bimonthly Monitoring with the Very Long Baseline Array, AJ 130, 1418, (2005).
- [8] N. A. Kudryavtseva et al., A new method for estimating frequency-dependent core shifts in active galactic nucleus jets, MNRAS 415, 1631 (2011).
- [9] A. M. Kutkin et al., The core shift effect in the blazar 3C 454.3, MNRAS 437, 3396 (2014).
- [10] M. L. Lister et al., MOJAVE: Monitoring of Jets in Active Galactic Nuclei with VLBA Experiments. VI. Kinematics Analysis of a Complete Sample of Blazar Jets, AJ 138, 1874 (2009).
- [11] I. Martí-Vidal et al., On the calibration of full-polarization 86 GHz global VLBI observations, A&A 542, A107, (2012).
- [12] I. Nestoras et al., F-GAMMA program: Multi-frequency study of Active Galactic Nuclei in the Fermi-GST era III. The first 5 years of IRAM 30-m monitoring, in prep.