Fractal energy carpets in non–Hermitian Hofstadter quantum mechanics
Abstract
We study the non-Hermitian Hofstadter dynamics of a quantum particle with biased motion on a square lattice in the background of a magnetic field. We show that in quasi-momentum space the energy spectrum is an overlap of infinitely many inequivalent fractals. The energy levels in each fractal are space-filling curves with Hausdorff dimension 2. The band structure of the spectrum is similar to a fractal spider net in contrast to the Hofstadter butterfly for unbiased motion.
I Introduction
It is well known that the energy spectrum of an electrically charged particle moving in the background of an external magnetic magnetic field on a two-dimensional infinite square lattice has a beautiful fractal structure known as the Hofstadter butterfly ref:Hofstadter . The energy bands plotted against the magnetic flux reveal a complex pattern which resembles a butterfly, hence the name “butterfly”. The fractality of the Hofstadter’s butterfly is revealed in the fact that small regions of the energy spectrum contain a distorted copy of a larger region, thus exhibiting the self-similarity property at all scales. This property is a characteristic feature of a fractal ref:fractals .
The Hofstadter spectrum was originally obtained in a tight-binding model which describes the motion on a square lattice of a (spinless) charged particle hopping from one site to one of the nearest sites in the presence of an external magnetic field perpendicular to the lattice plane.
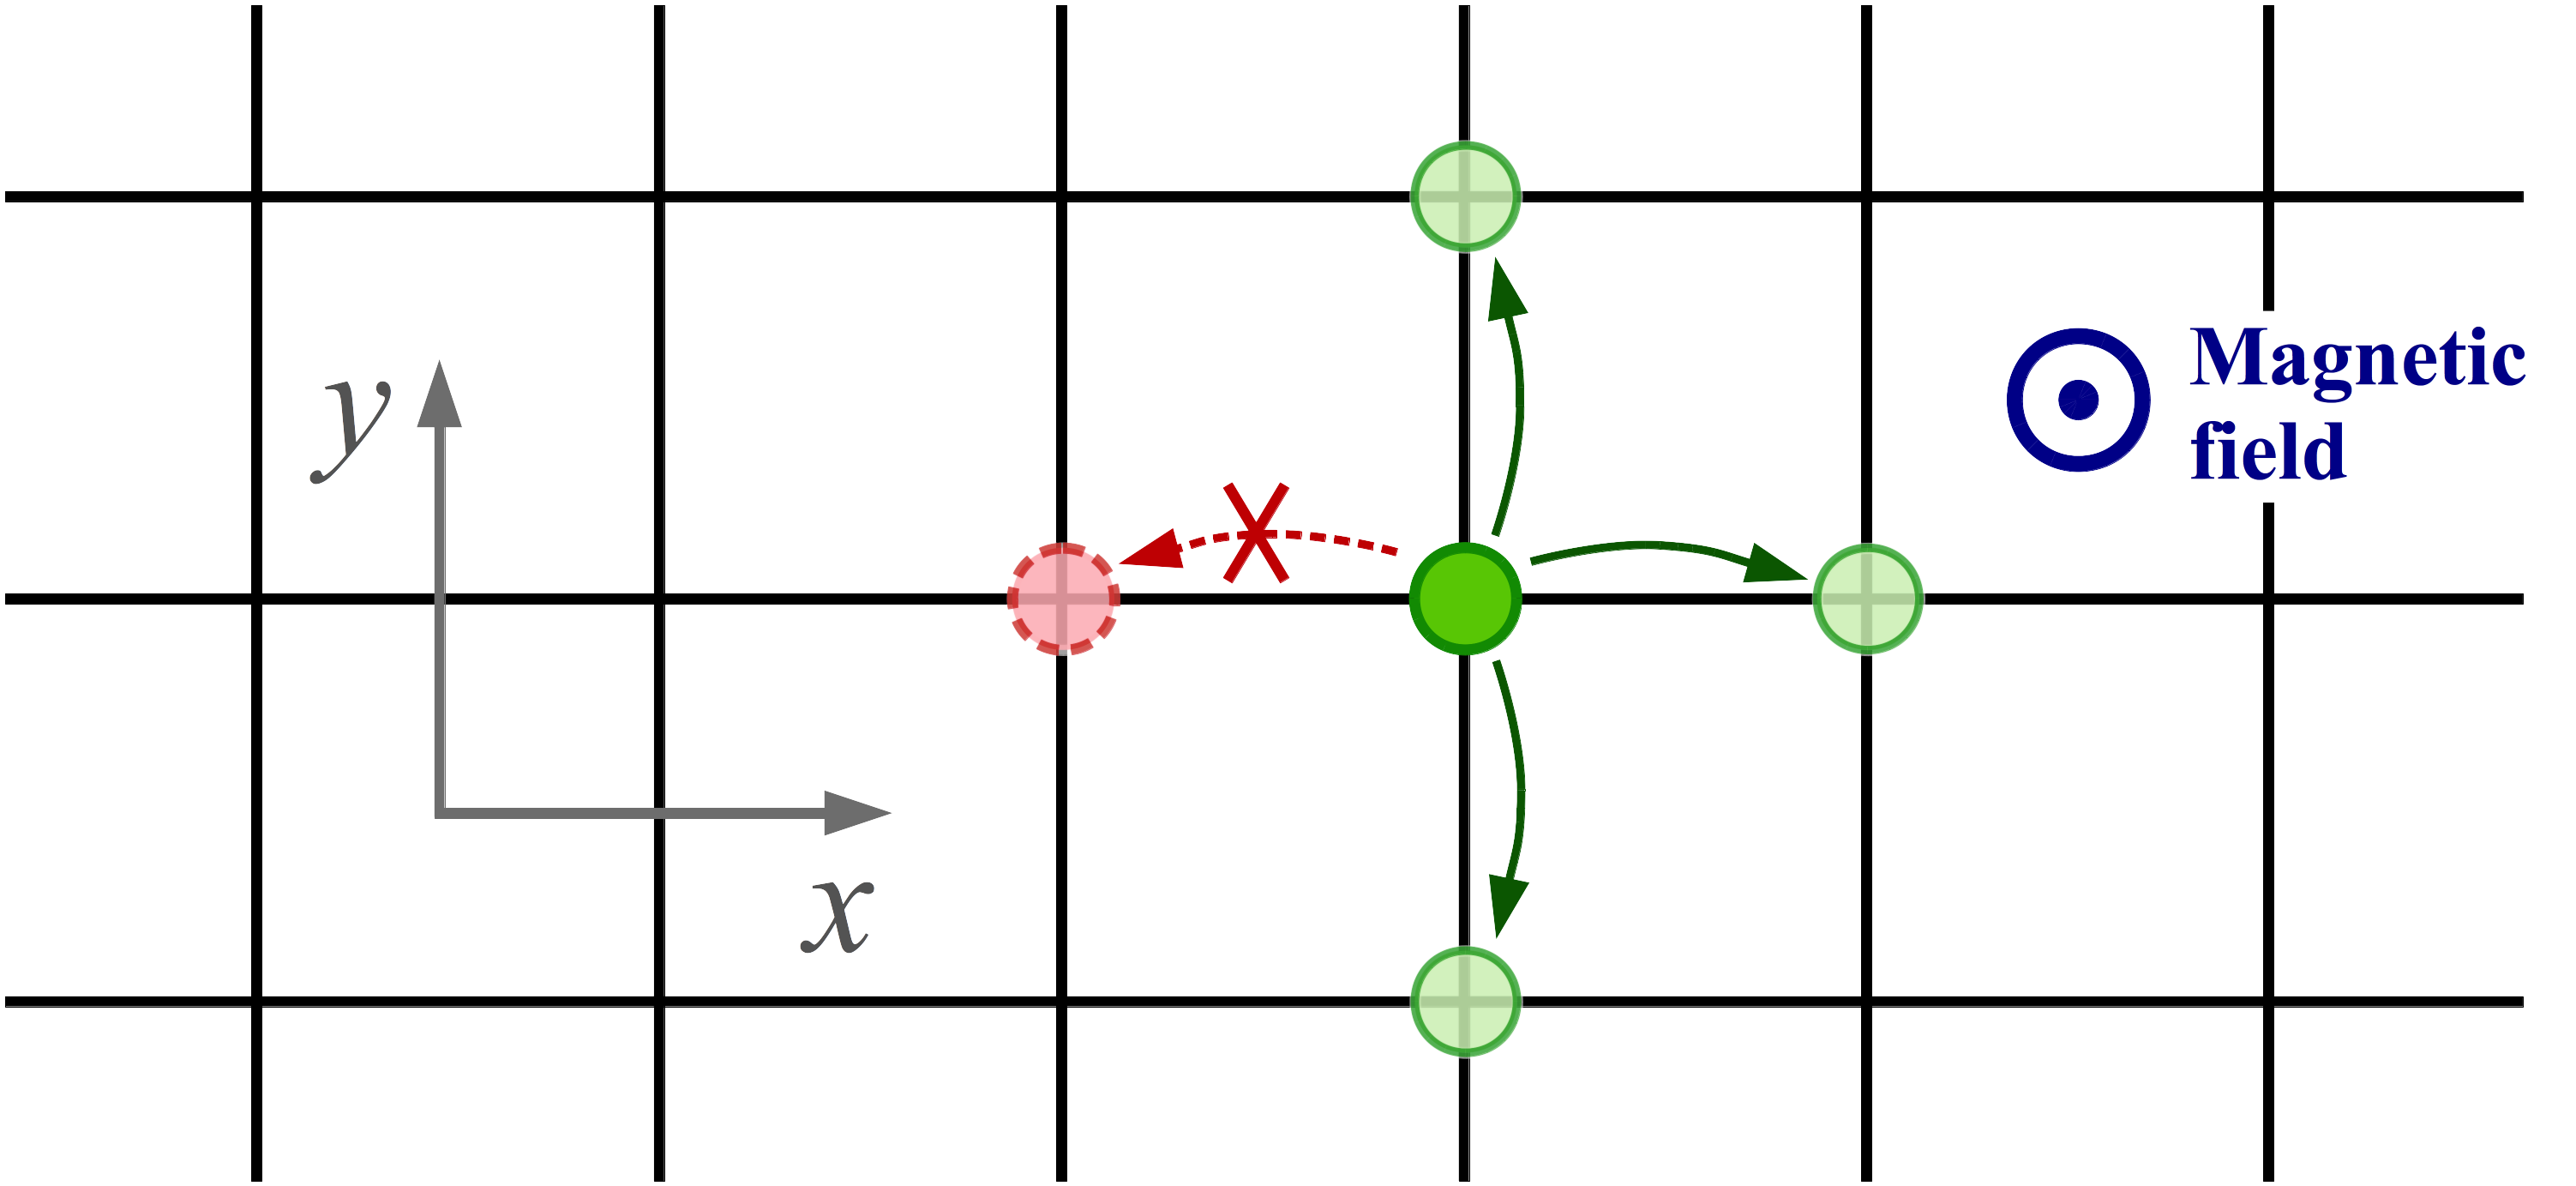
In this paper we address the problem of a biased quantum motion where the motion is constrained -“biased”- by the condition that the hopping of the particle to the left is now forbidden, while it can still freely hop to the other nearest sites (right, up and down) as indicated in Fig. 1. The particle is electrically charged so that its motion is affected by the presence of the magnetic field. Its dynamic is described by a truncated non Hermitian Hofstadter Hamiltonian.
This quantum system was introduced in Ref. ref:I where its relation with biased classical random walks – i.e. random walks on a square lattice conditioned to move horizontally only to the right, never to the left ref:Ibis – was studied. Explicit trace identities relating, on the one hand, the generating functions of the algebraic area probability distribution of biased random walks to, on the other hand, the traces of powers of the quantum truncated Hamiltonian, were proposed in the so-called commensurate case where the (normalised) magnetic flux per unit cell is a rational number. An exact solution for the quantum spectrum was derived. It turns out that the energy levels depend on two quantum numbers and . The quasi-momentum takes continuous values in and corresponds to the plane-wave Bloch states propagating along the vertical axis while the other quantum number takes discrete values in the same interval and fixes the boundary condition on the horizontal axis.
Following the approach of Ref. ref:Hofstadter where the fractal structure of the Hofstadter band spectrum is revealed when it is plotted as a function of the external magnetic flux, we are going to show below that the energy bands of the biased quantum model also exhibit, non surprisingly, a self-similar structure in the same “energy-flux” plane. In addition, we will also argue that energy levels for different magnetic fluxes reveal – when they are plotted as a function of – unusual fractal patterns (“fractal carpets”) in the ”energy-quasi-momentum” plane.
The paper is organized as follows: in Sec. II we consider the non-Hermitian Hofstadter model and its real-valued energy spectrum. In Sec. III we argue visually and numerically that the spectrum possesses a fractal structure not only for the energy bands plotted against the magnetic flux but also for the energy levels plotted against the quasi-momentum . An analytical argument based on Chebyshev nesting is presented in Sec. IV. It is followed by yet another analytical argument for the flattened energy bands in Sec. V. Complex-valued branches of the energy spectrum are briefly discussed in Sec. VI. The last section is devoted to our conclusions.
II The model and its spectrum
II.1 The biased quantum model
The biased quantum model non-Hermitian Hamiltonian is
| (1) |
where the operators and describe the hopping of the particle along (the positive directions of) the axes and , respectively. Quantum mechanically, the hopping operators act on a state at lattice site as ref:Zak
| (4) |
where111Here we use the notations of Ref. ref:Hofstadter . In the notations of Ref. ref:I has been used instead.
| (5) |
is the flux piercing an elementary plaquette of the square lattice counted in units of the elementary flux quantum . The hopping operators obey the commutation relation
| (6) |
II.2 The energy spectrum
II.2.1 General solution
In Ref. ref:I the spectrum of the Hamiltonian (1) was derived in the commensurate case where the magnetic flux (5) is a rational number
| (7) |
with and naturally relative prime integers, so that their greatest common divisor is equal to unity
| (8) |
The spectrum is obtained by solving
| (9) |
where
| (10) |
is a degree polynomial of the energy . Solutions of Eqs. (9) and (10) determine the possible energies where the continuous variables and play the role of quasi-momenta and the magnetic flux enters in Eq. (7) via the integers and which label distinct energy branches.
The spectrum consists of the eigenenergies
| (11) |
where maps different branches of the solutions. It includes, in general, complex valued energies which correspond either to formal instabilities or to a dissipative motion of the particle. It turns out that the spectrum is real for at least certain intervals of the quasi-momentum if and only if is such that
| (12) |
which corresponds to periodic (antiperiodic ) boundary conditions along the -site-long lattice cell in the direction. Below, we restrict ourselves to periodic and antiperiodic boundary conditions for which real eigenenergies do exist.
An interesting feature of the spectrum is that it is independent of the integer provided and are relative prime integers as specified in Eq. (8).
II.2.2 Examples and symmetries of the spectrum
In Fig. 2 (top) and (bottom) for and respectively, the real energy levels are plotted as a function of both for periodic/antiperiodic boundary conditions (solid/dashed lines). One sees that the real branches labelled by in Eq. (11) do materialize for particular intervals of .
Since the features of Fig. 2 are generic for odd and even , we describe them in details below.


For odd , the highest/lowest real energy level is a continuous curve (solid/dashed) for the whole quasi-momentum interval . The other branches are real only in distinct intervals (here we use the fact that the spectrum lies on a circle thus the quasi-momenta and are identified). These energy branches are grouped pairwise to form distorted ovals in each of these intervals. Thus, both in the periodic and antiperiodic cases, one has one continuous energy band and distorted energy ovals [see in Fig. 2 (top) the 21 energy dashed/solid ovals for ].
The odd- energy spectrum has a number of symmetries which are manifest in Fig. 2 (top):
| (13) | |||||
with . Indeed, the spectrum is symmetric under both mirroring in the quasi-momentum direction, , and the discrete shifts . Moreover, for odd , the periodic and antiperiodic spectra are related to each other by the mirroring transformation in the energy direction and a simultaneous shift along the quasi-momentum direction, (here we use again that in the quasi-momentum space and are identified).
For even , in the periodic case, both the highest and the lowest real energy levels are continuous curves for the whole interval . The other branches are real only in distinct intervals. The energy branches are grouped pairwise to form distorted ovals in each of these intervals. Thus one has two continuous energy bands and distorted energy ovals (see in Fig. 2 (bottom) the 24 solid ovals for ). The antiperiodic case is a bit simpler since the energy branches are grouped pairwise to make separate energy ovals in the bands. Thus one has distorted energy ovals (see Fig. 2 (bottom) the 32 dashed ovals for ).
The symmetries of the even- spectrum are simpler:
| (14) | |||||
with . The spectrum is symmetric with respect to mirroring of both energy and quasi-momentum . The spectrum is also invariant under the discrete shifts of the momenta, . Contrary to odd, for even the energy spectra for periodic and antiperiodic boundary conditions are not simply related.
Finally, due to the independence of the spectrum on the numerator of the (normalised) rational magnetic flux in (5), the spectra in Fig. 2 (top) (bottom) are realised, in fact, for six different values of with .
As clearly seen in Fig. 2, the real spectrum occupies the domain with energy bands depending on the magnetic flux . Following Ref. ref:I we plot in Fig. 3 the energy bands as a function of for . Notice that the band spectrum does not carry any information on the actual quasi-momentum dependence since it is obtained by a 1d projection of the spectrum on the vertical (energy) axis. In the next section we are going to show that not only the -dependence of the band spectrum but also the quasi-momentum -dependence of the energy spectrum (11) do have fractal self-similar patterns.

III Structure of energy levels
III.1 Structure of energy bands
It is well-known that the Hofstadter band spectrum222Notice that in the biased quantum model the real-valued band spectrum lies in the narrower interval . reveals a fascinating fractal structure – the Hofstadter butterfly – when it is plotted on the horizontal axis against the normalised magnetic flux on the vertical axis. Likewise, in the biased quantum model, a fractal structure should also materialize when the energy bands are plotted against .
In Fig. 4 the band spectrum is plotted against with all values (and not only the minimal values as in Fig. 3) for , both for periodic and antiperiodic boundary conditions. Here plays a role of a “resolution” parameter which determines the thinness of the chosen grid of possible values.
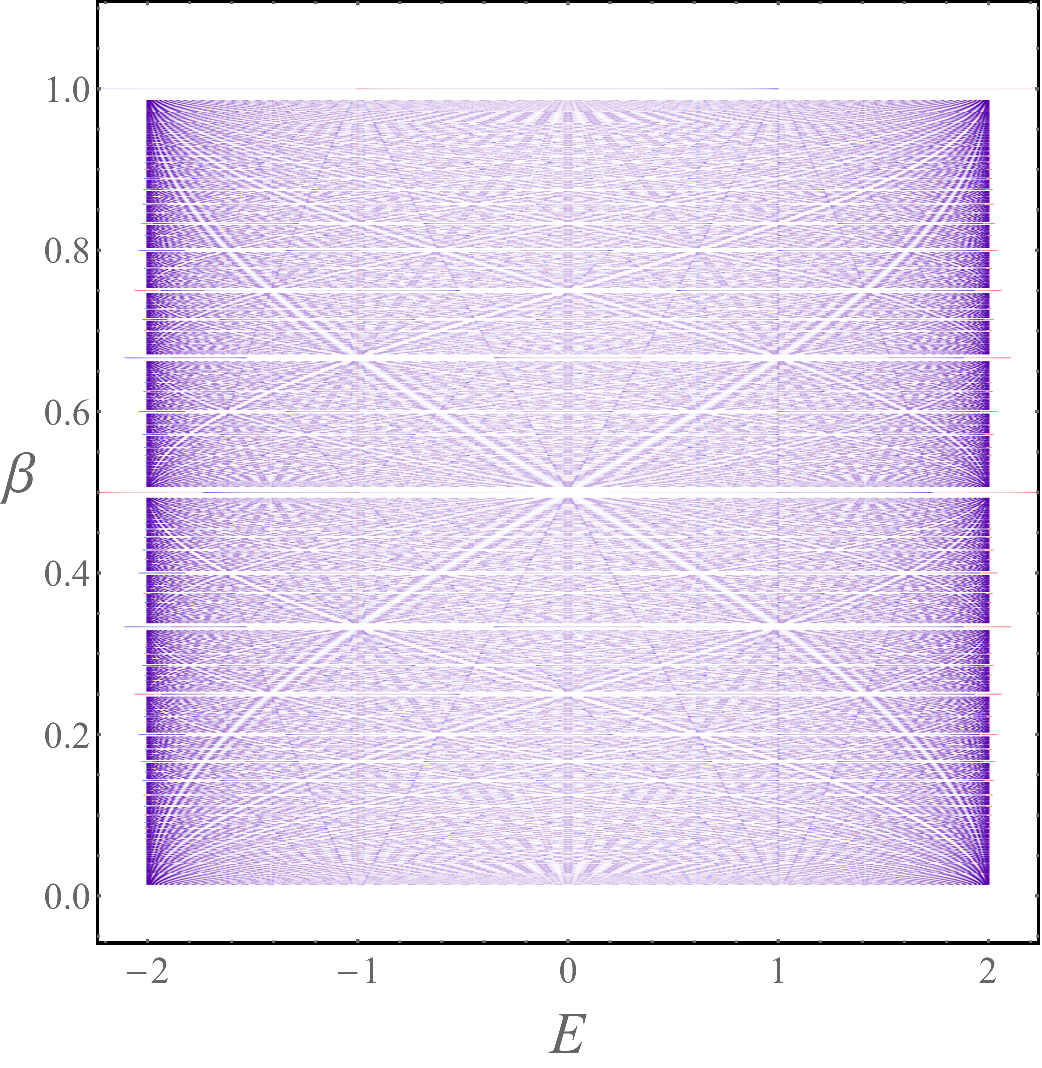
In Fig. 4 the variations of lightness in each energy band correspond to the variations of the (normalised) density of states at a given energy
| (15) |
such that the higher/lower density of states, the darker/lighter the band. As an illustration in Fig. 5 (top) and (bottom), we display the density of states (15) and the corresponding energy levels for , respectively.


At a fixed resolution the (normalised) magnetic flux runs over the values
| (16) |
where corresponds to . The energy levels are defined by Eqs. (9) and (10) that is to say
| (17) |
Evidently, some of the instances of and in Eq. (16) correspond to mutually reducible integers so that their greatest common divisor . In this case one can use the property of the energy polynomial (10) which appears in the LHS of Eq. (17)
| (18) |
where
| (19) |
and is a Chebyshev polynomial of the first kind333We use the standard notation for the Chebyshev polynomial of the first kind determined by the equation ..
Substituting Eq. (18) into Eq. (17), we get for the energy levels
| (20) |
which can be simplified as
| (21) |
where the integer is
| (22) |
We come to some trivial conclusions for the spectrum in the case of the rational (normalised) magnetic flux (7)
-
1.)
if and are mutual prime integers as in (8), then the energy spectrum is determined by
(23) because .
-
2.)
if and are not mutual primes [], then the energy spectrum is determined by
(24) with given in Eq. (22).
-
3.)
in the special case , where the magnetic field is absent, , we get the simple -independent solution
(25) which is Eq. (11) for and thus .
For the integer runs over all possible divisors of the natural number . Therefore the nontrivial energy levels at resolution are determined by Eq. (24) where the ’s are taken from the set of all non equal divisors of .
For example, the scan of non zero possible normalised magnetic fluxes with resolution includes the series . According to our discussion, the mutually prime numbers in share the common spectrum corresponding to , while and correspond to the spectrum of and corresponds to the spectrum of . Therefore, the magnetic fluxes at resolution should include the solutions at [plus, of course, the trivial solution (25)]. In other words, the solutions are given by Eq. (11) with .
As yet another example, consider the magnetic fluxes with resolution , given by , which can be divided into four different groups. The first group with the mutually prime numbers, , , has a spectrum corresponding to the minimal representative . The second group, given by with , corresponds to the mutually prime numbers with the minimal representative . The third group is which has the same spectrum as . Finally, the last group includes only . Thus, the magnetic fluxes at resolution should include the solutions corresponding to and (25). In other words, the solutions are given by Eq. (11) in which runs over the set of all divisors of .
Both examples illustrate that the energy levels with resolution are given by the the energy solutions (11) in which runs over all possible divisors of the original resolution factor [including, of course, the trivial energy level Eq. (25)].
The energy bands are plotted in Fig. 4: they do have a characteristic pattern which no longer resembles a butterfly but rather a spider net.
III.2 Fractal energy levels in quasi-momentum space
III.2.1 Self-similarity
To address the fractal structure of the eigenenergies of the non Hermitian Hofstadter Hamiltonian (1) plotted as a function of the quasi-momentum one has to consider curves made of all the disjoints energy ovals lying in the planar domain .
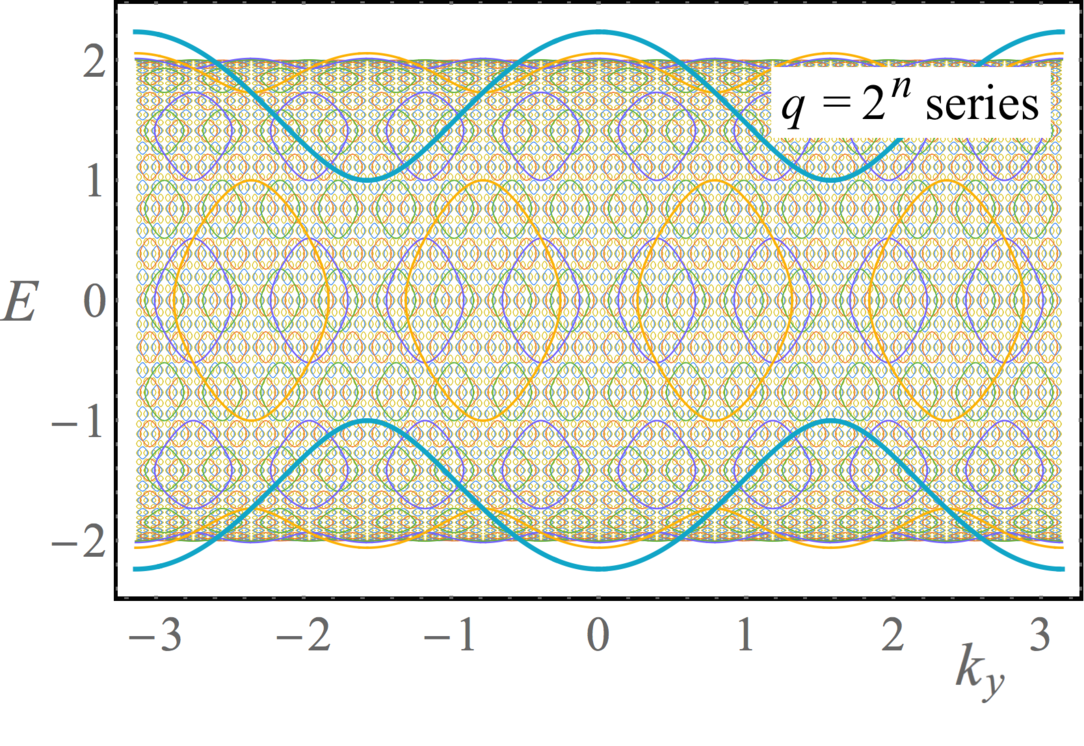
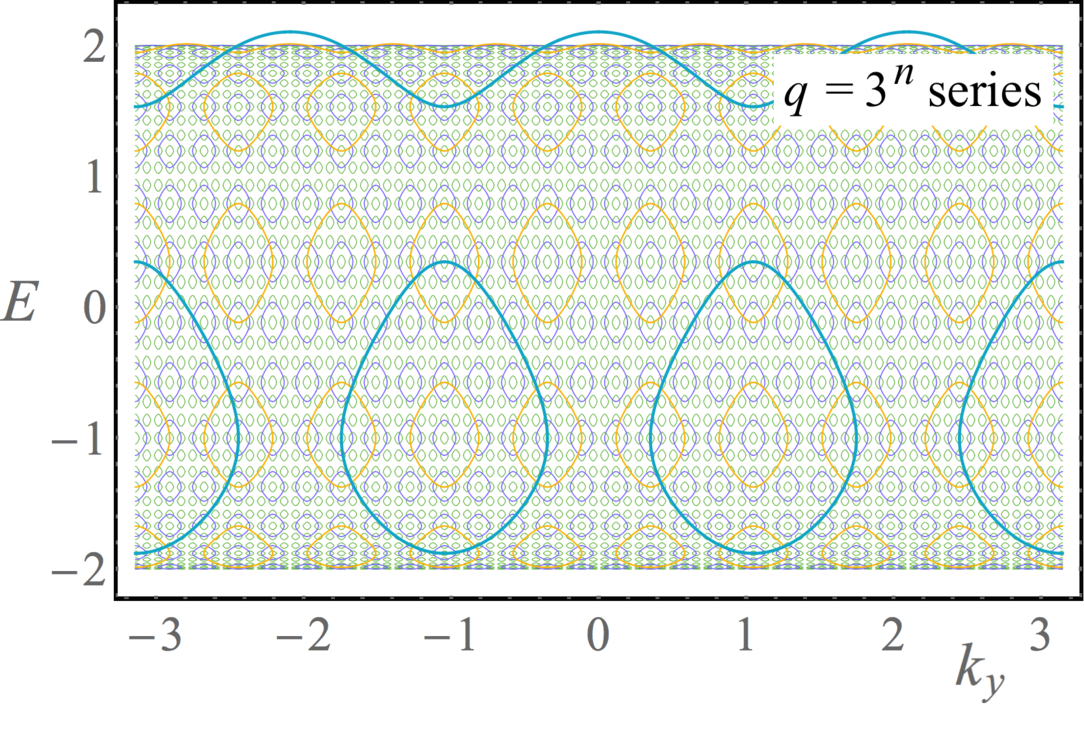
Let us focus on the series where the base includes any integer which is not a member of another series with a smaller base (i.e. for any integers and ). For example, Fig. 2 (top) for is the starting plot of the series with base whereas Fig. 2 (bottom) for belongs to the series . We are going to argue that for a given base in the limit the curve made of the reunion of all the disjoint ovals in each of the members of the series constitute a fractal area–filling curve with Hausdorff dimension 2, as it is the case for well-known area–filling curves such as, for example, the Peano, Wunderlich or Hilbert curves ref:fractals .
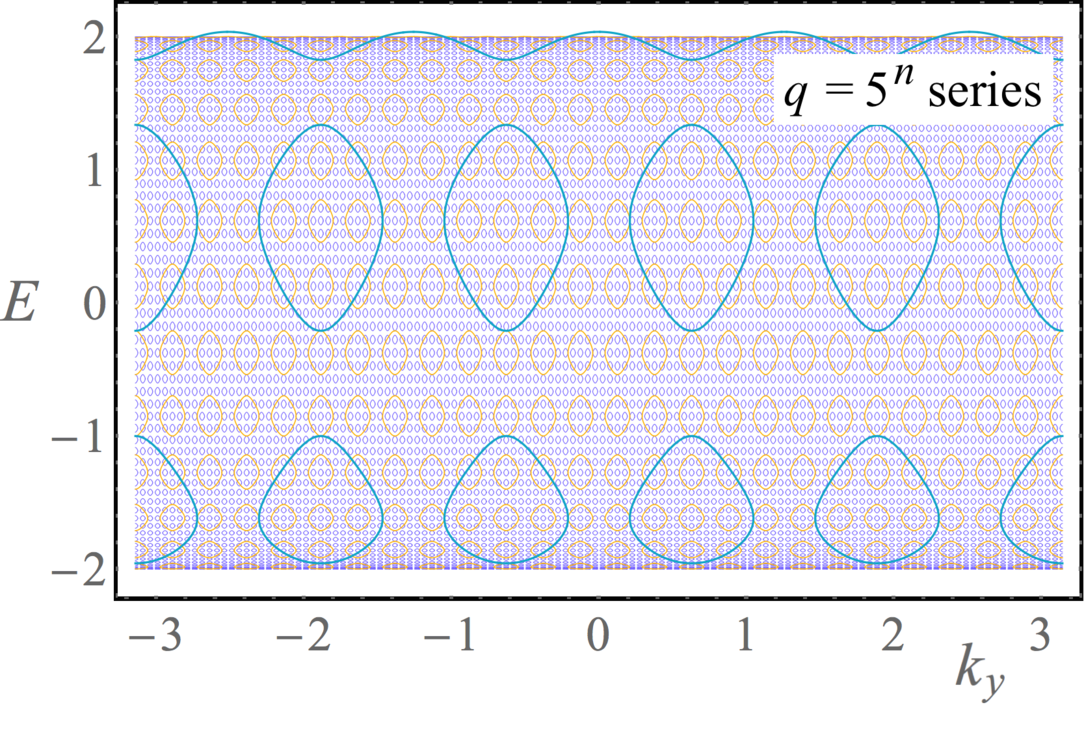
The curves for the series with are shown in Fig. 6.
(a)
(b)
(c)
Note that they are not per se strictly self similar because of the distortion of the ovals near the upper and lower energies . Leaving aside these spurious boundary effects, the overall pattern is those of a fractal which remains unchanged by a more an more accurate zooming. In the sequel we concentrate on the central part of the energy plot, say , where boundary effects become negligible and the self-similar structure of the oval patterns is manifest. As an example, the self–similarity of the energy levels in the series is explicitly illustrated in Fig. 7.
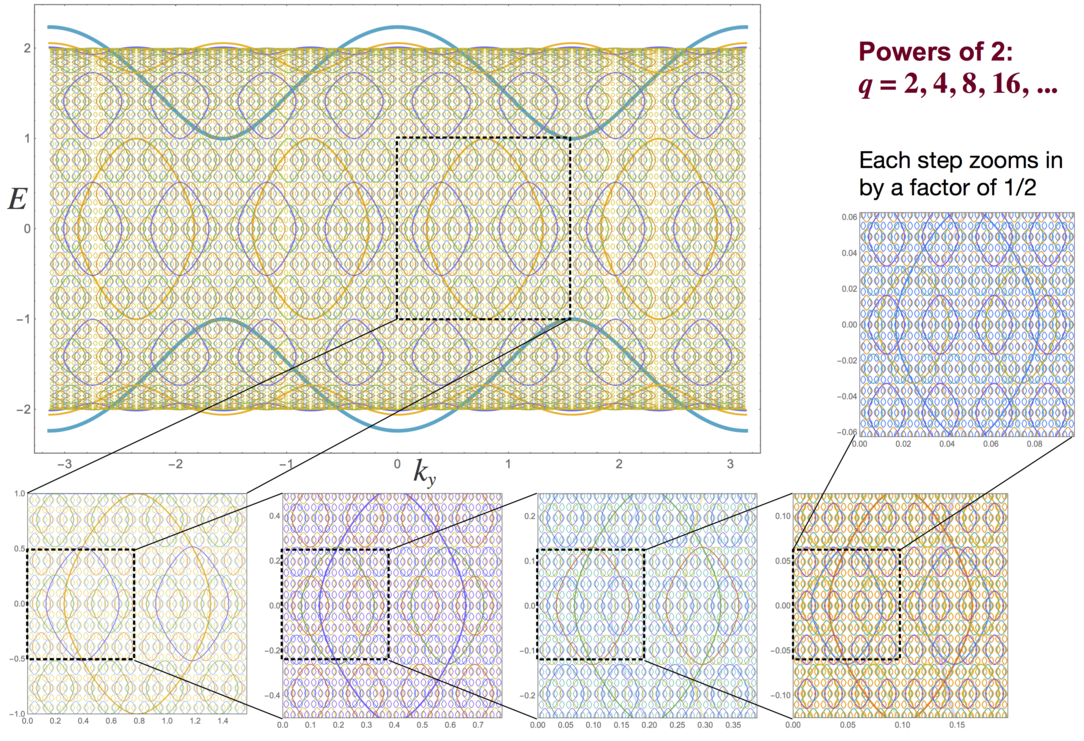
It is clear that in the central region (far from the distorted boundaries) the energy levels are self-similar to a zoomed version of the levels, this for any power . This self-similarity depends on the base number of the series. Thus, in the limit , we have not one but rather an infinite number of fractals labeled by the base that one considers.
III.2.2 Energy levels as space-filling curves
There are several ways to determine the fractal structure of a 2d curve. One way is to consider a curve which, by successive iterations, would have a diverging length yet the area in which it is contained remains finite (typical examples of such curves are the Koch and Peano curves ref:fractals ). The scaling of the length of the curve with the length’s resolution should give us the Hausdorff – fractal – dimension of the curve. Let us first address this question numerically and then, in the next section Section IV, consider some more precise analytical arguments.
As we have already seen, at resolution the number of energy ovals is for an even and for an odd . As a simple example, let us again consider the and curves of Figs. 2. Since the energy pattern repeats itself horizontally times, it is sufficient to consider the part of the curve made of the ovals contained in a given interval (a given column). Numerical estimates for and large (typically, the maximal power is for base ) give for the perimeter length and the area enclosed respectively
| (26) |
As for the total perimeter length and the total area of the entire curve made of all the disjoint ovals, the scalings444Note that the area enclosed by the ovals is contained in a rectangle of area whereas the ”available” surface inside the rectangle, i.e. after removing the gaps between the bands, is ref:I in the large limit . are respectively
| (27) |
The scaling (27) – a diverging length for a curve which nevertheless encloses a finite area – is typical of a fractal area–filling curve. The Hausdorff dimension of the curve and the resolution of the curve’s details – so that the bigger the resolution , the smaller the scale at which one looks at the curve (as already mentioned, corresponds to the minimal possible nonzero value of the normalised magnetic flux ) – should be related by
| (28) |
A comparison of Eq. (27) with Eq. (28) gives a Hausdorff dimension which does correspond to an area-filling curve.
Another way to show that the Hausdorff dimension is consists in rephrasing the scaling argument above in terms of iterative patterns which are clearly visible in Fig. 7 for base : each time the resolution is doubled, i.e. is divided by , the number of ovals is multiplied by . This property is again characteristic of a fractal with Hausdorff dimension . In general for base , iterating means dividing by with a number of ovals multiplied by , so again an Hausdorff dimension .
IV Chebyshev nesting and fractals
The energy spectrum of the non-Hermitian Hamiltonian (1) is determined by Eqs. (19), (23) or (24) which involve Chebyshev polynomials of the first kind. The fractal structure of the series can surprisingly be understood in terms of the so-called “Chebyshev nesting” which is a composition identity for Chebyshev polynomials
| (29) |
We can use three different approaches to discuss the relation of Chebyshev nesting (29) to the fractal self-similarity of the energy curves.
Firstly, let us consider the horizontal scaling of the energy solutions of Eq. (23). As we have already noticed in Fig. 2 and Fig. 6, the undistorted self-similar pattern of the energy levels is manifest in the vicinity of the horizontal axis. The same self-similarity should in particular be seen in the scaling behaviour of the zero-energy solutions which occur for a set of specific quasi-momenta . In other words, if, for the series , the energy curves exhibit a self-similarity as the power increases, then one might expect that the discrete quasi-momenta for which the energy lines cross the horizontal axis will also exhibit a self-similar scaling. According to Eqs. (19) and (23) for periodic boundary conditions – where indeed energy lines do cross the horizontal axis for both even and odd – these zero-energy quasi-momenta are given by
| (30) |
The important consequence of (29) is that, according to Eq. (36), does not depend on for . Then, in the periodic case at hand, the zero-energy quasi-momenta solutions of Eq. (30) are
| (40) |
where labels the possible independent solutions contained in the interval .
According to Eq. (40), for any fixed two powers and with , the zero-energy quasi-momenta are related by
| (41) |
This implies that the zero energy quasi-momenta for can be obtained by a rescaling of the quasi-momenta by a factor . In other words, the width of the ovals diminishes by with each step .
Secondly, let us consider the vertical scaling of the energy ovals for periodic boundary conditions. This scaling can be determined in a similar way using a simple argument based on the Taylor expansion of Chebyshev polynomials. Indeed, let us determine from Eqs. (19) and (23) the spectrum in the region close to the axis where the energy spectrum is undistorted. For a given , the Chebyshev polynomial in Eq. (19) can be expanded in power series as
| (42) |
where
| (43) |
The first two terms in the small- expansion (42) depend solely on . The next–order term in Eq. (42) does not share the same scaling, but in the small energies region (or, equivalently, small ), it can be neglected as well as the higher–order terms. These facts play an important role for the fractal properties of the energy spectrum: indeed keeping only these lowest–order terms, is invariant with respect to the shift
| (44) |
One can then distinguish two sectors according to the parity of
| (45) | |||||
| (46) |
where for even (odd) , respectively. For a given , is independent on .
Clearly, for with periodic boundary conditions, the energy close to the horizontal axis is determined by
| (47) |
Due to the independence on of the left hand side of Eq. (47) once the parity is fixed, the energy solutions for and are related by
| (48) |
where is an arbitrary natural number. The self-similar scaling property (48) is consistent with the zero energy quasi-momenta scaling (41).
The explicit solutions of Eqs. (45), (46), (47),
| (51) |
are low-energy solutions valid in the region . They highlight the self-similarity properties (41) and (48) of the energy spectrum as increases.
Thirdly, there is a bit more elegant and general way to show the fractal self-similarity of the spectrum both for periodic and antiperiodic boundary conditions by using yet another property of the Chebyshev polynomials
| (54) |
For practical purposes it is convenient to use an approximate formula based on (54)
where is given in Eq. (39). The approximation made in (IV) is valid in the interval with an error for . The accuracy of this approximation is increasing rapidly as either or or both become larger (for example for the error is less than ).
For large one can combine, both for periodic and antiperiodic boundary conditions, Eqs. (19), (23) and (IV) into
| (58) |
which are again valid in the energy domain . One can check that the solutions of Eqs. (58) reproduce the lowest energy levels.
The symmetries of Eqs. (58) clearly imply the fractal self-similarity of the energy levels
| (59) |
both for even and odd and . These equations are consistent with the scalings (41) and (48).
Equation (59) implies that the energy spectrum for can be obtained by
-
1.)
rescaling (i.e., squeezing) the solution by the factor both in the energy and quasi-momentum coordinates, and
-
2.)
periodically copying (i.e., extending) the squeezed solution times along the energy axis and times along the quasi-momentum axis.
Note that these properties cannot be readily seen from the original Eq. (11). They highlight three important properties of the series which were already numerically illustrated above. As :
-
A)
the total area enclosed by the energy ovals in a fixed area of the plane remains constant since the ovals become –times smaller in each of the two ( and ) directions while their number increases by a factor so that ;
-
B)
the total lengths and of the energy oval perimeters in a fixed column and a fixed row respectively remain constant since they become –times smaller while their numbers in each column and in each row increase by a factor so that and ;
-
C)
the total length of the energy oval perimeters in a fixed area in the plane increases by a factor so that due to the second property as well as because the number of columns and ovals increases by the same factor .
When these three properties imply that the total length of the energy curves (i.e., of the oval perimeters) in a fixed area of the plane diverges as while the area enclosed by these ovals remains constant. Thus, a union of the energy ovals indeed constitute an area-filling curve with Hausdorff dimension . In agreement with Eq. (28), the size of any individual oval along any direction decreases with an increasing resolution, , so that one gets with the usual Hausdorff dimension for space-filling curves.
Notice that the band structure of the energy levels has been obtained by projecting the –dependent energy levels on the vertical energy axis and plotting it against the the magnetic flux . Since the quasi-momentum dependent energy levels are self-similar, we conclude that for a fixed base the energy band spectrum has also to exhibit a fractal self-similarity for the different powers of the normalised magnetic flux , as illustrated in Fig. 4.
V Flattened energy spectra
V.1 Flattening
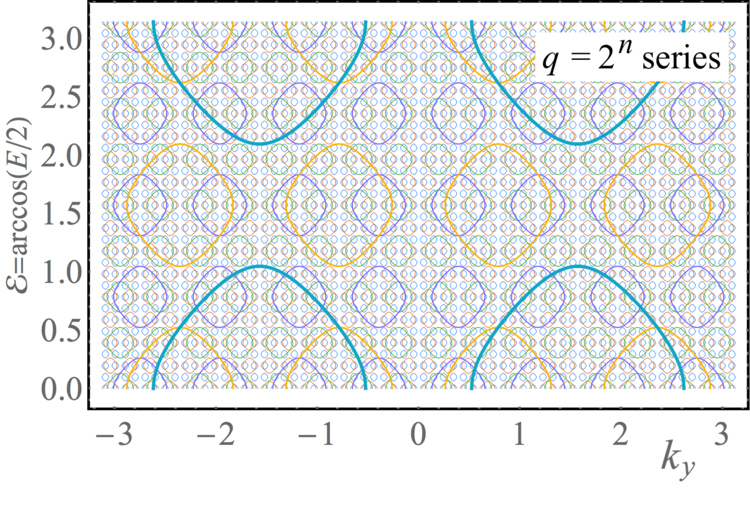
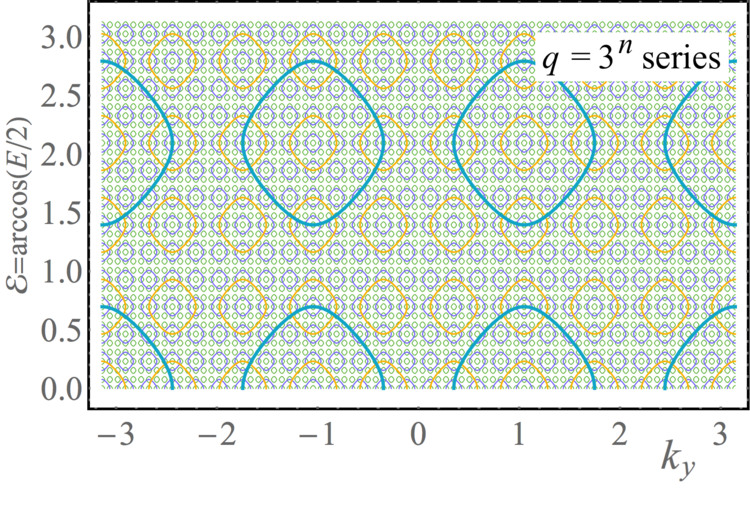
The fractal self-similarity of the real-valued energy spectrum (11) can be addressed in yet another way. As stressed above, the energy ovals are distorted near both edges of the spectrum (as illustrated in Fig. 6). On the other hand in the center , the distortion is practically absent and the self-similarity is quite pronounced. It turns out that in order to remove the boundary distortion effects from the entire energy domain, it is sufficient to consider, instead of the energy itself, the energy-related quantity
| (60) |
in the interval .
Using (11) for the energy branches of the original spectrum, one can rewrite Eq. (60)
| (61) |
where
| (62) |
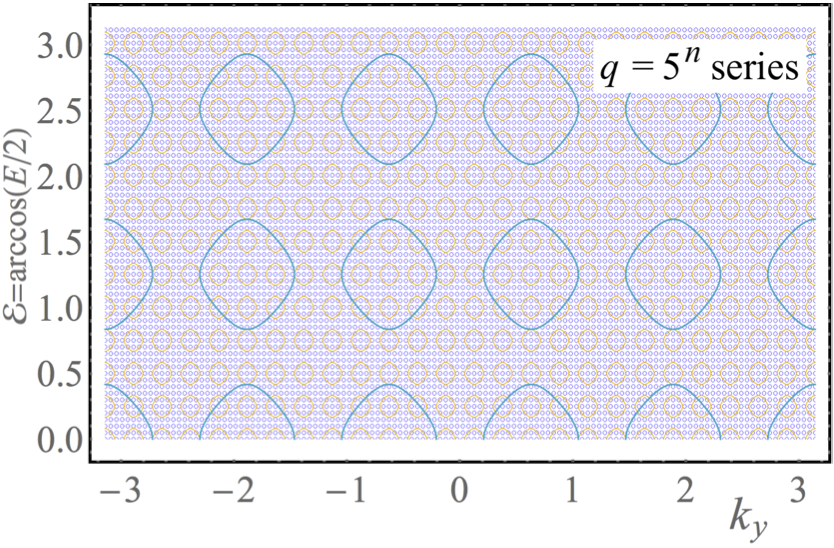
The flattened spectra (60) are shown in Fig. 8(a), (b) and (c), respectively for the series with , and – they correspond to the unflattened spectra of Fig. 6. Clearly, the arccos-operator in Eq. (60) “unfolds” the spectrum by flattening the energy levels close to , so that no distortion is present anymore. It follows that the fractal self-similarity of the spectrum is manifest in the whole energy domain.
(a)
(b)
(c)
For example in Fig. 8(a), each of the energy ovals intersects with two smaller energy ovals for . Analogously in Fig. 8(b), each of the energy ovals intersects with four and includes one smaller energy ovals for . And in Fig. 8(c) a similar self-similarity pattern can easily be observed for the series.
V.2 Self-similarity for the flattened bands
Besides these visual observations, one can make a more precise statement on the self-similarity. In Fig. 9 we plot the flattened band spectra for with . These plots share certain features with Fig. 3 but with the difference that in Fig. 9 the vertical axis shows the power for a given base instead of for a set of ’s.
Consider first in Fig. 9(a) the series. The spectrum at the lowest level has – in terms of the flattened energy variable (60) – a single band of width and a gap of width . In order to get the spectrum at the next level , it is sufficient to
-
(i)
rescale the original spectrum, shrinking it by a factor so that
-
(ii)
duplicate the resulting spectrum to cover again the whole energy range,
-
(iii)
and finally invert the duplicate around its center .
Obviously, the total width of the two resulting bands at level remains equal to the width of the single original band, .
Recursively, the band spectrum at level is obtained by applying the same rescaling/duplicating/inverting procedure on the spectrum at level :
-
(i)
rescale the spectrum by a -shrinking
-
(ii)
duplicate the resulting spectrum
-
(iii)
invert the duplicate around its center .
In Fig. 9(a) this procedure is explicitly illustrated up to level . Note that some pairs of adjacent smaller bands merge in single bands with a width twice larger. Note also that the inversion is not trivial only for the first iteration since from onward the spectrum becomes symetric around its center.
As a result, for the series, at level there are bands with individual widths necessarily summing to
| (63) |
By construction, this band spectrum is evidently self-similar, and it becomes a fractal in the limit .
Likewise, consider in Fig. 9(b) the flattened energy bands for the series up to level . Starting from level the iterative procedure consists in
-
(i)
rescaling the spectrum by a -shrinking;
-
(ii)
triplicating the resulting spectrum;
-
(iii)
and finally inverting the second copy around its center
with pairs of adjacent bands again merging into single bands of width twice larger. As a result, for the series, at level there are bands which again have a total width , as in Eq. (63). Similarly to the series, in the limit the band spectrum becomes a fractal.
A similar iterative procedure applies to the band spectrum for the series as illustrated in Fig. 9(c) up to level . The bands at level are constructed from the bands at level by a -shrinking, -plicating and inversion of every even copy around their centers and respectively. Again adjacent bands merge into single bands twice wider so that at level there are bands with a total width . Clearly, in the limit the spectrum becomes a fractal.

(a)

(b)

(c)
The universality of the iterative self-similar procedure is now evident. For the series the band spectrum at level can be constructed from the band spectrum at level by
-
(i)
-shrinking,
-
(ii)
-plicating,
-
(iii)
inverting every even copy around their centers with .
As a result at level there are (for odd ) or (for even ) bands with a total width . This implies that the bands always occupy of the available flattened energy range . The universality of the procedure is highlighted by the fact that all the band spectra are constructed from the same initial level band spectrum.
For every given base each successive iteration has the bands shrinking to smaller bands. Thus, in the limit , one obtains a point-like spectrum consisting of infinitely many bands of infinitely small width. The structure of the band spectrum is similar to a Cantor set with a difference, which is, however, essential: contrary to the Cantor set, the total band width is the nonzero base-independent quantity
| (64) |
Thus, similarly to the original unflattened band spectrum, the flattened band spectrum has a fractal self-similar structure when plotted against the normalised magnetic flux with , with a resolution for base determined by the increasing level number . The self-similarity pattern depends on but the total band width (64) is -independent. The flattened band spectrum has a Hausdorff dimension which follows from the -shrinking -plicating iterative procedure.
Finally, we stress that, as far as the unflattened spectrum in eq. (11) is concerned, distortion effects tend to disappear in the limit: as increases the energy “ovals” distortion effects migrate from the center of the spectrum towards its edges, . In other words, in the limit of an infinitely large resolution, regions with distorted ovals eventually disappear at the edges of the energy domain. This feature is clearly visible in the plots of Fig. 6 which are worth comparing with their corresponding flattened versions in Fig. 8. In Ref. ref:I , the unflattened spectrum was shown to have a total band width saturating to . Compared to the total unflattened energy range, , the bands therefore occupy in this limit of the whole energy interval. Equation (64), not surprisingly, leads to the same conclusion for the flattened band spectrum.
VI Complex energy branches
So far we have discussed the real energy branches of the non-Hermitian Hamiltonian (1). However, the full spectrum contains energy branches with a non zero imaginary part. Since these energies correspond either to some formal instabilities or to a dissipative motion of the particles, they are not particularly relevant for a large system at thermodynamical equilibrium. Still, for the sake of completeness, we find appropriate to display the entire spectrum with its complex energy modes.
In Fig. 10 the spectrum is displayed in a 3d (, , ) plot. The real branches shown in Fig. 2 are recognisable in the horizontal (, , ) plane. They build ordered chains of distorted ovals. Similarly, the complex branches build ordered chains of distorted ovals in the (, , ) plane. These complex (“vertical” in the 3d plot) ovals connect the real (“horizontal”) ovals in a chain–like manner.
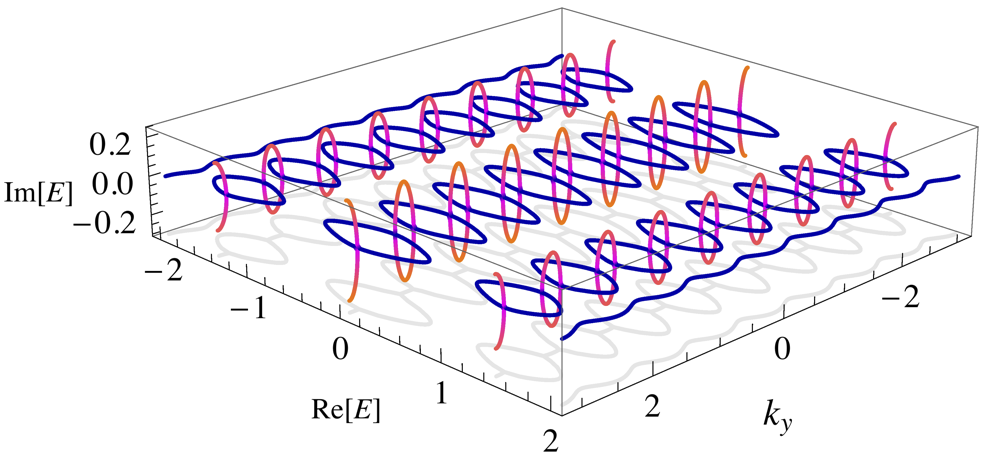
Energy spectra for generic values, both for periodic and antiperiodic boundary conditions, are similar to Fig. 10, with horizontal real ovals always connected by vertical complex ovals along the coordinate. This observation gives strong evidence to the fact that the entire energy spectrum – with the imaginary branches included – is also a fractal, similarly to the real energy spectrum.
VII Conclusions
We have studied the fractal properties of the energy spectrum of a charged particle with a biased motion on a two-dimensional square lattice in the background of a magnetic field. This biased quantum model is such that the particle is not allowed to hop in one of the directions (say, to the left) while it can freely move in all other directions. Its dynamics is described by a non-Hermitian Hamiltonian of a Hofstadter type.
We have shown that the energy spectrum, which depends on the normalised magnetic flux – the ratio of the magnetic flux threading an elementary plaquette to the magnetic flux quantum – possesses a nested multi-fractal structure.
The energy bands, plotted against the rational magnetic flux, exhibit a fractal pattern shown in Fig. 4. Contrary to the Hofstadter’s butterfly, the band spectrum is rather similar to a spider net.
The energy levels, plotted against the quasi-momentum, exhibit even more curious fractal patterns as illustrated in Fig. 6. We have shown, both numerically and analytically, that the real energy spectrum is an overlap of infinitely many inequivalent fractals which we call “fractal energy carpets”. The energy levels in each fractal are space-filling curves with Hausdorff dimensions .
In a more rigorous approach, we have shown that for a given base and resolution with , the energy curves for the normalised magnetic flux ( is required to not be equal to a natural power of a natural number) have a self-similar geometric structure. This self-similarity is observed up to certain finite scales, both in quasi-momentum and in energy, constrained by the finiteness of . In the limit of an infinitely fine resolution, , the structure of the energy level becomes a fractal with various fractal carpets depending on the base considered.
We have also shown that the real branches of the energy spectrum are connected by complex branches forming chain-like structures in the 3d space of the energies plotted against the quasi-momentum.
The fractal properties of the energy levels are visualised in the supplementary video material ref:video .
References
- (1) D. R. Hofstadter, “Energy levels and wave functions of Bloch electrons in rational and irrational magnetic fields” Phys. Rev. B 14, 2239 (1976).
- (2) B. Mandelbrot, “The Fractal Geometry of Nature” (W. H. Freeman and Co., San Francisco, 1982).
- (3) S. Matveenko and S. Ouvry, “Area distribution of two-dimensional quantum models and non Hermitian Hofstadter quantum mechanics” J. Phys. A 47, 185001 (2014).
- (4) S. Mashkevich and S. Ouvry, ”Area distribution of two-dimensional random walks on a square lattice” J. Stat. Phys. 137, 71 (2009).
- (5) J. Zak, “Magnetic Translation Group”, Phys. Rev. 134, A1602; “Magnetic Translation Group. II. Irreducible Representations”, Phys. Rev. 134, A1607.
- (6) https://www.youtube.com/watch?v=ODS3QVkPTPE