Disentangling inertial waves from eddy turbulence in a forced rotating turbulence experiment
Abstract
We present a spatio-temporal analysis of a statistically stationary rotating turbulence experiment, aiming to extract a signature of inertial waves, and to determine the scales and frequencies at which they can be detected. The analysis uses two-point spatial correlations of the temporal Fourier transform of velocity fields obtained from time-resolved stereoscopic particle image velocimetry measurements in the rotating frame. We quantify the degree of anisotropy of turbulence as a function of frequency and spatial scale. We show that this space-time-dependent anisotropy is well described by the dispersion relation of linear inertial waves at large scale, while smaller scales are dominated by the sweeping of the waves by fluid motion at larger scales. This sweeping effect is mostly due to the low-frequency quasi-two-dimensional component of the turbulent flow, a prominent feature of our experiment which is not accounted for by wave turbulence theory. These results question the relevance of this theory for rotating turbulence at the moderate Rossby numbers accessible in laboratory experiments, which are relevant to most geophysical and astrophysical flows.
I Introduction
The energy content of turbulence is usually characterized by the energy distribution among spatial scales, either in physical or in Fourier space. For rotating, stratified, or magnetohydrodynamic turbulence DavidsonBook2013 , waves can propagate and coexist with “classical” eddies and coherent structures, which advocates for a spatio-temporal description of such flows. While temporal fluctuations are usually slaved to the spatial ones via sweeping effects in classical turbulence Chen1989 ; Sanada1992 , they are expected to be governed by the dispersion relation of the waves for time scales much smaller than the eddy turnover time. The latter regime is the subject of wave turbulence theory, in which the assumption of weak nonlinear coupling between waves allows to predict scaling laws for the spatial energy spectrum Zakharov1992 ; Nazarenko2011 .
It is a matter of debate whether wave turbulence theory (also known as weak turbulence theory) is a good candidate to describe rotating turbulence in the rapidly rotating limit. Solutions to the linearized rotating Euler equation can be decomposed into inertial waves, which satisfy the anisotropic dispersion relation
| (1) |
where is the rotation rate and the component of the wave vector along the rotation axis (referred to as the vertical axis by convention) GreenspanBook . Accordingly, only fluid motions at frequencies smaller than the Coriolis frequency correspond to wave propagation. Fluid motions of weak amplitude and slowly varying in time () can be described in terms of waves with nearly horizontal wave vectors: they tend to be two-dimensional and three-component (2D3C), invariant along the rotation axis, a result known as the Taylor-Proudman theorem.
The trend towards two-dimensionality is a landmark in rotating turbulence, observed both in experiments and numerical simulations Hopfinger1982 ; Jacquin1990 ; Bartello1994 ; Moisy2011 ; DavidsonBook2013 ; Godeferd2015 . It originates from the modification of the nonlinear interactions by the Coriolis force, which yields preferential energy transfers towards modes with almost horizontal wave vectors Morinishi2001 ; Mininni2009 ; Lamriben2011 ; Delache2014 . In the frequency domain, this corresponds to the generation of slow dynamics compared to the characteristic frequency at which energy is supplied to the system. These anisotropic energy transfers can be accounted for in terms of resonant and near-resonant triadic interactions of inertial waves Cambon1989 ; Waleffe1993 ; Smith1999 ; Bordes2012 . A major feature of rotating turbulence is the emergence of inverse energy transfers in the horizontal plane Smith1999 ; Baroud2002 ; Morize2005 ; Chen2005 ; Mininni2009 ; Sen2012 ; Yarom2013 ; Deusebio2014 ; Campagne2014 . Inverse transfers between 3D fast “wave” modes and the 2D slow “vortex” mode, mediated by near-resonant triadic interactions, are allowed at finite Rossby number only Chen2005 ; Smith2005 ; Bourouiba2007 ; Bourouiba2012 ; Sen2012 . The 2D mode is therefore fed either from the coupling with the 3D modes at finite Rossby number, or from direct energy input by the forcing. One naturally expects the energy within this 2D mode to undergo an inverse energy cascade, similar to that of classical (non-rotating) 2D turbulence Kraichnan1967 ; Tabeling2002 .
Such coexistence between 2D and 3D flows is relevant to most experiments and numerical simulations, and cannot be accounted for by wave turbulence theory, which describes the direct energy cascade arising from resonant triadic interactions of 3D wave modes only Galtier2003 ; Cambon2004 . This theory therefore provides only a partial description of rotating turbulence in realistic systems, and careful experimental and numerical studies remain necessary to assess its range of validity.
Laboratory experiments differ from most numerical and theoretical studies by the presence of rigid horizontal boundaries, where the rotating flow achieves no-slip conditions through Ekman layers Pedlosky . In a laminar Ekman layer, the balance between the viscous and Coriolis forces leads to a boundary layer thickness . The belief is that, provided the experimental tank is deep enough, the bulk turbulent flow away from the top and bottom boundaries should resemble the one obtained in the ideal 3D periodic or stress-free domains considered in most numerical and theoretical studies. Closer to the horizontal walls, the boundary layers induce Ekman friction that is not taken into account by most numerical studies.
In the laboratory, the energy dissipation of rotating turbulent flows originates from three main contributions: bulk viscous dissipation of 3D flow structures, bulk viscous dissipation of quasi-2D flow structures (somewhat similar to the bulk energy dissipation of 2D turbulence), and dissipation through Ekman friction on the horizontal boundaries.
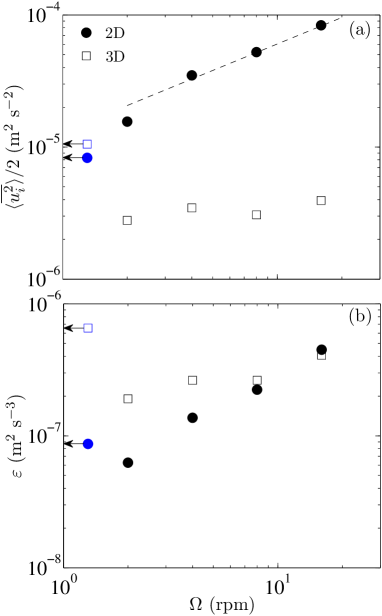
In spite of the importance of the 2D mode in most geophysical and laboratory flows, the 3D fluctuations still play a crucial role in the dynamics of rotating turbulence, because they are much more efficient at dissipating energy. This key feature is illustrated in Fig. 2, from data obtained in the present experiment (setup sketched in Fig. 1; see Sec. III for details): we decompose the turbulent velocity field into a vertically-averaged 2D flow and a vertically-dependent 3D remainder, and show the corresponding energies and energy dissipation rates as a function of global rotation. For maximum rotation, although the 3D component contains a small fraction of the total kinetic energy, its dissipation rate is as large as that of the vertically-invariant 2D component. Moreover, both of these dissipations are larger than an estimate of the frictional losses due to laminar Ekman layers (see Sec. III). An accurate description of the 3D structures of the flow is therefore essential to characterize the energy fluxes in rotating turbulence at moderate Rossby number.
A primary goal in this direction is to determine the range of scales and frequencies for which 3D fluctuations follow the inertial-wave dispersion relation. This requires a full spatio-temporal analysis, which is very demanding in general for wave-turbulence systems: the accessible range of scales is usually limited in experiments, whereas long integration times are prohibitive in numerical simulations. The case of rotating turbulence is particularly delicate because of the specific form of the dispersion relation (1): the frequency is not related to the wave number, as in conventional isotropic wave systems such as surface waves Berhanu2013 or elastic waves Boudaoud2008 ; Mordant2008 , but to the wave vector orientation only.
The recent studies of Clark di Leoni et al. Clark2014 and Yarom and Sharon Yarom2014 constitute important steps forward in this respect. Using numerical simulation of rotating turbulence forced at large scale, Clark di Leoni et al. Clark2014 observe a clear concentration of energy along the dispersion relation of inertial waves, and provide a detailed analysis of the various time scales of the system. They observe a wave-dominated regime at large scale and a sweeping-dominated regime at small scale (see also Ref. Favier2010 ). In the experiment of Yarom and Sharon Yarom2014 the forcing consists of a random set of sources and sinks at the bottom of a rotating water tank. They measure three-dimensional two-component (3D2C) velocity fields using a scanning particle image velocimetry (PIV) technique, and observe also a good agreement with the inertial wave dispersion relation. In both Refs. Clark2014 and Yarom2014 , the inertial waves are observed at scales smaller than the injection scale, suggesting that they are fed by forward energy transfers, which is consistent with the predictions of wave turbulence theory.
The aim of the present paper is to further analyze experimentally the range of spatio-temporal scales at which inertial waves can be detected in rotating turbulence. Stationary rotating turbulence is produced by a set of vortex dipole generators which continuously inject turbulent fluctuations towards the center of a rotating water tank where measurements are performed. We showed in Ref. Campagne2014 that this configuration generates a double energy cascade at large rotation rate: an inverse cascade of horizontal energy and a direct cascade of vertical energy, which behaves approximately as a passive scalar advected by the horizontal flow. Here we perform a detailed spatio-temporal analysis using two-point spatial correlations of the temporal Fourier modes computed from time-resolved two-dimensional three-component (2D3C) velocity fields measured by stereoscopic PIV in a vertical plane. We observe that, at large scales and frequencies, the spatio-temporal anisotropy of the energy distribution is well described by the dispersion relation of inertial waves, whereas smaller scales are dominated by the sweeping of the waves by the energetic large-scale flow.
II Experimental setup
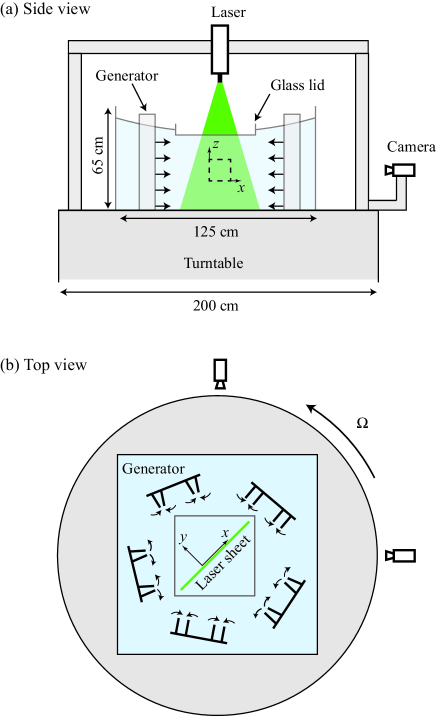
The experimental setup, sketched in Fig. 1, is similar to the one described in Refs. Campagne2014 ; Gallet2014 and is only briefly described here. It consists of a cm3 glass tank, filled with cm of water and mounted on a 2 m-diameter rotating platform which rotates at a rate in the range to rad s-1 ( to rpm). Turbulence is produced in the rotating frame by a set of ten vertical vortex dipole generators organized as a circular arena of 85 cm diameter around the center of the water tank. This forcing device was initially designed to generate turbulence in stratified fluids, and is described in detail in Refs. Billant2000 ; Augier2014 . Each generator consists of a pair of vertical flaps, 60 cm high and cm long, alternatively closing rapidly and opening slowly in a cyclic motion of period s. The closing stage is achieved with the flaps rotating at an angular velocity rad s-1, and a random phase shift is applied between the generators.
In the laminar regime, a single pair of flaps generates vortex dipoles with core vorticity . Additional PIV measurements close to a vortex dipole generator indicate that this core vorticity is governed by the vorticity in the viscous boundary layer of the flap, , where is the flap velocity and the viscous boundary layer thickness. In the present experiment, the vortex dipoles are unstable, and the closing of the flaps therefore produces small-scale 3D turbulent fluctuations that are advected towards the center of the arena by the remaining large-scale dipolar structure.
The turbulent Reynolds number, computed from the rms velocity and the horizontal integral scale, is about 400 in the center of the flow, and the turbulent Rossby number covers the range for rpm Campagne2014 .
We measure the three components of the velocity field (with oriented vertically, along the rotation axis) in a vertical square domain of size cm2 located at the center of the circular arena at mid-depth, using a stereoscopic PIV system DaVis ; Pivmat embarked on the rotating platform. These 2D3C (two-dimensional three-component) velocity fields are sampled on a grid of vectors with a spatial resolution of mm. Two acquisition sets are recorded for each rotation rate : one set of 10 000 fields at 0.35 Hz and one set of 1 000 fields at 1.5 Hz. The combination of these two time series results in a temporal spectral range of three decades.
III 2D vs. 3D flow components
In the present experiment, energy is primarily injected in the 2D mode (vertically invariant), but the instabilities in the vicinity of the flaps rapidly feed 3D fluctuations which are advected in the central region. Energy transfers between the 2D and 3D flow components, which vanish in the weak turbulence limit (), are allowed in our system because of the moderate value of the Rossby number. It is therefore of first interest to quantify the energy contained in the 2D and 3D components of the flow. We estimate the vertically-averaged 2D flow as the average of the velocity field over the vertical extent of the PIV field,
| (2) |
and the remaining -dependent 3D flow as . We compute the energy per unit mass of these two flow components as and , with the temporal average and the spatial average over the PIV field. They are plotted in Fig. 2(a) as a function of the rotation rate . Because of the limited height of the PIV field, the 2D flow estimated from Eq. (2) unavoidably contains 3D fluctuations associated to vertical scales larger than , so the measured 2D energy may overestimate the true one.
Figure 2(a) shows that without rotation the 2D and 3D components of the flow have comparable energy. With rotation, the 2D energy increases with , following approximately the power law Gallet2014 , whereas the 3D energy remains approximately constant, and represents only 5% of the total energy at the largest rotation rate. Although most of the energy is contained in the 2D flow component for , a significant fraction of the dissipation still arises from the 3D fluctuations. Assuming axisymmetry, we compute an estimate of the energy dissipation rate from the 6 terms of the velocity gradient tensor accessible in the 3C2D measurements,
| (3) |
This dissipation rate, computed both for and , is shown in Fig. 2(b). Since the derivatives are obtained from finite differences at the smallest resolved scale, the computed dissipation underestimates the true one (the PIV resolution is mm while the Kolmogorov scale is of order of 0.6 mm Gallet2014 ). However, we expect the measured evolution of with to reflect the true one.
We first compare these bulk energy dissipation rates to an estimate of frictional losses due to laminar Ekman layers, , where is the root-mean-square horizontal velocity. This estimate ranges from m2 s-3 for rpm to m2 s-3 for rpm: it is smaller than the bulk energy dissipation of both the 2D and 3D parts of the turbulent flow, by a factor of 10 for slow rotation and 4 for rapid rotation. A detailed experimental characterization of these Ekman layers would be necessary to validate the assumption of laminar layers, but it is beyond the scope of the present study.
We now compare the bulk energy dissipation rates in the 2D and 3D parts of the turbulent flow. Remarkably, while the 3D fluctuations represent a small fraction of the total energy, they account for a large fraction of the dissipation at all rotation rates. It is therefore of first interest to investigate these 3D modes, and to determine to what extent they can be described in terms of inertial waves.
IV Temporal analysis
We now focus on the temporal dynamics of the velocity field, which we characterize through the energy distribution of turbulent fluctuations as a function of angular frequency . This temporal energy spectrum is defined as
| (4) |
where
| (5) |
is the temporal Fourier transform of the velocity field (with ), the acquisition duration and the spatial average. The normalization is such that , with the temporal average. We use the standard Welch’s method Welch1967 to improve the statistical convergence of the power spectrum.
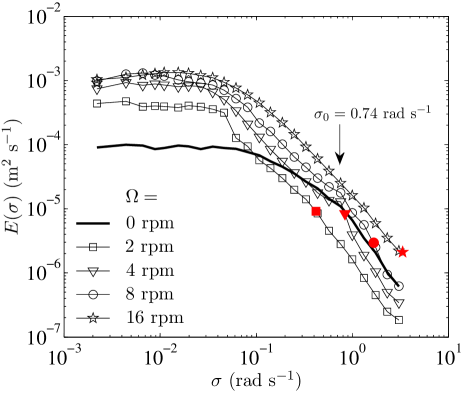
We plot for each rotation rate in Fig. 3. For , we observe a global increase with of the energy at all frequencies, consistently with the behavior of the overall energy in Fig. 2(a). These spectra for strongly differ from the non-rotating spectrum, with relatively much more energy at low frequency in the rotating case: global rotation induces slow dynamics.
A first step towards a description of the flow anisotropy in the frequency domain can be provided by further decomposing the power spectrum density (4) as
| (6) |
with the spectrum of the vertical velocity and the spectrum of the horizontal velocity. This decomposition highlights the frequency-dependent componentality of turbulence, i.e., the distribution of energy among the different velocity components, which is related to the polarization anisotropy Cambon1989 ; Morinishi2001 ; Delache2014 . This is not to be confused with the frequency-dependent dimensionality of turbulence, which compares the vertical and horizontal characteristic scales at a given frequency (described in section V).
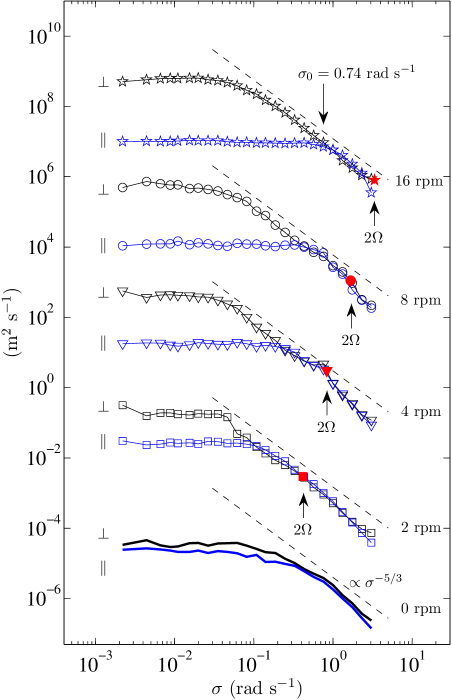
The temporal spectra and are shown in Fig. 4 for all rotation rates. Without rotation, energy is nearly equally distributed among the 3 velocity components (i.e., ). There is actually a slight over-representation of horizontal energy, a consequence of the forcing device geometry which preferentially injects energy in horizontal motions. As the rotation rate increases, the high frequencies remain nearly isotropic (iso-component), whereas the low frequencies become gradually anisotropic, with nearly flat and approaching a power law close to . This anisotropy is related to the fact that, as increases, the decorrelation frequency (i.e., the frequency below which the spectrum becomes flat) gets significantly smaller for the horizontal velocity () than for the vertical velocity (, increasing from to rad s-1 for from to rpm). For the largest rotation rate ( rpm), there is a clear range of frequencies over which the horizontal spectrum follows a -power-law. This range gets narrower for decreasing rotation rate .
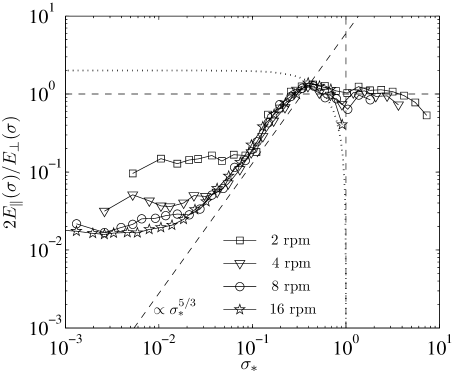
The decorrelation frequency of the vertical velocity appears to scale as , which becomes evident when plotting the ratio as a function of the normalized frequency (Fig. 5). In this figure, for , for which no inertial waves can exist, energy is nearly equally distributed among the velocity components (). The frequency range over which a power law is approached is bounded by the two decorrelation frequencies: on the left by and on the right by . Interestingly, we also observe a small frequency domain over which energy in the vertical component is slightly larger than in each horizontal component. Such a slight over-representation of the vertical velocity is compatible with the “componential” anisotropy of an assembly of linear inertial waves: a single plane inertial wave has a componential anisotropy (shown as a dotted line in Fig. 5), with a larger rms velocity along the vertical than along any horizontal direction for .
As can be seen in Fig. 2, for the experiment under rapid rotation, nearly 90% of the energy is contained in the 2D vortex mode. As discussed quantitatively in Campagne et al. Campagne2014 , this strong 2D nature of the flow drives an inverse cascade of energy for the horizontal velocity and a direct cascade of energy for the vertical velocity. The horizontal velocity consequently exhibits slow dynamics, while the vertical velocity fluctuations are found at higher frequencies (Fig. 4). This behavior is consistent with the usual phenomenology of rapidly rotating turbulence: the flow becomes approximately 2D at low-frequency, and the vertical velocity behaves as a passive scalar, which is stretched and folded by the horizontal velocity. This produces thin vertical layers swept by the horizontal flow, yielding rapidly changing time series of the vertical velocity. In a similar fashion, the -power-law of could originate from the stochastic sweeping by the large scale horizontal flow of a spatial spectrum, reminiscent of the inverse energy cascade of 2D turbulence.
V Spatio-temporal analysis
V.1 Spatio-temporal correlations
We now turn to a combined spatio-temporal analysis of the PIV time series, focusing on the signature of inertial waves in terms of dimensional anisotropy. This signature is sought here in terms of characteristic horizontal and vertical scales of the turbulent structures as a function of their frequency. For this, we define the frequency-dependent two-point spatial correlation of the temporal Fourier transform of the velocity field
| (7) |
with ∗ the complex conjugate (here again Welch’s method is used to improve convergence). Instead of the spectra considered in Refs. Clark2014 ; Yarom2014 , we compute spatial correlations, because the former are sensitive to finite size effects arising from the PIV field being of limited extent compared to the largest flow structures. The correlation (7) probes the energy distribution among vector separations for each frequency . Its angular average provides an estimate for the cumulative energy from scale to for turbulent motions of frequency . The single-point limit of this correlation is the temporal energy spectrum (4), i.e. .
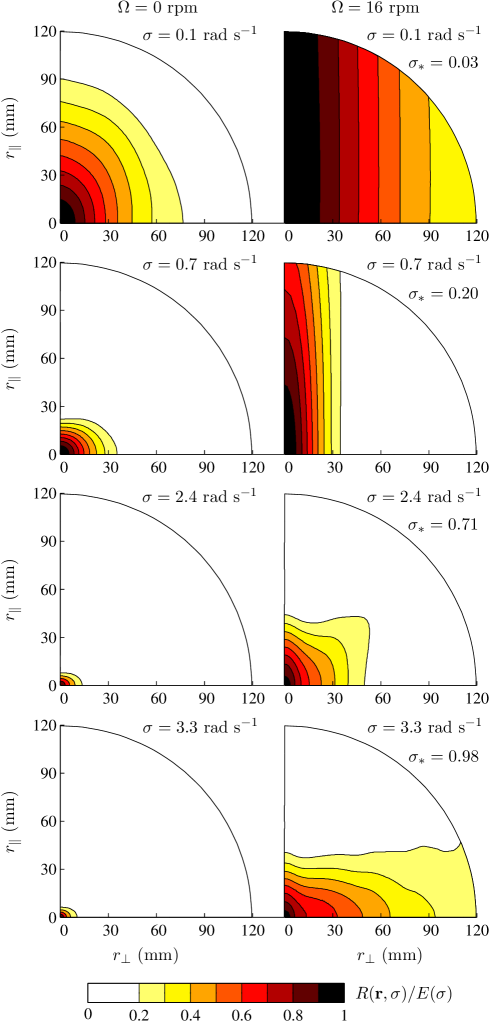
Maps of the normalized correlation are plotted in Fig. 6 for and 16 rpm at four selected angular frequencies . In the non-rotating case, the iso- lines are approximately circular at all scales and frequencies, indicating the overall isotropy of turbulence. The strongly peaked correlation that develops around as increases indicates that rapid turbulent fluctuations are found at small scales only. In the rotating case, the iso- lines evolve gradually from quasi-vertical at small frequency (“cigar” anisotropy) to more horizontal for (“pancake” anisotropy), with the normalized frequency. The “cigar” anisotropy observed at is consistent with the 2D3C vertical invariance predicted by the Taylor-Proudman theorem for vanishing frequency: it corresponds to the zero-frequency limit of Eq. (1) for nearly horizontal wave vector. Similarly, the tendency towards “pancake” anisotropy, observed for and sufficiently large , is consistent with the nearly vertical wave vector limit of Eq. (1).
A natural way to characterize the frequency-dependent anisotropy would be to compute integral scales along and normal to the rotation axis at each frequency. Here we consider a finer approach, which also takes into account the scale-dependence of this anisotropy: for each frequency and horizontal scale , we identify the vertical scale at which the correlation along the vertical axis is equal to the one at , i.e. such that . In practice, we compute as the vertical semi-axis obtained from the fit of the iso- line defined by with an ellipse of prescribed horizontal semi-axis . This method allows us to filter out the noise in the iso- lines at small . It also extends the analysis to values of larger than the PIV field height ( mm), which is useful at small for nearly vertically invariant . Poor fits defined by a correlation coefficient less than 0.9 or such that is larger than are discarded. We finally define the scale and frequency dependent anisotropy factor as
| (8) |
It is equal to for isotropic turbulence, to for vertically invariant (2D3C) turbulence, and to for horizontally invariant (1D2C) turbulence.
If the anisotropy of the two-point correlation at frequency is governed by linear inertial waves, we expect to be independent of the scale, and to be set by the dispersion relation (1). A simple estimate, assuming that the wave vector is in the vertical measurement plane and identifying on dimensional grounds and , yields a frequency-dependent anisotropy factor . Considering now an assembly of inertial waves with an axisymmetric wavevector distribution, an analytic computation (given in the Appendix) leads to a very similar result,
| (9) |
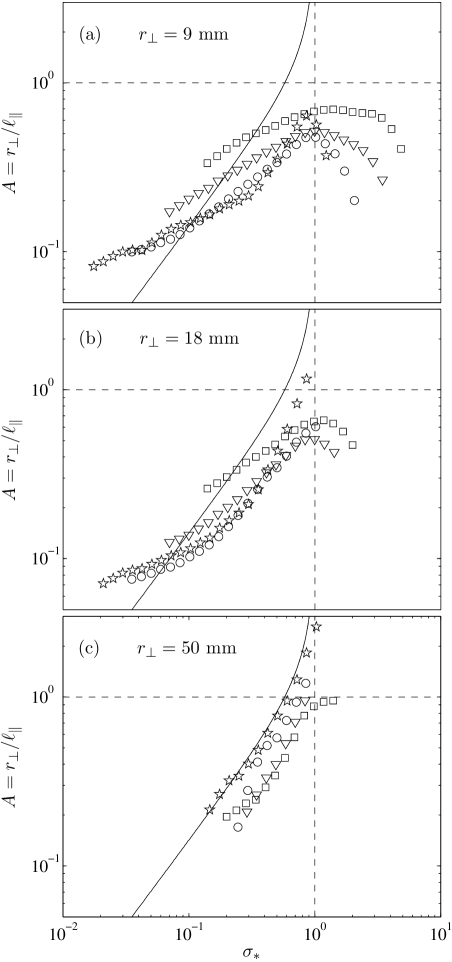
In Figs. 7 (a-c), we compare the anisotropy factor measured in the four rotating experiments to the inertial-wave prediction (9) at three horizontal scales , and mm. For all scales and , is an increasing function of , confirming that slow fluctuations are more vertically elongated than fast fluctuations. We find that the inertial-wave prediction (9) provides a good description of the data at large horizontal scales and large rotation rate. For such large scales ( mm), the anisotropy factor is no longer accessible for because it corresponds to much larger than the height of the PIV field. On the other hand, at smaller horizontal scale the prediction (9) fails, with small frequencies more isotropic than predicted by the inertial-wave argument.
Because of the moderate Reynolds and Rossby numbers of the present experiment, two effects may be considered to explain why large scales follow the inertial-wave prediction whereas small scales do not: viscous damping and sweeping of small scales by the velocity at larger scales. Viscosity introduces an imaginary term in the dispersion relation (1) without modifying its real part. Waves such that are therefore damped, with a viscous cutoff. This viscous cutoff is of order of 1 to 10 mm for the normalized frequencies in the range considered in Fig. 5. However, since viscous damping affects the wave amplitude without modifying the wave vector components, its should not affect the anisotropy. We therefore focus in the following on the sweeping effect.
V.2 Sweeping effect
Sweeping corresponds to the advection of the waves by the large-scale flow, which leads to a modification of their apparent frequency. An inertial wave propagating in a time-independent uniform flow has a Doppler-shifted frequency,
| (10) |
where is the intrinsic frequency given by (1), and is the frequency at which the wave is detected in the frame of the rotating tank. In our experiment, the energetic large-scale 2D flow may be thought of locally as a uniform sweeping flow that evolves slowly in time, inducing a scrambling of the waves’ spatio-temporal signature. An order of magnitude of the typical Doppler-shift can be estimated by , where is the root-mean-square horizontal velocity. A key difference between equations (10) and (1) is that the frequency now depends on the magnitude of , with small-scale waves more affected by sweeping.
For an ensemble of inertial waves with axisymmetric wavevector statistics, the intrinsic frequency can be related to the anisotropy through Eq. (9). Subsituting the corresponding expression into (10) and estimating the Doppler-shift term on dimensional grounds, we obtain
| (11) |
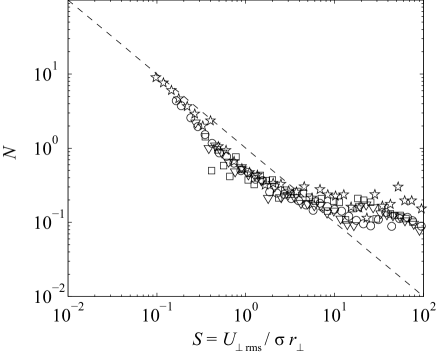
where is a constant of order unity. This indicates that the parameter
| (12) |
should be a unique function of the sweeping parameter . corresponds approximately to the intrinsic frequency of inertial waves rescaled by the advective time , whereas is the observed period of the waves, rescaled by the same advective time.
Figure 8 confirms this picture: the data for different values of , and collapse onto a master curve . This collapse indicates that sweeping is indeed responsible for the departure from the inertial wave prediction at small frequencies and/or small scales. The expected asymptotic behavior for small sweeping parameter is , which corresponds to the prediction (9) for an axisymmetric ensemble of non-swept inertial waves. The data is in quantitative agreement with this small- prediction, shown as a dashed line in figure 8. For large , equation (11) indicates that should asymptote to a constant value , which again is compatible with the data.
The master curve in figure 8 has the following simple interpretation: high-frequency or large-scale waves are hardly affected by sweeping. The Doppler-shift term is negligible compared to their intrinsic frequency, and their location in a space-time energy distribution is given by the dispersion relation (1). This is the low- behavior in figure 8.
By contrast, when focusing on low frequencies or small-scales in the frame of the tank, one measures the inertial waves with intrinsic frequency , but one also detects many waves with that are Doppler-shifted back to frequency by the advective term in (10). The anisotropy measured at low-frequency therefore results from strongly swept inertial waves with various intrinsic frequencies, and the information from the dispersion relation (1) is lost in the space-time correlation. The limit corresponds to frequencies that are much lower than the inverse advective time. In this limit, one detects mostly waves with that are Doppler-shifted by the horizontal flow in such a way that they are almost steady in the frame of the tank: this is a -independent regime that corresponds to the large- plateau in figure 8.
VI Conclusion
In the present experiment, the anisotropy of the turbulent energy distribution at a given spatio-temporal scale is well-described by the inertial-wave dispersion relation at high-frequency and/or large-scale only. The smaller-scale waves are subject to intense sweeping by large-scale turbulent motions contained predominantly in the 2D “vortex” mode. This conclusion is compatible with the numerical findings of Clark di Leoni et al. Clark2014 , who also identify the sweeping time scale as the relevant decorrelation time at small scale.
Such sweeping by the 2D mode has strong implications for wave-turbulence theories. Indeed, most waves do not follow the inertial-wave dispersion relation, and the assumptions of weak turbulence theory break down even at the linear stage in wave amplitude: instead of the dispersion relation (1), the linear problem consists in determining the evolution of waves embedded in a turbulent 2D flow. This is a formidable task in general, because the 2D flow is space- and time-dependent: in the discussion of our data, we simplified the problem by assuming that the 2D flow is at much larger scales and slower frequencies than the waves, therefore including it as a simple Doppler-shift term in the dispersion relation.
We conclude with a discussion on the dimensionality of the forcing. In the present experiment, the flow is driven by vertically invariant flaps: such a quasi-2D forcing device enhances two-dimensionalization and the resulting sweeping of the 3D flow structures. Nevertheless, accumulation of energy in the 2D mode is a robust feature of rotating turbulence, that takes place for arbitrary forcing geometry, even if the forcing does not input energy directly into the 2D mode. A careful and extensive numerical study of this issue has been recently reported for the fully-3D Taylor-Green forcing Alexakis : for rapid global rotation and low viscosity, energy accumulates in the 2D mode until the Rossby number based on the velocity of this 2D flow is of order unity. If these findings are confirmed, the sweeping of the most energetic 3D structures would be an inevitable outcome of this accumulation of 2D energy.
Acknowledgements.
We acknowledge P. Augier, P. Billant and J.-M. Chomaz for kindly providing the flap apparatus, and A. Aubertin, L. Auffray, C. Borget and R. Pidoux for their experimental help. This work is supported by the ANR grant no. 2011-BS04-006-01 “ONLITUR”. B.G. acknowledges support from Labex PALM. F.M. acknowledges the Institut Universitaire de France.Appendix A Anisotropy factor for a statistically axisymmetric distribution of inertial waves
We compute the anisotropy factor for an ensemble of independent plane inertial waves, with axisymmetric wave vector statistics. The temporal Fourier transform of the velocity field reads
| (13) |
where is the space-time Fourier amplitude of the velocity field at wave number and frequency . The two-point velocity correlation at frequency (7) can be written
| (14) | |||||
where is the space average, and is a separation vector inside the PIV plane. Introducing spherical coordinates with vertical polar axis, we denote the azimuthal angle between and the vertical PIV plane. The argument of the cosine becomes
| (15) |
Let us first consider an ensemble of inertial waves having the same wavenumber, . For a given reduced frequency , the dispersion relation determines the ratio , and because of statistical axisymmetry is independent of . The spatial correlation at frequency becomes
| (16) | |||||
where is the Bessel function of the first kind and is a prefactor proportional to the squared amplitude of the waves at wavenumber and frequency .
For a given frequency and horizontal scale , the vertical scale is determined from the isolines constant in the plane. An isoline of starting on the horizontal axis at intersects the vertical axis at . According to expression (16), such isolines connecting the two axes exist provided the argument of the Bessel function is smaller than the first zero of this function, i.e.,
| (17) |
where (). Equating expression (16) computed for and for leads to
| (18) |
and an anisotropy factor
| (19) |
This anisotropy factor depends very weakly on : it is minimum for low , where Taylor expansion for leads to
| (20) |
whereas it is maximum for the maximum value of allowed by (17), which gives
| (21) |
Because the numerical prefactors in (20) and (21) differ by less than , we can say that the anisotropy factor of this statistically axisymmetric distribution of inertial waves is given by expression (20) within accuracy. Because this anisotropy factor is almost independent of , we finally expect it to be approximately given by expression (20) for a realistic superposition of inertial waves with different wave numbers .
References
- (1) P.A. Davidson, Turbulence in rotating, stratified and electrically conducting fluids (Cambridge University Press, Cambridge, 2013).
- (2) S. Chen and R.H. Kraichnan, Phys. Fluids A 1 (12), 2019–24 (1989).
- (3) T. Sanada and V. Shanmugasundaram, Phys. Fluids A 4 (6) ,1245–50 (1992).
- (4) V. Zakharov, V. L’vov and G. Falkovich, Wave Turbulence (Springer, Berlin, 1992).
- (5) S. Nazarenko, Wave Turbulence (Springer-Verlag, Berlin, 2011).
- (6) H. Greenspan, The theory of rotating fluids (Cambridge University Press, 1968).
- (7) E.J. Hopfinger, F.K. Browand, and Y. Gagne, J. Fluid Mech. 125, 505 (1982).
- (8) L. Jacquin, O. Leuchter, C. Cambon, and J. Mathieu, J. Fluid Mech. 220, 1 (1990).
- (9) P. Bartello, O. Métais, and M. Lesieur, J. Fluid Mech. 273, 1 (1994).
- (10) F. Moisy, C. Morize, M. Rabaud, and J. Sommeria, J. Fluid Mech. 666, 5 (2011).
- (11) F.S. Godeferd and F. Moisy, Applied Mechanics Reviews 67, 030802 (2015).
- (12) Y. Morinishi, K. Nakabayashi, and S.Q. Ren, Phys. Fluids 13(10), 2912 (2001).
- (13) P.D. Mininni, A. Alexakis, A. Pouquet, Phys. Fluids 21, 015108 (2009).
- (14) C. Lamriben, P.-P. Cortet, and F. Moisy, Phys. Rev. Lett. 107, 024503 (2011).
- (15) A. Delache, C. Cambon, and F. Godeferd, Phys. Fluids 26, 025104 (2014).
- (16) C. Cambon and L. Jacquin, J. Fluid Mech. 202, 295 (1989).
- (17) F. Waleffe, Phys. Fluids A 5, 677 (1993).
- (18) G. Bordes, F. Moisy, T. Dauxois, P.-P. Cortet, Phys. Fluids 24, 014105 (2012).
- (19) L.M. Smith and F. Waleffe, Phys. Fluids 11, 1608 (1999).
- (20) C.N. Baroud, B.B. Plapp, Z.-S. She, and H.L. Swinney, Phys. Rev. Lett. 88, 114501 (2002).
- (21) C. Morize, F. Moisy, and M. Rabaud, Phys. Fluids 17, 095105 (2005).
- (22) Q. Chen, S. Chen, G.L. Eyink, and D.D. Holm, J. Fluid Mech. 542, 139 (2005).
- (23) A. Sen, P.D. Mininni, D. Rosenberg, and A. Pouquet, Phys. Rev. E 86, 036319 (2012).
- (24) E. Yarom, Y. Vardi, and E. Sharon, Phys. Fluids 25, 085105 (2013).
- (25) E. Deusebio, G. Boffetta, E. Lindborg, and S. Musacchio, Phys. Rev. E 90, 023005 (2014).
- (26) A. Campagne, B. Gallet, F. Moisy, and P.-P. Cortet, Phys. Fluids 26, 125112 (2014).
- (27) L. M. Smith and Y. Lee, J. Fluid Mech. 535, 111 (2005).
- (28) L. Bourouiba and P. Bartello, J. Fluid Mech. 587, 139 (2007).
- (29) L. Bourouiba, D.N. Straube, and M.L. Waite, J. Fluid Mech. 690, 129 (2012).
- (30) R. Kraichnan, Phys. Fluids 10, 1417 (1967).
- (31) P. Tabeling, Physics Reports 362, 1 (2002).
- (32) S. Galtier, Phys. Rev. E 68, 015301 (2003).
- (33) C. Cambon, R. Rubinstein, and F.S. Godeferd, New J. Phys. 6, 73 (2004).
- (34) J. Pedlosky, Geophysical Fluid Dynamics (Springer-Verlag, Heidelberg, 1987).
- (35) M. Berhanu and E. Falcon, Phys. Rev. E 87, 033003 (2013).
- (36) A. Boudaoud, O. Cadot, B.T. Odille and C. Touzé, Phys. Rev. Lett. 100, 234504 (2008).
- (37) N. Mordant, Phys. Rev. Lett. 100, 234505 (2008).
- (38) P. Clark di Leoni, P.J. Cobelli, P.D. Mininni, P. Dmitruk, and W.H. Matthaeus, Phys. Fluids. 26, 035106 (2014).
- (39) E. Yarom and E. Sharon, Nature Physics 10, 510-514 (2014).
- (40) B. Favier, F. S. Godeferd and C. Cambon, Phys. Fluids 22 (1), 015101 (2010).
- (41) B. Gallet, A. Campagne, P.-P. Cortet, and F. Moisy, Phys. Fluids 26, 035108 (2014).
- (42) P. Billant and J.-M. Chomaz, J. Fluid Mech. 418, 167 (2000).
- (43) P. Augier, P. Billant, M.E. Negretti, and J.-M. Chomaz, Phys. Fluids. 26, 046603 (2014).
- (44) DaVis, LaVision GmbH, Anna-Vandenhoeck-Ring 19, Goettingen, Germany.
- (45) F. Moisy, PIVMat toolbox for Matlab, http://www.fast.u-psud.fr/pivmat
- (46) P.D. Welch, IEEE trans. audio electroacoustics 15, 70 (1967).
-
(47)
A. Alexakis,
J. Fluid Mech. 769, 46 (2014).