Has a ”” Signal in p+p Reactions been Observed Yet?
Abstract
Our answer to the question posed in the title is: probably no. In this work we show that it is rather unlikely that the structure reported by the DISTO collaboration corresponds to a kaonic nuclear bound state. The main argumentation is based on the repetition of the DISTO analysis on the HADES data sample, containing p+p reactions at 3.5 GeV. We further discuss many aspects in connection with the final state and the -resonance. The results evidence possible problematics in the interpretation of the DISTO data.
pacs:
13.75.JzI The final state in p+p reactions
Since the first measurement of open strangeness production via the reaction
| (1) |
has been reported Cool et al. (1957), many experiments have exclusively measured this final state. Three issues were mainly investigated thereby: the production of N∗ resonances and their subsequent decay into Bierman et al. (1966); Chinowsky et al. (1968); Firebaugh et al. (1968); Baksay et al. (1976); Cleland et al. (1984); Abdel-Samad et al. (2006); Abd El-Samad et al. (2010); Abdel-Bary et al. (2010); Agakishiev et al. (2015), the final state interaction Sibirtsev et al. (2006); Abdel-Samad et al. (2006); Budzanowski et al. (2010a); Röder et al. (2013), and the cusp structure appearing at 2.13 GeV in the invariant mass distribution Siebert et al. (1994); Budzanowski et al. (2010b); Abd El-Samad et al. (2013). A fourth aspect was recently added to this list with the investigation of the kaonic nuclear bound state by the DISTO collaboration Yamazaki et al. (2010); Maggiora et al. (2010). In this analysis the following scenario has been investigated
| (2) | ||||
Here, a kaonic nuclear bound state , also called ””, is produced in p+p reactions together with a K+, and its non-mesonic decay in a pair has been considered. The aim of this work is to cross-check the claim that the observed structure (named , M=2267 MeV/c2 and =118 MeV) in a so-called deviation spectrum of Refs. Yamazaki et al. (2010); Maggiora et al. (2010) corresponds to the signature of an intermediate cluster to the final state (1).
In the following, we will explain what a deviation spectrum is, what difficulties arise from this method and why the absence of at lower beam energies is not linked to the absence of production - which is considered as a doorway for the formation of a Yamazaki and Akaishi (2002, 2007). We will further discuss whether a production strength of 17% of the total production cross section at EKin=2.85 GeV, as reported in Ref. Kienle et al. (2012), is a realistic scenario, given the upper limits for from Ref. Kienle et al. (2012) and this work. The discussion is completed by summarizing all mass spectra published so far where no clear signature of or any other kind of ”” signal is visible.
II The 2.5 GeV and 2.85 GeV discrepancy
After the publication of the DISTO results on the formation of a ”” in p+p reactions at a beam kinetic energy of 2.85 GeV Yamazaki et al. (2010); Maggiora et al. (2010), the same authors have analyzed also a data set measured by DISTO at a beam kinetic energy of 2.5 GeV Kienle et al. (2012). Despite the expectation, that as much as 33% of the observed yield of the structure at 2.85 GeV should be visible also at the lower beam energy of 2.5 GeV, no signal appeared in the data. Therefore, an upper limit of 0.22.1% of the production cross section was estimated Kienle et al. (2012).
II.1 The depletion of the yield
The missing signature of at 2.5 GeV was explained by the lower abundance of the -resonance at this energy which is, according to Refs. Yamazaki and Akaishi (2002, 2007), a doorway for the formation of the in p+p reactions 111In this view the , being partially a -bound state, forms together with a proton a by final state interaction.. The abundance of the -resonance was, however, only roughly estimated on the base of the missing mass distribution to the proton and () at 2.85 GeV and 2.5 GeV. In this approach the high mass region of the spectra, which includes among others the contributions by the and , was considered and the production at 2.5 GeV was estimated to be maximally 10% as for the data set at 2.85 GeV Kienle et al. (2012). This estimation assumed that first, the statistic in the resonance region of the spectrum contains only the resonances and , and second, that the to production ratio is the same for the two energies. The first assumption was disproven by the investigation of the resonance at a beam energy of 3.5 GeV Agakishiev et al. (2013). Indeed in the latter work the individual contributions to the spectrum were determined and it was found that a substantial contribution stems from the production of the , , and final states. While the production is below threshold at 2.5 GeV ((Threshold) = 2.77 GeV) and probably small at 2.85 GeV, the other two final states will definitely contribute to the observed yield in the high mass region of the , spectra measured by DISTO. The second assumption about a constant to production ratio is also questionable as the analysis in Ref. Epple and Fabbietti (2012) showed that at 3.5 GeV this ratio is reduced by about 15% in comparison to the ratio measured by the ANKE collaboration at =2.83 GeV Zychor et al. (2008). Both values have, however, large uncertainties so that it is difficult to extrapolate to lower energies.
We suggest an alternative ansatz to compare the production cross section at the two DISTO energies. In Ref. Agakishiev et al. (2013) the energy dependence of the production cross section of the final state was determined on the base of the values measured in p+p collisions Agakishiev et al. (2013); Zychor et al. (2008). Figure 1 shows a compilation of measured cross sections from the and final states versus the excess energy. The two vertical dashed lines mark the excess energy for the production for the two data sets, measured by DISTO (48.8 MeV and 161.2 MeV). The data are well described by a Fäldt and Wilkin parametrisation as done in Refs. Abdel-Bary et al. (2010); Faldt and Wilkin (1997). By assuming a similar behavior of the two channels close to threshold, we have scaled the curve down so that it fits the data points of the final state (long-dashed curve). We did also perform a free fit of the mentioned parametrisation from Refs. Abdel-Bary et al. (2010); Faldt and Wilkin (1997) to the two data points which also describes them well (dotted curve).
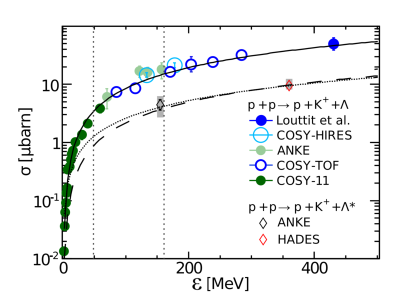
With help of the two curves the ratio of the production cross section between the two DISTO energies was determined to be /=0.23, for the scaled curve and 0.3 for the curve based on the free fit to the data. The ratios show that the cross section of production at the 2.5 GeV data set is in any case a sizable fraction of that at 2.85 GeV. Following the assumption that the production in p+p collision should proceed through the intermediate formation of a , at least 23% of the observed yield at 2.85 GeV should be expected at the lower energy.
In fact, the fraction of events affected by the final state interaction should be even higher at lower energies due to phase space considerations Sibirtsev et al. (2006). Provided that the hypothesis of the being a doorway for the creation of ”” is valid, that would result in an increased number of per .
We, thus, argue that the reasoning in Ref. Kienle et al. (2012) regarding the absence of a signal at the 2.5 GeV DISTO data is not convincing as the yield at lower energies is larger than estimated by the authors.
II.2 The problematic of deviation spectra
To provide a further cross check of the reported results by the DISTO collaboration, we have repeated the analysis of Refs. Yamazaki et al. (2010); Maggiora et al. (2010); Kienle et al. (2012) and produced so-called deviation spectra. The original idea behind this approach was that any measured event distribution in a given observable which deviates from a purely phase space driven production process hints to the presence of a new signal. The deviation spectrum is obtained by dividing the experimental event distribution of an observable by the same simulated distribution obtained by employing phase space simulations of the final state.
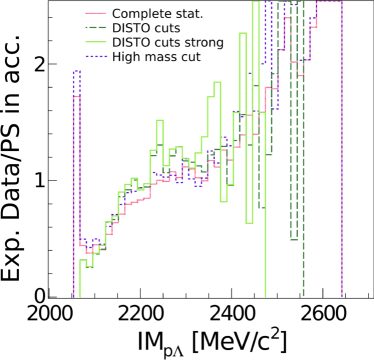
The data for this analysis Epple (2012); Fabbietti et al. (2013); Epple (2014); Agakishiev et al. (2015) stem from the p(EKin=3.5 GeV)+p reaction measured by the high-acceptance di-electron spectrometer (HADES) at the SIS18 synchrotron (GSI Helmholtzzentrum in Darmstadt, Germany). For details about the spectrometer and the experiment see Refs. Agakishiev et al. (2009, 2015). The in the following discussed deviation spectra were obtained by dividing the measured event distribution of the invariant mass distribution of p--pairs () by the according simulated spectrum. The simulations were performed under the assumption that the three particles in the final state (1) are produced via phase space only. The division is performed with measured spectra which means that the data are shown inside of the HADES acceptance and are filtered by the event selection procedure. As the statistic was obtained within two different regions of the spectrometer acceptance (HADES and WALL, see Ref. Agakishiev et al. (2015) for details) we present two different deviation spectra in Figs. 2 and 3, respectively.
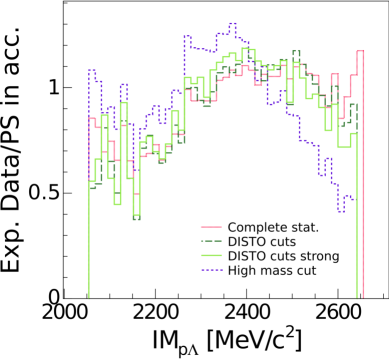
The two figures show several deviation spectra obtained under different data selections. While the red histograms show the deviation spectra for the full statistics as analysed in Agakishiev et al. (2015), the long-dashed histogram represents the result after applying the very same cuts as done in the analysis by DISTO: 0.6 and -0.20.4 Yamazaki et al. (2010); Maggiora et al. (2010). To point out the impact of such subsequent cuts, we have further restricted the proton angle from 0.6 to 0.4, while leaving the cut for the kaons unchanged; this is illustrated by the green histograms. An remarkable result (violet dashed in Fig. 2) is obtained if one only selects events where 1810 MeV/c2.
Before interpreting these spectra it has to be noted that: first, it was shown already that phase space production is not a suited model to describe the final state at a beam energy of 3.5 GeV Epple (2012); Fabbietti et al. (2013), so we do a priori not expect to retrieve a flat deviation spectrum from this method and secondly, most importantly, if the data are not described well by the simulation any further applied cut might have different influence on the measured and the simulated spectra. This is the reason why the deviation spectra drastically change under different cut conditions. One can see, in particular for the HADES case, that the applied cuts start to deplete the deviation spectra from 2500 MeV/c2 on. As a consequence, one obtains a deviation spectrum with a rising slope up to 2400 MeV/c2 and a fall off for larger masses. This spectrum could be seen as broad peak structure, but it reflects only the effect of the kinematical cuts. Such an effect is as well observed for the WALL data-set in Figure 3, where the green dashed histogram shows a small structure at 2250 MeV/c2.
In order to clarify these observations we want to present deviation spectra that we have obtained by dividing the measured spectra by a partial wave analysis model Anisovich and Sarantsev (2006); Anisovich et al. (2007). This model is based on a partial wave analysis of the measured data Agakishiev et al. (2015) and was compared to the measured events in many observables to gain confidence in the solidness of its data description. The deviation spectra in Figure 4 are shown under the very same cut conditions as for the spectra with the phase space
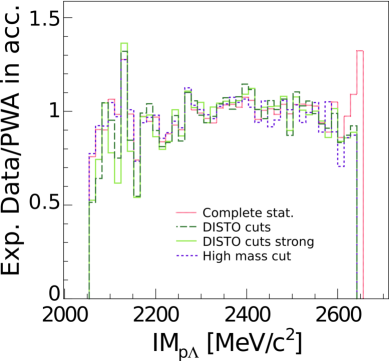
simulations. In contrast to the Figs. 2 and 3, the deviation spectra are in this case rather flat around one and the shape does not change when additional cuts are applied. This is entirely due to the correct description of the data by the PWA Agakishiev et al. (2015) so that the applied cuts, therefore, act symmetrically on the data and the model.
Summarizing, we have shown that deviation spectra strongly depend on the model to which the data are compared to. If the simulation model is not fully adequate, the applied cuts may distort the deviation spectrum drastically and no reliable conclusions can be drawn. We thus consider this method as suboptimal to look for peak structures. From our perspective it is, thus, not astonishing that a certain structure at 2.85 GeV can not be retrieved at the 2.5 GeV DISTO data set.
III Deviation Spectra Revisited
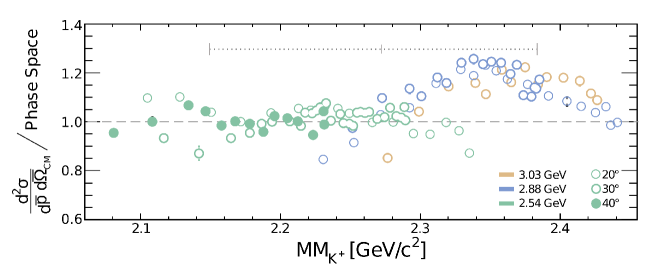
We want to extend our discussion on deviation spectra to other energies. Indeed, the idea of comparing phase space simulation to experimental data for the Reaction (1) dates back to Ref. Hogan et al. (1968). There inclusive spectra of the missing mass to the kaon were divided by phase space distributions at different kaon angles and beam kinetic energies. The result of Hogan et al. (1968) is shown in Figure 5. The deviation spectrum differs from unity in the high missing mass region (the missing mass to the kaon (MM) corresponds to the mass of the residue X with which it is produced, e.g. X= or ). The horizontal gray line indicates the signal range of . No deviation at =2267 MeV/c2 is visible in these data sets. Indeed, the authors of Ref. Hogan et al. (1968) have investigated the deviations in Figure 5 under the assumption of a di-baryon being produced together with the kaon. They have, however, also considered the fact that the presence of N∗ resonances in the data might cause the observed deviations from phase space, as was already suggested by an earlier work Bierman et al. (1966).
IV Any Signs of a Large Visible Signal?
Since no signal at the 2.5 GeV DISTO data has been found, an upper limit for its production strength of 0.22.1% of the total production cross section has been estimated Kienle et al. (2012). An independent analysis of p+p data measured by HADES has also set an upper limit on the production of a in p+p reactions at =3.5 GeV Agakishiev et al. (2015). The major difference between the DISTO and the HADES analysis is that in the former case visible bumps in the invariant mass spectrum were associated to a signal, while the latter analysis is done with help of a partial wave analysis (PWA) Anisovich and Sarantsev (2006); Anisovich et al. (2007). In the PWA the amplitude strength of a wave associated to the production of a kaonic nuclear bound state was determined and coherently added to all other contributing waves. These two different approaches prevent, however, a direct comparison of the signal strength and the upper limits. In the best case, a partial wave analysis would be performed on the three data sets simultaneously. For the time being, we have performed a simple incoherent analysis of the data to extract the upper limit of a visible signal strength, in order to be able to compare it consistently to the DISTO results. Such an extracted limit does not necessarily correspond to the real signal strength which is maximally compatible with the data, as interferences with other signals are neglected in this approach.
IV.1 An incoherent upper limit for the production at 3.5 GeV
To carry out this analysis, we have used the acceptance corrected invariant mass spectrum. The PWA solution from Ref. Agakishiev et al. (2015) delivers a model that describes the experimental spectrum well without the inclusion of a cluster signal. Although the PWA analysis was performed within the detector acceptance, an extrapolation of the solution to the full solid angle is possible. This way, with help of the 4-model also the measured data can be corrected to the full solid angle Epple (2014). Figure 6 shows the reconstructed experimental data in 4 overlayed with the PWA solution.
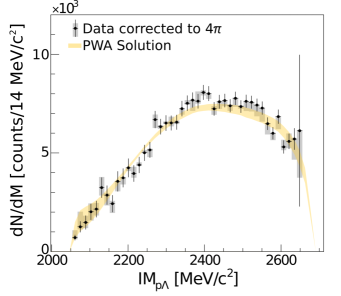
To extract an upper limit we have added a Breit-Wigner signal with varying mass, width, and amplitude to the PWA solution (signal hypothesis) and compared the new spectra to the data. We have considered the model compatible with the data, if the confidence level of the signal strength ( Junk (1999); Read (2000, 2002)) was smaller than 95%. Since there are small uncertainties from the acceptance correction (gray error bars in Fig. 6), the upper limit was determined four times. Each time the signal hypothesis was compared to the experimental data which were corrected with one of the four best PWA models of Ref. Agakishiev et al. (2015). The resulting upper limit, as a function of the mass of the bound state, is shown in Figure 7 for four different signal widths (30, 50, 70 and 90 MeV/c2). The width of the curves is due to the different upper limits obtained with the four different PWA models. The upper limit of about 0.7 b (in the relevant mass range) is below the coherent upper limit of the PWA of Ref. Agakishiev et al. (2015) which is consequential, as the interferences included in the PWA may hide the signal which makes it possible to include more signal strength while the spectra stay smooth.
We have also determined an upper limit specifically for the properties (M= 2267 MeV/c2, = 118 MeV/c2) which is 0.3-1 b depending on the PWA solution to which the signal is added.
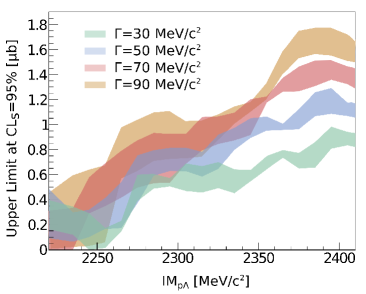
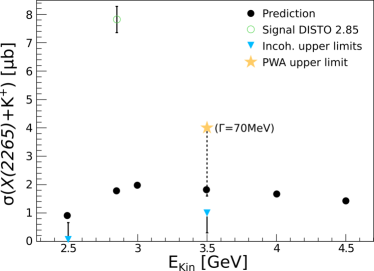
Figure 8 summarizes the observed yield at the DISTO energy of 2.85 GeV, the coherent upper limit from Ref. Agakishiev et al. (2015) at 3.5 GeV, the upper limit from the 2.5 GeV DISTO measurement, the here extracted upper limit from the 3.5 GeV HADES data set and the calculated prediction of a production cross section for the cluster of Ref. Suzuki et al. (2009). While the upper limits for a visible signal strength at 2.5 and 3.5 GeV lie apparently below the predictions of Ref. Suzuki et al. (2009) the DISTO value does exceed it by a factor of 4. No clear explanation for the excess with respect to the prediction at this specific energies was made available so far. This means in conclusion that either the cross sections for the production of has a very strong energy dependence or the observed structure is a non-physical signal.
IV.2 Qualitative Observations at Different p+p Beam Kinetic Energies
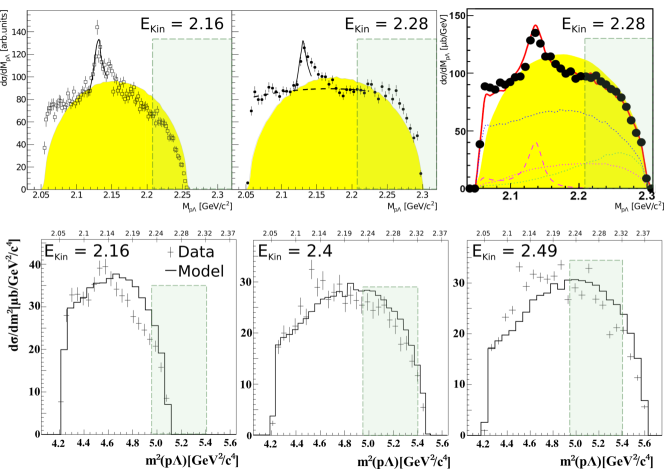
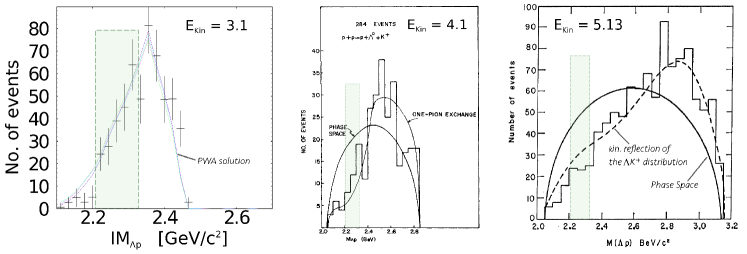
Besides the quantitative information discussed in the previous section there are several invariant mass spectra that have been published in the last years. Figures 9 and 10 contain a compilation of these spectra at various beam kinetic energies. For the production of a state with mass M=2265 MeV/c2 the threshold beam kinetic energy is =2.18 GeV. Given the large width of the signal it could also be produced at an energy of =2.16 GeV. If the hypothesis is true that a kaonic nuclear cluster is predominantly produced via the -doorway scenario Yamazaki and Akaishi (2002, 2007), the threshold for the production of a is =2.35 GeV (respecting the low mass of the in p+p collisions Agakishiev et al. (2013)).
The here collected spectra give only a qualitative impression of a potentially visible signal, but a strong deviation of the data from the according models in the region of the -signal (green box) is nevertheless not evident. It seems as if there is no hint for a strong visible signal of in any of the available data sets which means that if a signal is present its cross section can only be a small fraction of the total final state.
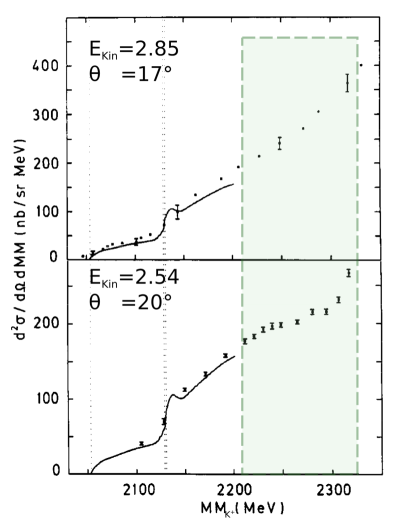
There are also other measurements at the same energy as the two DISTO data sets. Figure 11 shows the missing mass to the K+ Reed et al. (1968) (at 2.85 GeV, = 17∘) and Hogan et al. (1968) (2.54 GeV, = 20∘). The data exhibit no significant structure in the indicated signal range. One has to note, however, that these are inclusive spectra of the production of a residue together with a . can, depending on the available energy, be composed out of , , and . While in an exclusive analysis, as done in the DISTO and HADES cases, is identified with the system, in Fig. 11 all possible decay channels of the kaonic nuclear cluster ( and ) are summarized. This is on the one hand a disadvantage, as the background description for the sum of several channels is more difficult than in an exclusive analysis, on the other hand, however, this inclusive analysis would compensate for a small branching ratio of a in the channel and a signal would thus nevertheless appear in Fig. 11, if kaonic bound states were produced with a large cross section. Under the assumption of a smooth background underneath the signal this is obviously not the case for both data sets. So that also from this point of view it seems that a visible signal by a cluster is not present in the data.
There is one last data set at 2.83 GeV, taken by the ANKE collaboration, which contains exclusive events. Although a proposal had been set up for the analysis of the data with respect to the cluster Zychor (2008), it has not been pursued so far. These are probably the only data whose analysis can quickly resolve the question whether is due to a physical origin or not.
V Conclusions
We have summarized all available experimental measurements of p+p collisions relevant for the search of the lightest kaonic nuclear bound state ”” to cross check the hypothesis that the signal , reported by the DISTO collaboration, can be associated to a kaonic nuclear bound state . The signal is missing at low (2.85 GeV) and high (2.85 GeV) beam kinetic energies. Its absence can not be explained by a depletion of the yield as was explained with help of Figure 1. The upper limits for the production cross section of set at 2.5 and 3.5 GeV suggest that its contribution to the total production cross section is only a few percent.
The strongest argument against the argued nature of comes from the method with which the signal was extracted. The deviation spectrum technique to search for a new signal is not applicable, if the employed model is not under firm control and if the applied cuts arbitrarily influence the outcome of the spectra.
We do, thus, think that the structure is very unlikely to be due to a kaonic nuclear bound state. On the other hand, the extracted upper limits are still rather sizable and in the order of the predicted yield in Ref. Suzuki et al. (2009). This calls for new and high statistic experiments to measure the final state, possibly also employing polarization, and their subsequent analysis with modern techniques such as a partial wave analysis Agakishiev et al. (2015). The best data set so far for such an analysis is indeed the one measured by DISTO with 400.000 events (2.85 GeV). Given the fact that N* resonances do play a dominant role in the final state and given the fact that one data set is not enough to pursue a partial wave analysis with a unique solution as shown in Ref. Agakishiev et al. (2015), we call for a simultaneous analysis of all available data sets to finally pin down the issue of production in p+p collisions.
Acknowledgments
We kindly thank P. Piroue for providing us a nice version of Figure 5. This work has been supported by the following grants: DFG EClust 153, DFG FA 898/2-1, BMBF 05P12WOGHH and F&E-Vertrag TMLFRG1316.
References
- Cool et al. (1957) R. L. Cool, T. W. Morris, R. R. Rau, A. M. Thorndike, and W. L. Whittemore, Phys. Rev. 108, 1048 (1957).
- Bierman et al. (1966) E. Bierman, A. Colleraine, and U. Nauenberg, Phys. Rev. 147, 922 (1966).
- Chinowsky et al. (1968) W. Chinowsky et al., Phys. Rev. 165, 1466 (1968).
- Firebaugh et al. (1968) M. Firebaugh, G. Ascoli, E. Goldwasser, R. Sard, and J. Wray, Phys. Rev. 172, 1354 (1968).
- Baksay et al. (1976) L. Baksay et al., Phys. Lett. B 61, 405 (1976).
- Cleland et al. (1984) W. Cleland et al., Nucl. Phys. B 239, 27 (1984).
- Abdel-Samad et al. (2006) S. Abdel-Samad et al. (COSY-TOF Collaboration), Phys. Lett. B 632, 27 (2006).
- Abd El-Samad et al. (2010) S. Abd El-Samad et al. (TOF Collaboration), Phys. Lett. B 688, 142 (2010).
- Abdel-Bary et al. (2010) M. Abdel-Bary et al. (COSY-TOF Collaboration), Eur. Phys. J. A 46, 27 (2010).
- Agakishiev et al. (2015) G. Agakishiev et al. (HADES Collaboration), Phys. Lett. B 742, 242 (2015).
- Sibirtsev et al. (2006) A. Sibirtsev, J. Haidenbauer, H.-W. Hammer, and S. Krewald, Eur. Phys. J. A 27, 269 (2006).
- Budzanowski et al. (2010a) A. Budzanowski et al., Phys. Lett. B 687, 31 (2010a).
- Röder et al. (2013) M. Röder et al. (COSY-TOF), Eur. Phys. J. A 49, 157 (2013).
- Siebert et al. (1994) R. Siebert et al., Nucl. Phys. A 567, 819 (1994).
- Budzanowski et al. (2010b) A. Budzanowski et al. (COSY-HIRES Collaboration), Phys. Lett. B 692, 10 (2010b).
- Abd El-Samad et al. (2013) S. Abd El-Samad et al., Eur. Phys. J. A 49, 41 (2013).
- Yamazaki et al. (2010) T. Yamazaki et al., Phys. Rev. Lett. 104, 132502 (2010).
- Maggiora et al. (2010) M. Maggiora et al. (DISTO Collaboration), Nucl. Phys. A 835, 43 (2010).
- Yamazaki and Akaishi (2002) T. Yamazaki and Y. Akaishi, Phys. Lett. B 535, 70 (2002).
- Yamazaki and Akaishi (2007) T. Yamazaki and Y. Akaishi, Phys. Rev. C 76, 045201 (2007).
- Kienle et al. (2012) P. Kienle et al., Eur. Phys. J. A 48, 183 (2012).
- Note (1) In this view the , being partially a -bound state, forms together with a proton a by final state interaction.
- Agakishiev et al. (2013) G. Agakishiev et al. (HADES Collaboration), Phys. Rev. C 87, 025201 (2013).
- Epple and Fabbietti (2012) E. Epple and L. Fabbietti, Hyperfine Interact. 210, 45 (2012).
- Zychor et al. (2008) I. Zychor et al., Phys. Lett. B 660, 167 (2008).
- Faldt and Wilkin (1997) G. Faldt and C. Wilkin, Z. Phys. A 357, 241 (1997).
- Epple (2012) E. Epple (HADES Collaboration), PoS BORMIO2012, 016 (2012).
- Fabbietti et al. (2013) L. Fabbietti et al. (HADES Collaboration), Nucl. Phys. A 914, 60 (2013).
- Epple (2014) E. Epple (HADES Collaboration), EPJ Web Conf. 81, 02005 (2014).
- Agakishiev et al. (2009) G. Agakishiev et al. (HADES Collaboration), Eur. Phys. J. A 41, 243 (2009).
- Anisovich and Sarantsev (2006) A. Anisovich and A. Sarantsev, Eur. Phys. J. A 30, 427 (2006).
- Anisovich et al. (2007) A. Anisovich, V. Anisovich, E. Klempt, V. Nikonov, and A. Sarantsev, Eur. Phys. J. A 34, 129 (2007).
- Hogan et al. (1968) W. Hogan, P. Piroue, and A. Smith, Phys. Rev. 166, 1472 (1968).
- Junk (1999) T. Junk, Nucl. Instrum. Meth. A 434, 435 (1999).
- Read (2000) A. L. Read, CERN-OPEN-2000-205 (2000).
- Read (2002) A. L. Read, J. Phys. G 28, 2693 (2002).
- Suzuki et al. (2009) K. Suzuki et al. (FOPI Collaboration), Nucl. Phys. A 827, 312C (2009).
- Münzer (2015) R. Münzer (FOPI and HADES Collaboration), submitted to EPJ Web Conf. (2015).
- Reed et al. (1968) J. Reed et al., Phys. Rev. 168, 1495 (1968).
- Zychor (2008) I. Zychor, “Bound kaonic nuclear states with ANKECOSY,” http://collaborations.fz-juelich.de/ikp/anke/internal_notes/Zychor_report_kbs.pdf (21 November 2008).