Curvature Dependence of Hydrophobic Hydration Dynamics
Abstract
We investigate the curvature-dependence of water dynamics in the vicinity of hydrophobic spherical solutes using molecular dynamics simulations. For both, the lateral and perpendicular diffusivity as well as for H-bond kinetics of water in the first hydration shell, we find a non-monotonic solute-size dependence, exhibiting extrema close to the well-known structural crossover length scale for hydrophobic hydration. Additionally, we find an apparently anomalous diffusion for water moving parallel to the surface of small solutes, which, however, can be explained by topology effects. The intimate connection between solute curvature, water structure and dynamics has implications for our understanding of hydration dynamics at heterogeneous biomolecular surfaces.
One of the greatest advances in our understanding of the hydrophobic effect is the recognition that the hydration structure and thermodynamics of apolar solutes is qualitatively length scale dependent Chandler (2005); Lee et al. (1984); Honig et al. (1991); Lum et al. (1999); Huang et al. (2001); Huang and Chandler (2002); Rajamani et al. (2005); Ashbaugh and Pratt (2006); Pratt (2002); Djikaev and Ruckenstein (2013); Davis et al. (2012). The microscopic reason is that water structures very differently at small (convex) solutes, where the bulk H-bond network is only moderately deformed, as compared to large solutes, which significantly distort the tetrahedral bulk structure. The structural crossover happens at sub-nanometer length scales and has important implications for the interpretation of the structure and thermodynamics of hydrophobically-driven assembly processes Chandler (2005); Berne et al. (2009), such as protein folding and association Huang and Chandler (2000); Athawale et al. (2007); Li and Walker (2012).
The dynamics of the hydration layer that surrounds molecular self-assemblies and proteins in solution has attracted plentiful interest in the last decade Bagchi (2005). Solute fluctuations and hydration dynamics are understood to be highly coupled with important consequences to biological function, such as enzyme catalysis and molecular recognition in binding Bagchi (2005); Niehus et al. (2011); Kwon et al. (2010); Zhang et al. (2007); Pizzitutti et al. (2007); Fogarty and Laage (2014); Setny et al. (2013); Mittal and Hummer (2008); Vaikuntanathan and Geissler (2014); Patel et al. (2011); Jamadagni et al. (2011). Despite the obvious importance of the solute chemical composition, apparently the intrinsic topological and geometric features play an important role as well Zhang et al. (2007); Cheng and Rossky (1998); Pizzitutti et al. (2007); Fogarty and Laage (2014), possibly even leading to anomalous diffusion behavior Pizzitutti et al. (2007). Therefore, and due to the established fact that water considerably restructures at radii of curvature close to the sub-nanometer scale, a natural question to ask is, how does the water structural crossover affect the dynamics of the hydration layers in the solute vicinity?
One of the first simulation studies of curvature effects on hydration dynamics was performed by Chau et al. for three solute radii between 0.35 and 0.8 nm Chau et al. (1996). They found a slowdown of the diffusion of water in the first hydration shell relative to the bulk with an apparent minimum for the intermediate solute size. This interesting finding was not commented on, probably due to the little amount of data and statistical uncertainty of the results. Further, a slowdown of water reorientational dynamics was found compared to bulk, an effect that decreased with solute size Chau et al. (1996). The reorientational slowing-down has been recently explained by excluded-volume effects on the H-bond exchange dynamics Laage et al. (2009); N.Galamba (2014). In disagreement with the simulations with Chau et al., however, the excluded-volume concept predicts a monotonic increase of the reorientation times Laage et al. (2009), an apparent controversy which has not been addressed in literature, yet.
In this letter, we report on systematic molecular dynamics (MD) simulations of water around hydrophobic spherical model solutes of varying radius between 0.3 and 2.1 nm and investigate intrinsic curvature effects on water hydration dynamics. We find that the perpendicular and lateral diffusivity of hydration water exhibit a non-monotonic curvature dependence, with temperature-dependent minima located close to the structural crossover length scale Rajamani et al. (2005); Ashbaugh (2009). Both, curvature and temperature dependence, are strikingly similar to that of entropy during hydrophobic solvation Ashbaugh (2009) and thus allows strong conjecture that the hydrophobic effect extends beyond thermodynamic into dynamic anomalies. Furthermore, we find that the intriguing curvature dependence of the diffusivity is found to be related to a non-monotonic dependence of H-bond life times on curvature, exhibiting a maxima at the crossover length scale. This finding reconciles previous, apparently contradicting results from simulations Chau et al. (1996) and theory Laage et al. (2009); N.Galamba (2014) on reorientation times, as we find both predicted behaviors but in different length scale regimes. The intimate connection between solute curvature and water structure and dynamics should be of fundamental importance for biomolecular function mediated by heterogeneous biomolecular surfaces Bagchi (2005); Niehus et al. (2011); Zhang et al. (2007); Cheng and Rossky (1998); Pizzitutti et al. (2007); Fogarty and Laage (2014).
Our MD simulations are performed each containing a single and fixed hydrophobic model solute solvated in SPC/E water Berendsen et al. (1987) using the Gromacs simulation package Hess et al. (2008). The solute-water interaction is mediated by a shifted Lennard-Jones potential , whereas describes a coordinate shift by . With such a shifted potential, it is guaranteed that by changing the solute size only intrinsic curvature effects are probed, not, e.g., those of an additionally varying dispersion attraction.
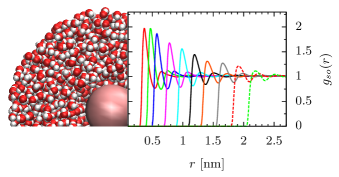
Values of Å and kJ/mol are chosen from a model for methane to mimic a reasonable dispersion attraction with a well-defined first solvation shell Huang and Chandler (2002). We choose shift radii , and in ten separate simulations. As a limiting case of a hydrophobic surface with zero curvature, the box delimiting walls in the -plane in a pseudo-2D simulation are chosen to interact with water by a 12-6 potential in -direction . After of Gibbs ensemble () equilibration, canonical () production runs are performed up to at a temperature of and with to 12000 water molecules. Further details on the simulation technique can be found in the Supporting Information (SI). A simulation snapshot and water oxygen density profiles around all the solutes are presented in Fig. 1.
We first characterize the water diffusion parallel to the solute surface. For this, we calculate the lateral mean square displacement (MSD) of the arc length a water oxygen has traveled in time , via
| (1) |
Here denotes the average distance of the water molecules inside the first hydration layer, which is delimited by the location of the first minimum in the RDF (cf. Fig.1), to the solute center. The time average over starting times is taken only in the first hydration shell. The variable is the azimuthal angle of the water oxygen-solute distance vector at time . For water molecules diffusing at a wall, Eq.(1) reduces to the usual two dimensional MSD in the -plane.
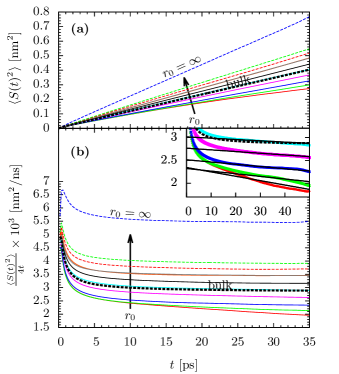
The lateral MSDs for water around all solutes are shown in Fig. 2(a) along with those of water at the planar hydrophobic surface and in bulk. Comparison to the bulk MSD indicates a crossover from below to above bulk water self-diffusion with increasing slopes with growing solute size. Additionally, the hydrating water of the smallest solutes exhibits non-linear, anomalous behavior in . This can be better recognized by the negative slope for small solutes in Fig. 2(b) where we plot the MSD divided by time, . Linearity of the MSDs is restored for larger solutes, converging towards the limiting MSD of the planar hydrophobic surface.
The apparently anomalous diffusion behavior for small solutes can be explained by intrinsic curvature effects, which modify the standard 2D diffusion law Gosh et al. (2012). Here, the probability distribution function (PDF) of diffusion on spherical surfaces reads
| (2) |
where , and is a normalization constant. By expanding Eq. (2) up to second order for small , we find that the second moment of the PDF can be written for small solutes as
| (3) |
On surfaces with high curvature () the second term on the r.h.s. of Eq. (3) slows down the MSD as found in our simulations. In the limit , this term vanishes and the MSD on planar surfaces, , is restored, consistent with the vanishing non-linearity as observed in Fig. 2.
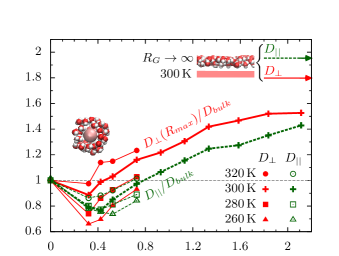
By fitting Eq. (3) to our MSDs, we obtain the lateral diffusion constant , see the inset in Fig. 2(b) for the fits. The results are plotted versus the Gibbs radius of the solutes in Fig. 3 at K normalized by bulk diffusion constant of water. For small solutes, we find that the parallel diffusion slows down with increasing solute sizes which leads to parallel mobilities smaller than in bulk. This trend changes at a minimum at a length scale of beyond which the lateral diffusivity monotonically rises with decreasing surface curvature to become bulk-like at about and finally saturates to a water mobility higher than in bulk, as well known for smooth and planar hydrophobic surfaces Kumar et al. (2005). The significant length scales observed here match well the structural crossover length scale of nm found for SPC/E water estimated from solvation free energies of spherical model solutes Rajamani et al. (2005).
To calculate the water diffusivity perpendicular to the hydrophobic surfaces, we employ the mean first-passage time (MFPT) analysis introduced by Hinczewski et al. Hinczewski et al. (2010); Seldmeier et al. (2011). The MFPT describes the mean time required by a molecule to travel from distance to the solute to a target distance and has an exact solution in a Smoluchowski description in terms of the free energy and diffusivity profile Weiss (1966). Its inversion leads to an expression for the perpendicular diffusivity profile Hinczewski et al. (2010); Seldmeier et al. (2011)
| (4) |
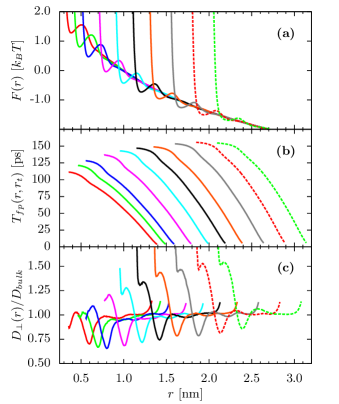
with and being a reflective boundary close to the solute where . From our MD simulations, we extract MFPTs as shown in the middle panel (b) of Fig. 4 along with free energy profiles in the upper panel (a). The latter result from a simple Boltzmann inversion of the solute-water RDFs plus the entropic contribution Seldmeier et al. (2011). The bottom panel (c) plots the resulting diffusivity profiles normalized by bulk diffusivity for all solute sizes. The general shape of the profiles describes a maximum inside the first solvation shell followed by a minimum in diffusivity which is reached at the outside margin of the solvation layer, whereafter diffusivity converges towards bulk diffusion in an oscillatory fashion. (The final rise of the profiles for radii close to the target distance is an artifact of non-Markovian contributions Hinczewski et al. (2010); Seldmeier et al. (2011), see also the SI for technical details.) In our calculated profiles, an interesting non-monotonic curvature dependence of the perpendicular water mobility near hydrophobic surfaces is visible in the extrema of the profiles. With growing solute size, the maximum of diffusivity in the first hydration shell continues to increase which leads to high perpendicular diffusivity in vicinity of weakly curved surfaces, whereas the minimum becomes less pronounced and almost vanishes in the profile at the planar limit (see SI).
We now define the perpendicular diffusion coefficient in the first hydration shell by the value of the diffusivity curve at , the position of the first peak of the RDF. The scaled value is presented next to the scaled values of in Fig. 3 versus solute size for K. Like , the perpendicular diffusivity also shows the crossover from below-to-above bulk mobility, but at a smaller distance of about 0.4 nm, indicating a preceding non-monotonic solute size dependence for small solutes as it is interpolated towards the limiting (bulk) case of a solute with vanishing radius. Since the magnitude of the perpendicular diffusivity slightly depends on the definition of what radius defines the first hydration shell, or if over all water molecules in this shell should be averaged, we compare those different definitions in the SI. We find similar values, in particular, all tested definitions rigorously reproduce the crossover from below-to-above bulk mobility behavior of water versus solute size close to the structural crossover length scale.
Additionally Fig. 3 plots diffusivity changes upon three different temperatures K, K and K at cavities at which the dynamic anomaly occurs. Decreasing temperature shifts the curves and the dynamic anomaly towards larger radii of curvature. Hence, the observed temperature dependence of diffusive dynamics obeys the same trend as the thermodynamic and structural crossover length scale Ashbaugh (2009). Taking into account entropy scaling laws for diffusion Rosenfeld (1977); Dzugutov (1996), which scale exponentially with excess entropy, suggests entropy to be a constitutive measure for the dynamic anomaly, thus firmly corroborating our conclusions.
Ultimately, water hydrogen bond (HB) kinetics and mobility are intimately linked because translational diffusion is accompanied by processes breaking, forming and re-forming HBs. The cooperation of elemental dynamic processes in water is successfully described with reaction-diffusion models Luzar and Chandler (1996); Luzar (2000); O.Markovitch and Agmon (2008) and was probed by simulations Luzar and Chandler (1996); Luzar (2000); O.Markovitch and Agmon (2008); Pereyra et al. (2012). Here, we probe HB lifetimes which are estimated by the correlation function of the HB operator , which is for a specific pair of water molecules while they are bonded, and otherwise Luzar and Chandler (1996); Luzar (2000); O.Markovitch and Agmon (2008). The negative derivative is the reactive flux hydrogen bond correlation function. We estimate ’intermittent’ HB lifetimes by the zero frequency part Luzar (2000), the integral of ,
| (5) |
It is significantly influenced by diffusion leading to the separation of initially bonded water molecule pairs after HB breaking. Without this separation, breaking a HB between two water molecules is reversible and the kinetics associated with this process are much faster than the irreversible rearrangements of the water hydrogen bond network analyzed here Luzar (2000). The correlation functions and details on the H-bond definition and numerical evaluation can be found in the SI.
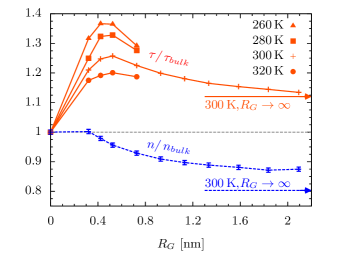
The results for scaled by their bulk value are plotted in Fig. 5. They exhibit a non-monotonic size dependence with a maximum retardation of about 25 versus bulk at roughly nm, close to the structural crossover length scale. After the maximum, the retardation decreases for solute sizes down to a remaining near the planar surface. Concurrently, the average number of HBs per water molecule , also shown in Fig. 5, decreases monotonically. Hence, the non-monotonic translational mobility behavior of water is solely reflected in the kinetic behavior of the HBs. The observed behavior reconciles previous, apparently contradicting results from simulations Chau et al. (1996) and theory Laage et al. (2009); N.Galamba (2014) on water reorientation times, as we find both predicted trends (increasing and decreasing life times), but in different solute size regimes, roughly separated by the important structural crossover scale.
Fig. 5 also plots the -dependence on the HB correlation times where a significant slowing down with decreasing temperature can be observed with not much change of the position of the maximum on the solute-size axis. We note that the latter behavior cannot be related one-to-one to our observed diffusivity behavior in (Fig 3) due to the multiple timescales entering (Luzar (2000) and SI).
In summary, we have established a firm link between structure and dynamics of hydration water around hydrophobic solutes with a novel dynamic anomaly happening at the well-know crossover length scale. Due to the fundamental importance of surface water to biomolecular processes and function Bagchi (2005); Jamadagni et al. (2011), in particular at topologically heterogeneous protein surfaces Zhang et al. (2007); Cheng and Rossky (1998); Pizzitutti et al. (2007); Fogarty and Laage (2014), our findings imply that nature has the means to employ local surface topology to mediate biological function. Hence, our results will help in the interpretation of experimentally found dynamic heterogeneities on biomolecular surfaces Bagchi (2005); Niehus et al. (2011); Kwon et al. (2010); Zhang et al. (2007); Pizzitutti et al. (2007); Fogarty and Laage (2014). Locally slowed down water, for instance, could thus fine-tune the folding kinetics of hydrophobic polymers and peptides Bagchi (2005) or may mediate the appropriate time scales for the association of ligands to catalytically active sites or binding pockets Bagchi (2005); Grossman et al. (2011); Setny et al. (2013).
Acknowledgements.
The authors thank Roland R. Netz for helpful discussions and the Deutsche Forschungsgemeinschaft (DFG) for financial support. M. Heyden is grateful for support by the Cluster of Excellence RESOLV (EXC 1069) funded by the Deutsche Forschungsgemeinschaft.References
- Chandler (2005) D. Chandler, Nature 437, 640 (2005).
- Lee et al. (1984) C. Y. Lee, J. A. McCammon, and P. J. Rossky, J. Chem. Phys. 80, 4448 (1984).
- Honig et al. (1991) A. Nicholls, K. A. Sharp, and B. Honig, PROTEINS: Struct. Funct. Gen. 11, 281 (1991).
- Lum et al. (1999) K. Lum, D. Chandler, and J. D. Weeks, J. Phys. Chem. B 103, 4570 (1999).
- Huang et al. (2001) D. M. Huang, P. L. Geissler, and D. Chandler, J. Phys. Chem. B 105, 6704 (2001).
- Huang and Chandler (2002) D. M. Huang and D. Chandler, J. Phys. Chem. B 106, 2047 (2002).
- Rajamani et al. (2005) S. Rajamani, T. M. Truskett, and S. Garde, Proc. Natl. Acad. Sci. (USA) 102, 9475 (2005).
- Ashbaugh and Pratt (2006) H. S. Ashbaugh and L. R. Pratt, Rev. Mod. Phys. 78, 159 (2006).
- Pratt (2002) L. R. Pratt, Ann. Rev. Phys. Chem. 53, 409 (2002).
- Djikaev and Ruckenstein (2013) Y. S. Djikaev and E. Ruckenstein, J. Chem. Phys. 139, 184709 (2013).
- Davis et al. (2012) J. G. Davis, K. P. Gierszal, P. Wang, and D. Ben-Amotz, Nature 491, 582 (2012).
- Berne et al. (2009) B. J. Berne, J. D. Weeks, and R. Zhou, Annu. Rev. Phys. Chem. 60, 85 (2009).
- Huang and Chandler (2000) D. M. Huang and D. Chandler, Proc. Natl. Acad. Sci. (USA) 97, 8324 (2000).
- Athawale et al. (2007) M. V. Athawale, G. Goel, T. Ghosh, T. M. Truskett, and S. Garde, Proc. Natl. Acad. Sci. (USA) 104, 733 (2007).
- Li and Walker (2012) I. T. S. Li and G. C. Walker, Proc. Natl. Acad. Sci. (USA) 108, 16527–16532 (2012).
- Bagchi (2005) B. Bagchi, Chemical Reviews 105, 3197 (2005).
- Niehus et al. (2011) G. Niehus, M. Heyden, D. A. Schmidt, and M. Havenith, Faraday Discuss. 150, 193 (2011).
- Kwon et al. (2010) O. H. Kwon, T. H. Yoo, C. M. Othon, J. A. V. Deventer, D. A. Tirrell, and A. H. Zewail, Proc. Natl. Acad. Sci. (USA) 107, 17101 (2010).
- Zhang et al. (2007) L. Zhang, L. Wang, Y.-T. Kao, W. Qiu, Y. Yang, O. Okobiah, and D. Zhong, Proc. Natl. Acad. Sci. (USA) 104, 18461 (2007).
- Pizzitutti et al. (2007) F. Pizzitutti, M. Marchi, F. Sterpone, and P. J. Rossky, J. Phys. Chem. B 111, 7584 (2007).
- Fogarty and Laage (2014) A. C. Fogarty and D. Laage, J. Phys. Chem. B. 118, 7715 (2014).
- Setny et al. (2013) P. Setny, R. Baron, P. Kekenes-Huskey, J. A. McCammon, and J. Dzubiella, Proc. Natl. Acad. Sci. (USA) 110, 1197 (2013).
- Mittal and Hummer (2008) J. Mittal and G. Hummer, Proc. Natl. Acad. Sci. (USA) 105, 20130 (2008).
- Vaikuntanathan and Geissler (2014) S. Vaikuntanathan and P. L. Geissler, Phys. Rev. Lett. 112, 020603 (2014).
- Patel et al. (2011) A. J. Patel, P. Varilly, S. N. Jamadagni, H. Acharya, S. Garde, and D. Chandler, Proc. Natl. Acad. Sci. U.S.A. 108, 17678 (2011).
- Jamadagni et al. (2011) S. N. Jamadagni, R. Godawat, and S. Garde, Annu. Rev. Chem. Biomol. Eng. 2, 147 (2011).
- Cheng and Rossky (1998) Y. K. Cheng and P. J. Rossky, Nature 392, 696 – 699 (1998).
- Chau et al. (1996) P. L. Chau, T. R. Forester, and W. Smith, Molecular Physics 89, 1033 (1996).
- Laage et al. (2009) D. Laage, G. Stirnemann, and J. T. Hynes, J. Phys. Chem. B 113, 2428 (2009).
- N.Galamba (2014) N.Galamba, J. Phys. Chem. B 118, 4169 (2014).
- Ashbaugh (2009) H. S. Ashbaugh, Chem. Phys. Lett. 477, 109-111 (2009).
- Berendsen et al. (1987) H. J. C. Berendsen, J. R. Grigera, and T. P. Straatsma, J. Phys. Chem. 91, 6269 (1987).
- Hess et al. (2008) B. Hess, C. Kutzner, D. van der Spoel, and E. Lindahl, J. Chem. Theory Comput. 4, 435 (2008).
- Gosh et al. (2012) A. Gosh, J. Samuel, and S. Sinha, EPL 98, 30003 (2012).
- Kumar et al. (2005) P. Kumar, S. V. Buldyrev, F. W. Starr, N. Giovambattista, and H. E. Stanley, Phys. Rev. E 72, 051503 (2005).
- Hinczewski et al. (2010) M. Hinczewski, Y. von Hansen, J. Dzubiella, and R. R. Netz, J. Chem. Phys. 132, 245103 (2010).
- Seldmeier et al. (2011) F. Seldmeier, Y. von Hansen, L. Mengyu, D. Horinek, and R. R. Netz, J. Stat. Phys. 145, 240 (2011).
- Weiss (1966) G. H. Weiss, Adv. Chem. Phys. 13, 1 (1966).
- Rosenfeld (1977) Y. Rosenfeld, Phys. Rev. A 15, 6 (1977).
- Dzugutov (1996) M. Dzugutov, Nature 381, 137 (1996).
- Luzar and Chandler (1996) A. Luzar and D. Chandler, Nature 379, 55 (1996).
- Luzar (2000) A. Luzar, J. Chem. Phys. 113, 23 (2000).
- O.Markovitch and Agmon (2008) O.Markovitch and N. Agmon, J. Chem. Phys 129, 084505 (2008).
- Pereyra et al. (2012) R. G. Pereyra, A. J. B. di Lorenzo, D. C. Malaspina, and M. A. Carignano, Chemical Physics Letters 538, 35 (2012).
- Grossman et al. (2011) M. Grossman, B. Born, M. Heyden, D. Tworowski, G. B. Fields, I. Sagi, and M. Havenith, Nature Struct. Biol. 18, 1103 (2011).