Electric Field Unbinding of Solid-Supported Lipid Multilayers
Abstract
We studied by X-ray reflectivity the behaviour of fully hydrated solid-supported lipid multilayers under the influence of a transverse electric field, under conditions routinely used in the electroformation process. The kinetics of sample loss (unbinding) was measured as a function of the amplitude and frequency of the applied field by monitoring the integrated intensity of the Bragg peaks. We also performed a time-resolved analysis of the intensity of the first Bragg peak and characterized the final state of the sample.
pacs:
61.10.KwX-ray reflectometry (surfaces, interfaces, films) and 87.16.DgMembranes, bilayers, and vesicles and 87.50.RrEffects of electric fields on biomolecules, cells and higher organisms1 Introduction
The influence of an external electric field upon lipid bilayers is of paramount importance, both from a practical and a fundamental point of view. Cell electroporation neumann89 has been long employed for introducing exogenous molecules into cells, while electroformation luisi00 is the best method to date for obtaining giant unilamellar vesicles, which can be used as model systems for the cell membrane and as transfection factors (see delattre93 and references therein). Although very important, these phenomena are still in need of a clear-cut explanation. This lack can be understood in light of the fact that both processes are instabilities involving large values of the electric field. As such, they lead to large deformations, irreversibly changing the system structure : creating pores in the membrane (electroporation) or ‘peeling’ the bilayers off the substrate (electroformation).
Here, we investigate the electroformation process angelova92 , which involves applying an AC electric field across a lipid film deposited on a substrate. The later stages of the process, namely the formation of small vesicles and the ”ripening” leading to the appearance of giant vesicles have already been studied in detail angelova92 . However, the very first step, during which the lipid bilayers unbind from the substrate, has not been quantified. In the present work, we focus on characterizing this initial step, using the X-ray reflectivity technique alsnielsen01 , which has the advantage of only being sensitive to the bound membranes katsaras00 . Thus, we can determine the quantity of lipid still left on the substrate at a certain time (averaged over the fotprint of the beam) as well as structural changes at the microscopic level (lamellar spacing, fluctuation amplitude etc.) that are inaccessible by light microscopy. It should be noted that the recent experimental work of Burgess et al. burgess04 studies the influence of the (static) surface charge on the structure of a unique supported bilayer, using neutron reflectivity.
Several theories were put forward to explain different aspects of the electric field effect upon the stability of lipid membranes (flat thaokar02 or under the form of vesicles isambert98 ; kumaran , charged bensimon90 ; lau98 ; kim02 or uncharged kummrow91 ). To our knowledge, the only theoretical paper relevant to our experimental configuration (uncharged flat membrane under the influence of a transverse electric field) is the one by Sens and Isambert sens02 . They predict an undulation instability of the membrane, with a typical wavelength in the submicron range.
2 Experimental method
2.1 Sample preparation and environment
The field unbinding experiments were performed using the zwitterionic lipid 1,2-dimyristoyl-sn-glycero-3-phosphocholine (abbreviated in the following to DMPC), bought from Avanti (Alabaster, AL, USA) and used without further purification. The lipid was dissolved in a 1:1 (vol/vol) mixture of chloroform and TFE (2- 2-2-trifluoroethanol) at concentrations between 5 and 20 mg/ml. An amount of 0.1-0.2 ml of the solution was pipetted onto carefully cleaned silicon substrates of a size of 15 25 mm2 cut from conductive (highly doped) commercial silicon wafers (Silchem Gmbh, Freiberg, Germany). Depending on the desired film thickness, the samples were either left to dry slowly, in which case all the lipid remains on the substrate, yielding stacks of 1000-3000 bilayers (depending on the solution concentration and volume), or submitted to the spin-coating process mennicke02 . In this case, immediately after deposition the substrate was accelerated to rotation (3000 rpm), using a spin-coater. In this case, the number of bilayers can be controlled. In both cases, the samples were left to dry under a laminar flux hood at room temperature for a few hours and then exposed to high vacuum at overnight to remove any remaining traces of solvent. They were finally stored at until the measurement.
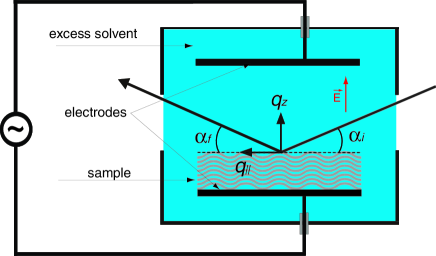
The experiments were performed in a plexiglas chamber with kapton windows (Fig. 1). The sample contacts and the counter electrode are in stainless steel. The electric field is applied using a function generator (Agilent Technologies). The peak-to-peak amplitude is given in the text as Vpp. The cell was mounted on a metal heating stage, temperature-controlled by water flow from a heating bath (Julabo Gmbh, Seelbach, Germany). After mounting the sample, the hydrating solution was gently added to avoid washing the lipid film off the substrate. We used ultrapure water (Millipore, Bedford, MA).
2.2 X-ray reflectivity
The X-ray reflectivity measurements presented here were carried out at the bending magnet beamline D4 of HASYLAB-DESY in Hamburg, Germany. At D4, a single-reflection Si(111) monochromator was used to select a photon energy of 20 keV, after passing a Rh mirror to suppress higher harmonics. Primary beam intensity is around counts/s. The use of high energy X-rays has two reasons : it reduces the beam damage to the sample and minimizes absorbtion in the solvent (the transmission factor is about 0.25 for 2 cm of water).
The chamber was mounted in horizontal scattering geometry, and the reflected beam was measured by a fast scintillation counter (Cyberstar, Oxford), using computer-controlled aluminum absorbers which attenuate the beam at small to prevent detector saturation. Incident and exit beams were defined by a system of motorized slits. The data was corrected for decreasing electron ring current and for the diffuse contribution (by subtraction of an offset scan). Finally, an illumination correction was performed.
2.3 Time correlation function
For some samples we determined the autocorrelation function of the scattering signal. After aligning the sample (usually with the first Bragg peak in specular condition), the signal from the scintillation detector was fed into a multiple-tau correlator (ALV-5000/EPP, from ALV Gmbh, Langen, Germany) and the corelation function berne00 was obtained. was averaged over 300 s. We performed these measurements both on thick (spread) and thin (spin-coated) samples. No detectable modulation was present for thick samples; however, for thin samples and at moderate frequencies, exhibited an oscillation at the frequency of the applied field. When this feature was observed, care was taken to rule out any artefacts : we checked that the modulation disappeared when unplugging the cable and when the sample chamber was vigorously flushed with solvent to remove the sample from the substrate, maintaining the experimental configuration and the applied field. This latter test conclusively shows that the oscillation is indeed a feature of the lipid bilayers, and not of the substrate or mounting.
3 Results
3.1 Field amplitude
We studied the unbinding kinetics as a function of the amplitude of the applied electric field. All the measurements discussed in this subsection were performed at a fixed field frequency and at a temperature of . First, we present results obtained at low amplitudes, , on spin-coated samples. Figure 2 shows a typical reflectivity spectrum before applying the field (A). After the field is turned on, only the vicinity of a Bragg peak is scanned, as shown in the inset (B). For all the curves, the measurements were performed on the second Bragg peak, where the background (due to the interference with the substrate) is flatter and can be more easily subtracted. The area under the Bragg peak is then integrated and corrected for the time variation of the primary beam. Since the integrated intensity is roughly proportional to the sample volume (number of layers illuminated area), we can thus monitor the kinetics of unbinding averaged over a few of sample area. The integrated intensity is shown in panel (C) as a function of time, for different values of the applied field 0.2, 0.3, 0.45, 1.0 and 2.0 Vpp. The longest evolution measured (at 0.2 Vpp) was recorded over almost ten hours.
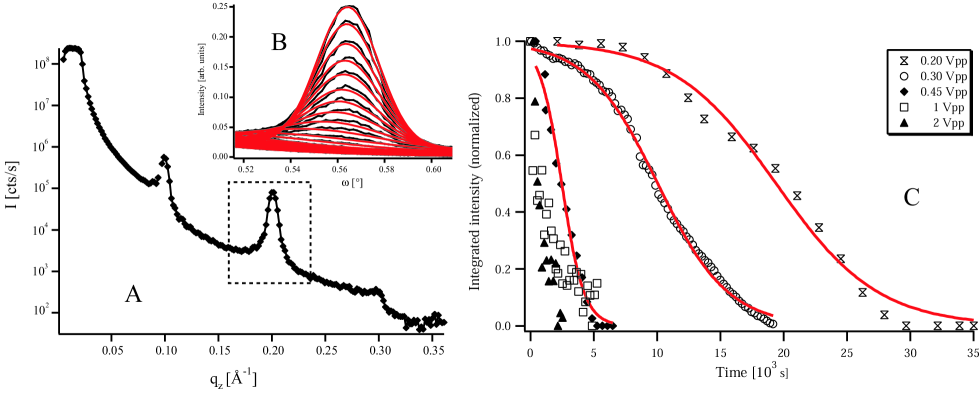
For the lowest applied fields, the intensity decay with time has a sigmoidal shape, characterized by a ”waiting time” and a ”decay time”; we quantified this tendency by fitting the curves with a hyperbolic tangent :
| (1) |
yielding the following values :
| [Vpp] | [s] | [s] | Sample | |
|---|---|---|---|---|
| 0.2 | 20000 300 | 8000 500 | thin | Fig. 2 C |
| 0.3 | 10000 40 | 5500 60 | -”- | -”- |
| 0.45 | 2500 70 | 1800 120 | -”- | -”- |
| 1.0 | 0 [fixed] | 1500 250 | -”- | -”- |
| 2.0 | 0 [fixed] | 800 100 | -”- | -”- |
| 5.0 | 0 [fixed] | 1300 100 | -”- | not shown |
| 1.0 | 3200 80 | 1500 120 | thick | not shown |
At higher field amplitudes (above 1Vpp), the ”waiting time” vanishes, so that we set . The remaining decay could be equally well described by an exponential function.
We also studied thick samples under the same experimental conditions. For comparison, the evolution of the scattered intensity was fitted using the same model as for the thin samples (equation 1) and the parameters are given in Table 1.
The main interest of using thick samples is, however, the possibility of studying the diffuse scattering signal and of obtaining information about the bilayer position fluctuations. Extensive measurements were performed, both at D4 (HASYLAB) and at the ID1 beamline at the ESRF (Grenoble, France); no difference was detected in the diffuse spectrum between the situation with or without electric field (data not shown). We therefore conclude that the bilayers within the sample are not significantly affected by the presence of the field (no enhancement in the fluctuation amplitude).
3.2 Comparison with thermal effects
The dependence of the unbinding rate on the amplitude of the electric field is strikingly similar to the kinetics recorded as a function of the temperature vogel00 . The same pattern of a plateau followed by a decay (at lower temperature) and the disappearance of the plateau (at higher temperatures) emerge, albeit on a completely different time scale (see Figure 3).
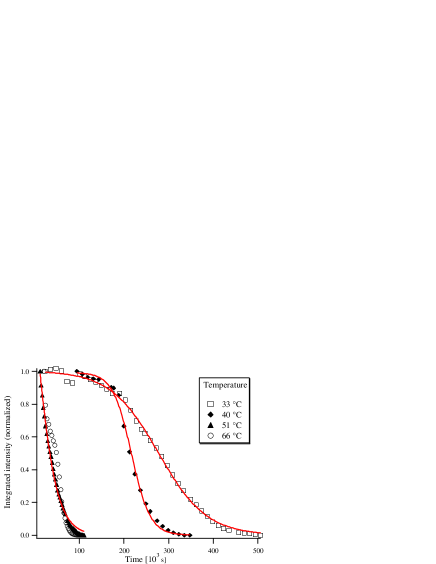
The lipid used was 1-oleoyl-2-palmitoyl-sn-glycero-3-phosphocholine (OPPC), bought from Avanti Lipids, Alabama. The samples were prepared as for the electric field studies (by spreading), except for using isopropanol as a solvent and for applying a hydrophilizing treatment to the substrates, by washing them in a saturated KOH solution in ethanol for about a minute. Subsequently, they were rinsed several times with ultra-pure water.
The data has been taken in a temperature-controlled steel chamber sample immersed in excess ultra-pure water (the beam path in water is 15 mm), on an in-house setup using a sealed tube generator (Mo Kα radiation, ) and a two-circle goniometer (Siemens D500). The integrated diffuse scattering of the first Bragg sheet was used as a measure of the total scattering volume.
No high-temperature measurements were performed for DMPC, so that a direct comparison with the results of subsection 3.1 is not possible. However, several measurements were made using one DMPC sample, at temperatures between 22 and , over a period of four weeks, without any apparent sample loss.
3.3 Field frequency
The temperature was set at for these measurements.
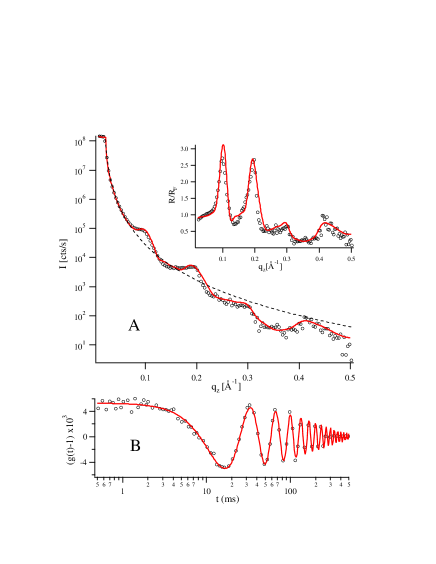
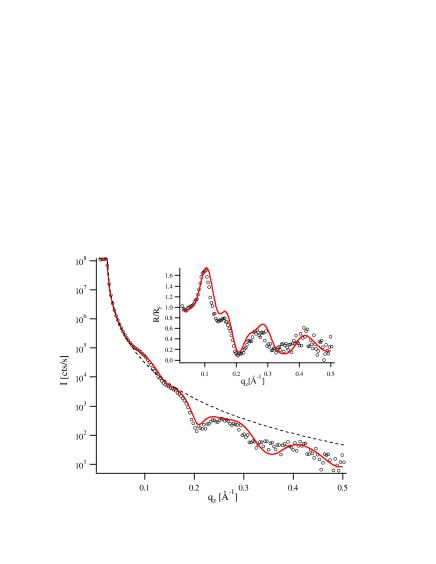
A representative example is shown in Figure 4; graph A shows the specular scan (corrected for the offset contribution) and the adjustment with the model given in salditt02 ; mennicke04 (red solid curve), as well as the associated Fresnel reflectivity (dashed line). The inset shows the same data divided by the Fresnel reflectivity. From the model, we infer that the sample consists of four layers, with approximate coverage ratios (starting at the substrate) : 1.0, 0.8, 0.45, 0.15 (other sample parameters, such as the amplitudes of the different Fourier components of the electron density profile and the Caillé parameter quantifying the amplitude of the thermal fluctuations were taken from previous measurements under the same conditions mennicke04 ). Graph B shows a time correlation function measured on top of the first Bragg peak (, corresponding to a repeat spacing ), under an applied electric field with an amplitude of 5 Vpp and a frequency . The correlation function is well described by a decaying oscillation at the applied frequency :
| (2) |
where the amplitude and the decay time . Similar measurements were performed at slightly different frequencies; the behaviour of follows the applied frequency, ruling out the presence of an external oscillator. As discussed above (subsection 2.3), we took additional step to confirm that the signal is indeed a genuine contribution of the sample.
We recorded the correlation function on top of the first Bragg peak for increasing frequencies and noticed that, above a threshold of the order of , estimated from measurements performed on several samples, no longer exhibits oscillations at the applied frequency.
In the range where the correlation function can be properly measured (about 10 to 50 Hz), the recorded frequency is very precisely that of the applied electric field. The decay time exhibits an intriguing dependence on : , but more systematic measurements would be needed to confirm whether this is an intrinsic feature of the sample or an artifact of the setup.
The frequency of the applied field also has a strong effect on the unbinding kinetics, as can be seen in Figure 5. The measurement was measured on a thick (about 3000 bilayers) sample. We started by applying a 10 Vpp field at 1 kHz and then decreased the frequency at 100 Hz and finally at 10 Hz. The change in the decay rate of the peak is very strong. In addition, an abrupt decrease in intensity was observed when switching from 100 to 10 Hz; this effect is systematically observed in all samples studied at high field amplitude (data not shown), and could be related to the unbinding of weakly adhering surface patches.

3.4 Final state
An interesting point to address is also the final state, defined as the point at which applying a reasonably strong electric field no longer has any observable effect on the sample. In most of the measurements performed on thin (spin-coated) samples, it appears that only one or two bilayers remain on the substrate. An example is shown in Figure 6, where a sample prepared according to the protocol in mennicke02 using a DMPC concentration of 2 mg/ml was exposed to an AC field with an amplitude of 10 Vpp at a frequency of 10 Hz, and afterwards at 5 Hz for more than 10 minutes in each case; the final reflectivity (open symbols) can be described by assuming that only two bilayers are left on the substrate, with coverage ratios of 0.8 and 0.3, starting at the substrate. This spectrum being a representative one for spin-coated samples, we can conclude that the bottom layer (closest to the substrate) is largely unaffected by the electric field.
4 Discussion and Conclusion
At the beginning of this study, two kinds of results were expected : long-time effects (unbinding kinetics under electric field) and changes in the short-time behaviour (the fluctuation spectrum) of the lamellar phase.
Unbinding kinetics : The unbinding of lipid bilayers from a solid substrate represents the first step of the electroformation process. We determined the kinetics of unbinding under field for various applied voltages, both for thin (tens of bilayers) and thick (thousands of bilayers) samples. A two-step process was observed at low voltage, consisting in a very slow decay (”incubation” plateau) followed by a fast sample loss. At higher applied voltages, the first step disappears. Surprising similarities with the previously characterized thermal unbinding kinetics were thus revealed. The frequency of the applied field is also important: the unbinding no longer occurs when the frequency exceeds a few hundred Hz.
The field-induced instability discussed here and the disintegration pathway of the lamellar stack has been corroborated in many sample series of DMPC, at varied field amplitudes, and frequencies, both for thin and thick stacks ollinger03 . Moreover, it was found that the presence of an osmotic stressor (polyethylene glycol, MW 20000) in solution does not prevent the instability, but does slow down the decay rate ollinger03 . However, the results of measurements on thick stacks and/or in the presence of a osmotic stress being rather noisy, we do not discuss them here.
Fluctuations : As we know that the applied field induces the unbinding, it must necessarily have an effect at the microscopic scale (i.e. that of the individual membrane). This effect could be at the level of the structural parameters (changes in the bilayer and/or water layer thickness) but could also involve enhanced fluctuations of the bilayers, as invoked in the case of thermal unbinding. In addition, recent theoretical work sens02 has suggested that a transverse electric field could induce an undulation instability of a (low conductivity) membrane.
We could detect no change in the structural parameters or in the diffuse scattering for thick samples; in thin samples, on the other hand, the intensity of the Bragg reflection exhibits a modulation at the frequency of the applied field. This leads us to the tentative conclusion that the electric field only affects a few layers at the top of the stack and that, in thick samples, their contribution to the scattered signal is swamped by that of the bulk. It appears that we are dealing with a surface phenomenon, which is reasonable in light of the fact that the electroformation phenomenon yields unilamellar vesicles; at some point, the bilayers must peel off one by one.
This conclusion is not in contradiction with the theoretical model of Sens and Isambert sens02 , since they also observe a strong change in dynamics in the presence of fixed boundaries. It would be reasonable to assume that motion of the membranes within the stack is hindered by their neighbours (and the boundary condition at the sustrate), while the top ones are relatively free to fluctuate. A more quantitative comparison cannot be made, since we cannot determine accurately the number of affected bilayers at the surface, the fluctuation amplitude and length scales; it should also be noted that membrane integrity is a key ingredient of their model (the electric current flows across the membrane, and the transverse electric field is amplified in proportion to the resistivity of the membrane).
This condition is not fulfilled in our samples, where defects (dewetted patches) are known to appear perrinogallice02 . The electric current is more likely to flow through the defects, rather than across the bilayers; this is also the case of electroformation procedures, where the deposited lipid film need not cover the entire surface of the electrode angelova92 .
We conclude that the presence of the electrodynamical instability studied by Sens and Isambert sens02 is neither confirmed nor can it be refuted by our experiments; a more careful setup, involving e. g. a freely suspended lipid film, would be needed.
In these conditions, an alternative explanation could be related to the presence of electro-osmotic flow in the solution, but more comprehensive tests must be performed in order to test this hypothesis.
Acknowledgements.
D. C. has been supported by a Marie Curie Fellowship of the European Community programme Improving the Human Research Potential under contract number HPMF-CT-2002-01903. Chenghao Li is acknowledged for helping with the D4 experiments, and Manouk Abkarian for assistance with the electroformation protocol.References
- (1) E. Neumann, A. E. Sowers, and C. A. Jordan (eds.), Electroporation and Electrofusion in Cell Biology, (Plenum Press, New York 1989).
- (2) P. L. Luisi and P. Walde (eds.), Giant Vesicles, Perspectives in Supramolecular Chemistry, vol. 6 (John Wiley & Sons Ltd. 2000).
- (3) J. Delattre et al., Liposomes : technological, biological and pharmacological aspects, (Inserm, Paris 1993) (in French).
- (4) M. I. Angelova, S. Soléau, Ph. Méléard, J. F. Faucon, and P. Bothorel, Progr. Colloid Polym. Sci 89, 127-131 (1992).
- (5) J. Als-Nielsen and D. McMorrow, Elements of Modern X-Ray Physics, (Wiley, Chichester, 2001).
- (6) J. Katsaras and V. A. Raghunathan, Aligned lipid-water systems, in Lipid bilayers : Structure and Interactions, edited by J. Katsaras and T. Gutberlet (Springer, 2000).
- (7) I. Burgess et al., Biophys. J. 86, 1763-1776 (2004).
- (8) R. M. Thaokar and V. Kumaran, Phys. Rev. E 66, 051913 (2002).
- (9) H. Isambert, Phys. Rev. Lett. 80, 3404-3407 (1998).
- (10) V. Kumaran, Phys. Rev. Lett. 85, 4996-4999 (2000) and Phys. Rev. E 64, 011911 (2001).
- (11) D. Bensimon, F. David, S. Leibler, and A. Pumir, J. Phys. (France) 51, 689-695 (1990).
- (12) A. W. C. Lau and P. Pincus, Phys. Rev. Lett. 81, 1338-1341 (1998).
- (13) Y. W. Kim and W. Sung, Europhys. Lett. 58, 147-153 (2002).
- (14) M. Kummrow and W. Helfrich, Phys. Rev. A 44, 8356-8360 (1991).
- (15) P. Sens and H. Isambert, Phys. Rev. Lett. 88, 128102 (2002).
- (16) U. Mennicke and T. Salditt, Langmuir 18, 8172-8177 (2002).
- (17) B. J. Berne and R. Pecora, Dynamic Light Scattering, (Dover, Mineola, N. Y., 2000).
- (18) M. Vogel, PhD. Thesis, Universität Potsdam, Potsdam (2000).
- (19) T. Salditt, C. Li, A. Spaar, and U. Mennicke, Europhys. J. E 7, 105-116 (2002).
- (20) U. Mennicke, Doru Constantin, and T. Salditt, submitted.
- (21) C. Ollinger, MSci. Thesis, Universit ät des Saarlandes, Saarbrücken (2003).
- (22) L. Perino-Gallice, G. Fragneto, U. Mennicke, T. Salditt, and F. Rieutord, Europhys. J. E 8, 275-282 (2002).