Surface Photometry and Metallicity of the Polar Ring Galaxy A0136-0801.
Abstract
We present a photometric and spectroscopic study of the polar ring galaxy A0136-0801 in order to constrain its formation history. Near-Infrared (NIR) and optical imaging data are used to extract surface brightness and color profiles of the host galaxy and the wide polar structure in A0136-0801. The host galaxy dominates the light emission in all bands; the polar structure is more luminous in the optical bands and is three times more extended than the main spheroid. The average stellar population in the spheroid is redder than in the polar structure and we use their (B-K) vs. (J-K) colors to constraint the ages of these populations using stellar population synthesis models. The inferred ages are 3-5 Gyrs for the spheroid and 1-3 Gyrs for the polar structure. We then use long slit spectra along the major axis of the polar structure to derive the emission line ratios and constrain the oxygen abundance, metallicity and star formation rate in this component. We find and , using emission line ratios. These values are used, together with the ratio of the baryonic masses of the host galaxy and polar structure, to constraint the possible models for the formation scenario. We conclude that the tidal accretion of gas from a gas rich donor or the disruption of a gas-rich satellite are formation mechanisms that may lead to systems with physical parameters in agreement with those measured for A0136-0801.
keywords:
Galaxies: photometry – Galaxies: abundances – Galaxies: formation – Galaxies: individual: A0136-0801 – Galaxies: peculiar – Methods: data analysis.1 Introduction
In the latest decade, several studies focused on the morphology and kinematics of polar structures in galaxies, i.e. Polar Ring/Disk Galaxies (PRGs). These are multi-spin systems, where stars and gas in the polar structure rotate in a perpendicular plane with respect to the stars in the central galaxy. The two decoupled components with orthogonal angular momenta are explained as the consequence of a ”second event” in their formation history (see Iodice, 2014, for a review). Thus, PRGs are among the ideal galaxies to study the physics of accretion/interaction mechanisms, the disk formation and the dark halo shape. Whitmore et al. (1990) compiled the first PRGs catalogue (PRC), with emphasis on the early-type nature of the host galaxy (HG), because of its morphology, and on appearance of the polar structure and its relative extension with respect to the mean radius of the HG. Later studies on the prototype of PRGs, NGC 4650A, showed that the polar structure is a disk, rather than a ring (see Arnaboldi et al., 1997; Iodice et al., 2002; Gallagher et al., 2002; Swaters & Rubin, 2003). Both in the PRC and in the new SDSS-based Polar Ring Catalog (SPRC) made by Moiseev et al. (2011), there are other PRGs that show a wide disk-like morphology similar to NGC 4650A. They are UGC 7576 (PRC A-04), UGC 9796 (PRC A-06), SPRC-27, SPRC-59, and SPRC-69 in the SPRC, and the galaxy studied in this work A0136-0801 (A-01). Thus, the ‘PRG’ morphological type currently includes both narrow polar rings and wide polar rings/disks. As reviewed by Iodice (2014), narrow/wide PRGs are characterised by different physical properties in addition to the radial extension of the polar structure. In particular, in both narrow and wide PRGs the HG has similar (spheroidal) morphology, colours, and age, but a different kinematics, independent from the morphological type (narrow or wide PRGs). Contrary to the HGs, the polar structures in narrow and wide PRGs have different morphology, baryonic mass, and kinematics, but, on average, similar oxygen abundance (see Fig. 4 in Iodice 2014).
Nbody and hydrodynamical simulations try to reproduce the different systems on the basis of different formation processes. The up-to-date formation scenarios proposed for PRGs are: i) major dissipative merger; ii) tidal accretion of material (gas and/or stars) by a donor; iii) cold accretion of pristine gas along a filament. In the merging scenario, the remnant is a PRG if two disk galaxies merge on a “polar” orbit and have unequal masses (Bournaud et al., 2005). In the tidal accretion scenario, a polar ring/disk can form around a pre-existing galaxy by the accretion of gas and stars from the outskirts of a disk galaxy during a parabolic encounter, or, alternatively, by the disruption of a dwarf companion galaxy (Reshetnikov & Sotnikova, 1997; Bournaud & Combes, 2003; Hancock et al., 2009). Both the two kinds of galaxy interactions described above (major merging and tidal accretion) are able to account for several morphologies and kinematics observed for PRGs, including wide and narrow rings, as well as helical rings and double rings. In the framework of disk formation, a polar disk galaxy, i.e. a galaxy having a polar disk-like structure, forms through the accretion of pristine gas along a filament (Macciò et al., 2006; Brook et al., 2008).
The discriminant physical parameters of the formation mechanisms for PRGs are the baryonic mass, the HG kinematics, and the metallicity in the polar structure. These were derived in several works for a sample of PRGs (NGC 4650A, UGC 7576, UGC 9796; AM2020-504 and VGS31b). The viability of the cold accretion scenario to form wide polar disk is supported for the first time (Spavone et al., 2010). Moreover, it has been confirmed that the tidal accretion mechanism is able to form both narrow and wide polar rings (Spavone et al., 2011; Freitas-Lemes et al., 2012; Spavone & Iodice, 2013).
In this work we present a similar analysis on the wide PRG A0136-0801, by using both new NIR photometry and spectroscopy, to constrain the formation history of this galaxy.
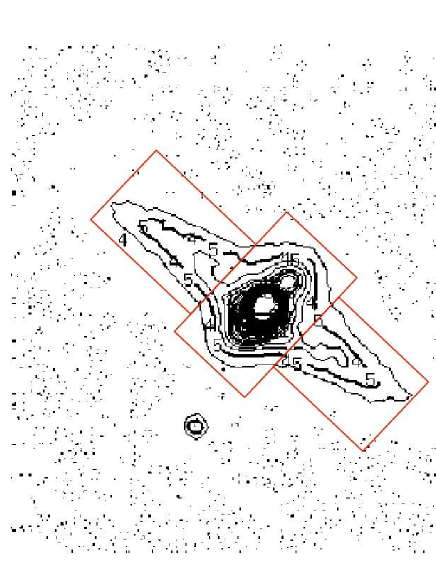
A0136-0801 was discovered by Schweizer et al. (1983) and classified as one of the best case of kinematically confirmed polar ring galaxy (PRC A-01) by Whitmore et al. (1990). It is characterized by a wide polar structure (see Fig.2), which is three times more extended than the optical radius of the central HG. The H-band images (Iodice et al., 2002) showed that the polar structure is less luminous than the central galaxy, and the bulk of the light is concentrated at smaller radii. This object was mapped in HI by Cox & Sparke (2004), who showed that all HI emission is found within the polar ring, whose outer HI contours appear to warp away from the poles. The total HI mass for this object is about , van Driel et al. (2000) also argued that the regular HI distribution and optical appearance, suggest that the polar structure is quite old and possibly dynamically stable. Moreover, Sackett & Pogge (1995) found different HII regions along the polar ring.
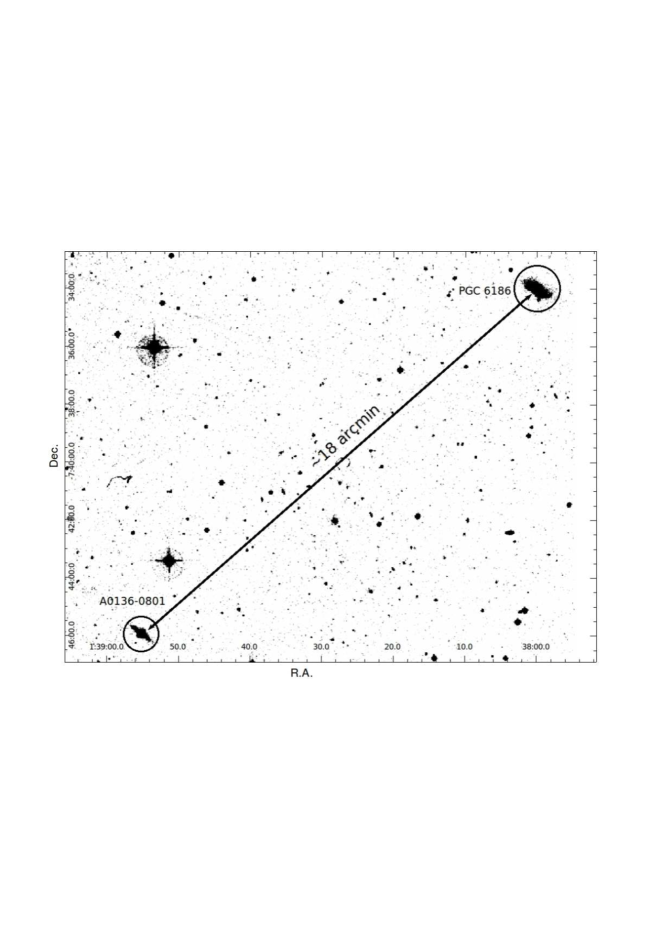
In the field around A0136-0801 (Fig. 1) there is a larger galaxy, PGC 6186, which is about 18 arcmin distant from A0136-0801, and their redshifts differ by 31 km/s (Galletta et al., 1997).
A0136-0801 has a heliocentric systemic velocity of km s-1, which implies a distance of about 73 Mpc, based on km s-1 Mpc-1, which yields an image scale of 0.3 kpc per arcsec, adopted in this work. The main properties of A0136-0801 are listed in Table 1.
The paper is structured as follow: in Sec. 2 we present the observations and data reduction; in Sec. 3 and Sec. 4 we describe the morphology and structure of the HG and polar structure in A0136-0801, based on the photometry; in Sec. 6 we give the oxygen abundances and metallicity of the HII regions in the polar structure. Results and conclusions are discussed in Sec. 7.
| Parameter | Value | Ref. |
|---|---|---|
| Morphological type | Sc peculiar | NED111NASA/IPAC Extragalactic Database |
| R.A. (J2000) | 01h38m55.2s | NED |
| Decl. (J2000) | -07d45m56s | NED |
| Helio. radial velocity | 5500 km/s | NED |
| Redshift | 0.018346 | NED |
| Distance | 73 Mpc | |
| Diameters | arcmin | Iodice et al. (2002) |
| Richter et al. (1994) | ||
| Galletta et al. (1997) | ||
| Central galaxy: | ||
| Absolute magnitude | -19.26 | This work |
| Absolute magnitude | -21.66 | This work |
| Absolute magnitude | -22.55 | This work |
| Polar ring: | ||
| Absolute magnitude | -18.49 | This work |
| Absolute magnitude | -19.76 | This work |
| Absolute magnitude | -20.31 | This work |
2 Observation and data reduction
Near-Infrared data for A0136-0801 - A0136-0801 was in a sample of PRGs observed in the J and K bands, with the SofI infrared camera at the ESO-NTT telescope, on December 2002. The camera has a field of view is arcmin2 and a pixel scale of 0.292 arcsec/pixel. A detailed description of the observing strategy and data reduction is published by Spavone & Iodice (2013). In summary, images were acquired by adopting an ON-OFF mode where the OFF sky frames were used to estimate the background level. The total exposure time on the target in the J and K bands are 360 sec and 1080 sec, respectively. The average seeing on the final image is FWHM 1.1 arcsec.
The main steps of the data reduction included dark subtraction, flatfielding correction, sky subtraction and rejection of bad pixels. The final science frames results from the stacking of the single pre-reduced exposures. The photometric zero points for that observing run are mag/arcsec2 and mag/arcsec2 for the J and K bands, respecitively.
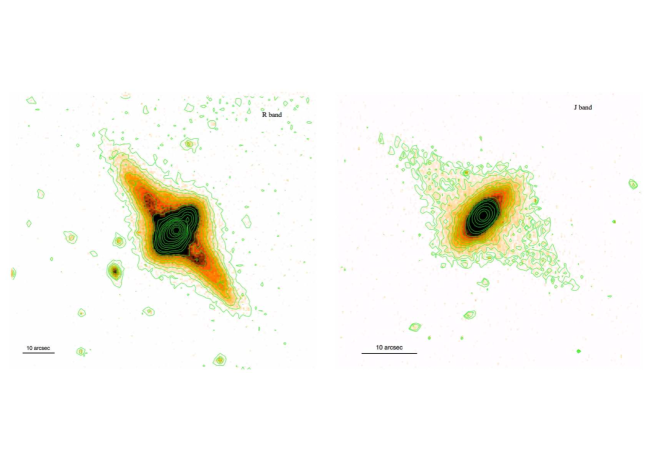
The calibrated J-band image of A0136-0801 is shown in the right panel of Fig. 2.
Optical data - Photometric observations for A0136-0801 in the optical bands ( and ) adopted for the present work were published by Godínez-Martínez et al. (2007). They were obtained in September 2001 on the 1.5 m telescope of the Observatorio Astrónomico Nacional on Sierra San Pedro Mártir (Baja California, México), equipped with a SITe1 CCD detector binned to give a pixel scale of 0.51 arcsec/pixel and a field of view of 4’.3. Reduction of the CCD frames was performed as described in Godínez-Martínez et al. (2007). The photometric calibration was made by using standard stars from the Landolt (1983) lists and, after the transformations from the natural and to the standard B and R magnitudes (see Godínez-Martínez et al. 2007). We obtained the following photometric zero points: mag/arcsec2 and mag/arcsec2, for the B and R bands respectively. The calibrated R band image of A0136-0801 is shown in the left panel of Fig. 2.
Spectroscopic data - The spectra analyzed in this work were obtained with the Andalucia Faint Object Spectrograph and Camera (ALFOSC) at the Nordic Optical Telescope in La Palma, in visitor mode, during the observing run 48-002 (on 28 and 29 October 2013). The adopted slit was wide and it was aligned along the major axis of polar structure of A0136-0801, at , in order to include the most luminous HII regions. The total integration time is 3 hours, with an average seeing of 1.15 arcsec.
We used the grism nr. 4, which coves the wavelength range of Å, it has a dispersion of 2.3 Å/pix and a spectral resolution 10. We aim to detect the the red-shifted emission lines of , , , , and in the polar structure of A0136-0801.
The data reduction and analysis is the same adopted and described by Spavone et al. (2010, 2011); Spavone & Iodice (2013), to derive the chemical abundances and metallicity in PRGs. The main steps includes the CCD pre-reduction. The wavelength calibration of the spectra was obtained by comparing spectra of Hg+Ne lamps acquired for each observing night. The sky spectrum was extracted at the outer edges of the slit, for arcsec from the galaxy center, where the surface brightness is fainter than 24 mag/arcsec2, and subtracted off each row of the two dimensional spectra. The uncertainty on the sky subtraction is better than . The final median-averaged 2D spectrum was obtained by co-adding the sky-subtracted frames.
Each 2D spectrum is flux calibrated by using the standard star HD192281 observed during the first night and HD19445 during the second night. The representative 1-D spectrum relative to the major axis of the polar structure in A0136-0801 is shown in Fig. 3. It results by the sum of all 1-D spectra along the spatial direction having emission lines with S/N . The integrated flux and the equivalent width of each emission line was obtained by integrating the line intensity over the local fitted continuum. The errors estimate on these quantities was calculated by using the relation published by Pérez-Montero & Díaz (2003).
According to Spavone & Iodice (2013) [and reference therein], the intensity of each emission line were corrected for the reddening, which account both for the absorption intrinsic to the galaxy and to the Milky Way. Along the polar structure of A0136-0801, the color excess is = , and the optical extinction is . This was obtained by comparing the observed and the intrinsic balmer decrement measured by summing up all 1-D spectra along the spatial direction in which the observed Balmer decrement was greater than the intrinsic one.
By assuming the Cardelli’s law (Cardelli et al., 1989), is used to derive the extinction . The observed and de-reddened mean emission line fluxes relative to are listed in Table 2.

| line | (Å) | (Å) | Observed flux relative to | De-reddened flux relative to |
|---|---|---|---|---|
| 4861 | 4950 | 1 | 1 | |
| 4340 | 4420 | 0.4 | 0.45 | |
| 3727 | 3795 | 1.99 | 2.55 | |
| 4959 | 5050 | 1.96 | 1.89 | |
| 5007 | 5099 | 3.28 | 3.19 | |
| 6563 | 6683 | 3.72 | 2.89 | |
| 6548 | 6668 | 0.46 | 0.36 | |
| 6583 | 6703 | 1.3 | 1.02 |
3 Host galaxy and polar structure morphology
Both NIR and optical images show that the central spheroid of A0136-0801 is the dominant luminous component (Fig. 2, see also the left panels of Fig. 5). The polar structure is more clearly visible in the optical bands, while it is fainter in the J and K bands. In the optical, it has a diameter of about 64′′ ( 22 kpc), which is three times more extended than the optical radius of the central galaxy (20′′ 7 kpc). This component hosts several star formation regions and dust that affect the light distribution (Iodice et al., 2002).
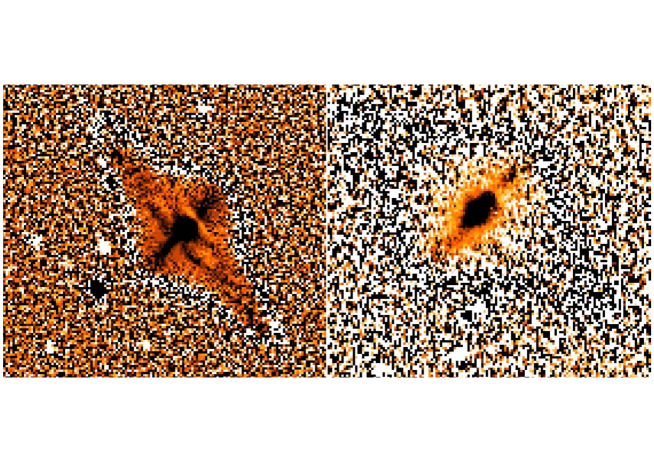
To examine the inner structure of the central HG, we have derived the high frequency residual images both in the optical and in the NIR bands. This is the ratio of the original reduced image with a smoothed222We used the IRAF task FMEDIAN to smooth the original reduced image one, where each original pixel value is replaced with the median value in a rectangular window. The window size is pixels in the R band and pixels in the J band. The un-sharp masked images in these bands are shown in the bottom panels of Fig. 2. Both in the optical R-band as well as in the J band, this image shows a disk-like structure along the major axis of the HG. In the optical R-band high frequency residual image of A0136-0801, the two arms of the polar structure are also clearly visible. On the SE side, the polar structure is in front of the HG, where the dust associated to this component is obscuring the light coming from the central galaxy. These features are not detectable in the J-band high frequency residual image.
4 Surface Photometry
In this section we describe the surface photometry and the two-dimensional model of the light distribution for A0136-0801. NIR images, in the J and K bands, where the dust absorption is very low, are used to study the structure of the central HG in A0136-0801. On the other hand, since the polar component is much more luminous and extended in the optical bands, B and R images are mainly used to study this component. The light and color distributions are derived for the whole system in both optical and NIR bands.
4.1 Isophotal analysis
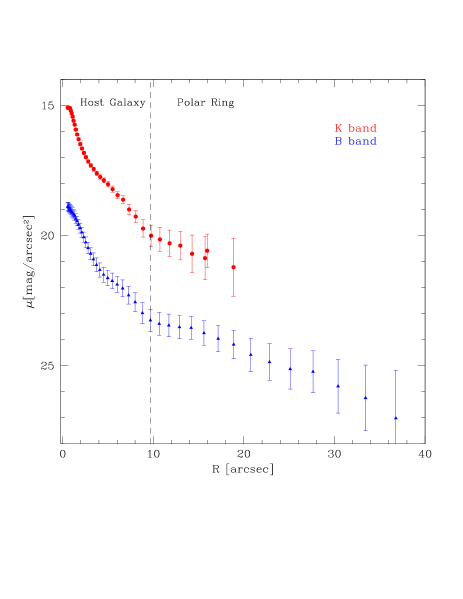
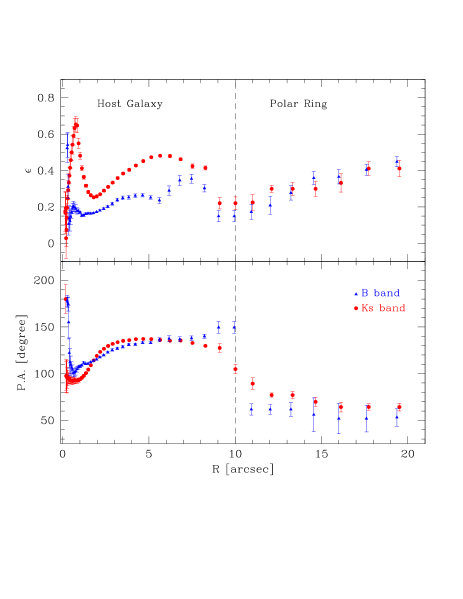
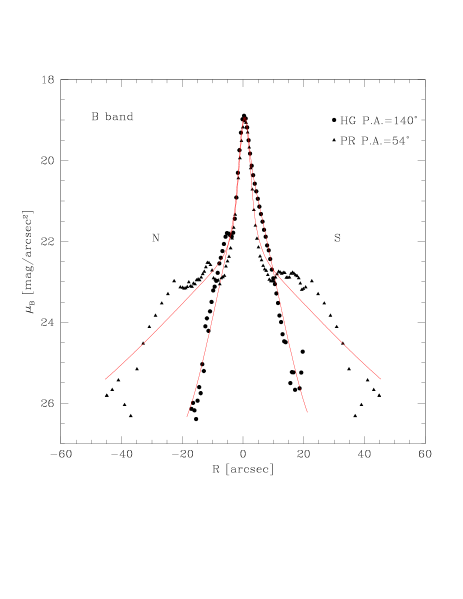
We used the IRAF-ELLIPSE task on the whole imaging dataset to perform the isophotal analysis and to derive the average surface brightness profiles, Position Angle (P.A.) and ellipticity (). The limits of the surface photometry presented in this work are derived as the distance from the center where the galaxy’s light blends into the background level. These radii set the surface brightness limit of the optical and NIR photometry. Results for the B and K bands are shown in Fig. 4. The average surface brightness profiles extend out to 27.77 arcsec (8.3 kpc) in the K band and out to 37 arcsec (11 kpc) in the B band (see Fig. 4, left panel). The limiting magnitudes corresponding to the radii given above are mag arcsec-2 for the K-band data, and mag arcsec-2 for the B-band image. The error estimates on the above quantities take the uncertainties on the photometric calibration ( mag) and sky subtraction ( ADU in the B band and ADU in the K band) into account.
The nucleus (for arcsec, kpc) is very bright in the K band, while light is probably obscured by dust in the optical B band image. In the K band, the HG extends out to 10 arcsec ( kpc). While, in the optical B-band, the contribution to the light by the polar structure is much more significant and the semi-major axis of this component is about 27 arcsec (8 kpc).
In the range arcsec ( kpc), a significant
twisting () is observed, where the P.A. increases from about
to , and the ellipticity shows a
peak (see Fig. 4, right panel). This is more pronounced
in the K band () than in the B band
(), where the perturbation by dust is stronger.
For arcsec ( kpc), in the region
where the HG dominates, the P.A. is almost constant to the value
, and increases up to 0.45 in the K image,
and 0.3 in the optical image, and decreases afterwards to .
At larger radii, for arcsec ( kpc),
in the regions of the polar ring, P.A. changes and it is almost
constant in the range of values . The
ellipticity shows a linear increase from 0.2 up to 0.4
The half-light radii of the whole galaxy are arcsec ( kpc) for the K-band and arcsec ( kpc) for the B-band. In Table 3 we give the total integrated magnitudes within two circular apertures centred on A0136-0801, derived in the K and B bands. The first aperture is within 14 arcsec, and it was chosen in order to make the comparison with the integrated magnitudes derived by the 2MASS data for A0136-0801. The second aperture corresponds to the outer limit of the surface photometry in the B and K bands given above.
| Aperture radius | ||||||
|---|---|---|---|---|---|---|
| (1) | (2) | (3) | (4) | (5) | (6) | (7) |
| 14 | 13.08 | 12.08 | 13.05 | 12.08 | 15.45 | 11.80 |
| 27.55 | 11.58 | |||||
| 36.77 | 15.19 |
Col. 1: Radius of the circular aperture in arcsec. Col. 2 and Col. 3: Integrated magnitudes in the J and K bands from the SOFI data. Col. 4 and Col. 5: Integrated magnitudes in the J and K bands from the 2MASS data. Col. 6 and Col. 7: Integrated magnitudes in the optical B and R bands.
4.2 2-Dimensional model of the light distribution
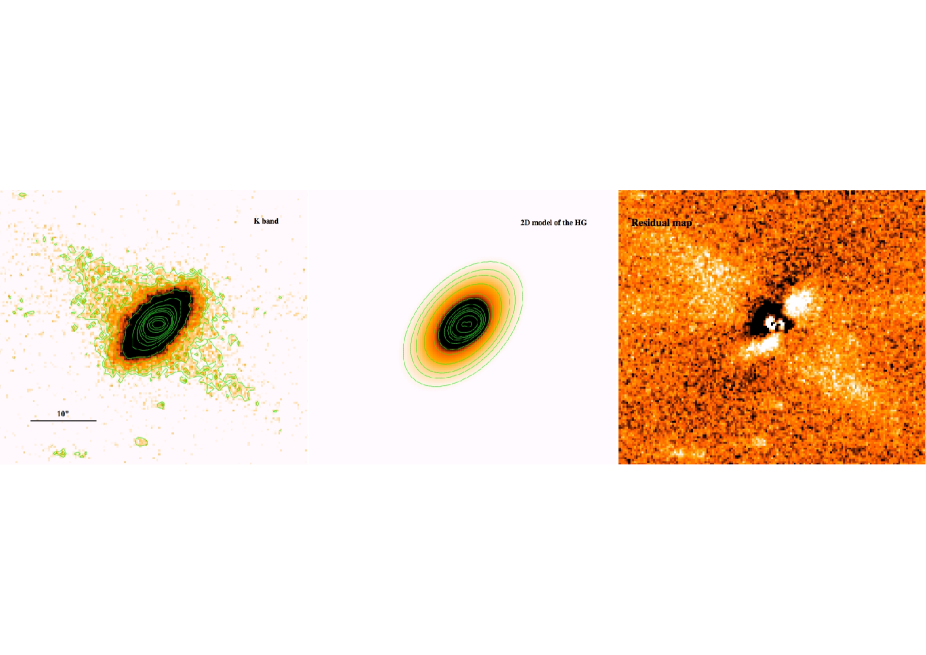
A0136-0801 has two main components, the central spheroid (the HG), with a bright nucleus, and the polar structure, which resembles a ring (see Fig. 2). In order to measure the structural parameters of the main galaxy components we adopted the following approach. In the K-band, which is less perturbed by dust, we obtained the best 2-dimensional (2D) model of the light distribution for the central HG, which is the dominant component at this wavelength, having masked the regions where the polar ring is still detectable. For the optical B-band image, both the HG and the polar ring light has been modeled.
The light distribution in the HG is modelled by a Sersic law (Sersic, 1968), to reproduce the bright nucleus,
| (1) |
plus an exponential law, to account for the disk-like structure detected in the high frequency residual images of A0136-0801 (see Fig. 2), given by
| (2) |
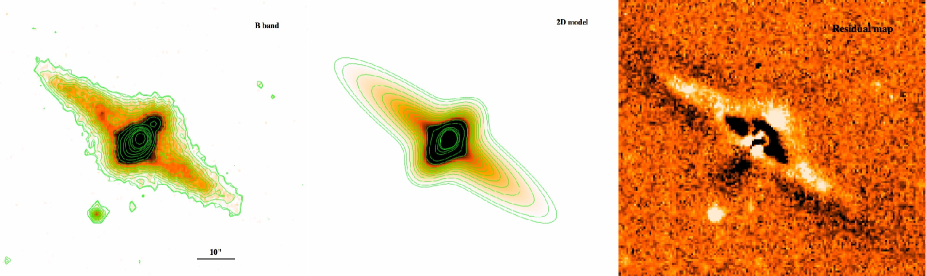
where is the galactocentric distance, and are the effective radius and effective surface brightness of the nucleus, and , and are the central surface brightness and scale length of the disk. In the B-band image, the 2D model accounts for both the light distribution of the HG (as described above) and polar structure. For this second component we used an exponential law, and derived the central surface brightness and scale length of the polar ring.
The maximum symmetric 2D model is made by using the GALFIT package (Peng et al., 2002), where all the structural parameters listed above, including also the total magnitudes, axial ratios and P.A.s are left free. A summary of the best-fit parameters for each component is listed in Table 4 and the results are shown in Fig. 5.
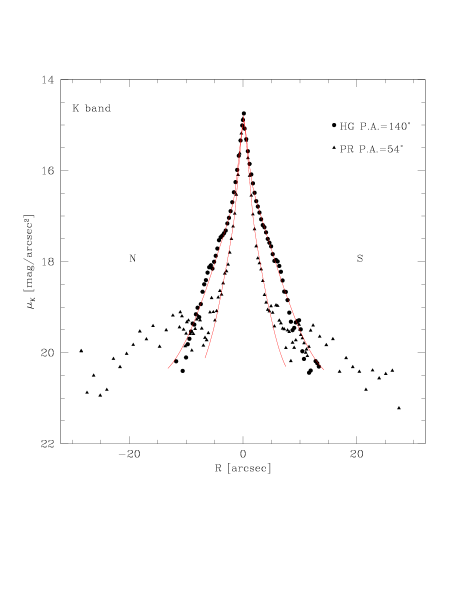
The morphology of the HG is well reproduced by the 2D model in the K band (see top-middle panel of Fig. 5). The best fit to the light distribution is obtained by the superposition of two component: a very concentrated bulge-like structure, with an effective radius of 1.12 arcsec ( kpc) and and exponential disk, with a scale length of about 3 arcscec ( kpc), see Table 4. The two components have similar flattening, but different P.A., consistent with the results of the isophote analysis (see Fig. 4). A twisted bulge-like component, in the central regions of the HG, is a real feature as suggested by the isophotal contours shown in top-right panel of Fig. 5. This misaligned structure is well reproduced by the 2D model in the K band (see top-middle panel of Fig. 5). The residual map (see top-right panel of Fig. 5), obtained by subtracting the 2D model from the original image, shows a nuclear sub-structure having an “s-shape”, elongated towards the polar direction, and two regions on both sides along the major axis of the HG where the galaxy is brighter than the model. The 2D residuals also clearly points out the low emission by the polar ring, which has been masked in the fitted image. Even if the optical B-band image is much more affected by the dust absorption, the 2D model of the light distribution reproduces consistently the morphology of both the HG and polar ring (see bottom-middle panel of Fig. 5). The scale radii of the two components in the HG (bulge-like and disk) are comparable with those derived by the fit of the K-band image (see Table 4). One interesting result is that the P.A. of the bulge-like nucleus is consistent with the P.A. found for the polar ring. The residual map of the B-band 2D model (see bottom-right panel of Fig. 5) also shows the luminous “s-shape” structure in the center, as already found in the residual map of the K-band model. The optical residual map shows several bright bumps along the polar ring, which are due to the star forming regions, and the loci where the two arms of the polar ring cross the HG, one on the SE side (behind the galaxy) and the other one on the NW side that passes in front of the HG, where the dust absorption is stronger. The comparison between the observed and fitted light profiles, in the B and in the K bands, along the HG major axis and along the polar ring, are shown in Fig. 6. The empirical laws for the main components observed in A0136-0801 are a good description of the average light distribution.
The implications of this analysis on the structure of A0136-0801, in particular the nature and the origin of the sub-structures identified in the residual maps, will be discussed in Sec. 7.
| Component | Model | P.A. | |||||||
|---|---|---|---|---|---|---|---|---|---|
| mag | mag arcsec-2 | mag arcsec-2 | arcsec | arcsec | degree | ||||
| (1) | (2) | (3) | (4) | (5) | (6) | (7) | (8) | (9) | (10) |
| K band | |||||||||
| HG - Bulge | Sersic | ||||||||
| HG - Disk | exp | ||||||||
| B band | |||||||||
| HG - Bulge | Sersic | ||||||||
| HG - Disk | exp | ||||||||
| PR | exp |
Col.1: Different components observed in A0136-0801. Col.2: Empirical law adopted to fit the light distribution for each component. Col.3: Total magnitude corresponding to each component. Col.4 - Col.8: Structural parameters that characterise each empirical law (i.e. effective surface brightness , effective radius and -exponent of the Sersic law, and central surface brightness and scalelength for the exponential law). Col.9 and Col.10: Average Position Angle and ellipticity of the isophote.
5 Color distribution and integrated magnitudes
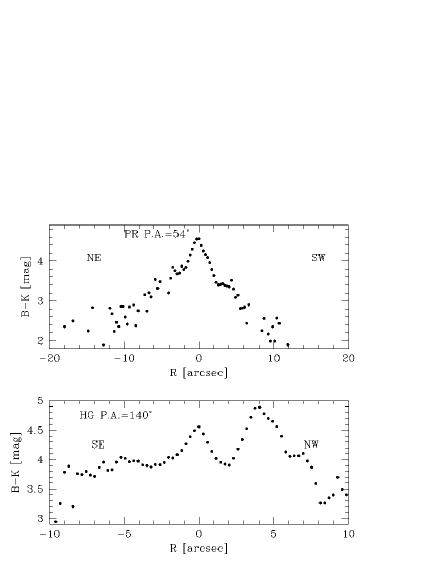
We have derived the B-K color profiles along the HG major axis, at , and along the polar structure, at , (see Fig. 7 left panel). The B-K color profiles show that nuclear regions of the galaxy, for arcsec, have the reddest colors, being mag in the center. At larger radii, B-K decreases. Along the HG major axis (see Fig. 7 bottom left panel), on the SE side, B-K color profile is almost constant in the range mag. On the NW side, for arcsec, the red bump corresponds to the strong absorption by the dust in the polar structure that passes in front of the HG (see also Fig. 2). The polar structure (see Fig. 7 top left panel), for arcsec is bluer than the HG, having 1.9B-K2.8 mag.
We derived the integrated magnitudes and J-K and B-K colors in three areas333To do this, was used the IRAF task POLYMARK to define each area and the task POLYPHOT to derive the integrated magnitude., as shown in Fig. 7 (right panel): one including the central HG of A0136-0801 and two including the NE and the SW sides of the polar structure. The three regions are traced on the B-band image, where the polar ring is much more luminous and extended with respect to the NIR images. Same polygons are adopted for all the other images (J and K bands), after they were registered and scaled to the B-band image. Total magnitudes were corrected for the extinction within the Milky Way, by using the absorption coefficient in the B band and the color excess E(B-V) derived from Schlegel et al. (1998). The absorption coefficients for the J and K bands are derived by adopting , and using the curve from Cardelli et al. (1989). The values of the absorption coefficients adopted for A0136-0801 are , and . Moreover, in order to estimate the extinction law in the polar structure, we adopted the procedure described by Iodice et al. (2004). In each band, we subtracted the unobscured part of the surface brightness profile (i.e. the northern side) from its obscured counterpart (the southern side), in order to obtain the “absorption profile” defined by
| (3) |
where is the observed intensity in the polar structure and is the intensity relative to the starlight with no dust obscuration. From this analysis we estimated the extinction coefficients mag, mag and mag, used to correct the measured magnitudes.
The difference between the intrinsic absorption derived from the Balmer line ratios and the , values derived from the photometry may be related with the different regions of the polar structure. While the is derived as an average quantity on both side of the major axis of the polar structure, and are computed locally in the obscured part of the HG where the polar ring passes in front of it.
Total magnitudes and colors and are listed in Table 5. The extinction corrected B-K integrated color for the HG derived in the area given above turns to be consistent with the same quantity estimated by the best fit 2D model of the light distribution for this component (see Sec. 4.2), which is mag.
| Component | Region | B-K | J-K | ||||||
|---|---|---|---|---|---|---|---|---|---|
| HG | center | 15.06 | 12.66 | 11.77 | -19.26 | -21.66 | -22.55 | 3.29 | 0.89 |
| PR | NE | 16.39 | 15.03 | 14.48 | -17.93 | -19.29 | -19.84 | 1.91 | 0.55 |
| PR | SW | 16.81 | 15.69 | 15.15 | -17.51 | -18.63 | -19.17 | 1.66 | 0.54 |
5.1 Stellar population analysis
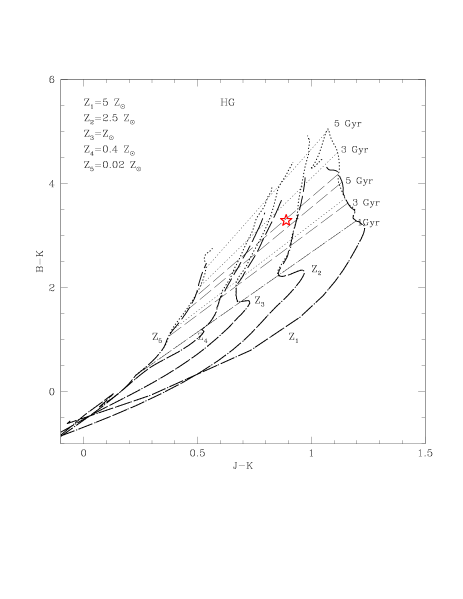
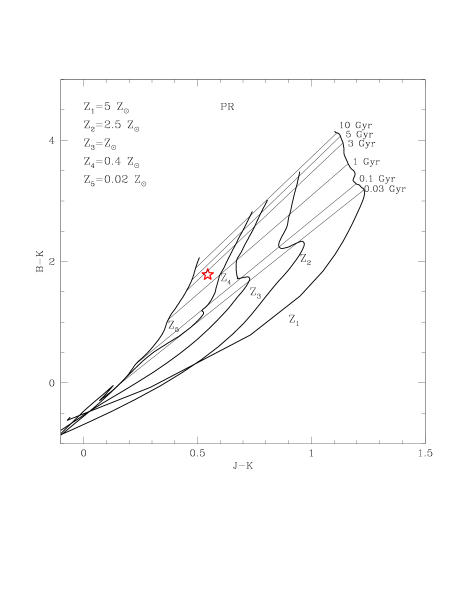
We aim to estimate the average (i.e. old plus the new bursts) stellar population ages of the HG and polar structure in A0136-0801, by using the integrated colors (optical vs NIR) measured for both components. Following the same approach of Iodice et al. (2002) and Iodice et al. (2002), we derived the B-K and J-K integrated colors (see Table 5). In the B-K versus J-K color diagram (shown in Fig. 8) are added the evolutionary tracks to reproduce the integrated colors in the central component and in the ring-like structures for a sample of PRGs, by using the stellar population synthesis model GISSEL444Galaxies Isochrone Synthesis Spectral Evolution Library (Bruzual & Charlot, 2003). The key input parameters adopted for GISSEL are the Initial Mass Function (IMF), the Star Formation Rate (SFR) and the metallicity. A detailed description of them is given by Iodice et al. (2002).
For the central HG was adopted a star formation history with an exponentially decreasing rate555It has the following analytical expression: , where the parameter quantifies the “time scale” when the star formation was most efficient., that produces a reasonable fit of the photometric properties of early-type galaxies in the local Universe. For the polar structure, which has usually bluer colors than the host galaxy and presents HII regions, a constant SFR, typically used for local spiral galaxies, is used. The evolutionary tracks for each model were derived for different metallicities (, , , and ), which were assumed constant with age.
The analysis of the B-K versus J-K color diagram (see Fig. 8, left panel) suggests that the stellar population in the HG in A0136-0801 could be dated from 3 to 5 Gyrs, and has a metallicity in the range . The polar ring has a younger age (from 1 to 3 Gyr) and a sub-solar metallicity, in the range , with respect to the HG. These values are comparable with those observed for the HGs and the PRs in the sample of PRGs in Iodice et al. (2002) and Iodice et al. (2002).
From the above models, we can derive the stellar mass-to-light ratio (M/L) in the B band, for both HG and polar ring in A0136-0801, in order to estimate the total baryonic mass (stars plus gas) for each component. For the central HG, the models predict an . From the total magnitude in the B band for the HG mag (see Table 5), the total stellar mass is M⊙. Given the absence of gas in this component, the baryonic mass coincides with the stellar mass. For the polar ring, the models predict an M. This component contains a large amount of gas ( M⊙ and M⊙, see Table 1), thus, taking into account the total magnitude in the B band, mag (see Table 5), the stellar mass is M⊙ and the total baryonic mass, stars plus gas, is M⊙. The importance of these estimates on the formation history for A0136-0801 is discussed in Sec. 7.
6 Oxygen abundances and SFR in the polar structure of A0136-0801
We have derived the Oxygen abundance parameter (Pagel et al., 1979), by following the procedure outlined by Spavone et al. (2010, 2011) and Spavone & Iodice (2013). According to Spavone & Iodice (2013, and references therein), we used the Empirical method introduced by Pilyugin (2001). This allow us to estimate the oxygen abundance and the metallicity of the HII regions of the polar structure in A0136-0801. We found for this galaxy .
Assuming the oxygen abundance and metallicity of the Sun, and (Grevesse & Sauval, 1998), given that , where , we obtain a metallicity for the HII regions in the polar structure of . This value turns to be consistent with the range of metallicities derived for the stellar population (), given in Sec. 5 (see also Fig. 8).
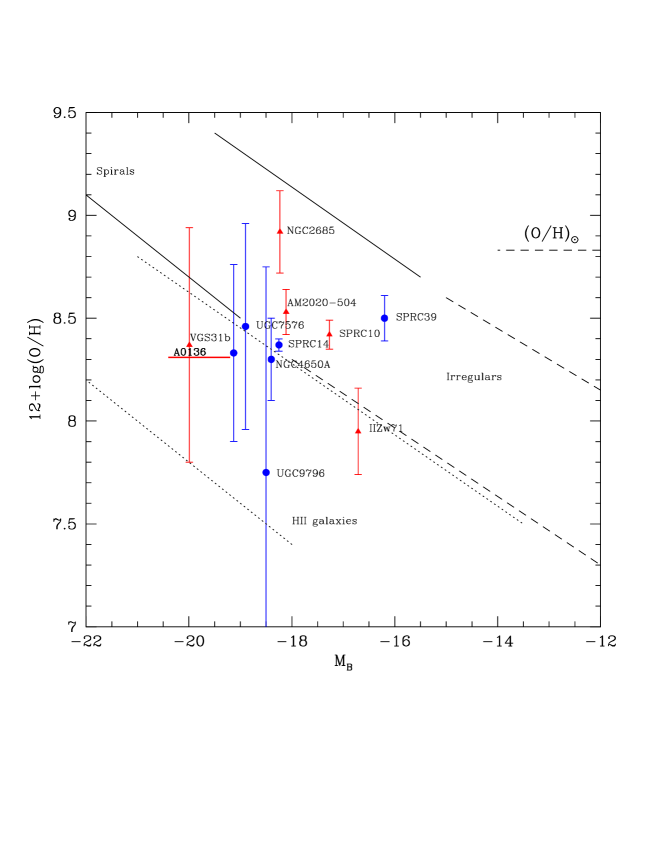
In Fig. 9 we compare the mean value of the oxygen abundance along the polar structure of A0136-0801, with those measured for different late-type galaxies by Kobulnicky & Zaritsky (1999)666The absolute blue magnitude for the objects in the sample of Figure 4 in Kobulnicky & Zaritsky (1999) are converted by using km/s/Mpc. (spirals, Irregulars and HII galaxies) and several PRGs, as a function of the total luminosity. The metallicity of the polar structure in A0136-0801 is comparable with that observed for both wide and narrow PRGs, which show a sub-solar values with respect to the mean metallicity of spiral galaxies with similar total luminosity. On average, taking into account the mean error on the oxygen abundances, PRGs are found in the region of low luminosity spirals or/and bright irregulars.
From the luminosity derived from emission lines with , using the expression given by Kennicutt (1998), we estimate the Star Formation Rate (SFR) for the polar structure of A0136-0801, this is . From the average value of erg/s we have obtained an average . This value of SFR has to be considered as a lower limit, since the long slit data give only lower limits to the luminosity, given that the slit usually covers only small area of the polar structure. A global estimate of the SFR in this component can be inferred from the Kron UV flux for A0136-801 from NED. We derive erg/s, with E(B-V) = 0.026 (Seibert et al., 2012), and from the Kennicutt law (Kennicutt, 1998), we obtain , which is a more reliable estimate for the SFR in the polar structure of A0136-0801.
As done in similar studies for other PRGs (Spavone et al., 2010, 2011; Spavone & Iodice, 2013), we checked whether the present SFR, and even 2 and 3 times higher can give the inferred metallicity of . To this aim, we adopted the linearly declining SFR, , where is the lookback time (Bruzual & Charlot, 2003). By using the mass-metallicity relation derived by Tremonti et al. (2004), we found that for A0136-0801 the expected metallicity is in the range . The implications of this result will be discussed in detail in Sec. 7.
7 Discussion and conclusions
We have carried out a detailed photometric study of the polar ring galaxy A0136-0801, based on new NIR, in the J and K bands, and optical, B and R bands, observations. Moreover, by using new long slit spectra, we have studied the chemical abundances in the polar structure of this galaxy. In this section we summarise the main results and discuss their implications on the formation history of A0136-0801.
7.1 Summary of the main results
The morphological analysis performed in this work shows that A0136-0801 has two main components, the central spheroid (the HG), with a bright nucleus, and a wide polar structure (see Fig. 2).
-
1.
The HG dominates the light in the NIR images and its structure can be well traced at all radii since the dust absorption due to the polar ring is negligible (see Fig. 2, right panel). In the optical images, the polar ring is much more luminous and it is at least two times more extended than the HG (see Fig. 2, left panel).
-
2.
The 2D models of the light distribution performed in both B and K bands have shown that the HG is characterised by a very concentrated bulge-like structure, with an effective radius of 1.12 arcsec ( kpc) and and exponential disk, with a scale length of about 3 arcscec ( kpc), see Table 4. The best fit to the light distribution of the polar structure has been obtained in the B band, with an exponential law, having a scale length of 13.3 arcsec ( kpc), which is four times larger than the scale length of the disk in the HG. The residual map, both in the dust-free K-band and in the B-band images, have revealed the existence of a nuclear sub-structure having an “s-shape” (see right panels of Fig. 5), elongated towards the polar direction.
-
3.
From the B-K color distribution, we found that the HG has redder colors with respect to the polar structure (see Fig. 7). In particular, the B-K color profiles show that nuclear regions of the galaxy, for arcsec, have the reddest colors, being mag in the center. On average, the HG has a mag. The polar structure (see Fig. 7 top left panel), for arcsec is bluer than the HG, having B-K mag.
-
4.
By using optical versus NIR colors (B-K vs J-K) and the stellar population synthesis models we estimated the age and metallicity of the stellar population in both components of A0136-0801. The constraints on the age and metallicity of the stellar population in the HG is within the range Gyrs, and . The polar ring has a younger age (from 1 to 3 Gyr) and a sub-solar metallicity in the range (see Fig. 8). From the above models we estimate the total baryonic mass, for both HG and polar ring in A0136-0801 (see Sec. 5), values are listed in Table 6.
-
5.
We derived the oxygen abundance and the metallicity of the HII regions of the polar structure in A0136-0801. We found and (see Sec. 6). This value turns to be consistent with the range of metallicities derived for the stellar population ().
7.2 Comparison of A0136-0801 with other PRGs
We discuss the observed properties of A0136-0801 with known PRG systems. The morphology of A0136-0801 is very similar to those of other PRGs with a wide polar structure, like NGC 4650A, UGC 7576 and UGC 9796. A detailed photometric analysis have shown that in UGC 7576 and UGC 9796 (Reshetnikov & Sotnikova, 1997; Godínez-Martínez et al., 2007) this component is a ring, while in NGC 4650A it is a disk (Iodice et al., 2002). As discussed above, the residual map obtained for A0136-0801 by the 2D model of the light distribution, shows a nuclear “s-shaped” structure, elongated towards the polar direction, which could be a sign of the polar structure reaching the HG center, as that observed in NGC 4650A (Iodice et al., 2002; Gallagher et al., 2002). Contrary to what the photometric analysis suggests, the integrated colors and metallicity of the stellar populations in the polar structure of A0136-0801 are quite different from those observed for the same component in NGC 4650A (Iodice et al., 2002; Spavone et al., 2010), being older and with higher metallicity. In Table 6 are also included the key physical parameters available for the wide PRGs mentioned above and for the narrow PRG AM2020-504.
All PRGs are characterised by a large amount of HI gas. The HI mass measured in A0136-0801 is of the same order of magnitude of those found for other PRGs ( M⊙), except NGC 4650A that is the PRGs with the highest HI mass ( M⊙). As found in A0136-0801 (see Sec. 5), the large baryonic mass in the HG with respect to that in the PR is an observed feature common to all PRGs, except for NGC 4650A, where the polar disk is twice as massive as the central spheroid. The HG in all wide PRGs, including A0136-0801, is supported by rotation, with , while the HG in the narrow PRG AM2020-504 is dominated by random motions. Overall, the metallicity of the polar structure in A0136-0801 is comparable with that observed for most of the wide and narrow PRGs, which show lower, i.e. sub-solar, values with respect to the metallicity in spiral galaxies of similar total luminosity (see Fig. 9). In particular, the metallicity in the polar structure of A0136-0801 is comparable with that measured for the wide PRG UGC 7576, while it is two times larger with respect to those estimated for UGC 9796. The narrow PRG AM2020-504 is among the PRG with the highest value of , which is close to the solar metallicity. As already pointed out by Iodice (2014), the differences in these key parameters are probably related to different formation processes.
7.3 Implications on the formation history of A0136-0801
In order to address the most reliable formation scenario for A0136-0801, below we compare and discuss how the observed properties for this galaxy, outlined in the present work, could compare with the predictions of different formation mechanisms for PRGs. In particular, we focus on the structure, i.e. the presence of a wide ring around a spheroidal object, on colors and ages for both HG and PR, on the observed kinematics and the gas content and metallicity in the polar structure.
As reviewed into Sec. 1, a PRG could form by the i) the disruption of a dwarf companion galaxy or of a gas-rich satellite, in the potential of an early-type system, or by the tidal accretion of gas stripped from the outskirts of a disk galaxy, ii) a dissipative merging of two disk galaxies, or iii) the accretion of cold gas from cosmic web filaments.
The key physical parameters that can discriminate between the different formation scenarios are i) the total baryonic mass (stars plus gas) observed in the polar structure with respect to the central spheroid, ii) the kinematics along both the equatorial and meridian planes, iii) the metallicity and SFR in the polar structure. For A0136-0801, all the above parameters are now available, obtained by the analysis performed in this work (i.e. the total baryonic mass and metallicity) and from literature (gas content and kinematics), they are listed in Table 6. The baryonic mass in the polar structure of A0136-0801 is less than that in the HG, being the ratio . The central HG is supported by rotation, with . The polar structure has a sub-solar metallicity ().
The tidal accretion scenario, in which the polar structure forms through the gas stripped from a gas-rich donor galaxy, in a high-inclined orbital configuration (Bournaud & Combes, 2003), is able to produce a wide polar ring as observed in A0136-0801. During this kind of interaction, the central HG does not change its original morphology and kinematics. So, as observed in A0136-0801, the remnant is an S0-like system, supported by rotation, with a polar structure. In this framework, in the field around the newly formed PRG the gas-rich donor galaxy should be still present. In the case of A0136-0801, inside a radius of about five times its diameter, as suggested by Brocca et al. (1997), there is a late-type galaxy PGC 6186 at a comparable redshift (see Fig. 1). This object is very poorly studied and only the apparent magnitude in the B band is given, which is 15.20 mag (see NED). There is no information on the gas content. Anyway, since this object has a comparable luminosity to that observed for A0136-0801, and it is classified as spiral, we expect that it has at the least the same, or even larger, baryonic mass of A0136-0801 (see Table 6). Thus, taking also into account that the value of derived for A0136-0801, is consistent with the metallicity of the very outer regions of bright spiral galaxies, which is in the range (Bresolin et al., 2009), PGC 6186 could be considered a possibile donor galaxy.
The gradual disruption of a dwarf satellite galaxy can be excluded as possible formation process for A0136-0801, because the baryonic mass estimated in the polar structure (, see Table 6) is at least 3 order of magnitude larger than the typical mass observed in dwarf galaxies ( Sawala et al., 2011). On the hand, if in the past A0136-0801 had a gas-rich satellite, with a mass of (Kunkel et al., 1996), like the Large Magellanic Cloud, it could be disrupted by the potential of the massive HG to form the polar structure.
In the merging scenario, the morphology and kinematics of the merger remnants depend on the initial orbital parameters and the initial mass ratio of the two merging galaxies (Bournaud et al., 2005). For A0136-0801, this scenario is ruled out because, according to simulations (e.g. Bournaud et al. 2005), a high mass ratio of the two merging galaxies is required to form a massive and extended polar ring as observed in A0136-0801. This would convert the intruder into an elliptical-like, not rotationally supported, stellar system. This prediction is in contrasts with the observed kinematics for the HG in A0136-0801.
Finally, we discuss whether the cold accretion scenario can reliable account for the observed properties of A0136-0801. This scenario predicts the formation of wide disk-like structures, characterised by a low, sub-solar metallicity. The open issue of this scenario concerns the nature of the polar structure: the simulations predict the formation of a polar disk, rather than annulus, around a puffed up disk (Macciò et al., 2006; Brook et al., 2008). The residual map, obtained for A0136-0801 by the the 2D model of the light distribution, have revealed the existence of a nuclear sub-structure having an “s-shape” (see right panels of Fig. 5), elongated towards the polar direction. If this feature is linked to the polar structure that reaches the galaxy center, this could be an hint for a polar disk in A0136-0801, but a definitive conclusion on the nature of the polar component in A0136-0801 cannot be reached on the basis of the photometry done. The kinematics mapping the inner regions777The kinematics published by Schweizer et al. (1983) is relative only to the outer arms of the polar structure and along the major axis of the HG. is also necessary to unveil the structure of this galaxy. Thus, the available data for A0136-0801 cannot allow us to discriminate between a ring or a disk. Anyway, even if the polar structure in this galaxy was a disk, it is characterised by an higher metallicity () than that predicted by the cold accretion scenario, which is (Snaith et al., 2012). Moreover, the metallicity estimated by using element abundances falls in the range of those expected by the SFR, which is (Sec. 6). Given that these values could further increase the metallicity of after 1 Gyr, we can rule out the cold accretion scenario for A0136-0801.
To conclude, even if the whole morphology of the polar ring galaxy A0136-0801 is very similar to that observed for NGC 4650A, both are classified as “wide PRGs”, the two system have a different formation history: the polar disk in NGC 4650A is reasonably formed by the cold accretion of gas along cosmic web filaments (Spavone et al., 2010), while for the PRG A0136-0801 the tidal accretion of material (gas and stars) from the outskirts of a donor galaxy, as well as the tidal disruption of a gas-rich satellite, are the most viable formation processes.
| PRG | Z | Ref. | |||||||
| km/s | km/s | ||||||||
| (1) | (2) | (3) | (4) | (5) | (6) | (7) | (8) | (9) | (10) |
| A0136-0801 | 23 | 11.8 | 145 | 0.9 | 67 | 1.95 | 1.6 | 0.32 | a, b |
| UGC7576 | 7.86 | 2.88 | 212 | 0.96 | 116 | 2.73 | 2.7 | 0.4 | c |
| UGC9796 | 10.0 | 3.05 | 157 | 1.08 | 73 | 3.28 | 2.6 | 0.1 | c |
| NGC4650A | 5 | 12 | 90 | 0.75 | 70 | 0.42 | 8.0 | 0.2 | d, e |
| AM2020-504 | 1.16 | 1.04 | 120 | 0.48 | 260 | 1.1 | 2.7 | 0.5-1 | f, g |
Col.1: PRG Col.2: Total baryonic mass in the central galaxy of the PRG. Col.3: Total baryonic mass in the polar structure. Col.4: Maximum rotation velocity along the major axis (equatorial plane) of the HG. Col.5: Ratio between the maximum rotation velocity along the equatorial and polar directions. Col.6: Central velocity dispersion of stars in the HG. Col.7: Ratio between the baryonic mass of the HG and polar ring. Col.8: Mass of the HI. Col.9: Metallicity of the HII regions in the polar structure. Col.10: References containing the values reported in the table.
c: Spavone et al. (2011) and references therein
Acknowledgements
We are very grateful to the anonymous referee for his/her comments and suggestions, which helped us to improve and clarify our work. M.S. wish to thank T. Pursimo for the support given during the data acquisition at NOT and D. Bettoni for many useful discussions and suggestions. E.I. wish to thank E. Pompei for the support given during the data acquisition at NTT. This work is based on observations made with ESO Telescopes at the Paranal Observatories under programme ID 70.B - 0253(A) and 74.B - 0626(A) . The authors wish to thank A. Watson for providing optical images analyzed in this work. The data presented here were obtained [in part] with ALFOSC, which is provided by the Instituto de Astrofisica de Andalucia (IAA) under a joint agreement with the University of Copenhagen and NOTSA.
References
- Arnaboldi et al. (1993) Arnaboldi M., Capaccioli M., Cappellaro E., Held E. V., Sparke L., 1993, A&A, 267, 21
- Arnaboldi et al. (1997) Arnaboldi M., Oosterloo T., Combes F., Freeman K. C., Koribalski B., 1997, AJ, 113, 585
- Bournaud & Combes (2003) Bournaud F., Combes F., 2003, A&A, 401, 817
- Bournaud et al. (2005) Bournaud F., Jog C. J., Combes F., 2005, A&A, 437, 69
- Bresolin et al. (2009) Bresolin F., Ryan-Weber E., Kennicutt R. C., Goddard Q., 2009, ApJ, 695, 580
- Brocca et al. (1997) Brocca C., Bettoni D., Galletta G., 1997, A&A, 326, 907
- Brook et al. (2008) Brook C. B., Governato F., Quinn T., Wadsley J., Brooks A. M., Willman B., Stilp A., Jonsson P., 2008, ApJ, 689, 678
- Bruzual & Charlot (2003) Bruzual G., Charlot S., 2003, MNRAS, 344, 1000
- Cardelli et al. (1989) Cardelli J. A., Clayton G. C., Mathis J. S., 1989, ApJ, 345, 245
- Cox & Sparke (2004) Cox A. L., Sparke L. S., 2004, AJ, 128, 2013
- Eskridge & Pogge (1997) Eskridge P. B., Pogge R. W., 1997, ApJ, 486, 259
- Freitas-Lemes et al. (2012) Freitas-Lemes P., Rodrigues I., Faúndez-Abans M., Dors O. L., Fernandes I. F., 2012, MNRAS, 427, 2772
- Gallagher et al. (2002) Gallagher J. S., Sparke L. S., Matthews L. D., Frattare L. M., English J., Kinney A. L., Iodice E., Arnaboldi M., 2002, ApJ, 568, 199
- Galletta et al. (1997) Galletta G., Sage L. J., Sparke L. S., 1997, MNRAS, 284, 773
- Godínez-Martínez et al. (2007) Godínez-Martínez A., Watson A. M., Matthews L. D., Sparke L. S., 2007, rmxaa, 43, 315
- Grevesse & Sauval (1998) Grevesse N., Sauval A. J., 1998, ssr, 85, 161
- Hancock et al. (2009) Hancock M., Smith B. J., Struck C., Giroux M. L., Hurlock S., 2009, AJ, 137, 4643
- Iodice (2014) Iodice E., 2014, in Iodice E., Corsini E. M., eds, Astronomical Society of the Pacific Conference Series Vol. 486 of Astronomical Society of the Pacific Conference Series, Narrow Polar Rings versus Wide Polar Ring/Diks Galaxies. p. 39
- Iodice et al. (2002) Iodice E., Arnaboldi M., De Lucia G., Gallagher III J. S., Sparke L. S., Freeman K. C., 2002, AJ, 123, 195
- Iodice et al. (2006) Iodice E., Arnaboldi M., Saglia R. P., Sparke L. S., Gerhard O., Gallagher J. S., Combes F., Bournaud F., Capaccioli M., Freeman K. C., 2006, ApJ, 643, 200
- Iodice et al. (2004) Iodice E., Arnaboldi M., Sparke L. S., Buta R., Freeman K. C., Capaccioli M., 2004, A&A, 418, 41
- Iodice et al. (2002) Iodice E., Arnaboldi M., Sparke L. S., Freeman K. C., 2002, A&A, 391, 117
- Iodice et al. (2002) Iodice E., Arnaboldi M., Sparke L. S., Gallagher J. S., Freeman K. C., 2002, A&A, 391, 103
- Kennicutt (1998) Kennicutt Jr. R. C., 1998, ARA&A, 36, 189
- Kobulnicky & Zaritsky (1999) Kobulnicky H. A., Zaritsky D., 1999, ApJ, 511, 118
- Kunkel et al. (1996) Kunkel W. E., Demers S., Irwin M. J., 1996, in American Astronomical Society Meeting Abstracts #188 Vol. 28 of Bulletin of the American Astronomical Society, The Mass of the Large Magellanic Cloud. p. 931
- Landolt (1983) Landolt A. U., 1983, AJ, 88, 439
- Macciò et al. (2006) Macciò A. V., Moore B., Stadel J., 2006, ApJL, 636, L25
- Moiseev et al. (2014) Moiseev A., Egorov O., Smirnova K., 2014, in Iodice E., Corsini E. M., eds, Astronomical Society of the Pacific Conference Series Vol. 486 of Astronomical Society of the Pacific Conference Series, The Sloan Digital Sky Survey Polar Ring Galaxy Catalogue: New Confirmations. p. 71
- Moiseev et al. (2011) Moiseev A. V., Smirnova K. I., Smirnova A. A., Reshetnikov V. P., 2011, MNRAS, 418, 244
- Pagel et al. (1979) Pagel B. E. J., Edmunds M. G., Blackwell D. E., Chun M. S., Smith G., 1979, MNRAS, 189, 95
- Peng et al. (2002) Peng C. Y., Ho L. C., Impey C. D., Rix H.-W., 2002, AJ, 124, 266
- Pérez-Montero & Díaz (2003) Pérez-Montero E., Díaz A. I., 2003, MNRAS, 346, 105
- Pérez-Montero et al. (2009) Pérez-Montero E., García-Benito R., Díaz A. I., Pérez E., Kehrig C., 2009, A&A, 497, 53
- Pilyugin (2001) Pilyugin L. S., 2001, A&A, 369, 594
- Reshetnikov & Sotnikova (1997) Reshetnikov V., Sotnikova N., 1997, A&A, 325, 933
- Richter et al. (1994) Richter O.-G., Sackett P. D., Sparke L. S., 1994, AJ, 107, 99
- Sackett & Pogge (1995) Sackett P. D., Pogge R. W., 1995, in Holt S. S., Bennett C. L., eds, Dark Matter Vol. 336 of American Institute of Physics Conference Series, Another flattened dark halo: Polar ring galaxy A0136-0801. pp 141–144
- Sawala et al. (2011) Sawala T., Guo Q., Scannapieco C., Jenkins A., White S., 2011, MNRAS, 413, 659
- Schlegel et al. (1998) Schlegel D. J., Finkbeiner D. P., Davis M., 1998, ApJ, 500, 525
- Schweizer et al. (1983) Schweizer F., Whitmore B. C., Rubin V. C., 1983, AJ, 88, 909
- Seibert et al. (2012) Seibert M., Wyder T., Neill J., Madore B., Bianchi L., Smith M., Shiao B., Schiminovich D., Rich R. M., Conrow T., Martin D. C., GALEX Catalog Team 2012, in American Astronomical Society Meeting Abstracts #219 Vol. 219 of American Astronomical Society Meeting Abstracts, The Galaxy Evolution Explorer (GALEX) Source Catalogs. p. 340.01
- Sersic (1968) Sersic J. L., 1968, Atlas de galaxias australes. Cordoba, Argentina: Observatorio Astronomico, 1968
- Snaith et al. (2012) Snaith O. N., Gibson B. K., Brook C. B., Knebe A., Thacker R. J., Quinn T. R., Governato F., Tissera P. B., 2012, MNRAS, 425, 1967
- Spavone & Iodice (2013) Spavone M., Iodice E., 2013, mnras, 434, 3310
- Spavone et al. (2010) Spavone M., Iodice E., Arnaboldi M., Gerhard O., Saglia R., Longo G., 2010, ApJ, 714, 1081
- Spavone et al. (2011) Spavone M., Iodice E., Arnaboldi M., Longo G., Gerhard O., 2011, A&A, 531, A21
- Swaters & Rubin (2003) Swaters R. A., Rubin V. C., 2003, ApJL, 587, L23
- Tremonti et al. (2004) Tremonti C. A., Heckman T. M., Kauffmann G., Brinchmann J., Charlot S., White S. D. M., Seibert M., Peng E. W., Schlegel D. J., Uomoto A., Fukugita M., Brinkmann J., 2004, ApJ, 613, 898
- van Driel et al. (2000) van Driel W., Arnaboldi M., Combes F., Sparke L. S., 2000, A&A, 141, 385
- van Driel et al. (2002) van Driel W., Combes F., Arnaboldi M., Sparke L. S., 2002, A&A, 386, 140
- Whitmore et al. (1990) Whitmore B. C., Lucas R. A., McElroy D. B., Steiman-Cameron T. Y., Sackett P. D., Olling R. P., 1990, AJ, 100, 1489