A 32-70 K formation temperature range for the ice grains agglomerated by comet 67P/Churyumov-Gerasimenko
Abstract
Grand Canonical Monte Carlo simulations are used to reproduce the N2/CO ratio ranging between 1.7 10-3 and 1.6 10-2 observed in situ in the Jupiter family comet 67P/Churyumov-Gerasimenko by the ROSINA mass spectrometer aboard the Rosetta spacecraft, assuming that this body has been agglomerated from clathrates in the protosolar nebula. Simulations are done using an elaborated interatomic potentials for investigating the temperature dependence of the trapping within a multiple guest clathrate formed from a gas mixture of CO and N2 in proportions corresponding to those expected for the protosolar nebula. By assuming that 67P/Churyumov-Gerasimenko agglomerated from clathrates, our calculations suggest the cometary grains must have been formed at temperatures ranging between 31.8 and 69.9 K in the protosolar nebula to match the N2/CO ratio measured by the ROSINA mass spectrometer. The presence of clathrates in Jupiter family comets could then explain the potential N2 depletion (factor up to 87 compared to the protosolar value) measured in 67P/Churyumov-Gerasimenko.
1 Introduction
The thermodynamic conditions prevailing in many bodies of the solar system suggest that clathrates could exist in the Martian permafrost (Thomas et al., 2009; Swindle et al., 2009; Mousis et al., 2013), on Titan (Choukroun & Sotin, 2012; Mousis et al., 2014), as well as in the interiors of other icy satellites (Kieffer et al., 2006; Hand et al., 2006). It has also been suggested that the activity observed in some cometary nuclei results from the dissociation of these crystalline structures (Marconi & Mendis, 1983; Smoluchowski, 1988; Marboeuf et al., 2010, 2011, 2012; Mousis et al., 2012). Several indirect evidences suggest that clathrates probably participated in the formation of planetesimals and the building blocks of giant planets in the outer solar system (Lunine & Stevenson, 1985; Mousis et al., 2010, 2014).
In the absence of experimental data existing at low-temperature (20–200 K) and low-pressure conditions (10-13–10-3 bar), which are typical of those encountered in planetary environments (Lunine & Stevenson, 1985; Sloan & Koh, 2008), clathrates are characterized via theoretical modeling. The approach usually employed in planetary science is based on the statistical mechanics model initially proposed by van der Waals & Platteeuw (1959), which makes use of simplified intermolecular potentials calibrated on equilibrium measurements performed at relatively high temperatures. In consequence, the use of these potentials at thermodynamic conditions relevant to those of the protosolar nebula (hereafter PSN) for predicting the composition of clathrates deserves to be confronted with more sophisticated approaches.
In this present work, we aim at reproducing the N2/CO ratio ranging between 1.7 10-3 and 1.6 10-2 observed in situ in the Jupiter family comet 67P/Churyumov-Gerasimenko (hereafter 67P) by the ROSINA mass spectrometer aboard the Rosetta spacecraft (Balsiger et al., 2007), which is found to be depleted by a factor up to 87 compared to the value of 0.148 hypothesized for the protosolar nebula (see below). By assuming that 67P has been agglomerated from clathrates, it is possible to derive the temperature range of formation of these crystalline structures in the PSN by mean of Grand Canonical Monte Carlo (GCMC) simulations based on elaborated interatomic potentials. These allowed us to investigate the temperature dependence of the trapping within a multiple guest (hereafter MG) clathrate formed from a gaseous mixture of CO and N2 in proportions corresponding to those expected for the protosolar nebula.
2 Computational details and simulation procedure
We assume multiple guest (MG) clathrate formation from a gaseous mixture composed of N2 and CO in proportions specified from a plausible protosolar gas phase composition. For this, we have assumed that both all C and N are in form of CO and N2 in the initial disk’s gas phase. This assumption is in agreement with thermochemical models of the protosolar nebula (Lewis & Prinn, 1980; Prinn & Fegley, 1989; Mousis et al., 2002). The use of C and N protosolar elemental abundances from the compilation of Lodders et al. (2009) allowed us to derive a gaseous mixture with mole fractions of 0.871 for CO and 0.129 for N2, giving a N2/CO ratio of 0.148 in the PSN.
The MG clathrate composition has been computed along its equilibrium pressure curve given by (Thomas et al., 2007; Mousis & Schmitt, 2008):
| (1) |
where is the mole fraction of species in the gas phase (here CO or N2) and the equilibrium pressure of single guest clathrate formed from component only.
The equilibrium pressures (in bar) are determined by using an equation based on an Arrhenius law (Miller, 1961):
| (2) |
where and are constant parameters depending on the nature of the species trapped in the clathrate and is the temperature (K). and have been determined by fitting the available theoretical and laboratory data (Mousis et al., 2008) and their values are given in Table 1. The calculated values of and partial pressures of CO () and N2 () are represented as a function of the inverse temperature in Fig. 1. Here, the equilibrium pressure of MG clathrate is in the 5.2 10-10–2.9 10-3 bar range when is varied between 52 and 100 K, respectively.
We have calculated the composition of N2–CO clathrates via Monte-carlo (MC) simulations in the Grand Canonical ensemble (GCMC) (Frenkel & Smit, 2002) for temperatures ranging from 52 to 100 K (the choice of this temperature range is explained in Sec. 3, but it is worth noting that, below 50 K, the equilibration time is in fact too long for the GCMC simulation), with an increment of 4 K between each computation. All our calculations have been performed in the case of Structure I (SI) clathrates (see structural details in Sloan & Koh (2008)). This choose has been motivated by the fact that CO is the dominating species in the gaseous mixture and is known to form Structure I single guest clathrate (Mohammadi, 2005).
In our system, the considered crystal size consists in 125 cubic unit cells (555), corresponding to 5,750 water molecules. The dimension of one parameter of the cubic simulation box is set equal to 60.15 Å during all our simulations. Periodic boundary conditions are applied to mimic infinite crystal. The water molecules are modeled using the well-known TIP4P/2005 model (Abascal & Vega, 2005), allowing them to translate and rotate during the simulation. Models for N2 and CO molecules are taken from Potoff & Siepmann (2001) and Piper et al. (1984), respectively. One hundred million MC steps were performed including insertion, deletion, translation and rotation of the molecules. Only the last 50 million steps were used to compute the data. The first 50 million steps have been discarded from the analysis and were only used to equilibrate the system.
From the knowledge of the partial pressure of each species (see Fig. 1), GCMC simulations have been performed to compute the composition of the MG clathrate. However, the number of MC steps needed to equilibrate the system strongly increases when temperature decreases. Simulation tests showed that below a temperature of 52 K, this number becomes even larger than the 50 million steps we simulated. At these low temperatures, statistically relevant results on the mole fractions of encaged molecules in our MC calculations thus become too time consuming. In consequence, below 52 K, these quantities have been evaluated via a thermodynamic extrapolation, described below, and fitted to the results computed at higher temperatures.
After the equilibration period, chemical equilibrium takes place between gas and clathrate. It is then possible to write an equilibrium constant for each species in the form:
| (3) |
where is the activity of species in clathrate defined from the mole fraction of species in clathrate () and its activity coefficient ( ) as . The evolution of with temperature should obey the Van’t Hoff relation:
| (4) |
where is the entrapping energy of CO or N2, and R the ideal gas constant.
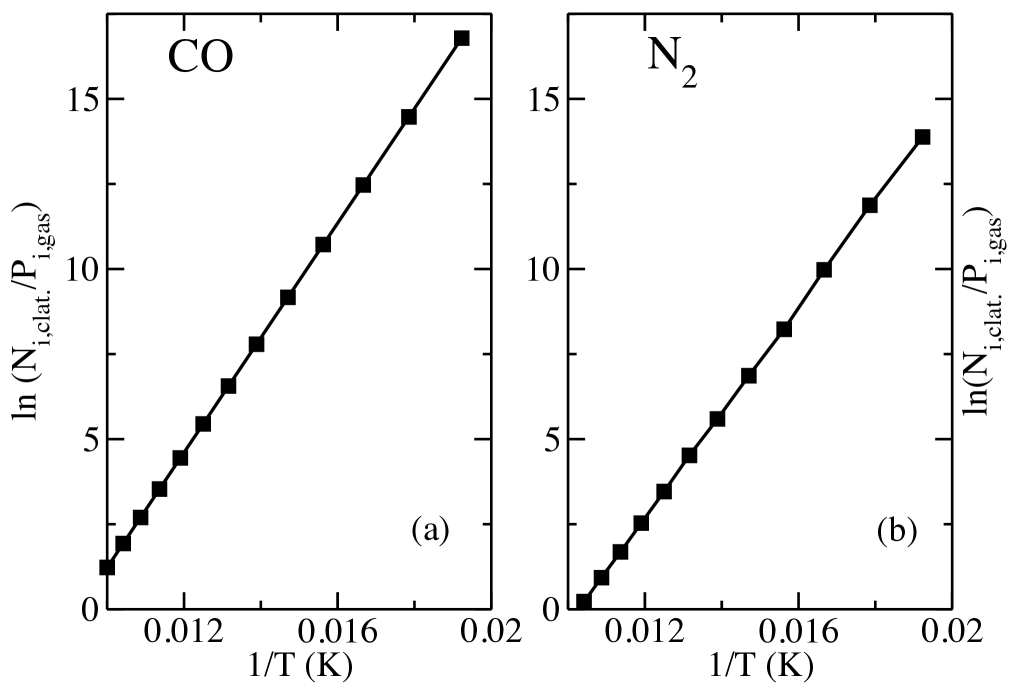
Under the simulated conditions, the occupancy of the clathrate cages is still maximum. We thus, obtained an amount of 8 molecules of CO and N2 per unit cell, implying that the total number of molecules trapped in clathrate is constant, independently of the temperature. By Neglecting the non ideal terms of the activity coefficient at first approximation, this allowed us to get and to rewrite Eq. 4 as follows:
| (5) |
with the number of encaged molecules of type . Our simulations allowed retrieving the values of and at temperatures higher than 52 K and provided us with a direct access to the different values of the quantity ln. Figure 2 represents these quantities plotted for CO and N2 as a function of . They show a linear behavior with a correlation coefficient higher than 0.999 for each species, in agreement with Eq. 5. The computed data have been fitted via the use of linear equations, allowing to find ln() = 1685.145/ - 15.617 and ln() = 1554.469/ - 15.972. The entrapping energies comes directly from the fit, R and R. These two linear equations have been used to estimate the ratio at temperatures lower than 52 K. Note that, for simplification, we will use below the abbreviation N2/CO for this ratio.
3 Results
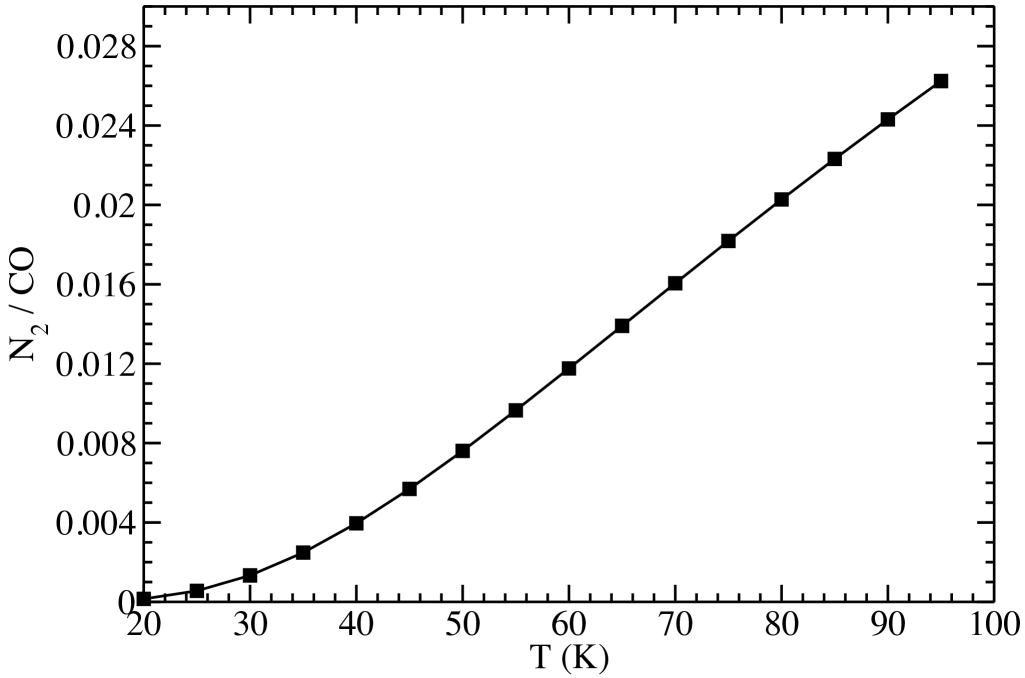
Figure 3 shows the evolution of N2/CO ratio as a function of temperature in the 20–100 K range. This ratio monotonically increases with the growing temperature. The figure exhibits a linear regime in the 50–100 K range whereas at lower temperatures, the curve trend is less steep and the ratio converges smoothly towards zero. The N2/CO ratio found is equal to 1.5 10-4 at 20 K. This value is 50 times smaller than at 50 K. In the temperature range considered here, the calculated N2/CO ratio is significantly lower than the ratio of 0.15 in the coexisting gas phase. This indicates that the clathrate formation favors the CO entrapping at the expense of N2. This behavior is related to the difference in entrapping energy between CO and N2. Indeed, being lower, the entrapping of CO is selectively favored when the temperature decreases.
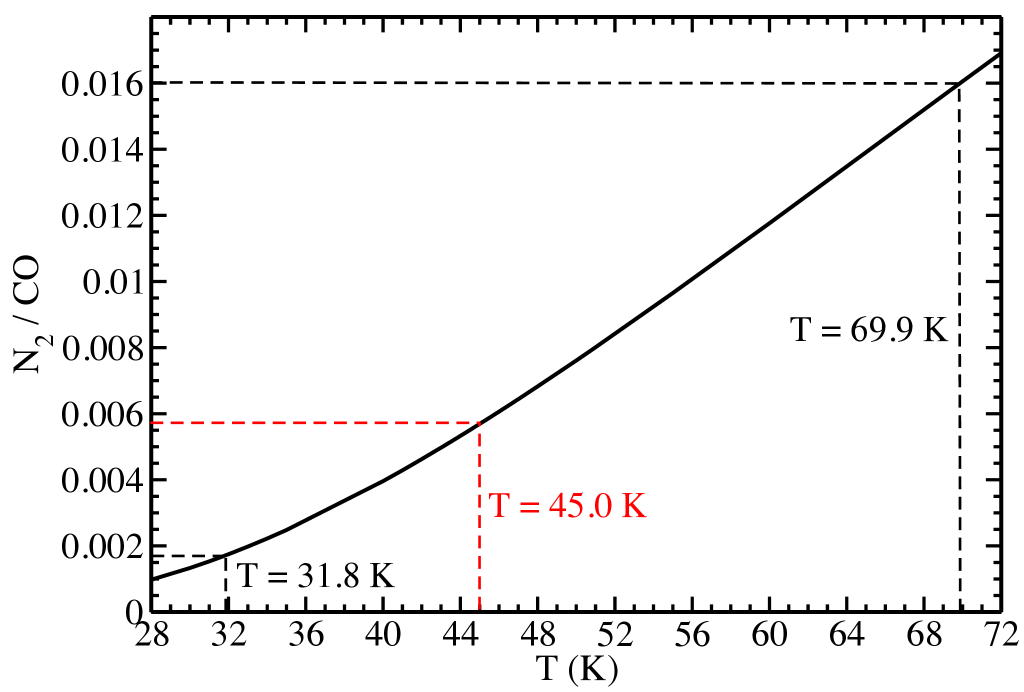
Figure 4 is a zoom of a portion of Fig. 3 given for easy reading of the correspondence between the N2/CO ratio measured in 67P by the ROSINA instrument and the formation temperature of the ice grains from which the comet agglomerated. Taking into account the strong variation of the N2/CO measurement between 0.17 to 1.6% depending on the position of the Rosetta spacecraft above the surface of the comet nucleus (Rubin et al., 2015), we find that the ice grains at the origin of 67P formed at temperatures ranging between 31.8 and 69.9 K in the protosolar nebula, with corresponding equilibrium pressures ranging between 6.0 10-19 and 2.1 10-6 bar. For the sake of information, the mean N2/CO ratio of 0.57% corresponding to the averaging of the 138 spectra obtained by Rubin et al. (2015) is represented on Fig. 4. The corresponding formation temperature of the ice grains is of 45 K in the PSN, with an equilibrium pressure of 3.3 10-12 bar.
4 Discussion and Conclusions
The composition of a MG clathrate formed from a gaseous mixture of N2 and CO in proportions corresponding to those expected for the protosolar nebula (87.1 % for CO and 12.9% for N2) has been investigated in the 20–100 K temperature range. Above 50 K, the clathrate composition has been computed via Grand Canonical Monte-Carlo simulations for pressures ranging from 5.2 10-10 to 2.9 10-3 bar. Below 50 K, the clathrate composition has been extrapolated via the use of a Van’t Hoff relation. The results show that, at thermodynamic conditions relevant to those of the protosolar nebula, CO has a much higher propensity than N2 to be trapped in clathrates. Assuming that 67P agglomerated from clathrates, our calculations suggest that the cometary grains must have formed at temperatures ranging between 31.8 and 69.9 K in the protosolar nebula to match the N2/CO ratio measured by the ROSINA mass spectrometer (Rubin et al., 2015).
Whilst narrower, the range of formation temperatures inferred from our model for the grains of 67P is consistent with the one (22–80 K) found from the reading of Fig. 2 of Mousis et al. (2012) who performed calculations of planetesimals compositions based on the classical statistical mechanics model of van der Waals & Platteeuw (1959). In the absence of experiments at this temperature range, the fact that these two different approaches lead to similar conclusions, namely that clathrates can explain the N2/CO ratio observed in 67P, suggest that this scenario is plausible. The presence of clathrates in Jupiter family comets could then explain the apparent N2 depletion (factor up to 87 compared to the protosolar value) measured in 67P.
References
- Abascal & Vega (2005) Abascal, J. L. F., & Vega, C. 2005, J. Chem. Phys., 123, 234505
- Balsiger et al. (2007) Balsiger, H., Altwegg, K., Bochsler, P., et al. 2007, Space Sci. Rev., 128, 745
- Choukroun & Sotin (2012) Choukroun, M., & Sotin, C. 2012, Geophys. Res. Lett., 39, L04201
- Frenkel & Smit (2002) Frenkel, D. & Smit, B., 2002, Understanding molecular simulation: from algorithms to applications, Elsevier
- Hand et al. (2006) Hand, D. P., Chyba, C. F., Carlson, R. W., & Cooper, J. F. 2006, Astrobiology, 6, 463
- Kieffer et al. (2006) Kieffer, S. W., Lu, X., Bethke, C. M., et al. 2006, Science, 314, 1764
- Lewis & Prinn (1980) Lewis, J. S., & Prinn, R. G. 1980, ApJ, 238, 357
- Lodders et al. (2009) Lodders, K., Palme, H., & Gail, H.-P. 2009, Landolt Börnstein, 44
- Lunine & Stevenson (1985) Lunine, J. I. & Stevenson, D. J. 1985, The Astrophysical J. Supplement Series, 58, 493
- Marboeuf et al. (2012) Marboeuf, U., Schmitt, B., Petit, J.-M., Mousis, O., & Fray, N. 2012, A&A, 542, AA82
- Marboeuf et al. (2011) Marboeuf, U., Mousis, O., Petit, J.-M., et al. 2011, A&A, 525, AA144
- Marboeuf et al. (2010) Marboeuf, U., Mousis, O., Petit, J.-M., & Schmitt, B. 2010, ApJ, 708, 812
- Marconi & Mendis (1983) Marconi, M. L., & Mendis, D. A. 1983, ApJ, 273, 381
- Miller (1961) Miller, S. L. 1961, Proceedings of the National Academy of Science, 47, 1798
- Mohammadi (2005) Mohammadi, A.H., Anderson, R., & Tohidi, B. 2005, Am. In. Chem. Eng., 51, 2825
- Mousis et al. (2014) Mousis, O., Lunine, J. I., Fletcher, L. N., et al. 2014, ApJ, 796, LL28
- Mousis et al. (2013) Mousis, O., Chassefière, E., Lasue, J., et al. 2013, Space Sci. Rev., 174, 213
- Mousis et al. (2010) Mousis, O., Lunine, J. I., Picaud, S., & Cordier, D. 2010, Faraday Discussions, 147, 509
- Mousis & Schmitt (2008) Mousis, O., & Schmitt, B. 2008, ApJ, 677, L67
- Mousis et al. (2008) Mousis, O., Alibert, Y., Hestroffer, D., et al. 2008, MNRAS, 383, 1269
- Mousis et al. (2012) Mousis, O., Guilbert-Lepoutre, A., Lunine, J. I., et al. 2012, ApJ, 757, 146
- Mousis et al. (2002) Mousis, O., Gautier, D., & Bockelée-Morvan, D. 2002, Icarus, 156, 162
- Piper et al. (1984) Piper, J., Morrison, J. A., & Peters, C. 1984, Molecular Physics, 53, 1463
- Potoff & Siepmann (2001) Potoff, J.J & Siepmann, I. 2001, AICHE J., 47, 1676
- Prinn & Fegley (1989) Prinn, R. G. P., & Fegley, B., Jr. 1989, Origin and Evolution of Planetary and Satellite Atmospheres, 78
- Rubin et al. (2015) Rubin, M., Altwegg, K., Balsiger, H., et al. 2015, Science, DOI:10.1126/science.aaa6100
- Sloan & Koh (2008) Sloan, E. D. & Koh, C. A. 2008, Clathrate Hydrates of Natural Gases, 3rd ed.; CRC Press, Taylor & Francis Group, Boca Raton
- Smoluchowski (1988) Smoluchowski, R. 1988, MNRAS, 235, 343
- Swindle et al. (2009) Swindle, T. D., Thomas, C., Mousis, O., Lunine, J. I., & Picaud, S. 2009, Icarus, 203, 66
- Takeuchi et al. (2013) Takeuchi, F., & Hiratsuka, M., Ohmura, R., Alavi, S., Amadeu, K. S. et al. 2013, J. Chem. Phys., 138, 124504
- Thomas et al. (2009) Thomas, C., Mousis, O., Picaud, S., & Ballenegger, V. 2009, Planet. Space Sci., 57, 42
- Thomas et al. (2007) Thomas, C., Mousis, O., Ballenegger, V., & Picaud, S. 2007, A&A, 474, L17
- van der Waals & Platteeuw (1959) van der Waals, J. H., & Platteeuw, J. C., 1959, Advances in Chemical Physics, 2, 1
| Molecule type | / (K) | |
|---|---|---|
| CO | -1685.54 | 10.9946 |
| N2 | -1677.62 | 11.1919 |