Benchmarking the cost of thread divergence in CUDA
Abstract
All modern processors include a set of vector instructions. While this gives a tremendous boost to the performance, it requires a vectorized code that can take advantage of such instructions. As an ideal vectorization is hard to achieve in practice, one has to decide when different instructions may be applied to different elements of the vector operand. This is especially important in implicit vectorization as in NVIDIA CUDA Single Instruction Multiple Threads (SIMT) model, where the vectorization details are hidden from the programmer. In order to assess the costs incurred by incompletely vectorized code, we have developed a micro-benchmark that measures the characteristics of the CUDA thread divergence model on different architectures focusing on the loops performance.
Index Terms:
GPU, CUDA, multithreading, SIMT, SIMDI Introduction
Most of the current processors derive their performance from some form of SIMD instructions. This holds true for Intel i-Series and Xeon processor (8 lanes wide AVX instruction), Intel Xeon Phi accelerator (16 lanes wide AVX instructions), AMD Graphics Cores Next (64 lanes wide wavefronts) and NVIDIA CUDA (32 lanes wide warps). By the very nature of those instructions all the operations on a vector are performed in parallel, at least conceptually. That provides a constraint on the class of algorithms that can be efficiently implemented on such architectures. If we want to perform different operations on the different components of the vector operands we are essentially forced to issue different instructions masking the unused components in each of them which of course carries a performance penalty. The aim of this paper is to asses those cost. We will concentrate on the NVIDIA CUDA as that is the architecture that we use in our current work[1].
The CUDA and OpenCL programming models make thread divergence very easy to achieve as they rely on implicit vectorization. They model the computing environment as a great number of threads executing a single program called kernel[2], and to the programmer this may look as an multithreaded parallel execution. In fact the CUDA Programming Guide states: “For the purposes of correctness, the programmer can essentially ignore the SIMT behavior; however, substantial performance improvements can be realized by taking care that the code seldom requires threads in a warp to diverge.”
On NVIDIA architectures threads are grouped warps of 32 threads that must all execute same instructions in essentially SIMD (vector) fashion. This entails that any branching instruction with condition that does not give the same result across the whole warp leads to thread divergence - while some threads take one branch other do nothing and then the other branch is taken with roles reversed. This is a picture given in the NVIDIA programming guide, which warns against thread divergence but otherwise is missing any details. Only in the Tesla architecture white-paper it is mentioned that this is achieved using a branch synchronization stack [2].
As the strict avoidance of thread divergence would severely limit the algorithms that could be implemented using CUDA, it would be interesting to check what are the real costs. The necessity of following two branches is one obvious performance obstacle. We will be however interested in the overhead associated with the re-convergence mechanism itself as manifested in loops.
Loops, which are probably the most used control statement in programming, are an interesting example. While it is easy to picture the two way branching model as in a if else statement, it is much harder to follow the execution of loops, especially nested. In this contribution we will benchmark the performance of single and double loops with bounds that are different across the threads. While such model is discouraged in CUDA programming it can nevertheless appear naturally while porting an existing multi-core algorithm to GPU. To our best knowledge such measurements were not published up to this date. We have only found some data in reference [3] but not the explicit timings of the synchronization stack operations. We will analyze our results in view of the best information on the CUDA thread divergence model that we have found.
This paper is organized as follows: In the next section we present the setup we used for benchmarking the execution of single and double loop kernel. Then we present the CUDA stack based re-convergence mechanism and in the last section we use it to analyze our results.
II Timings
II-A Single loop
Our first test consisted of running single loop using the kernel from Listing 1. Each thread of a warp (we used only one warp) runs through the same loop but with upper limit, denoted by , set individually for each thread. We measured the number of cycles taken by the loop using the CUDA clock64() function, repeating our loop N_UNROLL times if needed. We have also added a possibility to run same loop N_PREHEAT times before making the measurements. We have repeated each measurement 256 times and used those samples to estimate the error. We have found out that when using N_PREHEAT=1 we had essentially zero errors even with N_UNROLL=1 . When no "preheating" was used the results were more erratic, with difference of few cycles between the samples.
We start our measurements with all loops having same upper limit of (no divergence). Next we decrease the upper limit for one of the threads and continue until all threads in warp have different upper bounds (see Table I).
| tid | ||||||||||||||||||||||||||||||||
|---|---|---|---|---|---|---|---|---|---|---|---|---|---|---|---|---|---|---|---|---|---|---|---|---|---|---|---|---|---|---|---|---|
| 0 | 1 | 2 | 3 | 4 | 5 | 6 | 7 | 8 | 9 | 10 | 11 | 12 | 13 | 14 | 15 | 16 | 17 | 18 | 19 | 20 | 21 | 22 | 23 | 24 | 25 | 26 | 27 | 28 | 29 | 30 | 31 | |
| M | ||||||||||||||||||||||||||||||||
| 0 | 32 | 32 | 32 | 32 | 32 | 32 | 32 | 32 | 32 | 32 | 32 | 32 | 32 | 32 | 32 | 32 | 32 | 32 | 32 | 32 | 32 | 32 | 32 | 32 | 32 | 32 | 32 | 32 | 32 | 32 | 32 | 32 |
| 1 | 32 | 32 | 32 | 32 | 32 | 32 | 32 | 32 | 32 | 32 | 32 | 32 | 32 | 32 | 32 | 32 | 32 | 32 | 32 | 32 | 32 | 32 | 32 | 32 | 32 | 32 | 32 | 32 | 32 | 32 | 32 | 31 |
| 2 | 32 | 32 | 32 | 32 | 32 | 32 | 32 | 32 | 32 | 32 | 32 | 32 | 32 | 32 | 32 | 32 | 32 | 32 | 32 | 32 | 32 | 32 | 32 | 32 | 32 | 32 | 32 | 32 | 32 | 32 | 31 | 30 |
| 28 | 32 | 32 | 32 | 32 | 31 | 30 | 29 | 28 | 27 | 26 | 25 | 24 | 23 | 22 | 21 | 20 | 19 | 18 | 17 | 16 | 15 | 14 | 13 | 12 | 11 | 10 | 9 | 8 | 7 | 6 | 5 | 4 |
| 29 | 32 | 32 | 32 | 31 | 30 | 29 | 28 | 27 | 26 | 25 | 24 | 23 | 22 | 21 | 20 | 19 | 18 | 17 | 16 | 15 | 14 | 13 | 12 | 11 | 10 | 9 | 8 | 7 | 6 | 5 | 4 | 3 |
| 30 | 32 | 32 | 31 | 30 | 29 | 28 | 27 | 26 | 25 | 24 | 23 | 22 | 21 | 20 | 19 | 18 | 17 | 16 | 15 | 14 | 13 | 12 | 11 | 10 | 9 | 8 | 7 | 6 | 5 | 4 | 3 | 2 |
| 31 | 32 | 31 | 30 | 29 | 28 | 27 | 26 | 25 | 24 | 23 | 22 | 21 | 20 | 19 | 18 | 17 | 16 | 15 | 14 | 13 | 12 | 11 | 10 | 9 | 8 | 7 | 6 | 5 | 4 | 3 | 2 | 1 |
The results of the measurements as a function of are presented in the Figure 1. We have tested three CUDA architectures (see Table II). We have found out that the number of cycles depended only on the architecture or Compute Capability of the card, not on the particular device. We have used CUDA 7.0 environment for all our test. We have compiled our benchmarks using the -arch=sm_20 -Xptxas -O3 flags, as sm_20 architecture did not change the results, but produced no undefined instructions in the cuobjdump disassembly listing, contrary to sm_30.
There are two interesting things on this plot to take notice of, apart from the fact that GPU are getting faster with each new architecture. Firstly although the longest loop has always same upper bound () the time increases linearly with each new divergent thread. This is a clear signal of an additional cost associated with the divergence, as in fact there is altogether less work done by the threads. Secondly this cost of thread divergence is proportional to the number of divergent threads, up to , then it exhibits several "jumps" every four steps, at least for the two newest architectures (Kepler, Maxwell). The behavior on the Fermi architecture is slightly different, but we will be not concerned with this architecture in this contribution, and provide the plots only for comparison.
| architecture | device |
|---|---|
| Fermi | GTX 480, GT 610 |
| Kepler | GT 650M, GT 755M, GTX 770 |
| Maxwell | GTX 850M |
II-B Double loop
On our second test we used a kernel with nested loops, again the loops upper bounds were set individually for each thread of the warp (see Listing 2). We used same patterns as for the single loop (Table I) setting both loops bounds to the same value (). The timings are presented in the Figure 2. We can observe a similar pattern as in the single loop case. The number of cycles at first increases smoothly with the number of divergent threads, and then exhibits "jumps" every four steps.
III CUDA divergence model
To understand the observed behavior it is necessary to find out the details of the CUDA thread divergence/re-convergence model. This is not explicitly stated by NVIDIA apart from brief mention of the branch synchronization stack in [2]. A more detailed description can be found in references [4, 5, 6, 7] and [8]. There it was established that the CUDA implementation follows the approach described in US patents [9] and [10]. In here we briefly describe this algorithm. Our description is based on reference [10]. We choose reference [10] over [9] because of the SSY instruction specification. While in [9] it is described as taking no arguments, cuobjdump listing shows that it expects one argument which matches the description in [10]. We concentrate only on one type of control instruction which is relevant to our example: the predicate branch instruction, ignoring all others.
Scalar Multiprocessor (SMX) processor maintains for each warp an active mask that indicates which threads in warp are active. When about to execute a potentially diverging instruction (branch) compiler issues one set-synchronization SSY instruction. This instruction causes new synchronization token to be pushed on the top of synchronization stack. Such token consist of three parts: mask, id and program counter (pc) and takes 64 bits - 32 of which are taken by the mask. In case of the SSY instruction the mask is set to active mask, id to SYNC and pc is set to the address of the synchronization point. The actual divergence is caused by the predicated branch instruction which has form @P0 BRA label which translates to the pseudocode in Algorithm 1. The P0 is a 32bit predicate register that indicates which threads in the warp should execute (take) the branch.
The instructions are executed according to the pseudocode in the Algorithm 2. The instruction may have a pop-bit set, also denoted as synchronization command, indicated by the suffix .S in the assembler output. The instruction which is suffixed with .S will be called a carrier instruction. When encountered it signals the stack unwinding. The token is popped from the stack and used to set the active mask and the program counter. The reference [10] does not specify exactly when carrier instructions are executed, before or after popping the stack, so we have assumed that this is done after unwinding the stack. Actually in both kernels that we have studied this carrier instruction is NOP, but this is not necessarily the case in general.
Summarizing: SSY and predicated branch instructions (only if some active threads diverge) push token onto the stack and the synchronization command pops it.
IV Analysis
We will try to understand the results of benchmarks from Section II in view of the implementation described in Section III. We begin with disassembling the kernels. The results are presented in Listings 3 and 4. We have included only the relevant portions of the assembler code.
Looking at the listing 3
we notice all the instructions described in the previous section. To better understand what is happening here we will make a "walk-through" this listing assuming .
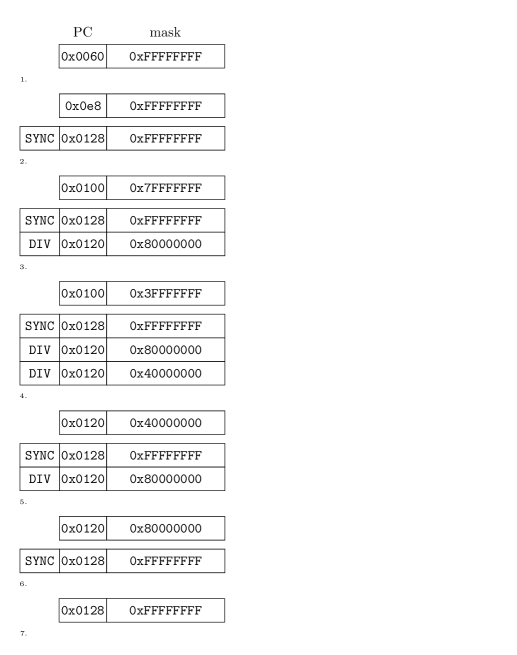
We start on line 1, all bits in the active mask are set and the stack is empty (Figure 3.1). The predicate register P0 is set to the result of the comparison . In our test this condition is never fulfilled so all bits of P0 are cleared.
As line 4 contains a potentially diverging instruction a SSY instruction is issued on line 3 with address pointing past the loop to the line 12. The active mask and the address are pushed onto the stack (Figure 3.2).
On line 4 we have a predicated branch instruction, but as the register P0 is all false, this does not produce any divergence, and so does not change the active mask and does not push any token on the stack. The control then moves on to the next instructions.
Ignoring two NOPs the next instruction on line 7 increments the loop counter in register R4, which was set to zero by an instruction not shown on the listing. Next instruction on line 8 performs the addition.
On line 9 register P0 is set to the result of testing the loop condition . On next line this register is used to predicate the branch instruction. As all bits in P0 are set and the branch is taken by all threads and no token is pushed onto the stack. All the threads are active. The control jumps to line 7 when the loop counter is again incremented. This continues until without any changes to the stack.
When the condition on line 9 fails for the last thread of the warp and last bit of the P0 is cleared (P0=0x7FFFFFFF). The branch on line 10 instruction is now diverging so a DIV token is pushed on the stack with mask set to !P0=0x80000000 (not taken mask) and address equal to PC+1 (line 11) (Figure 3.3). The active mask is set to P0 which disables the thread 31 and the execution jumps to line 7. Then the loop counter is incremented to 31, but only in the active threads.
At line 9 the as the comparison fails for thread 30. The predicate register P0 will have its bit 30 cleared (P0=0x3FFFFFFF) so not all active threads will take the branch on line 10. Again a DIV token will by pushed on the stack with mask set to not taken mask (0x7FFFFFFF &!0x3FFFFFFF = 0x40000000) and PC=0x0120. Then the active mask is set to P0=0x3FFFFFFF disabling threads 30 and 31 and control jumps to line 7 (Figure 3.4).
The loop counter is incremented again to 32 so all bits of the predicate P0 are cleared. There is no divergence in branch on line 10 as none of the active threads take the branch and the control moves to line 11.
The NOP instruction on line 11 has pop-bit set, so a token is popped from the stack. The active mask is set to the token mask and PC to the token’s PC. The NOP instruction is executed. And the control jumps again to line 11 that was the token program counter (Figure 3.5). Stack is popped again and after executing the NOP instruction the control goes back to line 11 (Figure 3.6).
Then the last item is popped from the stack. This is the SYNC token that restores the 0xFFFFFFFF active mask and sets the PC to line 12, ending the loop (Figure 3.7).
This walk-through lets us see the general pattern: as is increased we start pushing DIV tokens on the stack earlier and earlier at each iteration through the loop and the stack unwinding takes place at the end. The total number of push/pop instructions is (the SYNC instruction always pushes token on the stack) and the maximum stack size is also . This is illustrated on the Figure 4 were we plot the stack history showing the length of the stack as a function of the number of executed instructions. This figure was obtained using a very simple emulator implementing the algorithms 1 and 2.
We have also instrumented our code using CUPTI API from NVIDIA[11]. While this API cannot show the push/pop instructions, we have found out that for the number of executed instructions indeed increases by one with increasing and that this is due to the increasing number of executions of stack unwinding instruction NOP.S on line 11. This corresponds with the linear raise of the number of cycles taken by the loop, as show in the Figure 1. By fitting to the first 16 points we have found out that the penalty for one diverging branch is exactly 32 cycles on Kepler (see the continuous line in the Figure 1) and 26 cycles on Maxwell. Those 32 cycles include pushing the token on the stack, executing a synchronization command and popping the stack. In section IV-A we will take a more detailed look at how exactly those cycles are divided between those operations.
Looking again at the Figure 1 we notice that the first jump occurs when length of the stack exceeds 16 i.e. when . We can assume that this is the physical length of the fast on chip memory allocated for stack, and growing the stack longer requires spilling the entries into some other memory (as mentioned in [10]). After this jump the number of cycles again increases by 32 at each step for the next four entries leading us to assume that the entries are spilled four at the time e.g. in chunks of 32 bytes. This is exactly the length of the L2 cache line suggesting that the entries are spilled to the global memory. This would also explain why running a preheat loop before measurements reduces the overall number of cycles taken by the loops and makes the measurements deterministic, as it populates the cache.
We have assumed that during a push that would overflow the stack, the four lowest entries are spilled into the global memory leaving the room for new four highest entries. Likewise when popping the stack would require access to elements that were spilled, they are loaded back from the memory. We have implemented this scenario in our emulator. Comparing that with the timing measurements we have found out that the spilling and loading back takes together around 84 cycles on Kepler architecture and 176 cycles on Maxwell.
Using the CUPTI API we have looked for additional load/store or cache hit/miss instructions that would indicate the spill into the global memory, but found none, however we have noticed appearance of some additional branch instructions. Those instruction did not show up in the execution trace, so could not be attributed to the particular instructions. The number of those additional instructions was however exactly equal to the number of spills. Without the detailed knowledge of NVIDIA micro-architecture it is impossible to ascertain the meaning of those instructions. One plausible explanation would be that the branch instructions are reissued after the stack content is spilled to memory.
We did same analysis for the double loop kernel using the disassembly presented in Listing 4.
This is a more complicated case as illustrated by the stack history presented in the Figure 5.
The maximum length of the stack is now and we have found out that the number of push operations is (see the continuous line on Figure 2).
As in the single loop case we have found out that additional number of branch instructions is executed and this number is exactly predicted by the number of spills (see Figure 6).
Using the parameters obtained from the single loop measurements we used our emulator to predict the timings of the double loop kernel. The results are presented in the Figure 7. The agreement while not perfect is still very good (76 cycles difference in the worst case which amounts to ). Looking at the Figure 8 we see that the difference between the actual and predicted number of cycles follows a very regular pattern and happens only on spill occurrence, suggesting some simple mechanism contributing to the exact number of cycles needed to perform stack spill depending on previous spills history.
IV-A Detailed timings
In the previous section we have calculated the costs associated with diverging predicated branch instructions. That was the total cost associated with pushing and popping the stack as well as executing the synchronization command carrier instruction. In this section we are attempting a more detailed view. To this end we will use the kernel from listing 5.
This is essentially the single loop kernel with additional timing instruction inserted inside the loop (line 17). According to the walk-through in the previous section those instructions should be executed before unwinding the stack, while the last instruction on line 21 should be executed after.
At first we did not include the synchronization command on line 20, as we deemed it unnecessary within one warp. The results were however not compatible with the previous ones. Inspection of the disassembly in listing 6 reveled that actually all the timing instructions were executed before the stack unwinding triggered by the synchronization command on line 34.
Adding the __syncthreads() instruction on line 20 solved the problem. The overall results now matched the results from the previous section. Of course the total times differed substantially as the code had now extra instructions, but the differences in number of cycles between the runs with various values of were identical for (no spills) and differed by few cycles for .
We have gathered the timelines for each and each thread in warp but we used only the timings for thread 0 – the one that always iterates 32 times through the loop. We have found out that when there were no spills () then the total cost was last code segment: the unwinding of the stack. There was no cost associated with predicated brach instruction i.e. the push operation. This may be explained by the fact that the latency of push operation can be hidden as the token pushed onto the stack is not needed by the next instruction. While unwinding the stack however the popped token is used immediately to set active mask and PC. Additionally the carrier instruction has to be executed, even if this is a NOP it still has to be fetched an decoded.
When was greater then , i.e. the stack was spilled in the memory, the cost were divided between the branch instruction that now took around 40 cycles longer and stack unwinding that now took around 42 cycles longer. This corresponds well with the overall 84 cycles penalty estimated in the previous section.
V Summary
The Single Thread Multiple Threads (SIMT) programming model introduced by NVIDIA with CUDA technology gives the programmer an illusion of writing a multithreaded application. In reality the threads are executed in groups of 32 threads (warps) performing essentially vector operations. The illusion of multithreading is maintained by an elaborate mechanism for managing the divergent threads within a warp. This mechanism is completely hidden from the programmer and no description is provided by NVIDIA in their programming guide. In this contribution we have presented a detailed study of two CUDA kernels leading to a large thread divergence. Following other sources, we have assumed that the management of the diverging threads is based on a synchronization stack and follows closely the idea described in reference [10] which is a NVIDIA owned patent. That assumption allowed us to fit the observed execution times with accuracy better then .
We have estimated the cost of a diverging branch instruction to be exactly 32 cycles on Kepler architecture provided that the maximum stack length did not exceed 16. After that stack entries had to be spilled into memory which carried an additional penalty of cycles. On Maxwell the estimated cost of branch divergence was considerably shorter: only cycles, but the cost of spilling was much higher cycles. More detailed timings are suggesting that all of that cost, in case of no spills, can be attributed to stack unwinding.
We also performed the measurements on Fermi architecture, there the pattern seems to be slightly different suggesting that the physical thread synchronization stack length is shorter in this architecture.
We have analyzed only a very specific case: loops with different bounds across the threads, this is however a quite natural scenario. We would like to emphasize that in this case the additional costs reported by us are the costs of the divergence management mechanism alone, excluding additional penalty of incomplete vectorization. Nevertheless they implied an overhead of in case of 14 diverging threads for the double loop kernel and for the single loop. In the more general case there would be additional costs associated with the serialization of the different branches.
Our work was confined to NVIDIA CUDA technology it would be however interesting how this corresponds to shader programming both in DirectX and OpenGL and we are planning to extend our work in this direction in the future.
References
- [1] P. Białas, J. Kowal, A. Strzelecki et al., “GPU accelerated image reconstruction in a two-strip J-PET tomograph,” arXiv preprint arXiv:1502.07478, 2015.
- [2] E. Lindholm, J. Nickolls, S. Oberman, and J. Montrym, “NVIDIA Tesla: A unified graphics and computing architecture,” IEEE Micro, vol. 28, no. 2, pp. 39–55, 2008.
- [3] H. Wong, M.-M. Papadopoulou, M. Sadooghi-Alvandi, and A. Moshovos, “Demystifying GPU microarchitecture through microbenchmarking,” in Performance Analysis of Systems & Software (ISPASS), 2010 IEEE International Symposium on. IEEE, 2010, pp. 235–246.
- [4] N. Wilt, The CUDA Handbook: A Comprehensive Guide to GPU Programming. Pearson Education, 2013.
- [5] S. Collange, M. Daumas, D. Defour, and D. Parello, “Barra: A parallel functional simulator for GPGPU,” in Modeling, Analysis & Simulation of Computer and Telecommunication Systems (MASCOTS), 2010 IEEE International Symposium on. IEEE, 2010, pp. 351–360.
- [6] ——, “Comparaison d’algorithmes de branchements pour le simulateur de processeur graphique Barra,” in 13‘eme Symposium sur les Architectures Nouvelles de Machines, 2009, pp. 1–12.
- [7] T. M. Aamodt et al., “GPGPU-Sim,” 2012. [Online]. Available: http://www.gpgpu-sim.org
- [8] A. Habermaier and A. Knapp, “On the correctness of the SIMT execution model of GPUs,” in Programming Languages and Systems. Springer, 2012, pp. 316–335.
- [9] B. W. Coon and J. E. Lindholm, “System and method for managing divergent threads in a SIMD architecture,” US Patent US7 353 369 B1, 04 01, 2008. [Online]. Available: https://www.google.com/patents/US7353369
- [10] B. W. Coon, J. R. Nickolls, L. Nyland, P. C. Mills, and J. E. Lindholm, “Indirect function call instructions in a synchronous parallel thread processor,” US Patent US8 312 254 B2, 11 13, 2012. [Online]. Available: https://www.google.com/patents/US8312254
- [11] NVIDIA, “CUPTI: CUDA toolkit documentation,” 2014. [Online]. Available: http://docs.nvidia.com/cuda/cupti/