An Extragalactic Spectroscopic Survey of the SSA22 Field
Abstract
We present VLT VIMOS, Keck DEIMOS and Keck LRIS multi-object spectra of 367 sources in the field of the protocluster SSA22. Sources are spectroscopically classified via template matching, allowing new identifications for 206 extragalactic sources, including 36 Lyman-break galaxies (LBGs) and Lyman- emitters (LAEs), 8 protocluster members, and 94 X-ray sources from the ks Chandra deep survey of SSA22. Additionally, in the area covered by our study, we have increased by , 13, and 6 times the number of reliable redshifts of sources at , at , and with X-ray emission, respectively. We compare our results with past spectroscopic surveys of SSA22 to investigate the completeness of the LBGs and the X-ray properties of the new spectroscopically-classified sources in the SSA22 field.
keywords:
surveys — techniques: imaging spectroscopy — X-rays: galaxies — galaxies: clusters: general — galaxies: active.1 INTRODUCTION
The SSA22 field hosts one of the most distant and well studied protoclusters currently known. Originally discovered by Steidel et al. (1998), the SSA22 protocluster lies at and contains several powerful active galactic nuclei (AGNs; Lehmer et al., 2009a, b), numerous Lyman-break galaxies (LBGs; Steidel et al., 1998, 2003) and Lyman- emitters (LAEs; Hayashino et al., 2004; Matsuda et al., 2005), and multiple spatially extended Lyman- blobs (Steidel et al., 2000; Matsuda et al., 2004, 2011), the most extreme of which span regions kpc in extent. The protocluster has been mapped using the LAE population, which has revealed a belt-like structure across a 6020 Mpc2 (comoving size) region (Hayashino et al., 2004; Yamada et al., 2012). At its core, the protocluster reaches a factor of times overdensity of LBGs and LAEs compared to the field (Steidel et al., 2000). Cosmological models predict that the protocluster would have collapsed into a structure resembling a rich local cluster (e.g., Coma) with a total mass (see, e.g., Governato et al., 1998; Steidel et al., 1998).
Since the discovery of the protocluster, the SSA22 field has been extensively studied at several wavelengths, providing new information about how galaxies grow in high density environments at (e.g., Chapman et al., 2001, 2004; Geach et al., 2005; Webb et al., 2009; Nestor et al., 2011; Tamura et al., 2009, 2010, 2013; Uchimoto et al., 2012; Kubo et al., 2013). To address how the supermassive black hole (SMBH) populations in the protocluster environment are growing, a deep ks Chandra survey was conducted over the SSA22 field: the Chandra Deep Protocluster Survey (Lehmer et al., 2009b).111See http://astro.dur.ac.uk/~dma/SSA22/ for details on the Chandra Deep Protocluster Survey. The Chandra exposure over SSA22 yielded multiple detections for LBGs and LAEs associated with the protocluster. Early results indicated that the fraction of protocluster galaxies hosting AGN was elevated by a factor of compared to the field population at , suggesting the presence of an enhanced AGN duty cycle and/or more massive SMBHs in the protocluster environment (Lehmer et al., 2009a). Additional AGN studies of clusters and protoclusters have confirmed a steady rise in the AGN fraction for galaxies in the highest density environments with increasing redshift (e.g., Martini et al., 2009, 2013; Digby-North et al., 2010; Lehmer et al., 2013), implying that the key growth phases of the most massive SMBHs occured in high-redshift protoclusters like that found in SSA22.
Prior to the current work, the Chandra SSA22 point source catalog from Lehmer et al. (2009b) contained robust redshift matches for only of the X-ray sources, limiting initial constraints on the AGN activity in the protocluster to a small subset of sources in the field. Additionally, there is only one published LBG spectroscopic catalog in the SSA22 field (Steidel et al., 2003). This survey only covered the area around the center of the protocluster and yielded spectroscopic measurements for of the known LBGs. Therefore, in order to better characterize the AGN activity in the SSA22 protocluster it is imperative to unambiguously identify protocluster members by obtaining spectroscopic measurements of both the galaxies (LBGs and LAEs) and X-ray sources in the field.
In this paper, we present a survey of extragalactic sources in the SSA22 field using the multi-object spectrographs at the Very Large Telescope (VLT) and Keck. We map the SSA22 field with the dual goals of identifying new protocluster members and complementing previous studies performed in this field. We target new LBGs in the redshift range of the SSA22 protocluster, as well as X-ray sources detected in the Chandra Deep Protocluster Survey. The structure of the paper is as follows: in 2 we outline our observations and the data reduction strategies; in 3 we detail our spectral template matching approach used to identify the sources; in §4 we describe the main results; and in §5 we summarize our work. Throughout this work, unless stated otherwise, the errors listed are at the 1 level, we use AB magnitudes, CGS units, and adopt the concordance cosmology, , and .
2 OBSERVATIONS AND DATA REDUCTION
| mask id | instrument | obs. date | RA | DEC | P.A. | nnew/nrep |
|---|---|---|---|---|---|---|
| SSA22a (Keck1) | DEIMOS | 2009 Sep 16 | 22:17:42.74 | 00:16:44.7 | 170.9 | 27/0 |
| SSA22b (Keck2) | DEIMOS | 2009 Sep 16 | 22:17:40.27 | 00:15:20.2 | 133.5 | 27/5 |
| SSA22c (Keck3) | DEIMOS | 2009 Sep 17 | 22:17:17.05 | 00:16:32.8 | 166.4 | 19/1 |
| SSA22d (Keck4) | DEIMOS | 2009 Sep 17 | 22:17:25.64 | 00:18:41.5 | 128.0 | 16/1 |
| SSA22e (Keck5) | LRIS | 2009 Dec 15 | 22:17:33.53 | 00:18:36.8 | +106.0 | 6/1 |
| SSA22f (Keck6) | LRIS | 2009 Dec 16 | 22:17:44.20 | 00:14:56.0 | +99.1 | 7/2 |
| 2096 (VLT1) | VIMOS | 2011 Jun 09 | 22:17:34.60 | 00:15:20.0 | +90.0 | 98/0 |
| 2318 (VLT2) | VIMOS | 2011 Sep 20 | 22:17:34.60 | 00:15:20.0 | +90.0 | 100/0 |
| 2349 (VLT3) | VIMOS | 2011 Sep 23 | 22:17:34.60 | 00:15:20.0 | +90.0 | 53/6 |
| 2523 (VLT4) | VIMOS | 2012 Jul 22 | 22:17:34.60 | 00:15:20.0 | +90.0 | 11/64 |
| 2526 (VLT5) | VIMOS | 2012 Aug 15 | 22:17:34.60 | 00:15:20.0 | +90.0 | 10/54 |
| 2531 (VLT6) | VIMOS | 2012 Aug 22 | 22:17:34.60 | 00:15:20.0 | +90.0 | 5/27 |
Characteristics of the Keck and VLT slit masks observed in the SSA22 field, including the instruments, observation dates (UT), and mask center coordinates (J2000.0) and position angles. The number of new spectroscopic targets and those that have previously determined redshifts have been indicated as and , respectively.
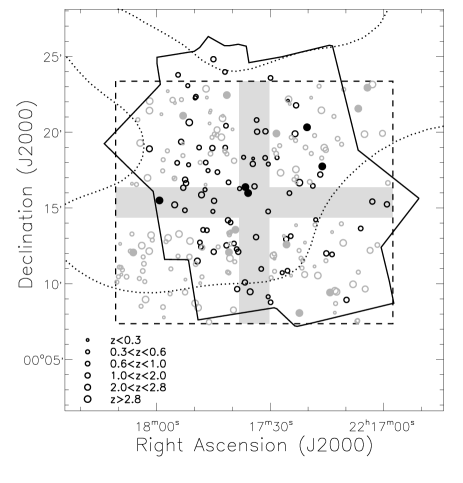
Our observations were conducted using multiple slit mask exposures of the Visible Multi-Object Spectrograph (VIMOS; Le Fèvre et al., 2003) on the VLT, and the Deep Imaging Multi-Object Spectrograph (DEIMOS; Faber et al., 2003) and Low Resolution Imaging Spectrometer (LRIS; Oke et al., 1995) on Keck. These observations cover an important fraction of the areal footprint of the SSA22 Chandra field (see Figure 1). In some observations (Keck LRIS, VLT VIMOS), we obtained flux calibrated spectra through the use of response curves obtained from standard stars. In these cases, the spectra have been corrected by atmospheric extinction. Although Keck DEIMOS and VLT VIMOS lack an atmospheric dispersion compensator (ADC), we do not attempt atmospheric refraction corrections. This is because observations performed by these instruments are executed at small zenith angles with N-S oriented slits, and consequently, with negligible dispersion effects (see e.g., Filippenko, 1982; Szokoly, 2005; Sánchez-Janssen et al., 2014). When flux calibrated spectra are provided, we do not attempt to correct the spectra for slit losses (see e.g., Cassata et al., 2011). Therefore, in cases of flux calibration, the spectra are accurate to the 1020% level.
| object id | RAa | DECa | sdss | subaru | ukidss | s. typec | masksd | quality | classe | |
|---|---|---|---|---|---|---|---|---|---|---|
| VLT observations | ||||||||||
| 10031 | 334.27914 | 0.12557 | 0.6292 | 23.0 | 21.3 | 18.6 | EllG | 1,4 | A | bri |
| 10032 | 334.30383 | 0.13486 | 0.1000 | 20.4 | 21.1 | 20.2 | EllG | 1 | B | bri |
| 10034 | 334.49194 | 0.12968 | 0.1718 | 21.1 | 21.3 | 20.0 | SFG | 1,4 | A | bri |
| 10051 | 334.30301 | 0.14493 | 0.3839 | 22.7 | 21.1 | 18.8 | EllG | 3,5 | A | bri |
| 10077 | 334.45193 | 0.16735 | 0.1102 | 21.4 | 21.9 | 21.4 | SpG | 1,5 | A | bri |
| 10092 | 334.51294 | 0.16906 | 0.3034 | 21.8 | 21.5 | 19.5 | SpG | 1,4 | A | bri |
| 10110 | 334.42041 | 0.17862 | 0.3986 | 22.7 | 22.0 | 20.4 | SpG | 1,6 | A | bri |
| 10113 | 334.53757 | 0.18189 | 0.4213 | 23.0 | 21.8 | 20.3 | SpG | 1,6 | A | bri |
| Keck observations | ||||||||||
| 006 | 334.24649 | 0.25400 | 1.1261 | 22.1 | 21.9 | 20.1 | AGN | 4 | A | XR/bri |
| 010 | 334.26257 | 0.25703 | 1.0252 | … | 24.9 | 20.2 | AGN | 4 | B | XR |
| 016 | 334.27536 | 0.22747 | 0.9070 | … | 24.7 | 21.7 | SpG | 4 | A | XR |
| 021 | 334.29099 | 0.14894 | 1.1123 | … | 25.3 | 21.5 | SpG | 3 | B | XR |
| 035p | 334.30688 | 0.19892 | 0.7532 | 23.4 | 23.3 | 20.4 | SpG | 3 | A | XR |
| 038 | 334.31320 | 0.20006 | 1.7338 | 22.5 | 22.5 | 20.9 | AGN | 3 | A | XR/bri |
| 039 | 334.31378 | 0.31386 | 1.3997 | 22.1 | 21.7 | 20.5 | AGN | 3 | A | XR/bri |
| 043p | 334.31766 | 0.29569 | 3.0980 | … | 24.5 | … | AGN | 3 | A | XR/3 |
aOptical positions in J2000.0 equatorial coordinates.
bThe optical magnitudes presented in this Table come from the SDSS survey (e.g., Adelman-McCarthy et al., 2008), SSA22 photometric survey of Hayashino et al. (2004) (Subaru magnitudes) and the UKIDSS survey (e.g., Lawrence et al., 2007). The UKIDSS magnitudes have been transformed from Vega to AB magnitudes using K(AB)=K(Vega)+1.9 (from Hewett et al., 2006).
cSpectral types are based on cross-correlation template that has minimum (see details in §3). EllG elliptical galaxy; SpG spiral Galaxy; SFG starburst galaxy; LBG Lyman-break galaxy; AGN active galactic nuclei.
d Masks where source presents A or B quality spectra.
e Target selection criteria classes. bri bright source (); XR X-ray source from the Lehmer et al. (2009b) catalog; 3 LBG; 4 LBG; Ste03 LBG from Steidel et al. (2003); LAE LAE from Hayashino et al. (2004).
Table 2 is presented in its entirety in the electronic version (also at ftp://cdsarc.u-strasbg.fr/pub/cats/J/MNRAS/450/2615); an abbreviated version of the table is shown here for guidance as to its form and content.
2.1 VLT observations
The VIMOS observations were centered at the coordinates , and span an area of 18′16′ (see Figure 1). These observations were performed in MOS (multi-object spectroscopy) mode using the hr blue grism. The wavelength coverage of 3700–6700 Å covers AGN emission lines (e.g., Ly, C iv and C iii) at . The observations consisted of six slit masks, each with a total integration time of hrs for masks used in 2011 (masks 1–3; see Table 1 for details) and hrs for masks used in 2012 (masks 4–6; Table 1). The exposures times were selected in order to detect faint optical counterparts to limiting magnitudes of for extragalactic sources with strong emission features and for sources with moderate emission/absorption features. The spectra on each mask are reduced using the standard ESO VIMOS pipeline version 2.9.7.222http://www.eso.org/sci/software/pipelines This pipeline consist of routines from the VIMOS Interactive Pipeline and Graphical Interface (VIPGI; Scodeggio et al., 2005). The conditions were photometric, with seeing and the resolving power of these observations is . Each VIMOS mask had slits, of which provide spectra of sufficient quality for our template matching (see §3). The spectra obtained from the VIMOS pipeline contained some contamination of emission lines due to the spectral multiplexing and sky lines. The ranges where this contamination is present has been masked out from the spectra in order to perform cross-correlation template fits (see §3). The extracted VIMOS spectra were flux-calibrated using standard response curves333http://www.eso.org/observing/dfo/quality/VIMOS/qc/response.html obtained from repeated exposures of standard stars. The flux calibration has been further refined by comparing the brightness of stars observed in our survey (see Appendix A) with their SDSS photometry.
2.2 Keck observations
In 2009 September, we observed four slit masks (SSA22a-d) targeting X-ray sources in the SSA22 field with DEIMOS on the Keck II telescope. The DEIMOS masks typically each contained 75 targets and were observed for 1.5–2 hr, split into 20–30 min integrations; details of the observations are presented in Table 1. All observations used 15 wide slitlets and the 600 line mm-1 grating ( Å; ). The conditions were photometric, with 05 seeing. The wavelength coverage of these observations was 4600–9700 Å with a spectral resolution of Å. In 2009 December we observed two slit masks (SSA22e and f) targeting SSA22 X-ray sources using LRIS, a dual-beam spectrograph on the Keck I telescope. Each mask was observed for hr, split into three exposures. All observations used 13 wide slitlets, the 400 line mm-1 blue grism ( Å; ), and the 400 line mm-1 red grating ( Å; ). Slit mask SSA22e, observed the first night, used the 5600 Å dichroic, while SSA22f, observed the following night, used the 6800 Å dichroic. Conditions were clear for the LRIS observations. When LRIS spectra were observed in both the blue and the red grism, we obtained a wavelength coverage of 3500–10000 Å with a spectral resolution of Å. The DEIMOS data were processed using a slightly modified version of the pipeline developed by the DEEP2 team at UC-Berkeley (Cooper et al., 2012; Newman et al., 2013), while the LRIS data reduction followed standard procedures.
Given that our targets are X-ray sources and high-redshifts galaxies primarily, in the next sections we focus our analysis mainly on the extragalactic sources. In Appendix A we present information related to stellar sources observed in the field.
3 SPECTRAL ANALYSIS
We targeted sources for spectroscopy based on three target selection criteria classes. The first category corresponds to sources in the Chandra X-ray catalog of the SSA22 field from Lehmer et al. (2009b). The second category includes bright sources with optical magnitudes .444The -magnitudes come from the Subaru photometric survey of Hayashino et al. (2004) The third category corresponds to optically selected LBG and LAE candidates, further divided into four sub-categories: Steidel et al. (2003) LBG candidates, new or LBG candidates (see §4.2 for details), and LAE candidates from Hayashino et al. (2004). The majority of Keck targets correspond to sources in the X-ray catalog of Lehmer et al. (2009b).
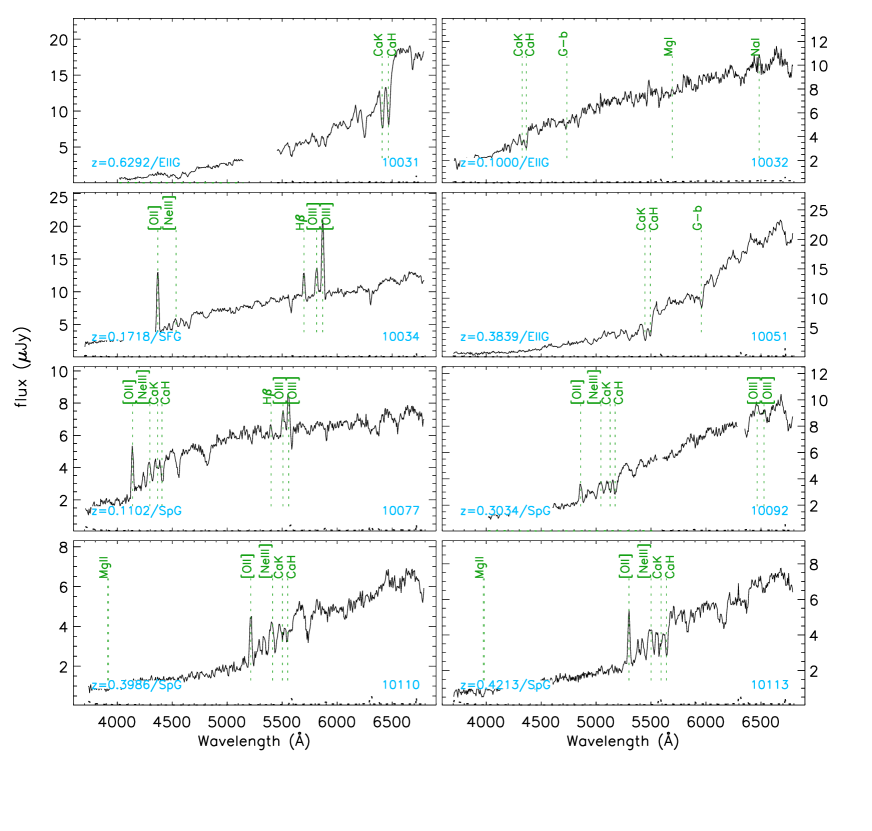
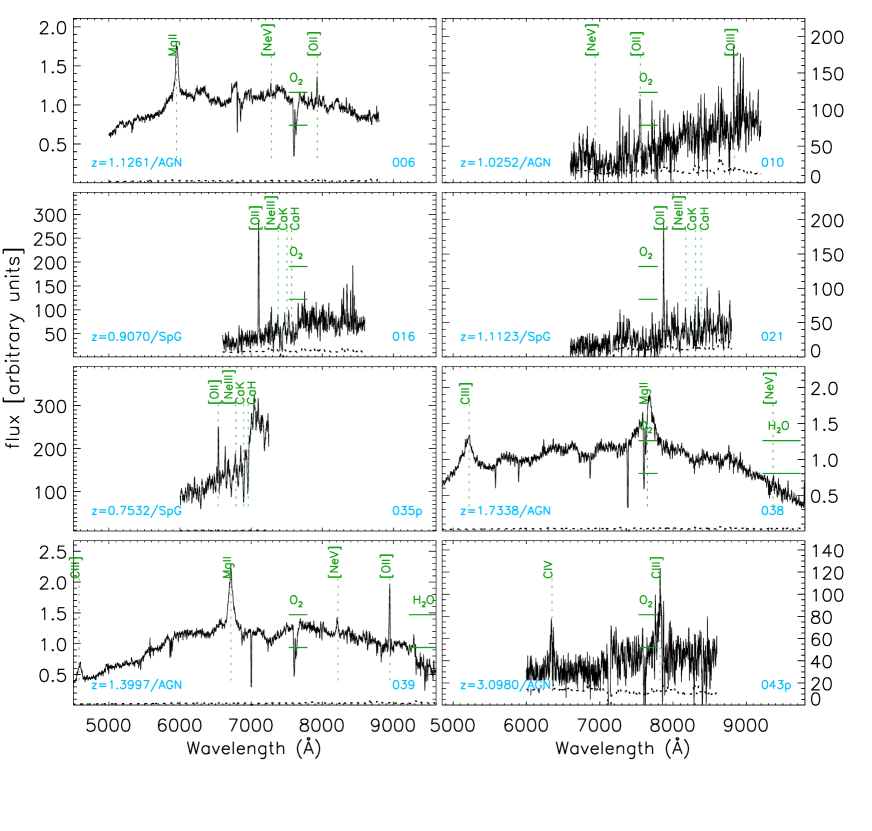
To determine redshifts and spectral types for our observed objects, we fit our spectra with several templates using the publicly available software specpro (Masters & Capak, 2011). The extragalactic templates used (see Appendix A for a description of the stellar templates) come from the VVDS (Le Fèvre et al., 2013) for Spiral (SpG), Elliptical (EllG), and Star-Forming Galaxies (SFG); Shapley et al. (2003) and Bielby et al. (2013) for LBGs in emission and absorption; Francis et al. (1991) for Seyfert galaxies; and Vanden Berk et al. (2001) for QSOs. For each spectrum, we select a cross-correlation template based on the minimum . In general, almost every recognizable extragalactic spectrum will be well described by one of the templates. Therefore, based on the best-matched template we obtain redshifts and classify the spectra respectively as SpG, EllG, SFG, AGN (for QSO or Seyfert), or LBG.
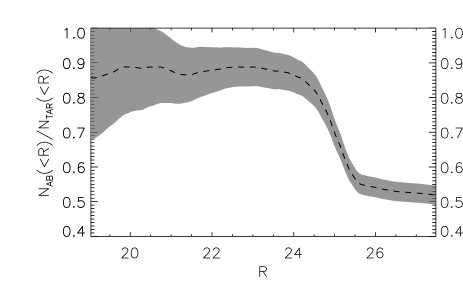
In Table 2, we present basic information for our observed objects. This table summarizes the results of our source spectroscopy, including the quality of the derived spectroscopic redshift (). Quality flag signifies an unambiguous redshift determination, typically relying on an asymmetric line profile indicating Ly emission (cf., Stern et al., 2000), a confidently identified continuum break in the spectroscopy (e.g., a Lyman-break or D4000 break), and/or the identification of multiple emission/absorption features. Quality flag signifies a less certain redshift determination, where the asymmetry of the emission line was ambiguous, the continuum break was of uncertain identification, and/or only a single emission feature was identified. We consider spectroscopic redshifts to be likely correct; however, additional spectroscopy would be beneficial. Some of the sources have been observed multiple times. In the last column of Table 1, is the number of previously unobserved sources on a given mask, and is the number of sources which were also observed on a previous mask. and account for quality A and B obtained in this work, including both extragalactic sources and stars. For cases of spectral quality A or B, the redshift errors are conservatively expected to be , based on the spectral resolution combined with uncertainties in the wavelength calibration. These errors are verified by comparing the redshifts obtained for sources with good quality spectra in more than one mask. For cases where the extragalactic sources were observed in more than one slit, we also checked the reliability of the redshift determinations obtaining cases where . For and spectra the reliability is 98% (62 out of 63 cases) and 97% (28 out of 29 cases), respectively. In Figure 2 we plot the ratio of the cumulative number of A/B quality spectra to the total number of targeted slits () as a function of magnitude in the -band. This ratio is more or less constant at % with increasing , up to . As expected, for declines dramatically. Table 2 includes the target selection criteria class; many of the sources that were previously classified as bright and a few of the X-ray sources were found to be stars (see Appendix A for details of stellar spectra). The ratio of A/B spectra to the number of targeted sources () of each target class is as follows (Poisson errors are assumed): for bright, for X-ray, for LBGs, and for LBGs (see Table 3 for details).
| classa | VLT obs. | Keck obs. | VLT & Keck obs. |
|---|---|---|---|
| Bright | 218/246 | 38/41 | 245/274 |
| X-ray | 35/94 | 97/186 | 120/233 |
| LBG | 38/140 | 2/2 | 39/141 |
| LBG | 12/70 | 0/1 | 12/71 |
| All LBG | 52/254 | 6/11 | 57/262 |
| All classes | 277/561 | 102/200 | 367/714 |
a Target selection criteria class.
is the number of A or B quality spectra and is the total number of targeted sources.
In Figures 3 and 4 we plot flux/counts as a function of wavelength for the VLT and Keck spectra of extragalactic sources respectively; identified absorption and emission lines of the best matched spectral template are indicated. The spectral classification for most sources was based on templates that match the source spectra for at least two noticeable absorption/emission features. The exceptions to this are the LBGs (see §4.2 for more details). In total we have spectroscopically classified (with A/B quality) 164 extragalactic sources and 113 stars in the VLT observations, and 94 extragalactic sources and 8 stars in the Keck observations. In section 4.5, we describe in more detail the spectra of three sources that show peculiar spectral features. Discounting overlaps (matching radius ) between the VLT and Keck observations, we have obtained reliable spectra for a total of 247 unique extragalactic sources and 120 unique Galactic stars. For sources observed by both the VLT and Keck observations, we found consistency in the wavelength range where the spectra overlapped.
4 RESULTS AND DISCUSSION
4.1 Comparison with Published Redshifts
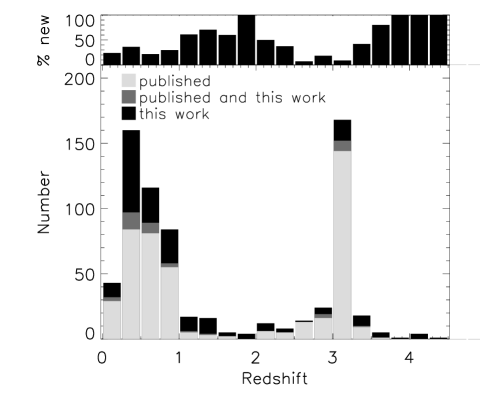
We compare our redshifts with those from published spectroscopic surveys that include the SSA22 field. These surveys include the Garilli et al. (2008) VIMOS VLT Deep Survey (VVDS; Le Fèvre et al., 2005a), the LAE FOCAS Subaru surveys by Matsuda et al. (2005) and Yamada et al. (2012), and the Keck LBG survey by Steidel et al. (2003). We selected sources in those surveys that were within an area of 23′23′ centered on the VLT survey center. The selected area is large enough to cover the LBG fields SSA22a from Steidel et al. (2003) and the Chandra survey from the SSA22 field (Lehmer et al., 2009b). In the published surveys, we select sources with redshift quality similar to those of our surveys. In the case of the VVDS survey, we select only flags 3 and 4, which indicates a redshift reliability above 95%. Additionally in the Steidel et al. (2003) surveys, we selected only secure redshift identifications of optically selected LBG candidates with a strong emission feature (identified as a Ly emission line) and/or cases of multiple absorption features. Therefore, the spectral quality of the selected sources in Steidel et al. (2003) is very similar to or spectra from this work (see §4.2). Finally, the LAE redshift identifications of Matsuda et al. (2005) and Yamada et al. (2012) correspond to cases of a high S/N emission feature often complemented with multiple absorption features. Therefore, the selected LAE redshift identifications are equivalent to or spectra from this work as well (see §4.2). Using this criterion, there are 494 source redshifts available in published catalogs, including 281 reliable redshifts from the VVDS survey, 100 sources from Steidel et al. (2003), and 113 sources from the LAE surveys. Note that we do not count sources that are repeated across the published surveys. For repeated sources (angular distance ), we have taken the following arbitrary order of priority (from highest to lowest priority): the Steidel et al. (2003) LBG survey, the LAE survey of Yamada et al. (2012), the LAE survey of Matsuda et al. (2005), and then the VVDS survey.
The redshift distribution of our sample is compared with those available in the literature in Figure 5. The VVDS survey provides the majority of redshifts at , while the other surveys dominate the source redshift distribution at . By design, the LAE surveys are very concentrated on sources at (see §4.3). Our spectroscopy included 41 sources that already had redshifts from the public surveys (matching radius ). In these sources we do not find major differences between our redshifts and published redshifts (). Therefore, we spectroscopically identified 206 (247 total minus 41 previously classified) new extragalactic sources, a % increase in the number of reliable spectroscopic redshifts. Our major contribution comes in the redshift range between and , where we have increased the number of sources with redshifts by factors of (from 12 to 42) and 13 (from 1 to 13), respectively. The sources at come mainly from the Keck observations, since DEIMOS and LRIS probe wavelengths up to . The sources at were obtained by targeting LBGs candidates at with VLT-VIMOS (see §4.2).
4.2 Lyman-Break Galaxies
Our LBG template was used to fit galaxies that have been optically classified either as LBGs or LAEs. The majority of LBGs have been previously classified in four groups: LBGs, LBGs (from the photometric survey of Hayashino et al., 2004), optical LBGs candidates from Steidel et al. (2003), and optical LAEs candidates from Hayashino et al. (2004).
The criteria to select LBGs was:
| (1) | (4) | |
| (2) | (5) | |
| (3) |
The criteria to select LBGs was:
| (1) | (5) | |
| (2) | (6) | |
| (3) | (7) | |
| (4) |
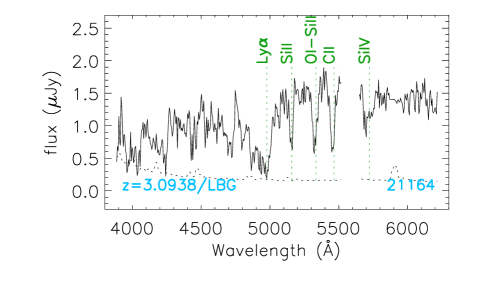
Note that in the last expressions CFHTLS stands for Canada-France-Hawaii Telescope. With the exception of one source (VIMOS source 21164; see Figure 6 and Table 2), the LBGs show clear evidence of a single strong emission line, assumed to be Ly. VIMOS source 21164 () was the only case found with Ly absorption. This feature was accompanied by at least three absorption lines, allowing a very reliable cross correlation match with our LBG absorption template (see Figure 6). Among the absorption lines observed the spectrum of source 21164 are: Si ii 1260, O i+Si ii 1303 and C ii 1334. The VLT (Keck) observations showed evidence for high-redshift () LBG spectral signatures in 43 (2) sources. Discounting overlaps with published redshifts, we found a total of 36 new sources with LBG spectral signatures (including LBGs and LAEs). Since the Keck observations exclusively targeted Chandra X-ray sources, all LBGs from Keck are X-ray emitters.
| Sources | With Spectroscopic | ||||
|---|---|---|---|---|---|
| Published and not in this worka | Yes | 37 | 17 | 2 | 1 |
| Published and in this workb | Yes | 3 | 4 | 0 | 0 |
| This work onlyc | Yes | 14 | 18 | 6 | 6 |
| Not =A, B targets with redshiftsd | Yes | 5 | 2 | 1 | 0 |
| Not =A, B targets with no redshifte | No | 31 | 64 | 15 | 43 |
| No information | No | 80 | 181 | 58 | 363 |
The area where the sources were selected correspond to a 23′23′ square centered on the coordinates , (J2000).
a Sources with published redshifts and with no A or B redshifts from this work.
b Sources with published redshifts and with A or B redshifts from this work.
c Sources with A or B redshifts from this work only.
d Targets from this work that did not result in =A or B spectra and with redshifts from published surveys.
e Targets from this work that did not result in =A or B spectra and with no redshifts from published surveys.
In the sample of LBG candidates at and we found eight cases in which the spectrum did not match the typical characteristics of an LBG. Five out of the eight cases were stars (see Appendix A); the other three cases include an EllG at (10979), an SFG at (11281), and an SpG at (21493). As a test of possible contamination from low-redshift sources, we tried other templates to fit the LAE or LBG candidates. These alternative templates do not present improved fits over the LBG template. For example, the SFG and SpG templates confuses the strong LBG Ly emission feature with [O ii] 3727 in the redshift range ; however, we would expect to observe other features as well (e.g. [Ne iii] 3864, H 4861, [O iii] 5007) that are not present. Only the spectra of VLT sources 11281 and 21493 exhibit these features. Indeed, the LBG template does not present any important emission features besides Ly 1216, though it does have absorption features such as Si ii 1263, O i 1304, C ii 1335 and Si iv 1397. With the exception of three spectra (21164, 21186, and 31167; see Figure 3), there are no clear cases of absorption features in our LBG spectra. In general, our observations are unable to probe the continuum of LBGs. This is expected given that the majority of the optically selected LBGs have . Indeed, S/N in the spectral continua of successfully identified LBGs is low ().
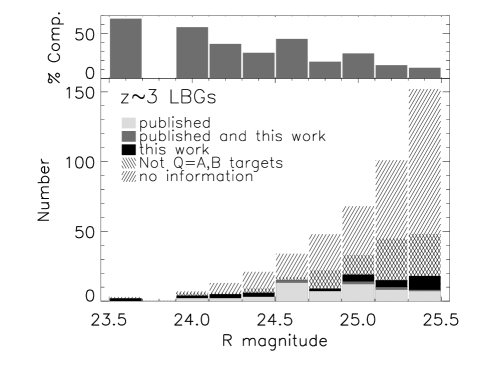
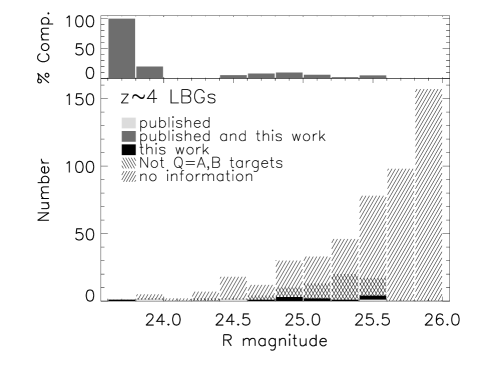
Within the area selected to concentrate this study (see §4.1), we check the completeness of the LBG selection by comparing the total number of LBG candidates to the number that have spectroscopic redshifts (see Figures 7 and 8). The total number of sources with redshifts is 93, with 32 being new redshifts from our survey (see Table 4). The total number of sources with redshifts is 15, with 12 coming from our survey (see Table 4). Figures 7 and 8, and Table 4 show that our survey is far from complete, particularly for sources at . If we include all the spectroscopic information available (including this work), and of the and sources have spectroscopic redshifts for candidates, respectively. Additionally, and of the and sources have spectroscopic redshifts for candidates, respectively. Thus, in our LBG spectroscopic redshift survey was and for the and sources, and and for the and sources (see details in Figures 7 and 8, and Table 4), respectively. These numbers suggest that we are only detecting LBGs with strong Ly emission; in general, our observations are not deep enough to probe the continua of these sources.
Similar to this work, Cassata et al. (2015) observed high redshift sources with VLT-VIMOS. Their sample included sources with and photometric redshifts 2–6. For sources with spectral VVDS flags 3 or 4 (equivalent to = A/B in our survey, see §4), Cassata et al. (2015) found fractions of and for and , respectively. These fractions are higher than our values of for and LBGs with . However, these differences are expected given that the Cassata et al. (2015) VIMOS masks were observed twice, including one 14 hr exposure using a blue filter (lrblue) and one 14 hr exposure using a red filter (lrred). As we discussed earlier in this section, our LBG targets where mainly concentrated in our VLT observations and not in the Keck observations. Therefore, the Cassata et al. (2015) exposures are typically a factor of 3 times deeper and cover a broader wavelength range than our VLT observations of SSA22 LBGs, which explains the differences in .
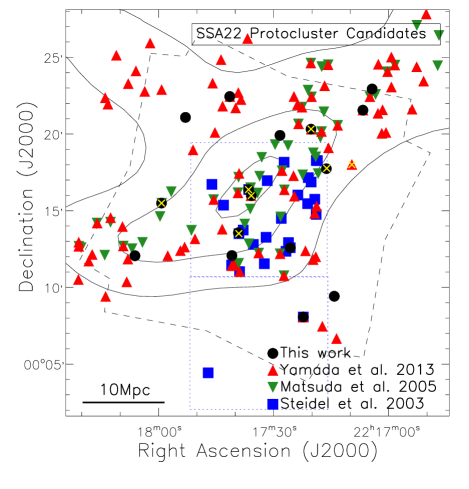
4.3 New protocluster candidates
We identify new SSA22 protocluster candidates as sources with redshifts . This range of redshifts covers a comoving length of Mpc. The chosen range more or less agrees with the expected extension of this protocluster, which covers a comoving area of approximately 6030 Mpc2 (as shown in Hayashino et al. 2004 and Figure 9). Based on this criterion, we found 16 sources in our survey and 134 unique additional sources in published catalogs. We find eight overlapping sources between our observations and the public surveys and hence we report 8 new protocluster candidates (see Figure 9). Most of the protocluster candidates found in our sample (12 out of 16) are from the optically selected LBGs at (see §4.2); the rest are two X-ray selected quasars and two LAE/X-ray AGNs (see §4.4). The SSA22 protocluster members from the published catalogs come from optically selected LBGs (27 sources from Steidel et al., 2003) and LAEs (107 sources from Matsuda et al., 2005; Yamada et al., 2012). The protocluster candidates from Steidel et al. (2003) are primarily from the SSA22a field, which contains the central region of the protocluster (see Figure 9). Our criteria to select LBGs (see §4.2) are similar to those used by Steidel et al. (2003); a large fraction () of Steidel et al. (2003) sources are identified by our LBG selection scheme. In contrast, our LBG selection criteria is almost independent of the LAE optical selection criteria of Hayashino et al. (2004). For example, for the LAEs with spectroscopic redshifts, only of the sources match our selection criteria for LBGs. Additionally, the LAE selection criteria are focused on detecting sources in a narrower range of redshifts (at ) than our LBG selection criteria. Specifically, the average spectroscopic redshift of the LAEs is with a standard deviation of 0.02 compared to an average redshift = 3.11 with standard deviation of 0.21 for the LBGs.
4.4 X-ray sources
The ks Chandra Deep Protocluster survey reaches sensitivities of in the observed 2–8 keV X-ray band. The catalog of Lehmer et al. (2009b) consists of 297 X-ray point source detections. For the Keck observations we targeted X-ray sources by using counterpart positions from the optical/near-infrared observations reported in Lehmer et al. (2009b), which are registered to the astrometric frame of the UKIRT Infrared Deep Sky Survey (UKIDSS; Lawrence et al., 2007) Deep Extragalactic Survey (DXS) of the SSA22 field. In cases where there is not clear -band identifications, we sometimes simply put a slitlet on the X-ray position while for others we would target a nearby -band source. In the case of the VLT observations we targeted the X-ray sources when their optical counterparts (from Lehmer et al., 2009b) were detected in the VIMOS pre-image. We associate a spectrum with an X-ray source if its angular distance to a X-ray counterpart is less than . The last expression corresponds to the sum of squares of (the X-ray positional a error found in Table 2 of Lehmer et al., 2009b) and which is an estimation of the expected positional error between optical sources and their X-ray counterpart.
| xid | id | ref. | RA | DEC | |||||||
|---|---|---|---|---|---|---|---|---|---|---|---|
| (1) | (2) | (3) | (4) | (5) | (6) | (7) | (8) | (9) | (10) | (11) | (12) |
| 4 | … | 5 | 334.24249 | 0.36628 | 1.0 | 0.9266 | 23.4 | 24.49 | 30.80 | 28.11 | 25.940.09 |
| 6 | 006 | 1 | 334.24615 | 0.25372 | 1.5 | 1.1261 | 21.9 | 21.79 | … | 29.36 | 25.870.13 |
| 7 | 10516 | 1 | 334.25137 | 0.33200 | 0.1 | 2.2845 | 21.2 | 20.71 | 31.58 | 30.36 | 26.280.15 |
| 8 | … | 5 | 334.25208 | 0.35658 | 1.1 | 0.6328 | 23.2 | 23.98 | 29.46 | 27.98 | 25.050.15 |
| 10 | 010 | 1 | 334.26251 | 0.25714 | 0.5 | 1.0252 | 24.9 | 25.80 | 29.96 | 27.68 | 24.610.29 |
| 11 | 20518 | 1 | 334.27042 | 0.16092 | 0.0 | 2.4122 | 26.9 | 25.75 | … | 28.39 | 26.850.09 |
| 16 | 016 | 1 | 334.27557 | 0.22722 | 1.2 | 0.9070 | 24.7 | 25.40 | 29.55 | 27.73 | 25.110.14 |
| 20 | … | 3 | 334.29001 | 0.30003 | 0.9 | 3.1050 | 24.5 | 25.03 | 30.12 | 28.86 | 25.790.21 |
The optical magnitudes used to obtain , , , and log come from the SDSS survey (e.g., Adelman-McCarthy et al., 2008), the SSA22 photometric survey of Hayashino et al. (2004) (Subaru magnitudes) and the UKIDSS survey (e.g., Lawrence et al., 2007). The flux densities at rest-frame 2500Å and 4400Å (from which we obtain , , , and log ) were obtained by interpolating a power-law fit between two Galactic reddening corrected flux densities obtained from optical magnitudes. If the observed optical flux densities wavelengths do not cover the rest-frame 2500Å/4400Å, the flux densities at rest-frame 2500Å/4400Å were obtained from the closest wavelength observed flux densities assuming a power-law spectrum with (e.g., Vanden Berk et al., 2001). Table 5 is presented in its entirety in the electronic version (also at ftp://cdsarc.u-strasbg.fr/pub/cats/J/MNRAS/450/2615); an abbreviated version of the table is shown here for guidance as to its form and content. See §4.4 for details on the columns and their associated units.
The new spectroscopic classifications for X-ray sources and their respective X-ray IDs (from Table 2 of Lehmer et al., 2009b) is presented in Table 5 and the details of the columns are given below.
Column (1) gives IDs from Table 2 of Lehmer et al. (2009b).
Column (2) gives IDs in case the source belongs to our survey.
Column (3) gives the referred surveys where a source has been spectroscopically observed. 1this work; 2Steidel et al. (2003); 3Yamada et al. (2012); 4Matsuda et al. (2004); 5Le Fèvre et al. (2005b).
Columns (4) and (5) give the X-ray point source positions (from Lehmer et al., 2009b) in J2000.0 equatorial coordinates.
Column (6) gives angular distance (in ″) between the X-ray source and the spectroscopically identified source.
Column (7) gives redshifts, either from our survey or published surveys in case the source is not in our survey.
Column (8) gives the Subaru AB -band magnitudes from the SSA22 photometric survey of Hayashino et al. (2004).
Column (9) gives the monochromatic AB magnitude at rest-frame wavelength 2500 Å. These were computed by extrapolating the flux densities obtained from the optical magnitudes. Previous to the extrapolation, the flux densities obtained have been corrected for Galactic reddening.
Column (10) gives the logarithm of the monochromatic luminosity at rest-frame 3.6 (with units erg s-1). These values were computed from the flux densities at rest-frame wavelength 3.6 . The flux densities at rest-frame wavelength 3.6 have been obtained by interpolating a power-law fit between two Galactic reddening Spitzer corrected flux densities (observed at 3.6, 4.5, 5.8 and 8.0 ). If the Spitzer observed bands do not cover the rest-frame wavelength 3.6 , the flux densities at rest-frame 3.6 are obtained from their closest wavelength observed flux densities assuming a power-law spectrum with (e.g., Stern et al., 2005).
Column (11) gives the logarithm of the monochromatic luminosity at rest-frame 2500 Å (with units erg s-1).
Column (12) gives the logarithm of the monochromatic luminosity at rest-frame 2 keV (with units erg s-1) obtained from observed X-ray fluxes from Table 2 of Lehmer et al. (2009b) (see this section for more details).
Column (13) gives the difference between the logarithm of the monochromatic luminosity at rest-frame 2 keV and the expected value from Steffen et al. (2006) (i.e., ).
Column (14) gives the logarithm of the 2–10 keV band luminosity (with units erg s-1) obtained from observed X-ray fluxes of Table 2 of Lehmer et al. (2009b) (see this section for more details).
Column (15) gives the optical-to-X-ray power-law slope ). Where and are the flux densities at rest-frame 2 keV and 2500Å, respectively.
Column (16) gives the logarithm of the radio-loudness parameter (). Where is the flux densities at rest-frame 4400Å. The flux densities at rest-frame 5 GHz have been obtained using flux densities at 1.4 GHz obtained from the radio images of Chapman et al. (2003) assuming a power-law spectrum with .
Column (17) gives 1 if the source is an AGN candidate, 0 otherwise. This is based on our AGN selection criteria described in this section.
In the VLT observations, we found reliable redshifts for 35 X-ray sources. The Keck observations exclusively targeted the X-ray sources, and therefore the majority of this sample (97 out of 102) correspond to X-ray sources. After accounting for the 12 overlapping X-ray sources between the Keck and VLT surveys, in total we found 120 redshifts for X-ray sources, of which only 15 overlap with redshifts available from published catalogs and 11 are stars. Therefore, we found redshifts for 94 new extragalactic X-ray sources. Of the 109 extragalactic X-ray sources in our survey, 58 are classified as EllGs or SpGs, 9 are SFGs, 3 are LBGs and 39 are AGNs. Prior to this work there were only 23 X-ray sources with published spectroscopic redshifts; with this work we increase this to a total of 128 (117 of which are extragalactic sources), an increase by a factor . Note that Lehmer et al. (2009b) reports on 46 X-ray sources with redshifts, though many of these sources are unpublished and from VVDS sources with less secure redshifts than the ones used in this work. In Table 2 of Lehmer et al. (2009b) there are 25 redshifts from the unpublished work of Chapman et al. (2009). Of these 25 sources, we obtained redshifts for 13 and in just 4/13 our redshift measurement matches the one provided in Table 2 of Lehmer et al. (2009b). All 13 overlaping sources have = A spectra. Therefore, the Chapman et al. (2009) redshifts do not seem to be robust enough to be used in this work.
Using the redshifts of our survey and those from published catalogs, we obtain X-ray luminosities in the 2–10 keV band , and monochromatic 2 keV luminosities () from the observed X-ray fluxes found in Table 2 of Lehmer et al. (2009b). The X-ray luminosities are estimated assuming a power-law spectrum (; ) with (e.g., Page et al., 2005). By default the luminosities are obtained by extrapolating the observed hard-band (2–8 keV) fluxes. In cases where the sources were not detected in the hard-band (2–8 keV), the observed fluxes were obtained in either the soft-band (0.5–2 keV) or the full-band (0.5–8 keV).
We classify our X-ray sample as AGN candidates based on similar criteria to that adopted by Lehmer et al. (2012):
-
1.
X-ray Luminosity: for cases in which , we can reliably classify the source as an AGN (e.g., Bauer et al., 2004).
-
2.
X-ray Spectral Shape: hard X-ray spectra are indicative of dominant and powerful X-ray AGN that are significantly obscured. We select such hard AGN candidates based on their hardness ratios, with a cut at an effective .
-
3.
X-ray-to-Optical Flux Ratio: X-ray-to-optical flux ratios indicate X-ray emission which is significantly elevated compared to normal galaxies. We identify AGN candidates based on where is either in the HB, FB or SB.555 is obtained from (where is the 0.3–3.5 keV flux in erg cm-2 s-1; Maccacaro et al., 1988). Assuming which is the expected value for a AGN spectra (e.g., Akiyama et al., 2000) and correcting to the observed flux (either at 2–8 keV, 0.5–8 keV or 0.5–2 keV) assuming .
-
4.
X-ray-to-Radio Luminosity Ratio: X-ray emission, as measured by radio emission, is significantly higher than expected from pure star formation; i.e., , where is the rest-frame 1.4 GHz monochromatic luminosity in units of and is the expected X-ray emission level that originates from starburst galaxies (e.g., Bauer et al., 2002; Ranalli et al., 2003; Mineo et al., 2014).666From Bauer et al. (2002) the following relationship is obtained: (where is in erg and is in W Hz-1) and therefore in the range of radio luminosities where this relationship is valid (i.e. ) ; ( for a power-law spectrum with ). The radio fluxes are obtained from the SSA22 VLA radio images of Chapman et al. (2003) with an assumed spectral index of (White et al., 1997); is obtained from assuming a power-law spectra with .
-
5.
Optical spectroscopy: Based on our source classification for sources is in our spectroscopic survey. For the few cases that sources are not in our spectroscopic sample, we search for evidence of AGN features in the literature if applicable.
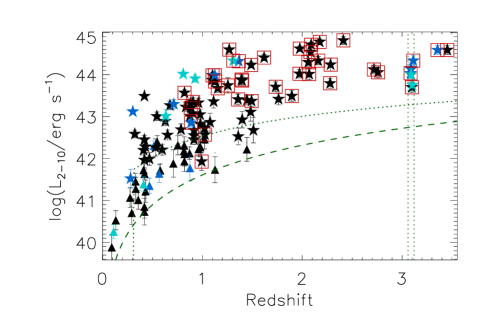
Our criteria indicate 84 (out of 117) of the X-ray extragalactic sources are AGNs. In our optical spectroscopy, only 39 out of 78 of the AGNs candidates were spectroscopically classified as AGNs. The lack of AGN features in the optical spectra in half of the X-ray AGNs is expected from AGN obscuration (e.g., Alexander et al., 2001; Barger et al., 2005). In Figure 10 we show the X-ray luminosity versus redshift for the X-ray sources. Note that the sensitivity limit of the SSA22 Chandra survey implies that every X-ray source above is an AGN.
We find 7 sources that potentially belong to the SSA22 protocluster (). These sources have X-ray luminosities implying they are quasars777Quasars are defined here as AGNs with with bolometric luminosities . with (e.g., Marconi et al., 2004). The SSA22 protocluster candidates with X-ray detections are marked with X symbols in Figure 9. In the work of Lehmer et al. (2009b) there are 9 reported X-ray sources at ; however, 3 of the 9 sources came from the unpublished work of Chapman et al. (2009). As mentioned earlier, we do not adopt Chapman et al. (2009) redshifts in this work. Of the seven X-ray protocluster candidates, five are from our spectroscopy (one new source found in our survey), and three show QSO signatures in their optical spectra. Our sample of X-ray protocluster candidates might not be complete. The missing sources could be missed targets or cases with fainter fluxes than the sensitivity limits of our survey. For example the X-ray source 120 in the Lehmer et al. catalog, has a photometric redshift within the range (Tamura et al., 2010). This source was targeted by our survey, but the resulting spectrum did not show any recognizable feature. Additionally, observations of this source at sub-millimeter wavelengths complemented by a hard photon index () strongly indicate an obscured protocluster quasar (Tamura et al., 2010). From the photometric redshifts of Kubo et al. (2013), we also expect to find additional X-ray protocluster members. In the mentioned work, it is found that there are 19 X-ray sources within . In contrast, we found 11 sources in this redshift range, and therefore, more X-ray protocluster members with reasonable optical magnitudes for spectroscopy may exist.
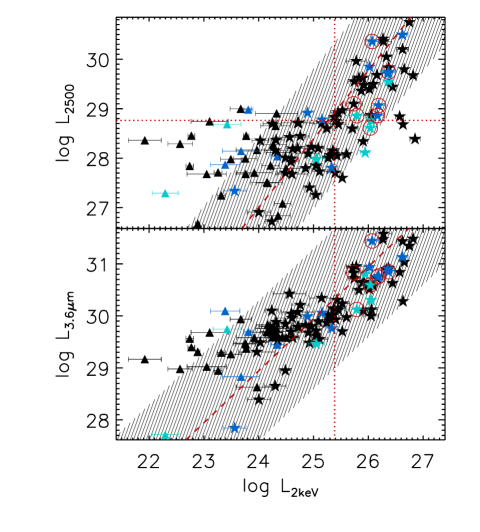
To check additional properties of the X-ray sample, we plot the 2 keV luminosity versus the 3.6 luminosity and the 2 keV luminosity versus the 2500 Å luminosity in Figure 11. With the exception of some outliers, our AGN candidates satisfy the relation of Steffen et al. (2006). The to ratio of X-ray AGN candidates seem to match the expected values when compared to the Richards et al. (2006) SEDs (see lower panel Figure 11).
In this work we obtained the radio loudness parameter by extrapolating optical and radio flux densities. The radio flux densities were sensitive enough888The limiting 1.4 GHz sensitivity is 60 Jy (5; Chapman et al., 2003). to properly discriminate between radio-loud (those with ) and radio-quiet (those with ) AGNs for a fraction of our sample. In our X-ray extragalactic sample 12 sources (nine AGNs) have radio detections with four of them corresponding to radio-loud AGN with moderate radio loudness parameters (). Additionally, at least 23 (four protocluster candidates) out of the 75 AGNs that do not have radio detection cannot be excluded (with log upper limits 1.5) from being radio-loud (see Table 5).
4.5 Peculiar spectra in the SSA22 Field
In this section we describe three X-ray sources with peculiar spectrum.
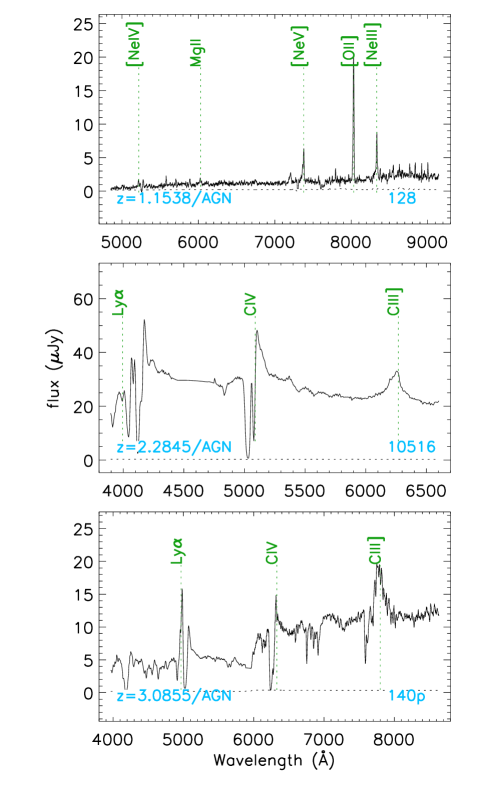
4.5.1 X 128: A Ne-Rich Type-2 AGN at
X 128 is a moderate-redshift type-2 AGN showing an interesting set of emission lines at , with line ratios atypical of composite obscured AGN spectra (see Figure 12). Specifically, several ionization states of neon are particularly strong, including [Ne iv] 2424, [Ne iii] 3343, [Ne v] 3346, [Ne v] 3426, [Ne iii] 3869, and [Ne iii] 3968. In radio galaxy spectra, typically [Ne iv] 2424 is observed with comparable strength to C ii] 2326 (e.g., McCarthy, 1993; Stern et al., 1999), whereas here the [Ne iv] line appears at least the C ii] line strength. The observed lines are not unprecedented, however; for instance, these ionization states are all evident in Hubble Space Telescope Imaging Spectrograph (STIS) observations of the “hot spot” in the inner narrow-line region of the well-studied Seyfert 2 galaxy NGC 1068 (Kraemer et al., 1998; Kraemer & Crenshaw, 2000). In that source, high S/N spectra, including several dozen emission lines from the UV through the optical, are modeled as coming from multiple photoionized gas components.
4.5.2 BAL quasars
In this work we found two BAL quasar spectra: VIMOS 10516 at and LRIS 140p at (see Figure 12). Both sources present Ly 1216, C iv 1549 and C iii] 1909 emission lines. These BAL quasars show C iv blue-shifted absorption with projected line-of-sight Doppler broadenings km s-1 and km s-1 for 10516 and 140p, respectively. These sources as expected present moderate-to-weak X-ray emission with respect to normal quasars (e.g., Gallagher et al., 2006; Gibson et al., 2009; Saez et al., 2012) with and for 10516 and 140p, respectively; where is the difference between log and its expected value from the relation of Steffen et al. (2006).
5 SUMMARY AND FUTURE WORK
In this paper we present a survey of extragalactic sources in the SSA22 field obtained using multi-object spectrographs on the VLT and Keck telescopes. We quantify redshifts for new LBGs in the redshift range of the SSA22 protocluster and X-ray sources in the Chandra Deep Protocluster Survey with the goals of finding new protocluster members and complementing previous studies performed in this field. The main results can be summarized as follows:
-
1.
By template matching high quality VIMOS, DEIMOS, and LRIS spectra we have successfully identified redshifts for 247 extragalactic sources and 120 Galactic stars. Discounting matches with sources that have redshift identifications from published catalogs, we found redshifts for a total of 206 new extragalactic sources.
-
2.
We have substantially increased the number of sources with known redshifts in the redshift range between and , by factors of and , respectively.
-
3.
By targeting LAE and LBG candidates, we have successfully identified redshifts for 36 new sources at with spectral features. All but one source has strong emission line; the exception (VLT 21164) has absorption.
-
4.
We have identified 8 new SSA22 protocluster candidates (), one of of which is an X-ray detected quasar.
-
5.
We have increased the number of X-ray sources with reliable redshifts from 23 to 128, leaving the Lehmer et al. (2009b) catalog now % complete.
-
6.
Using a variety of multiwavelength criteria, we identified 84 out of the 128 X-ray sources in the SSA22 field as AGNs, with 7 AGNs protocluster candidates (one new from this work; ). These candidates correspond to quasars with bolometric luminosities .
The spectroscopic survey performed in this work is far from complete. There is still an important fraction of X-ray sources without any spectral identification (). Additionally, there are optically identified LBGs candidates without reliable redshifts. The level of completeness of LBGs at and with is and , respectively (see §4.2). Since most optically selected LBGs have , in general, our observations are neither probing the continuum nor the absorption spectra of LBGs. More and deeper spectral surveys are needed both to find a more complete sample of the SSA22 protocluster and to fully exploit the ks Chandra observation available in this field.
| object id | RAa | DECa | sdss | subaru | ukidss | s. typec | masksd | quality | classe |
|---|---|---|---|---|---|---|---|---|---|
| VLT observations | |||||||||
| 10047 | 334.49319 | 0.14679 | 18.3 | 18.3 | 17.4 | Kstar | 1 | A | bri |
| 10048 | 334.52917 | 0.14442 | 20.9 | 19.4 | 17.2 | Mstar | 1,4 | A | bri |
| 10052 | 334.53781 | 0.14977 | 18.2 | 18.2 | 17.3 | Kstar | 1,4 | A | bri |
| 10060 | 334.52075 | 0.15687 | 20.0 | 18.9 | 17.8 | Mstar | 1,4 | A | bri |
| 10070 | 334.27811 | 0.16194 | 22.5 | 22.0 | 21.7 | Mstar | 1,4 | B | bri |
| 10072 | 334.35138 | 0.16143 | 22.3 | 22.0 | 22.1 | Kstar | 1,4 | B | bri |
| 10085 | 334.43250 | 0.17121 | 17.4 | 18.4 | 17.6 | Gstar | 1,3 | A | bri |
| 10089 | 334.33994 | 0.17206 | 18.1 | 18.6 | 18.0 | Kstar | 1 | A | bri |
| Keck observations | |||||||||
| 025 | 334.29446 | 0.18511 | … | 24.8 | 21.9 | Mstar | 3 | A | XR |
| 053 | 334.32986 | 0.24122 | 17.6 | 18.4 | 16.1 | Mstar | 3 | A | XR/bri |
| 062p | 334.33701 | 0.17625 | 24.0 | 22.8 | 19.1 | Mstar | 2 | A | … |
| 072 | 334.34821 | 0.24539 | 21.2 | 20.0 | 18.9 | Mstar | 3 | A | XR/bri |
| 150p | 334.41080 | 0.26592 | 24.6 | 23.0 | 20.4 | Mstar | 1 | A | … |
| 186 | 334.43619 | 0.29689 | 22.8 | 21.2 | 19.4 | Mstar | 2 | A | XR/bri |
| 210 | 334.44656 | 0.28000 | 17.4 | 18.5 | 14.2 | Mstar | 1 | B | XR/bri |
| 253p | 334.47568 | 0.37325 | 21.0 | 19.6 | 18.1 | Mstar | 1 | A | bri |
aOptical positions in J2000.0 equatorial coordinates.
bThe optical magnitudes presented in this Table come from the SDSS survey (e.g., Adelman-McCarthy et al., 2008), SSA22 photometric survey of Hayashino et al. (2004) (Subaru magnitudes) and the UKIDSS survey (e.g., Lawrence et al., 2007). The UKIDSS magnitudes have been transformed from Vega to AB magnitudes using K(AB)=K(Vega)+1.9 (from Hewett et al., 2006).
c Based on the cross-correlation star template that has minimum .
d Masks where source presents A or B quality spectra.
e Target selection criteria classes. bri bright source (); XR X-ray source from the Lehmer et al. (2009b) catalog; 3 LBG; 4 LBG; Ste03 LBG from Steidel et al. (2003); LAE LAE from Hayashino et al. (2004).
Table A.1 is presented in its entirety in the electronic version (also at ftp://cdsarc.u-strasbg.fr/pub/cats/J/MNRAS/450/2615); an abbreviated version of the table is shown here for guidance as to its form and content.
Acknowledgements
We would like to thank Ezequiel Treister and the anonymous referee for helpful discussions regarding the interpretations of our results. We would also like to thank Scott Chapman for providing radio images of the SSA22 field. CS acknowledges support from CONICYT-Chile (FONDECYT 3120198, Becas Chile 74140006, and the Anillo ACT1101). FEB acknowledges support from CONICYT-Chile (Basal-CATA PFB-06/2007, FONDECYT 1141218, Gemini-CONICYT 32120003, ”EMBIGGEN” Anillo ACT1101), and Project IC120009 ”Millennium Institute of Astrophysics (MAS)” funded by the Iniciativa Científica Milenio del Ministerio de Economía, Fomento y Turismo. The work of DS was carried out at Jet Propulsion Laboratory, California Institute of Technology, under a contract with NASA. JEG thanks the Royal Society.
Based on observations made with ESO Telescopes at the Paranal Observatory under programme IDs 085.A-0616 and 089.A-0405. Some of the data presented herein were obtained at the W.M. Keck Observatory, which is operated as a scientific partnership among the California Institute of Technology, the University of California and the National Aeronautics and Space Administration. The Observatory was made possible by the generous financial support of the W.M. Keck Foundation. The authors wish to recognize and acknowledge the very significant cultural role and reverence that the summit of Mauna Kea has always had within the indigenous Hawaiian community. We are most fortunate to have the opportunity to conduct observations from this mountain.
References
- Adelman-McCarthy et al. (2008) Adelman-McCarthy, J. K., et al. 2008, ApJS, 175, 297
- Akiyama et al. (2000) Akiyama, M., et al. 2000, ApJ, 532, 700
- Alexander et al. (2001) Alexander, D. M., Brandt, W. N., Hornschemeier, A. E., Garmire, G. P., Schneider, D. P., Bauer, F. E., & Griffiths, R. E. 2001, AJ, 122, 2156
- Barger et al. (2005) Barger, A. J., Cowie, L. L., Mushotzky, R. F., Yang, Y., Wang, W.-H., Steffen, A. T., & Capak, P. 2005, AJ, 129, 578
- Bauer et al. (2002) Bauer, F. E., Alexander, D. M., Brandt, W. N., Hornschemeier, A. E., Vignali, C., Garmire, G. P., & Schneider, D. P. 2002, AJ, 124, 2351
- Bauer et al. (2004) Bauer, F. E., Alexander, D. M., Brandt, W. N., Schneider, D. P., Treister, E., Hornschemeier, A. E., & Garmire, G. P. 2004, AJ, 128, 2048
- Bielby et al. (2013) Bielby, R., et al. 2013, MNRAS, 430, 425
- Cassata et al. (2011) Cassata, P., et al. 2011, A&A, 525, A143
- Cassata et al. (2015) —. 2015, A&A, 573, A24
- Chapman et al. (2001) Chapman, S. C., Lewis, G. F., Scott, D., Richards, E., Borys, C., Steidel, C. C., Adelberger, K. L., & Shapley, A. E. 2001, ApJL, 548, L17
- Chapman et al. (2004) Chapman, S. C., Scott, D., Windhorst, R. A., Frayer, D. T., Borys, C., Lewis, G. F., & Ivison, R. J. 2004, ApJ, 606, 85
- Chapman et al. (2003) Chapman, S. C., et al. 2003, ApJ, 585, 57
- Cooper et al. (2012) Cooper, M. C., Newman, J. A., Davis, M., Finkbeiner, D. P., & Gerke, B. F. 2012, spec2d: DEEP2 DEIMOS Spectral Pipeline, astrophysics Source Code Library
- Digby-North et al. (2010) Digby-North, J. A., et al. 2010, MNRAS, 407, 846
- Faber et al. (2003) Faber, S. M., et al. 2003, in Society of Photo-Optical Instrumentation Engineers (SPIE) Conference Series, Vol. 4841, Instrument Design and Performance for Optical/Infrared Ground-based Telescopes, ed. M. Iye & A. F. M. Moorwood, 1657–1669
- Filippenko (1982) Filippenko, A. V. 1982, PASP, 94, 715
- Francis et al. (1991) Francis, P. J., Hewett, P. C., Foltz, C. B., Chaffee, F. H., Weymann, R. J., & Morris, S. L. 1991, ApJ, 373, 465
- Gallagher et al. (2006) Gallagher, S. C., Brandt, W. N., Chartas, G., Priddey, R., Garmire, G. P., & Sambruna, R. M. 2006, ApJ, 644, 709
- Garilli et al. (2008) Garilli, B., et al. 2008, A&A, 486, 683
- Geach et al. (2005) Geach, J. E., et al. 2005, MNRAS, 363, 1398
- Gibson et al. (2009) Gibson, R. R., et al. 2009, ApJ, 692, 758
- Governato et al. (1998) Governato, F., Baugh, C. M., Frenk, C. S., Cole, S., Lacey, C. G., Quinn, T., & Stadel, J. 1998, Nature, 392, 359
- Hayashino et al. (2004) Hayashino, T., et al. 2004, AJ, 128, 2073
- Hewett et al. (2006) Hewett, P. C., Warren, S. J., Leggett, S. K., & Hodgkin, S. T. 2006, MNRAS, 367, 454
- Kraemer & Crenshaw (2000) Kraemer, S. B., & Crenshaw, D. M. 2000, ApJ, 532, 256
- Kraemer et al. (1998) Kraemer, S. B., Ruiz, J. R., & Crenshaw, D. M. 1998, ApJ, 508, 232
- Kubo et al. (2013) Kubo, M., et al. 2013, ApJ, 778, 170
- Lawrence et al. (2007) Lawrence, A., et al. 2007, MNRAS, 379, 1599
- Le Fèvre et al. (2003) Le Fèvre, O., et al. 2003, in Society of Photo-Optical Instrumentation Engineers (SPIE) Conference Series, Vol. 4841, Instrument Design and Performance for Optical/Infrared Ground-based Telescopes, ed. M. Iye & A. F. M. Moorwood, 1670–1681
- Le Fèvre et al. (2005a) Le Fèvre, O., et al. 2005a, A&A, 439, 845
- Le Fèvre et al. (2005b) —. 2005b, A&A, 439, 877
- Le Fèvre et al. (2013) —. 2013, A&A, 559, A14
- Lehmer et al. (2009a) Lehmer, B. D., et al. 2009a, ApJ, 691, 687
- Lehmer et al. (2009b) —. 2009b, MNRAS, 400, 299
- Lehmer et al. (2012) —. 2012, ApJ, 752, 46
- Lehmer et al. (2013) —. 2013, ApJ, 765, 87
- Maccacaro et al. (1988) Maccacaro, T., Gioia, I. M., Wolter, A., Zamorani, G., & Stocke, J. T. 1988, ApJ, 326, 680
- Marconi et al. (2004) Marconi, A., Risaliti, G., Gilli, R., Hunt, L. K., Maiolino, R., & Salvati, M. 2004, MNRAS, 351, 169
- Martini et al. (2009) Martini, P., Sivakoff, G. R., & Mulchaey, J. S. 2009, ApJ, 701, 66
- Martini et al. (2013) Martini, P., et al. 2013, ApJ, 768, 1
- Masters & Capak (2011) Masters, D., & Capak, P. 2011, PASP, 123, 638
- Matsuda et al. (2004) Matsuda, Y., et al. 2004, AJ, 128, 569
- Matsuda et al. (2005) —. 2005, ApJL, 634, L125
- Matsuda et al. (2011) —. 2011, MNRAS, 410, L13
- McCarthy (1993) McCarthy, P. J. 1993, ARA&A, 31, 639
- Mineo et al. (2014) Mineo, S., Gilfanov, M., Lehmer, B. D., Morrison, G. E., & Sunyaev, R. 2014, MNRAS, 437, 1698
- Morrison & McCammon (1983) Morrison, R., & McCammon, D. 1983, ApJ, 270, 119
- Nestor et al. (2011) Nestor, D. B., Shapley, A. E., Steidel, C. C., & Siana, B. 2011, ApJ, 736, 18
- Newman et al. (2013) Newman, J. A., et al. 2013, ApJS, 208, 5
- Oke et al. (1995) Oke, J. B., et al. 1995, PASP, 107, 375
- Page et al. (2005) Page, K. L., Reeves, J. N., O’Brien, P. T., & Turner, M. J. L. 2005, MNRAS, 364, 195
- Pickles (1998) Pickles, A. J. 1998, PASP, 110, 863
- Ranalli et al. (2003) Ranalli, P., Comastri, A., & Setti, G. 2003, A&A, 399, 39
- Richards et al. (2006) Richards, G. T., et al. 2006, ApJS, 166, 470
- Saez et al. (2012) Saez, C., Brandt, W. N., Gallagher, S. C., Bauer, F. E., & Garmire, G. P. 2012, ApJ, 759, 42
- Sánchez-Janssen et al. (2014) Sánchez-Janssen, R., Mieske, S., Selman, F., Bristow, P., Hammersley, P., Hilker, M., Rejkuba, M., & Wolff, B. 2014, A&A, 566, A2
- Scodeggio et al. (2005) Scodeggio, M., et al. 2005, PASP, 117, 1284
- Shapley et al. (2003) Shapley, A. E., Steidel, C. C., Pettini, M., & Adelberger, K. L. 2003, ApJ, 588, 65
- Steffen et al. (2006) Steffen, A. T., Strateva, I., Brandt, W. N., Alexander, D. M., Koekemoer, A. M., Lehmer, B. D., Schneider, D. P., & Vignali, C. 2006, AJ, 131, 2826
- Steidel et al. (1998) Steidel, C. C., Adelberger, K. L., Dickinson, M., Giavalisco, M., Pettini, M., & Kellogg, M. 1998, ApJ, 492, 428
- Steidel et al. (2000) Steidel, C. C., Adelberger, K. L., Shapley, A. E., Pettini, M., Dickinson, M., & Giavalisco, M. 2000, ApJ, 532, 170
- Steidel et al. (2003) —. 2003, ApJ, 592, 728
- Stern et al. (2000) Stern, D., Bunker, A., Spinrad, H., & Dey, A. 2000, ApJ, 537, 73
- Stern et al. (1999) Stern, D., Dey, A., Spinrad, H., Maxfield, L., Dickinson, M., Schlegel, D., & González, R. A. 1999, AJ, 117, 1122
- Stern et al. (2005) Stern, D., et al. 2005, ApJ, 631, 163
- Szokoly (2005) Szokoly, G. P. 2005, A&A, 443, 703
- Tamura et al. (2009) Tamura, Y., et al. 2009, Nature, 459, 61
- Tamura et al. (2010) —. 2010, ApJ, 724, 1270
- Tamura et al. (2013) —. 2013, MNRAS, 430, 2768
- Uchimoto et al. (2012) Uchimoto, Y. K., et al. 2012, ApJ, 750, 116
- Ueda et al. (2003) Ueda, Y., Akiyama, M., Ohta, K., & Miyaji, T. 2003, ApJ, 598, 886
- Vanden Berk et al. (2001) Vanden Berk, D. E., et al. 2001, AJ, 122, 549
- Webb et al. (2009) Webb, T. M. A., Yamada, T., Huang, J.-S., Ashby, M. L. N., Matsuda, Y., Egami, E., Gonzalez, M., & Hayashimo, T. 2009, ApJ, 692, 1561
- White et al. (1997) White, R. L., Becker, R. H., Helfand, D. J., & Gregg, M. D. 1997, ApJ, 475, 479
- Yamada et al. (2012) Yamada, T., Matsuda, Y., Kousai, K., Hayashino, T., Morimoto, N., & Umemura, M. 2012, ApJ, 751, 29
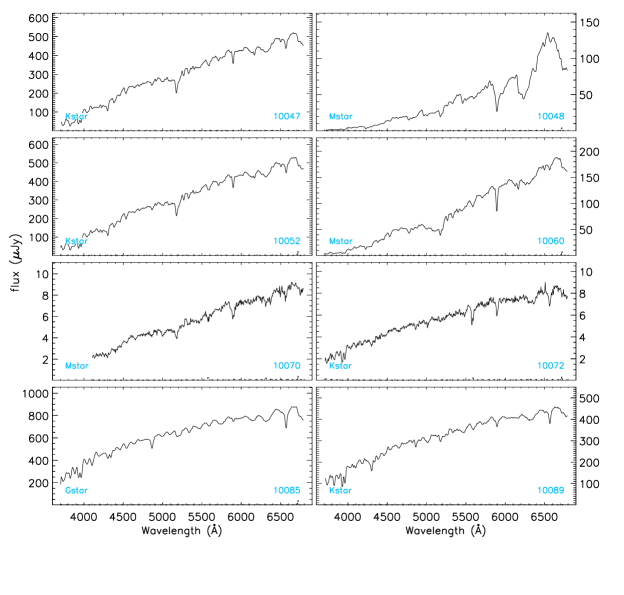
Appendix A Spectra of Stars in the SSA22 Field
As for extragalactic sources, Galactic stars were recognized by cross correlating template spectra with the data using the specpro tool. The templates used (from Pickles, 1998) allow us to get a reliable stellar classification based on main-sequence classes (A, F, G, K, and M stars). To classify stars we choose the template with minimum . We found 113 stars in the VLT observations (see Table A.1 and Figure A.1) and 8 stars in the Keck observations (see Table A.1 and Figure A.2). There is one star which was observed by both VLT and Keck, corresponding to 20644 (VLT) and 186 (Keck), such that we have surveyed a total of 120 Galactic stars. The majority are K and M stars (110/120) but we also find a few G and F stars (10/120).