The Need for Speed in Near-Earth Asteroid Characterization
Abstract
We have used Minor Planet Center (MPC) data and tools to explore the discovery circumstances and properties of the currently known population of over 10,000 NEAs, and to quantify the challenges for follow-up from ground-based optical telescopes. The increasing rate of discovery has grown to 1,000/year as surveys have become more sensitive, by 1 mag every 7.5 years. However, discoveries of large () NEAs have remained stable at 365/year over the past decade, at which rate the 2005 Congressional mandate to find 90% of 140 m NEAs will not be met before 2030 (at least a decade late). Meanwhile, characterization is falling farther behind: Fewer than 10% of NEAs are well characterized in terms of size, rotation periods, and spectral composition, and at the current rates of follow-up it will take about a century to determine them even for the known population. Over 60% of NEAs have an orbital uncertainty parameter, , making reacquisition more than a year following discovery difficult; for this fraction is over 90%. We argue that rapid follow-up will be essential to characterize newly-discovered NEAs. Most new NEAs are found within 0.5 mag of their peak brightness and fade quickly, typically by 0.5/3.5/5 mag after 1/4/6 weeks. About 80% have synodic periods of 3 years that would bring them close to Earth several times per decade. However follow-up observations on subsequent apparitions will be difficult or impossible for the bulk of new discoveries, as these will be smaller () NEAs that tend to return 100 fainter. We show that for characterization to keep pace with discovery would require: Quick (within days) visible spectroscopy with a dedicated 2 m telescope; long-arc (months) astrometry, to be used also for phase curves, with a 4 m telescope; and fast-cadence (min) light curves obtained rapidly (within days) with a 4 m telescope. For the already-known large () NEAs, that tend to return to similar brightness, subsequent-apparition spectroscopy, astrometry, and photometry could be done with 1–2 m telescopes.
keywords:
Asteroids , Asteroids, rotation , Near-Earth Objects , Orbit determination1 Introduction
Near-Earth Asteroids (NEAs) are asteroids that have been brought into the inner Solar System mainly through gravitational interactions with Jupiter and Saturn, placing them in orbits with perihelia AU that intersect or come close to Earth’s orbit (Shoemaker et al., 1979; Bottke et al., 2002; Greenstreet et al., 2012). This population is of interest to science as it provides a probe into the dynamical and compositional evolution of our Solar System and, not least, as a source of objects that have shaped Earth’s history, geologically and biologically, through numerous impacts over many millions of years. And they may yet do so again (Shoemaker, 1983).
NEAs have attracted public interest in recent times due to the unexpected 2013 February 15 event when a 17 m meteor exploded with 500 kt TNT of energy over the city of Chelyabinsk, Russia and injured over 1,000 people (Emel’yanenko et al., 2013; Borovička et al., 2013). The start-up of two private companies aiming to mine valuable resources from NEAs in the near future has rekindled interest in the scientific and for-profit exploration of asteroids (e.g., Elvis, 2014). In addition, the U.S. president, Barack Obama, has made NEAs the prime targets for human space exploration111http://www.nasa.gov/news/media/trans/obama_ksc_trans.html.
In 2005 the U.S. Congress issued a mandate to NASA to find at least 90% of the NEAs larger than 140 m (corresponding to an absolute magnitude222for asteroids, the absolute magnitude is given by the apparent magnitude that the asteroid would have if it could be observed from 1 AU away, at zero phase angle, while it was 1 AU from the Sun. of ) by 2020 (Brown Jr., 2005). There are an estimated in this size range, and larger than 100 m, or (Mainzer et al., 2011). Some argue that follow-up efforts aimed at characterization should concentrate only on the subset of NEAs that come close to Earth (Minimum Orbit Intersection Distance333The Earth MOID is the shortest distance separating the orbit of an asteroid from that of Earth. A small MOID value does not necessarily imply a risk of impact as both Earth and the asteroid are rarely at the points of their orbits closest to each other at the same time., AU) and are larger than 140 m; these are formally classified as Potentially Hazardous Asteroids (PHAs)444http://www.minorplanetcenter.net/iau/lists/Dangerous.html. However, there are good reasons to design follow-up programs that are broader than that. In terms of hazard assessment, we know that the much more numerous objects smaller than 140 m can pose significant risks (Brown et al., 2013), as we were reminded by the Chelyabinsk event. A large majority (67%) of the 4,900 known NEAs with have AU. In addition, because PHAs (irrespective of size) are, as far as we know, drawn from the same general population as other NEAs, characterizing the general population will allow us to calibrate the relationships needed to infer physical and orbital evolution properties of the PHA subset. Finally, from the technological standpoint, NASA’s proposed Asteroid Redirect Mission555http://www.kiss.caltech.edu/study/asteroid/asteroid_final_report.pdf requires an 8 m NEA in a favorable orbit be found. A second option for ARM is the retrieval of a 1–5 m boulder from a larger NEA (Abell et al., 2014).
As we argue below, most kinds of follow-up that would help to quantify an object’s threat or usefulness must be done within a short window of time, before some of the properties are well-enough known to judge whether it is an “important” object for follow-up or not. Thus we concentrate our discussion on the NEA population as a whole.
In this paper, we use the discovery circumstances and properties of the currently known population of NEAs to quantify some of the challenges that ground-based observers face in making follow-up observations. Our goal is to define the optimal follow-up strategies for NEAs that would allow the bulk of the discovered population to be characterized on a one-decade timescale. This is desireable from a planetary defence perspective because the bulk of the impact hazard resides with the smaller (), and thus more numerous, objects, which are also the least characterized. Gathering these data (composition, structure, size, etc.) for a significant proportion of this size population would allow for better estimates of potential damage due to impact, and more optimistically, better designed missions to deflect or destroy them. For example, if we knew that most 25 m NEAs are monolithic, we would produce different impact damage estimates and deflection mission requirements than if we discovered most of them are rubble piles. Scientifically, knowing the spectral class and spin distributions of a significant portion of a given size population will enable tests of current dynamical evolution models of the inner Solar System as well as possible insights into the collisional history of asteroids and the effect of Solar radiation pressure on spin axis evolution.
We describe our data sources in §2, and present current discovery and characterization trends in §3. We then describe the known NEA population in terms brightness behavior (§4), positional uncertainties (§5), sky motions (§6), and hemisphere bias (§7). In §8, we discuss the implications for follow-up astrometric, photometric, and spectroscopic observations. Finally, in §9 we summarize by laying out strategies for increasing the rate of characterization.
In this paper, we use the discovery circumstances and properties of the currently known population of NEAs to quantify some of the challenges that ground-based observers face in performing follow-up observations. Our goals are to define the optimal follow-up strategies for NEAs so the bulk of the discovered population can be characterized on a one-decade timescale, and to provide a centralized source of NEA discovery properties useful for observers planning follow-up programs.
2 Method
The IAU Minor Planet Center666http://www.minorplanetcenter.net (MPC) serves as the world’s clearinghouse for NEA observations and orbital data, and provides web-based tools for generating lists of objects that are currently observable, and providing NEA ephemerides. We have written a series of Python programs making use of modules Mechanize777http://wwwsearch.sourceforge.net/mechanize/download.html and BeautifulSoup4888http://pypi.python.org/pypi/beautifulsoup4/, to extract data from the MPC webpages and files. We used the following MPC resources.
Data:
-
1.
NEA.txt999http://www.minorplanetcenter.net/iau/MPCORB/NEA.txt provides orbital elements at a nominal epoch, along with absolute magnitude , slope parameter 101010The Slope Parameter, , is a measure of how an object’s brightness surges when it nears opposition, the so-called opposition effect. It is believed to be an interplay of shadowing and coherent-backscattering mechanisms (e.g., Muinonen et al., 2002)., number of observations, number of oppositions, arc length (for single opposition objects) or years of first and last observations (for multiple opposition objects), and orbital uncertainty parameter (see §5.1 for an explanation of this parameter).
-
2.
The lists of Atens111111http://www.minorplanetcenter.net/iau/lists/Atens.html, Apollos121212http://www.minorplanetcenter.net/iau/lists/Apollos.html, and Amors131313http://www.minorplanetcenter.net/iau/lists/Amors.html provide much of the same data but also include discovery date and site, and Earth MOID, but exclude .
Tools:
-
1.
MPEph141414http://www.minorplanetcenter.net/iau/MPEph/MPEph.html is used to generate a table of ephemerides for user-selected NEAs for a range of dates and times. The data returned include magnitude estimates.
-
2.
NEAobs151515http://scully.cfa.harvard.edu/cgi-bin/neaobs.cgi is used to generate a list of NEAs suitable for observation according to user-specified criteria including observing location, NEA magnitude, sky motion, solar elongation, RA, Dec, and orbital uncertainty.
We have also made use of the web services of NEODyS-2161616http://newton.dm.unipi.it/neodys/, which provides convenient text tables of observations for each NEA taken from the MPC’s database.
To quantify the various observational follow-up challenges, we use these resources to look at the properties of all NEAs discovered as of 2013 March as described in the sections below. For some of the analysis we also make use of a subsample consisting of the 6,763 NEAs discovered during the 10 years spanning January 1, 2002 to December 31, 2011. We call this the “Decade Sample.” For each NEA in the Decade Sample, we generated a file containing a list of daily ephemerides for that time span, including calculated apparent magnitudes.
3 Current NEA Characterization Progress Rates and Trends
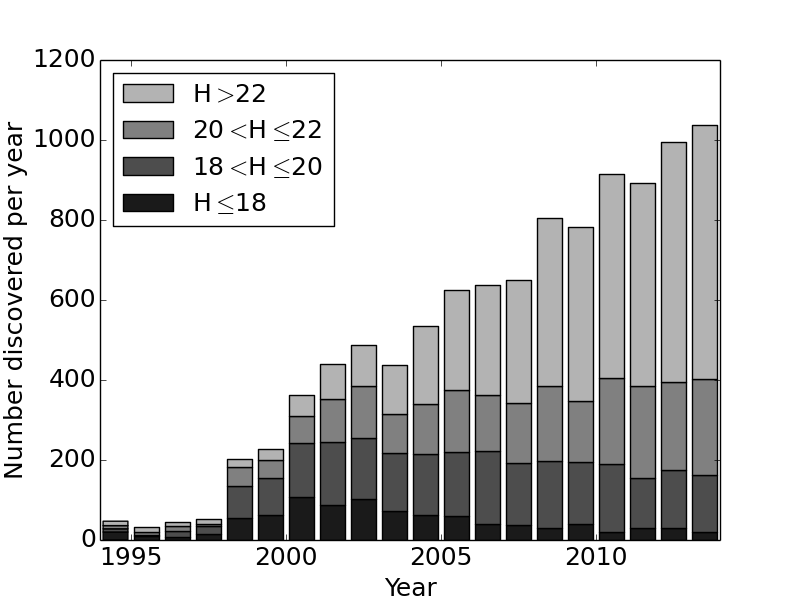
The current discovery rate of NEAs is 1,000/year (Figure 1) and this rate should increase shortly to 1,500/year with the enhanced Catalina Sky Survey detector arrays being installed , the increased use of Pan-STARRS-1 for NEA discovery (100% of available time beginning March 2014) and the coming online of Pan-STARRS-2 , and the first light of the LINEAR SST for NEA searches . We note that while the discovery rate has increased in absolute number almost continuously since 1998, this increase has been due mainly to an increase in the discoveries of the smaller NEAs. Meanwhile, the discovery rate of NEAs has remained flat at 365/year thanks to a continuous decrease in the discovery of NEAs being offset by a similar increase in the discovery of NEAs (see Figure 1). At this rate (and bearing in mind discovery rate will drop as the number of undiscovered objects decreases and if survey capabilities remain unchanged), the Congressional mandate of 2005 (Brown Jr., 2005) to find at least 90% of the NEAs larger than 140 m (, an estimated according to Mainzer et al., 2011) will be met no earlier than 2030, i.e., more than 10 years late. Mainzer et al. (2011) also predict there are NEAs larger than 100 m ().
While the pace of NEA discoveries has increased each year, characterization is falling farther behind.
3.1 Sizes
Only a small fraction (7%) of NEAs have well-determined diameters and albedos from thermal IR detection with NEOWISE (Mainzer et al., 2011) and Spitzer (Thomas et al., 2011) and fewer than 5% have been detected by ground-based radar171717http://echo.jpl.nasa.gov/asteroids/index.html, accessed 2014/05/01.. While a higher radar rate (100/year) has now been implemented and higher spatial resolution is being investigated, the total number of NEAs accessible to radar is limited (by the outgoing pulse power) to those that come well within 0.1 AU181818See the SNR graphs for the Arecibo (http://echo.jpl.nasa.gov/~lance/snr/far_asnr18.gif) and Goldstone (http://echo.jpl.nasa.gov/~lance/snr/far_gsnr-20.gif) radar dishes. Although 61% of NEAs have AU, the correct positioning to achieve a 0.1 AU distance from Earth occurs rarely. With the revived NEOWISE mission, the prospect of more thermal IR detections has improved. In 3 years 2,000 known NEOs (Near-Earth Objects) will be detected and then albedos measured to 50%, for a total of 25% of known NEOs191919http://www.lpi.usra.edu/sbag/meetings/jan2014/presentations/08_1415_Mainzer_SBAG.pdf.
For the vast majority of NEAs these quantities must be inferred from ground-based visible/near-IR observations yielding estimates of absolute magnitude and albedo. However, the alone is often uncertain by up to a magnitude due to inhomogeneous photometry and star catalog magnitude biases (Williams, 2015), light curve variability (amplitudes typically 0.4 mag, Mainzer et al., 2011), poorly-constrained phase curves, and systematic size-dependent biases of unknown cause (e.g., Chesley et al., 2002; Pravec et al., 2012).
3.2 Rotation Periods
By the beginning of 2014, 8% of all known NEAs had period determinations listed in the Light Curve Database (Warner et al., 2009), with the number increasing at a rate of 150–200 NEAs per year , mostly for objects. We note that many of the light curves these rotation periods are derived from are not published (e.g., the MPC receives light curve data for only 30 NEAs per year202020http://www.minorplanetcenter.net/light_curve).
3.3 Composition
Spectral characterization of NEAs proceeds at a similarly slow rate. The largest program of optical-near-IR spectroscopy (0.5–2.5 microns) is the MIT-IRTF programme212121http://smass.mit.edu/minus.html, which has acquired a total of 1,000 spectra (of mostly large NEAs) at a rate of 100/year. It would take almost two centuries to complete spectroscopy of all 20,500 NEAs with and 120 years for the 13,200 NEAs with (Mainzer et al., 2011) at current rates, should these be the goals of such an IR spectroscopy program. It is noted, as we will show in §4.2, that most of these NEAs will not be bright enough for ground-based IR spectroscopy.
3.4 Orbital Uncertainties
Orbital uncertainties are large (greater than 6 arcmin/decade along the orbit) for nearly all objects smaller than owing to a lack of long-arc astrometry. And, as we show in §5.1, astrometric follow-up is also lagging.
3.5 Trends
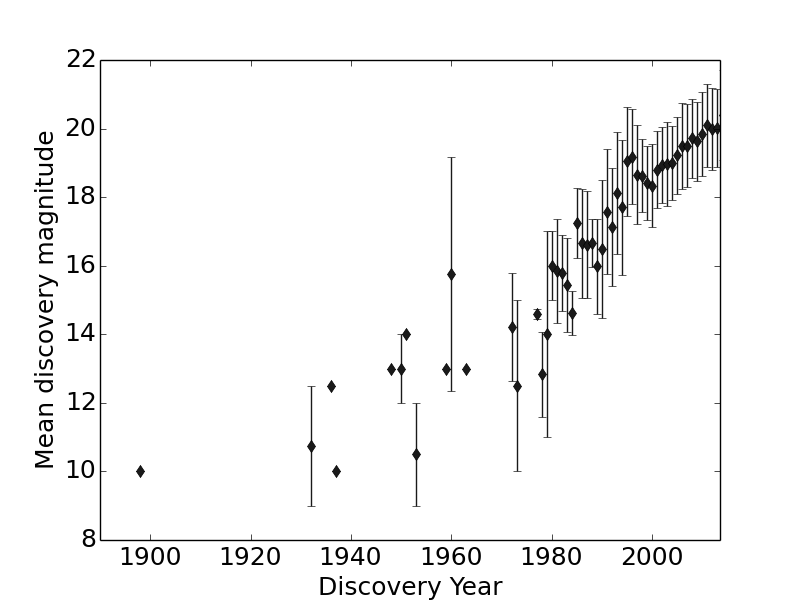
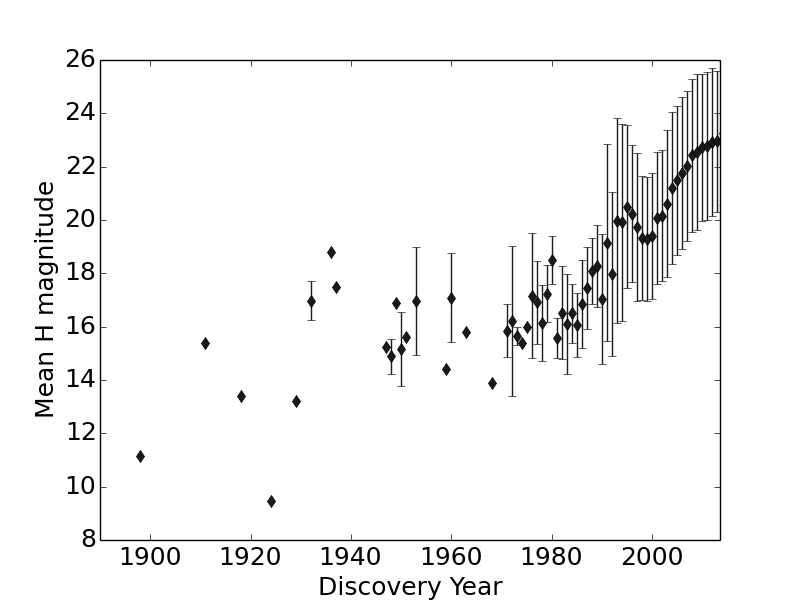
Follow-up observations will become even more challenging as surveys become sensitive to fainter objects and as large NEAs become fully known, as they effectively already are for objects with diameters 1 km (Mainzer et al., 2011). The progression of NEA discovery magnitudes (see §4) is shown in Figures 2 and 3. For the past three decades there has been a steady increase in mean discovery depth by about 1 magnitude every 7.5 years, from to . The mean magnitude has become correspondingly larger, from in 1980 to in 2013, corresponding to an approximate size decrease from 3,550 m to 140 m.
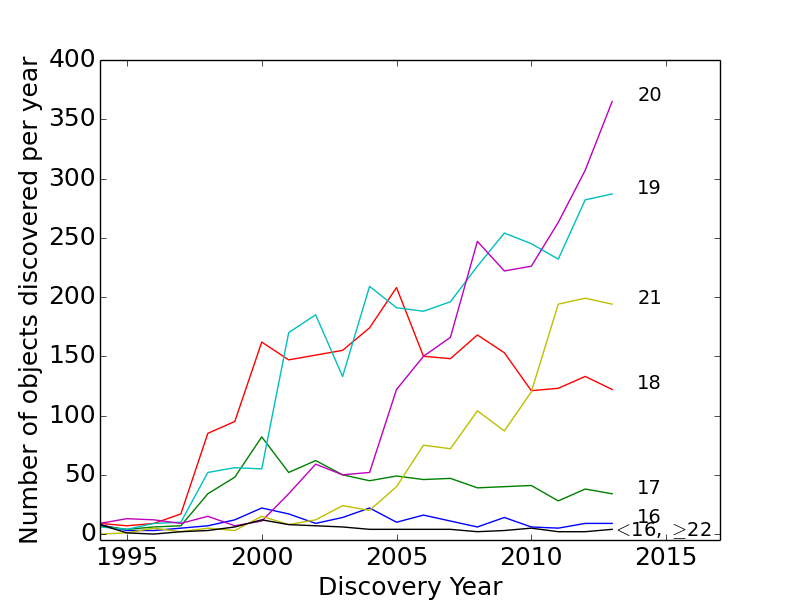
Figure 4 shows in more detail the breakdown of discovery magnitudes over the past 20 years. The discovery rate at saturated at 200/year in 2000 as most of the big objects were found. Meanwhile, the discovery rate at has increased over the same period and now dominates at 375/year.
4 NEA Brightnesses
4.1 Brightness at Discovery
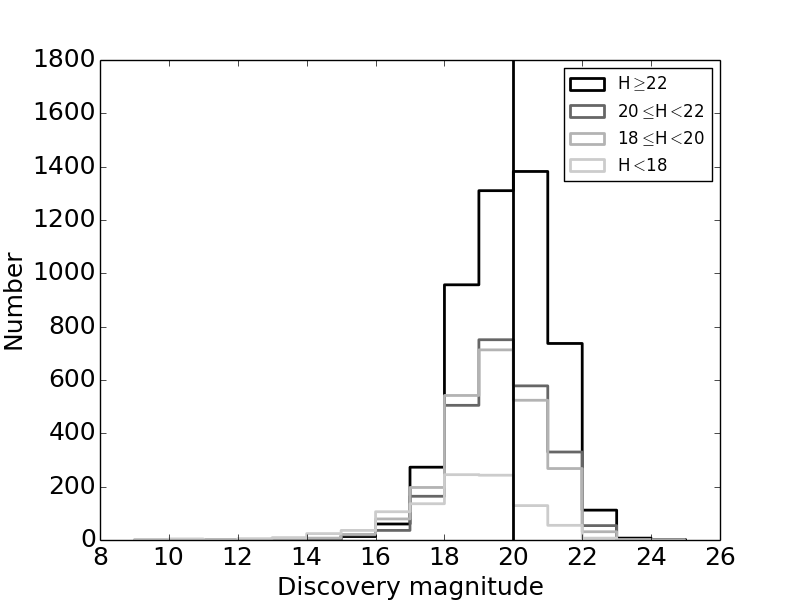
To characterize the brightnesses of NEAs at discovery, we have combined the MPC Atens/Apollos/Amors files, extracted the discovery dates of the nearly 10,000 NEAs known as of 2013 March, and looked up their discovery observation optical magnitude through the NEODyS-2 interface. These are usually or magnitudes, which we use with no correction given our coarse magnitude binning, but we note that we might expect as big as 0.4–0.5 mag based on Sloan Digital Sky Survey (SDSS) color-color plots for main belt objects in Ivezić et al. (2001) and transformation to and through the SDSS photometric relations222222http://www.sdss.org/dr7/algorithms/sdssUBVRITransform.html. We also note that Pan-STARRS discoveries have been reported in, e.g., the , , and wide bands, but the offsets from these to are expected to be 0.1–0.4 mag for most asteroids (Denneau et al., 2013). There are a few objects (currently 0.2%) that were WISE discoveries with no magnitude for the discovery date. Otherwise we expect that our technique provides a reasonable approximation of band magnitude at discovery for nearly all the objects. The discovery magnitude distribution is shown in Figure 5 for various bins. The overall mean is 19.4 with a standard deviation of 1.4.
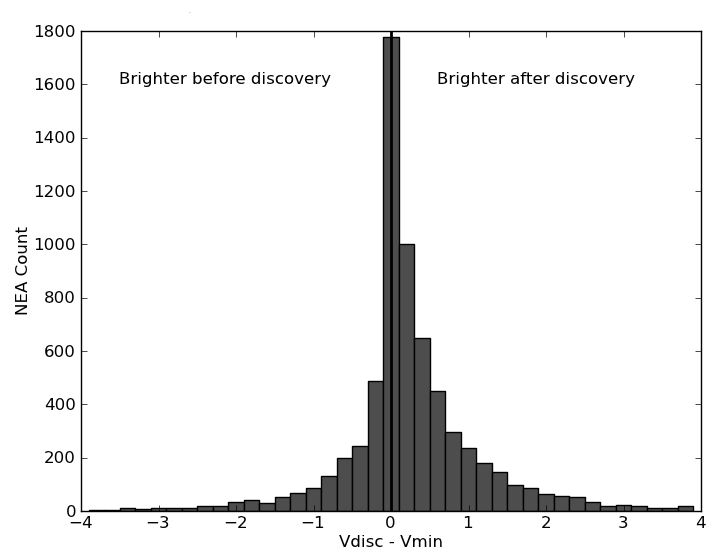
To explore how a typical NEA’s brightness changes during its discovery apparition, we consider the Decade Sample. For each NEA in this sample, we look up the discovery date in the Atens, Apollos, and Amors data files, and then examine the ephemerides at daily intervals to determine how the asteroid’s magnitude (theoretically) changed throughout its discovery apparition. We define , where is the discovery magnitude and is the brightest magnitude achieved during the apparition, and where +/- values represent NEAs brighter after/before discovery, respectively. Figure 6 gives the distribution of . NEAs discovered before reaching peak brightness have positive values of , while those discovered after have negative values. Most NEAs (60%) are discovered within 0.5 magnitudes of their peak brightness during the discovery apparition.
We then evaluated the fraction of NEAs remaining brighter than a series of limiting apparent magnitudes, , after discovery (Figure 7). It is clear that this fraction drops rapidly for many interesting cases. The values of was motivated by the infrared spectroscopic capabilities of the IRTF, and also is in range for photometric and astrometric follow-up by amateurs. represents the infrared spectroscopic limit of Magellan (see §8) and is the current mean discovery magnitude. represents the limit for the proposed NEA spectroscopic follow-up project LINNEAUS (Elvis et al., 2014). The solid lines show the brightness evolution using the full Decade Sample, while the dashed lines are drawn from only the NEAs discovered during the last 2 years of the Decade Sample. As can be seen, the number of NEAs that remained above a certain brightness decreased noticeably over time, due mainly to the increase in the number of small () NEAs discovered (Figure 1) and the greater overall survey depth in more recent years (Figure 2).
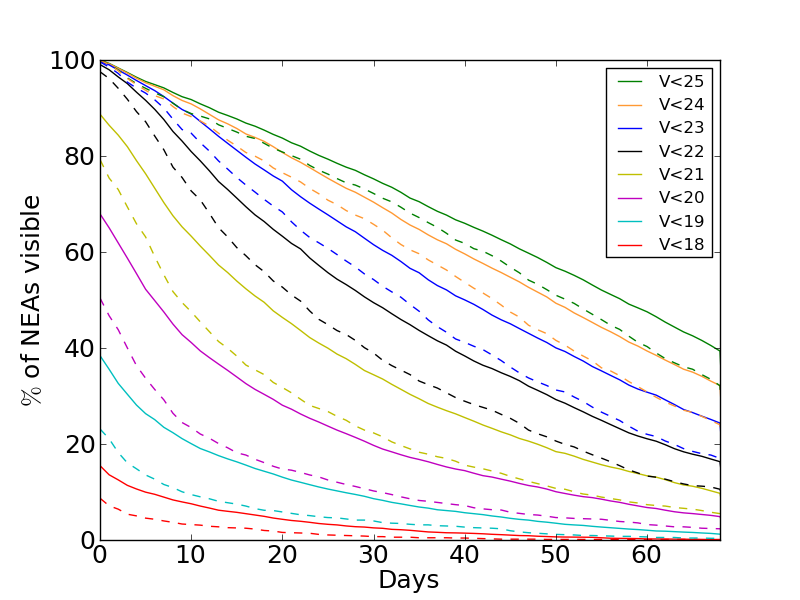
Approximately 2/3 of the objects discovered during the decade were found at , but faded by 0.5 mag after 1 week, 3.5 mag by 4 weeks, and by more than 5 mag by 6 weeks. Meanwhile, at the bright end, we see that only 17% of NEAs became brighter than , even during their discovery apparition (Figure 7), and even less, 3%, remained brighter than for more than 30 days. The small objects () that are only seen on very close passages would fade much faster than these aggregate values, as evidenced by the dashed lines, which show the values of these curves for the last 2 years of the Decade Sample. These last 2 years featured many more small () NEA discoveries than for the average of the sample. The discovery apparition then offers only a short window for characterization. We explore the implications for follow-up in §8.
4.2 Brightnesses on Subsequent Apparitions
NEAs will have other apparitions following discovery, so we also investigated their observability at these subsequent apparitions. The success of a “subsequent apparition” approach to characterization depends on two factors:
-
1.
The length of time that will elapse before the NEA’s next apparition.
-
2.
The brightness the NEA will reach on its next apparition(s).
The synodic period, , is the time that elapses between two consecutive apparitions (i.e., when the NEA returns to a similar position near Earth). If an NEA’s orbital period is denoted by (given in years), then its synodic period with respect to Earth will be given by (Freedman and Kaufmann, 2005):
| (1) |
The distribution of synodic periods for the known NEAs as of March 2013 is shown in Figure 8.
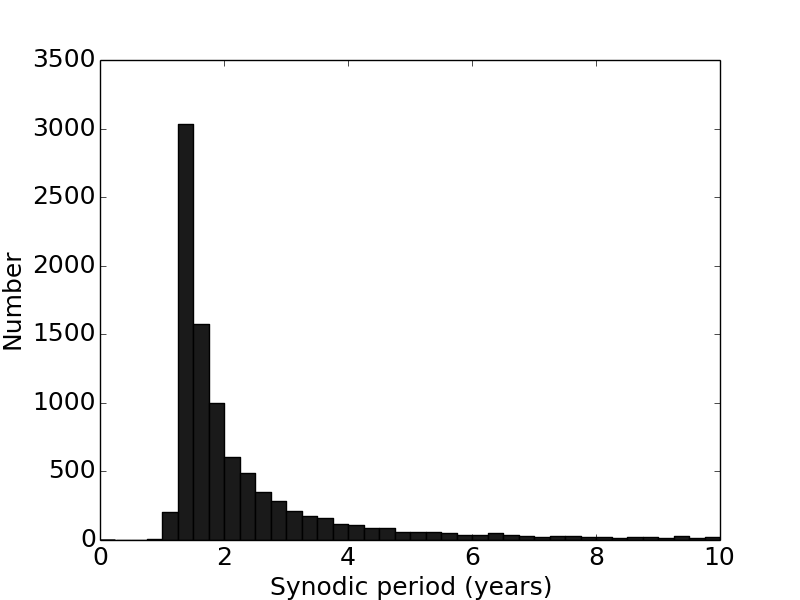
Almost 80% of known NEAs have years and will therefore have at least three apparitions each decade. Synodic periods of 3–10 years account for 20% of known NEAs. These reapparition times are too long for space mission target selection studies as the properties and highly accurate orbits needed for selection will take too long for planning purposes.
As an example of what it takes to determine an orbit well enough for space mission planning, we present NEA (101955) Bennu, the target for the OSIRIS-REx mission232323http://www.asteroidmission.org/. To obtain an accurate enough ephemeris, it was observed with radar during 3 apparitions and had optical observations spanning 15 years. This provided a very accurate orbit determination, which also constrained the magnitude of the Yarkovsky effect acting upon it, thus allowing the mass/area ratio of Bennu to be calculated (Chesley et al., 2014).
Only 5% of the nearly 10,000 NEAs known as of 2013 March have years as their position relative to Earth changes very slowly; it will be decades before they can be re-observed from Earth after their discovery apparition. There may also well be NEAs with long synodic periods currently “hiding” within the region of space at elongations 60°, making them unobservable because of their position with respect to the Sun; these may not be discovered from Earth for decades. The positive side of this situation is that once a long synodic period NEA becomes observable, it will remain so for an extended period of time.
Given that most of objects will return several times within a decade, we computed the brightest magnitude that NEAs known as of 2013 March will achieve on return apparitions over a 10 year period starting January 1, 2018, by which time, most of today’s newly discovered NEAs would be making at least their first return. We used the MPC tool MPEph (see §2) to generate daily ephemerides for these NEAs and determined the brightest magnitude reached over a 1, 5, and 10 year period (starting January 1, 2018). Results are shown in Figure 9 (on the left for objects with and on the right for ).
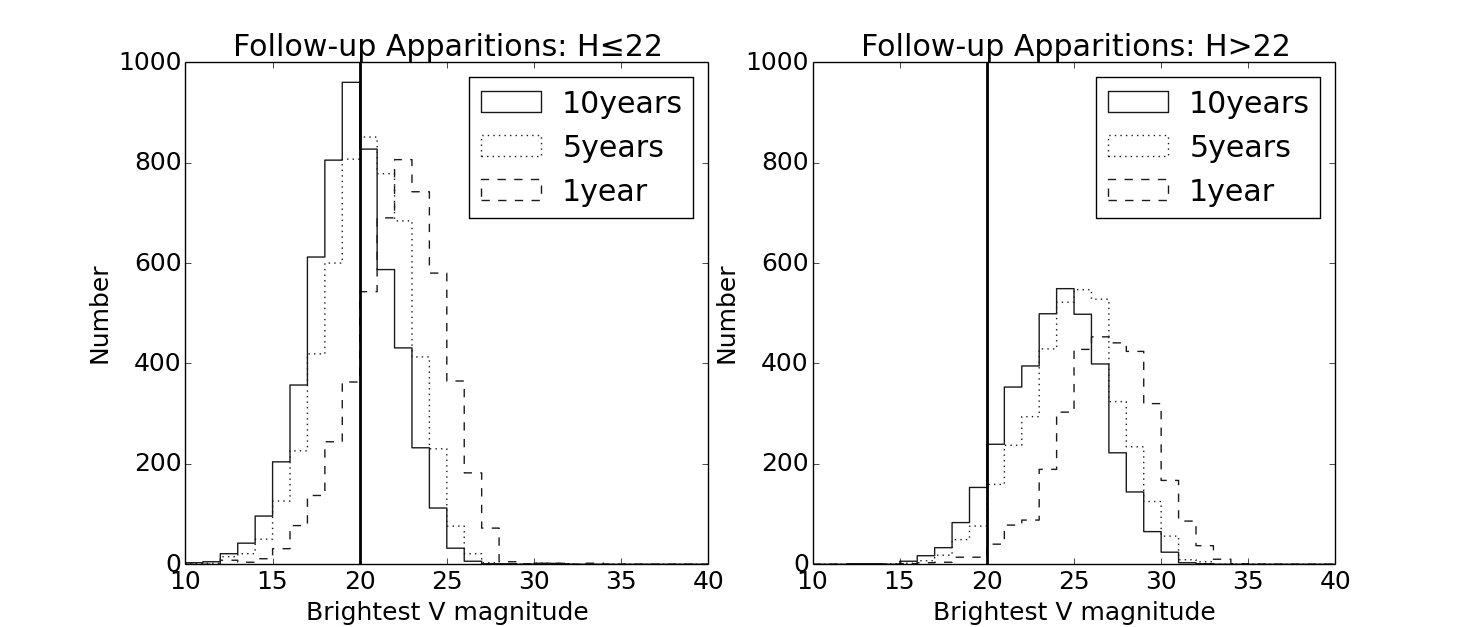
Figure 9 shows that over a period of one year, less than 1% of the known NEA population will become brighter than . Even over a decade, only 17% will reach . By comparison to Figure 5, we see the larger NEAs () typically do return to similar brightnesses within a decade; however, smaller NEAs () are generally no brighter than 5 magnitudes fainter than at discovery, and rarely brighter than . This reflects the bias towards discovering small NEAs during their very closest approaches to Earth.
Most of the NEAs that remain to be discovered and characterized are at the smaller end of the size distribution242424http://sservi.nasa.gov/wp-content/uploads/2014/03/Harris.pdf; if follow-up of these objects is not performed during the discovery apparition, the distribution in Figure 9 suggests that nearly all will remain uncharacterized for over a decade. We conclude that from a brightness point-of-view, follow-up cannot wait for a subsequent apparition but must be performed during the discovery apparition.
5 NEA Positional Constraints
5.1 Orbit Uncertainty
Following discovery, an NEA’s orbit must be determined to sufficient accuracy for the NEA to be successfully re-acquired for follow-up on a subsequent apparition. The uncertainty in an NEA’s orbital solution is quantified by the MPC via the Orbit Uncertainty Parameter, 252525http://www.minorplanetcenter.net/iau/info/UValue.html. is an integer running from 0 (extremely precise orbit) to 9 (highly imprecise orbit). An asteroid with a value of 0 is defined to have an orbit precise enough to allow calculation of its position along its orbital path to within after one decade. Each integer step in is a logarithmic step increase of a factor 4.4 in this uncertainty. So corresponds to an uncertainty of more than 41° after a decade. It is important to understand that is associated with an uncertainty in position along the orbit of the asteroid, which cannot be readily converted to an on-sky positional uncertainty because it would depend on the asteroid’s trajectory with respect to the Earth observer at the time of the observation.
With sufficient observing time and telescope aperture, any NEA of sufficient brightness can be recovered at subsequent apparitions after discovery, but practically speaking, to lie within a typically-sized imaging field (10 arcmin), requires (for an NEA; for Main Belt Asteroids the tolerances are more relaxed). This quality of has to be reached during the discovery apparition to allow for ready recovery, and thus further orbit quality improvement at subsequent apparitions. Radar has the potential to greatly improve the quality of a calculated orbit given that a radar observation can reduce on-sky positional uncertainty of an NEA at the following apparition by up to 2 orders of magnitude or more (Ostro et al., 2002, 2007). Unfortunately, only 100 NEAs are observed each year with radar and, as we discuss in §3.1, many NEAs are out of reach of current radars.
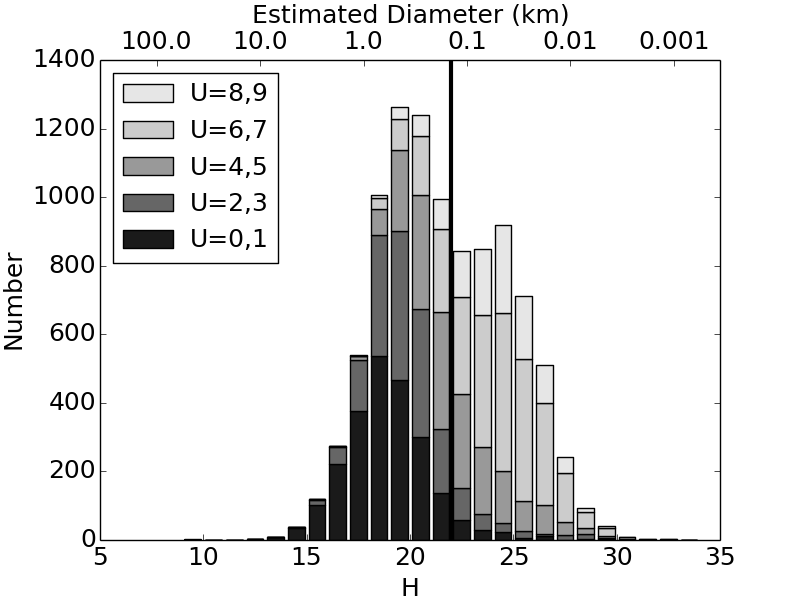
We used the MPC NEA.txt to extract the values of , , number of oppositions, and arc length (given as days for single opposition objects, or years between first and last observation for multi-opposition objects). Figure 10 shows the values as a function of the magnitude for NEAs discovered through 2013 March262626The estimated diameter was calculated using the following relationship (Fowler and Chillemi, 1992) between the diameter, , visual albedo, , and absolute magnitude, : (2) We used a value of , as recommended by Stuart and Binzel (2004).. Over 65% of larger () NEAs have values of , and thus, orbits well-defined enough for re-acquisition on subsequent apparitions. These high-quality orbit determinations come about for two reasons: (1) many were discovered over a decade ago so they have been observed over several apparitions; and (2) being large, they are generally brighter and thus can be discovered (or reobserved) farther from Earth, where their relative motion to Earth leads to slower fading than is the case for smaller objects traveling closer.
However, for smaller NEAs () less than have . By this fraction is reduced to 5%. Only more recent surveys have been able to find significant numbers of NEAs (Figure 1). In addition, this population tends to return at fainter magnitudes (see §4.2 and Figure 9). Therefore, few have been observed over multiple apparitions. The overwhelming fraction of known are thus poor candidates for targeted re-acquisition on the next apparition and will have to be re-discovered by chance. There are only 50 very small NEAs () with very well-determined orbits () such that they could be found beyond the next apparition with a targeted observation.
At the fraction of NEAs with smaller shows a small increase. This we attribute to the fact that smaller NEAs must be physically close to Earth to become bright enough to be detected. When an NEA is discovered close to Earth, its initial orbit will not generally be accurate enough to entirely rule out an impact with our planet. Possible impactors are heavily observed until an improved and more accurate orbit is obtained, with a sufficiently low value of to rule out an impact with 100% certainty.
5.2 Arc Length
The most direct way to reduce the uncertainty in an NEA orbit is to increase the arc length observed during the discovery apparition, and then through re-observation at subsequent apparitions. An NEA’s arc length is simply the number of days elapsed between the first and last time it was observed.
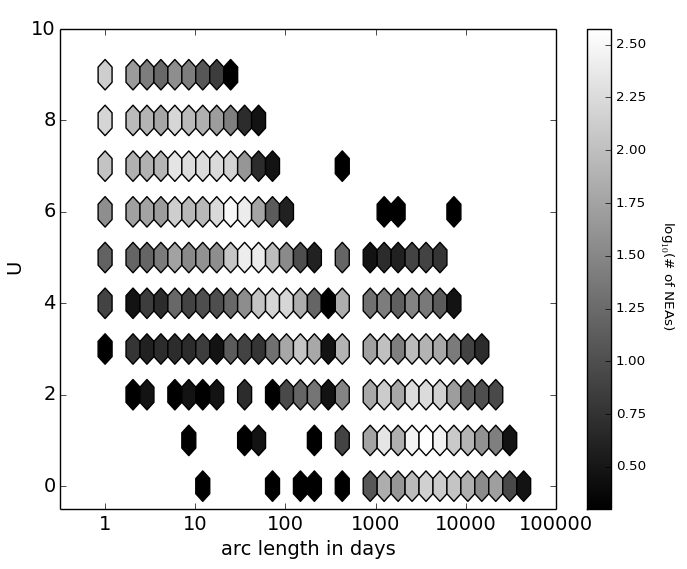
A clear relation of with in days is shown in Figure 11. This figure can be compared to Figure 4 in Desmars et al. (2013), who carried out a similar exercise using the current ephemeris uncertainty as a measure of the orbital uncertainty for all known asteroids (not just NEAs). They found that astrometry conducted within the first 2 days after discovery had the highest impact in reducing positional uncertainty for NEAs; astrometry from that point on until 7–14 days had little effect on the uncertainty, after which point the uncertainty begins to decrease with increasing arc length. Our results corroborate this for the NEAs: Up to 10 days, the is typically 7. Desmars et al. (2013) also found that astrometry on 10–250 day timescales improves the orbit much more rapidly. Our plot bears these results out for NEAs as well: decreases linearly as a function of for arc lengths 10 days. There is a clear ridge line in our figure that defines the typical arc length needed to reach a given value, and by 100–200 days the has typically dropped to 3. The relation between and arc length extends to multiple apparitions. However, even with multiple apparition observations, about 40% of NEAs still have ; this is generally due to an NEA having been observed for short arcs during a few (often non consecutive) apparitions, stressing the need for longer individual observing arcs during each apparition.
Achieving at the discovery apparition typically requires astrometry over an arc length of 3 months (Figure 11). For NEAs, obtaining such a long arc requires large telescopes (4 m class or larger) to ensure the object is detected (see §8). However, the extent to which further astrometric measurements reduce for specific NEAs will depend on the phase of the orbit being observed, as determining orbit curvature is crucial. We will explore this in a subsequent paper. We did search for differences in the arc length vs relation for Aten, Apollo and Amor NEAs separately, but found no difference.
6 Sky Motion
The relative proximity of NEAs means they have proper motions that can potentially limit follow-up observations. In this section we explore NEA sky motions during a typical year. Using NEAobs (see §2) we created ephemerides for all NEAs visible during 2013, and determined the sky motion on the night when each NEA was at its brightest. Figure 12 shows the resulting distribution.
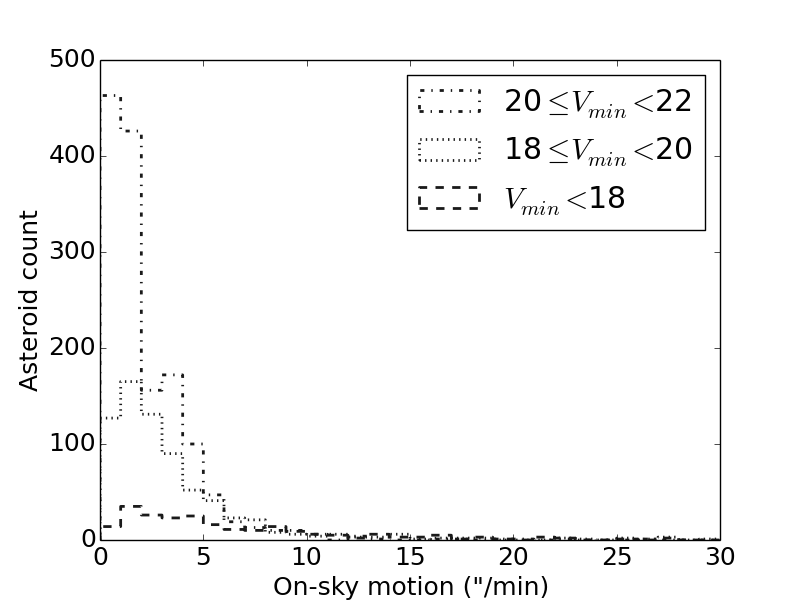
We find that the typical sky motions are 5′′/min, with median 1.5′′/min. This plot can be used to estimate the fraction of targets accessible to a telescope conducting follow-up observations from a sky motion perspective. For example, less than 5% of NEAs visible in 2013 were moving faster than the 9′′/min that the Magellan telescope is capable of tracking, so sky motions would not pose a significant limitation for this case. On the other hand, for any follow-up observations done by sidereal tracking, the sky motion constrains exposure times as described in §8.
7 Hemisphere Bias
All large NEA ground-based surveys, except the recently cancelled Siding Spring Survey in Australia, are in the Northern Hemisphere, so 30% of the most southern part of the celestial sphere is not searched as thoroughly as the rest. Our ephemerides show that 92% of the known NEAs will appear in both hemispheres within a five year period, and 98% within a ten year period. For , this may permit follow-up from either hemisphere on subsequent apparitions. However, given that for the objects will return 5 mag fainter (see §4.2, Figure 9), follow-up may not be possible from either hemisphere. This is investigated further in a future paper.
The limitations discussed in §4.1 (see Figure 9) highlight the need to complete most of the follow-up at discovery. For this reason, some follow-up facilities need to be placed at similar locations to the telescopes being used for discovery. As of 2012, 67% of NEAs are being discovered from the U.S. Southwest region (in an area around 32°N 110°W) by the Catalina Sky Survey and associated Mt. Lemmon Survey, LINEAR272727Lincoln Lab’s Near Earth Asteroid Research program, which was terminated as of 2013., and Spacewatch. Rapid (discovery night) follow-up would argue for very close proximity from a common-weather point of view, while longer-term follow-up (e.g., long-duration coverage of light curves or follow-up in subsequent nights after discovery) could benefit from observatories distributed along longitude and at similar latitudes. Follow-up of discoveries from Hawaii (where Pan-STARRS is currently the second most prolific NEA discovery site) must be made in Hawaii, as the next high-quality observing site to the West is in the Canary Islands, some 15 h away. If rapid follow-up is desired, then this also argues for astrometry of discovery observations to be submitted to the MPC in near realtime.
8 Discussion
Our analysis of the currently-known population of NEAs shows that:
-
1.
The discovery rate of NEAs has remained steady at 365/year over the past decade (see Figure 1), suggesting it will take over 20 years to discover the remaining population of NEAs unless the rate of NEA discovery increases dramatically.
-
2.
The mean magnitude for NEAs being discovered today is , which has been increasing at a rate of 1 mag every 3 years. Meanwhile, the mean discovery magnitude for NEAs is , which has increased at a rate of 1 mag every 7.5 years.
-
3.
60% are discovered within 0.5 mag of their peak brightness during the discovery apparition and they fade quickly: the typical NEO will dim by 0.5 mag after 1 week, 3.5 mag by 4 weeks, and by more than 5 mag by 6 weeks.
-
4.
80% of synodic periods (which define windows for followup in subsequent apparitions) are 3 years so that 3 apparitions per decade are available for charactrization if the returning NEA is sufficiently bright.
-
5.
The average brightness for NEAs on return apparitions in the decade following their discovery is 5 magnitudes (i.e., 100 times) fainter than at discovery. For larger () NEAs, about half of the decade-scale returns achieve similar brightness to that of their discovery apparition.
-
6.
Orbital uncertainties are significant for the bulk of currently known NEAs, as most have been observed for relatively short arcs on a single apparition. Whereas most (60%) of NEAs have , less than 10% of NEAs do. To reduce the orbital uncertainty parameter on the discovery apparition to levels practical for recovery on subsequent apparitions () requires astrometric measurements over arcs 3 months.
-
7.
Sky motions when NEAs are at their observable brightest are generally 5′′/min, with median 1.5′′/min except for very close approaches for which the rate can exceed this by an order of magnitude.
-
8.
Currently, the concentration of surveys in the Northern Hemisphere means that follow-up observatories must be located in the North too for observations on the discovery apparition. However, follow-up of objects on subsequent apparitions can be done from North or South (assuming they can be found), as 92% of these bigger NEAs will appear in both hemispheres within a 5 year period at magnitudes comparable to those at discovery.
We can use these results, along with projected discovery circumstances for the next few years, to determine telescope requirements for various types of follow-up observations.
8.1 Fiducial Magnitudes
We begin by defining a few fiducial magnitudes for exposure time predictions. The mean magnitude at discovery is currently mag (see Figure 2), so to reach the bulk (2/3) of these objects at discovery, observers would need to achieve depths of . However, the mean discovery magnitude among all surveys increases by 1 mag every 7 years, and Pan-STARRS is already achieving this today. Thus, we take as the projected mean discovery magnitude for a year or two from now (and we should expect that to reach 2/3 of the population we would have to get a magnitude or so fainter, to objects with discovery magnitudes of ).
In the discussion that follows, we take the historically-preferred magnitudes and translate them to (or AB mag ), which are more likely representative for the follow-up observations. We do so crudely by taking and note that (AB mag to Vega mag, see section §4 above). With these assumptions and our results from above, we derive the following fiducials:
-
1.
The fast fading of newly-discovered asteroids and 100 fainter reapparitions will require some types of follow-up to be done rapidly (within days) after discovery. Taking the projected mean discovery magnitude of , () and allowing for 0.5 mag of fading in a week, we find that the observations will need to achieve mean depths of (), or for bulk of new objects .
-
2.
For follow-up observations done on a months timescale after discovery the NEAs are expected to be 3 mag fainter still; i.e., we require mean depths of , or for the bulk of new objects .
-
3.
For currently-known NEAs making return apparitions in the next decade, we take the mean discovery magnitude for all NEAs discovered through 2013 March of , with encompassing 2/3 of the objects (see §4.1). For objects, the reapparitions will be similarly bright, setting the observing depths at , or for the bulk of old objects. However, for the objects the depths required to reach the mean is 5 magnitudes fainter. That would be for the bulk of old objects, or for the bright half of old objects.
We show in Table 1 the signal-to-noise (S/N) and exposure times for magnitude ranges around our fiducial magnitudes under dark-sky conditions typical of moonless nights on Kitt Peak and Cerro Tololo282828https://www.noao.edu/kpno/manuals/dim/, accessed 2014/03/17.. We have assumed the performance of a typical modern back-illuminated CCD and take the radius for photometry to be 2 arcsec sampled with sub-arcsecond pixels. (Thus for excellent seeing our estimates would be pessimistic.) Our calculations check out against the online exposure time calculators292929http://www.noao.edu/noao/noaonews/mar99/node16.html; e.g., the Kitt Peak 2.1 m and 4 m telescopes with these assumptions.
| R mag | Circumstances | ||||||
|---|---|---|---|---|---|---|---|
| 2 m | 4 m | 2 m | 4 m | 2 m | 4 m | ||
| 20.5 | 16 s | 2 s | 50 s | 10 s | 45 min | 10 min | Mean for new discoveries on same nights; or, most reapparitions |
| 22.0 | 90 s | 16 s | 7 min | 90 s | … | 2.5 h | Most new discoveries at 1 week |
| 24.0 | 35 m | 10 m | 4 h | 1 h | … | … | Mean for new discoveries at 1 month |
| 25.0 | 4 h | 1 h | … | 5 h | … | … | Most new discoveries at 1 month; or, most reapparitions |
8.2 Requirements for Astrometry
For ground-based astrometry we compute the exposure times needed to achieve tolerances of 0.1 arcsec. For faint objects, with a well-sampled PSF and no image trailing, astrometric precision should be given by Birney et al. (2006):
| (3) |
In 1 arcsec seeing we then require to achieve 0.1 arcsec precision, but as a source at that level is barely significantly detected, in practice one will likely require a slightly higher S/N.
The requirement for no NEA trailing could be satisfied in several ways. One could track non-sidereally on the (potentially imprecisely known) motion of the asteroid, though centroiding the resulting star trails could introduce subtle astrometric biases, for example through timing errors caused by seeing/transparency variations during the exposure. Alternatively, one could take sets of individual exposures short enough to prevent trailing and then combine them later, either by shift-and-add to optimize S/N (which the MPC sternly warns against), or by averaging the individual position measurements. For the typical NEA motion of 1.5 arcsec/min found above, sidereally-tracked exposures would be limited to s.
From Table 1 we see that a 2 m telescope could accomplish the astrometric measurements even with sidereal tracking for newly-discovered objects on timescales of about 1 week (not surprising since the discoveries will be made by 2 m-class telescopes), and for reapparitions of known large NEAs (which will likely be done de facto by future search surveys). Long-arc (months) astrometry of only the brightest new objects could possibly be done on a 2 m by tracking on the asteroid and trailing the stars or shift-and-add. The mean new objects would require a 4 m telescope. Long-arc astrometry of the faintest new objects and the reapparitions would require a larger telescope still. This argues strongly for conducting long-arc astrometry on 4+ m telescopes during the discovery apparitions. The field of view would ideally be 20 arcmin to ensure that enough astrometric standards lie within each image and to accommodate uncertain positions. To ensure a well-sampled PSF would require pixel sizes of 0.5 arcsec.
8.3 Requirements for Light Curves
For light curves, the S/N requirements are much stiffer. In addition, the temporal sampling defines the range of rotation rates for which periods can be determined, with one benchmark being that for “sparsely-sampled” observations over many rotations that will undergo Fourier analysis, the light curve needs to be sampled at intervals no more than 18% of the rotation period (Pravec et al., 2000). The nearly 700 NEAs in the Light Curve Database (see Pravec and Harris, 2000; Warner et al., 2009) with light curve properties listed show amplitudes of 0.4 mag, with rotation periods typically 2.2 h for objects (1/4 of the sample) and 2 h for larger ones.
However, the true distributions are not known, as NEAs with hard-to-measure periods would not be included in the database. In their attempt to measure light curves of 83 sub-km NEAs with a 2.4 m telescope (down to ), Statler et al. (2013) found that 2/3 had ambiguous light curves that would not permit determination of the period. Their cadence was 90 s, and their median photometric precision was 0.04 mag. While their ambiguous cases were measured with typically worse than average precision, they concluded that the ambiguous objects were likely either super-fast or super-slow rotators, or objects with intrinsically low amplitude (e.g., axis-symmetric) objects.
A recent detailed study by Warner and Harris (2011) finds that the predicted yield of Fourier analysis on sparsely-sampled (up to 16 times per night) light curves with noise of 0.03 mag is highest in the period range of 2–6 h and for amplitudes 0.2 mag. Such a strategy could be well-suited to reapparitions of the larger NEAs, typically exhibiting 2 h spin periods and amplitudes of 0.4 mag. For a 2 h period the 18% requirement yields spacings of 20 min. Table 1 shows that observations with a 1-sigma precision per point of a few percent, i.e., 0.03 mag (yielding light curves with S/N 10 and corresponding to the cases discussed by Warner and Harris, 2011), could be obtained with long blocks of time on 2 m-class telescopes. Wide-field surveys for transients are already providing periods for (mostly Main Belt) asteroids this way (e.g., Chang et al., 2014).
However, as Warner and Harris (2011) articulate, there are compelling reasons to measure the spin properties of the smaller ( m) NEAs: This size regime has been poorly sampled; it is susceptible to radiation pressure effects, which could then be quantified; allows probing below the “spin barrier” at 2.2 h; can show if at these sizes, asteroids still have satellites; does the fraction of tumblers increase with size?
As most new discoveries will be smaller NEAs, they will likely be fast-spinning and fade fast, so cannot be observed for many nights. For light curve requirements for these objects we adopt as a benchmark the same photometric precision of 3% and set the cadence at 30 s to potentially reach periods under 10 minutes (or less if several periods are observed). We conclude that even a 4 m-class telescope could accomplish this only for the brighter new discoveries on the same night.
Some light curve work has already been done on a very large telescope. Kwiatkowski et al. (2010) reported on a pilot program to use the 10 m SALT telescope to measure 14 NEAs with , with 5–60 s exposures (various instrumental issues limited them to 0.1 mag precision). They measured periods ranging from 77 s to 44 min. A dedicated campaign that observed all of the newly-discovered NEAs for 3 months could double the sample of periods for this population.
Finally, Warner and Harris (2011) cite the potential usefulness (and outreach synergy) of smaller (0.5–1 m) telescopes in obtaining light curve observations in the range . Exposure times to reach the required S/N would force a multi-rotation Fourier analysis approach for most of this range on small telescopes, which is better-suited to the large () NEAs. Figure 4 indicates current rates of 1 new discovery per night overall within this magnitude range. But for any newly-discovered NEAs (and of the known population, about 1/4 were discovered with ), their (likely) fast rotations would demand faster cadences and a 2 m-class telescope. Meanwhile, for reapparitions of currently known NEAs, 10% (or 1,000 NEAs) will achieve within a decade (§4.2).
8.4 Requirements for Spectra
Optical reflectance spectra with modest resolution () of Main Belt asteroids were the basis of the Bus and Binzel (2002) asteroid taxonomy scheme. They provide a breakdown of types into Carbonaceous (C), Stony (S), and Metallic and Unknown (X), and into several sub-types. The currently standard optical-infrared Bus-DeMeo taxonomy (DeMeo et al., 2009) is superior to the Bus-Binzel taxonomy as it adds spectral diagnostics in the near-IR (1.0–2.5 microns) to the optical. All but three of the 26 Bus-Binzel taxonomy classes are preserved, with just one new class (Sv) defined in the Bus-DeMeo scheme. For some purposes, the visible-only regime preserves useful discriminants among types (e.g., see Figures 8, 10 and 13 in Bus and Binzel, 2002). From the NEO perspective, many key classes are defined only by their visible-wavelength features; e.g., the selection of potential metallic M-type objects from the two other sub-classes of the X-class, is improved by rejecting the 30% of E-types with a strong 0.49 mm optical feature. The 0.7 mm band, though uncommon in NEOs, is the only alternative to the 3.1 mm feature to diagnose hydrated minerals.
Optical to infrared spectra of NEAs as faint as can be obtained with an exposure of 30–60 minutes using the spectrograph SpeX on the 3 m Infrared Telescope Facility (IRTF) on Mauna Kea, Hawai’i303030http://irtfweb.ifa.hawaii.edu/~spex/ (R.P. Binzel, priv. comm.). Figure 4 indicates that this would apply to 100 (10% and decreasing) newly-discovered NEAs per year. Optical to infrared spectra of NEAs as faint as (Moskovitz, 2012) can be taken in a 1 hour exposure with the FIRE spectrograph on the 6.5 m Magellan telescopes at Las Campanas Observatory in Chile313131http://obs.carnegiescience.edu/Magellan/ (Simcoe et al., 2010). However, for projected new discoveries, () would reach only the brightest 1/3 of objects (see §8.1), and then only on the discovery night. Most reapparitions would be reachable, but only if the astrometry were of sufficient accuracy to be able to place the NEA in the spectrograph slit.
An alternative approach is to forego infrared spectroscopy. Optical spectroscopy is much less demanding than near-infrared spectroscopy as the atmospheric background is orders-of-magnitude fainter. A 2 m-class telescope with an efficient spectrograph can obtain a modest resolution () spectrum with S/N 15 for a () NEA in under 1 h (e.g., the LINNEAUS project; see Elvis et al., 2014); this represents the mean new discovery on the discovery night, and most reapparitions. New discoveries would require a 4 m telescope after a week.
This argues strongly for a dedicated 2 m telescope equipped with a high-efficiency visible wavelength spectrometer. At a good site, a telescope can effectively observe faint NEAs for 210 nights of the year, after weather (15%), full Moon (25%) and equipment maintenance (5%) are excluded323232http://www.gemini.edu/sciops/statistics/. Assuming an average 10 h of observation per night, a dedicated NEA telescope/spectrograph combination could obtain 2,000 spectra/year. Such a setup could keep pace with new NEA discoveries with same/next night spectroscopic followup. It would double the sample of NEA spectra within the first 6 months and would extend the coverage to small objects.
8.5 Requirements for Colors
In the absence of spectra, broad-band colors can in some cases provide some level of discrimination among asteroid types, for example as shown for the griz SDSS filters by DeMeo and Carry (2013) and Ivezić et al. (2001). From their figures, we judge that photometry at the level of a few percent would be sufficient (higher precision would not necessarily be helpful as the scatter in colors within a population is typically on the order of 0.1 mag). One significant complication is that the NEA’s light in all bands will be modulated by its rotation. For big NEAs (), periods can be many hours, but for the smaller NEAs periods are typically 2.2 h (see §8.3). For very fast rotators, long exposures would give an average over the light curve and thus could be used to get (average) colors. But for exposures on, or separated by, timescales significant compared to the (generally unknown) period, there will be light-curve-dependent corrections depending on the (generally unknown) amplitude, which is often nearly half a magnitude (see §8.3). In any case, exposures can be tracked on the asteroid.
Interpolating between the and 100 columns in Table 1, and using the -band exposure time as a reasonable estimate for the average exposure time over , , and , we conclude that 2 m telescopes could achieve the required precision in short (minutes per filter) exposures for most reapparitions and the mean new discoveries. Longer exposures (hours to get multiple filters) would be needed for each new mean NEA a week after discovery, which would only be practical for fast rotators but which is not likely worth the time given the crude diagnostic they would permit; low-resolution spectroscopy as described above would be a better choice. A 4 m telescope would be somewhat more practical for multicolor photometry of fast-rotating new discoveries out to a week, where 4 filters could be done on an hour timescale.
8.6 Requirements for Phase Curves
By measuring the brightness of an asteroid over a range of phase angles () it is possible to derive an estimate of its absolute magnitude. Moreover, it has been shown that different taxonomic classes show distinct linear relationships between phase angle and magnitude (for °), and that the slope of this line (the phase coefficient, ) is related to the albedo of the asteroid (Belskaya and Shevchenko, 2000). These relationships appear to hold true for smaller asteroids too (Hergenrother et al., 2013). Thus, by measuring a phase curve we obtain an estimate of the asteroid’s albedo and broad taxonomic class, as well as its absolute magnitude. If the absolute magnitude is already known, the phase curve can be used to estimate the slope parameter .
10–20% photometry would be good enough for constraining the phase curve if measured over a large enough range of phase angles, and hence over long enough observation arcs . The photometric S/N constraint is more stringent than the minimal one for astrometry, and thus astrometric measurements could be made “for free” from these observations. Or, put another way, useful phase curve photometry could come out of the data taken for astrometry if the field were large enough to contain some of the growing number of faint photometric standard stars. Given that there are already sufficient stars in a 30 arcmin field of view to permit photometry at the few percent level (Pickles and Depagne, 2010) and that the AAVSO Photometric All-Sky Survey333333http://www.aavso.org/apass/ is still in progress, a 20 arcmin field like that suggested for astrometry will prove sufficient. The photometric standard surveys have a faint limit of . While exposures targeting the magnitudes expected for the faintest NEA discoveries might have these faint standards saturated, interweaving quick exposures would permit photometric calibration.
From Table 1 we conclude that a 2 m telescope could be used for phase curve measurements for most reapparitions as well as most new discoveries out to a couple of weeks. A 4 m could extend coverage to a month for the mean new discovery at an hour per exposure (but keep in mind the complications from light curve modulation; see §8.5). This might not be justifiable based on the phase curve knowledge alone but it would make sense to plan the long-arc astrometric followup observations to have longer exposure times (either in single exposures or by coadding) than strictly necessary for the astrometry itself, to permit the phase curve measurements at large phase angles.
9 Conclusions
We have used properties of the over 10,000 known NEAs and their discovery circumstances to show that rapid follow-up after discovery is essential for closing the wide, and increasing, gap between discovery and characterization on a decade timescale, particularly as an increasing number of new discoveries will be of smaller () NEAs that are projected to be 100 fainter on subsequent apparitions.
Spectral follow-up that keeps pace with discoveries could be accomplished with a dedicated 2 m telescope observing NEAs within days of discovery. Long-arc (months) astrometry would require a 4+ m telescope, and the same observations could be used to measure phase curves and colors that would help to constrain albedos. Light curves for the bigger (and likely more slowly-rotating) new NEAs could be collected shortly after discovery with a 2 m telescope, but the cadence required to measure fast rotations likely for smaller new NEAs would necessitate rapid follow-up with a 4 m telescope.
Already-known large () NEAs making return apparitions are predicted to reach brightnesses similar to their discovery magnitudes (generally brighter than the discoveries projected for new surveys, which will thus likely measure astrometry for them by default). For this subset of objects, targeted follow-up spectroscopy and photometry can be done with 2 m telescopes. For the brightest of these, 1 m-class amateur telescopes can contribute light curves and astrometry.
If means are insufficient to fund the necessary telescopes, which should be prioritized? Spectral classification yields the highest scientific return as it provides composition, which also yields an albedo estimate, and thus a more stringent constraint on an object’s size. Light curves may provide structural information or reveal a binary system.
Lastly, astrometric measurements are of value if one desires to perform targeted observations at a subsequent apparition after discovery and thus requires a precise orbit. It should be noted that orbits obtained within the first few days or weeks of an NEA’s discovery are generally good enough to securely establish the shape and location of the orbit in space (Lee et al., 2015), while further observations, especially at future aparitions, will do most to improve the accuracy of locating the asteroid along its orbit, and thus on the sky. The level of accuracy achieved for the initial orbit is sufficient for studies of the shapes and distribution of asteroid orbits and their evolution over time; it is also sufficient to determine if it intersects with, or is close enough to, Earth’s orbit that an asteroid with that orbit could be at risk of impact with our planet.
Because the majority of new NEAs are not going to pose any danger of short- or mid-term impact, it may be argued that a more precise orbit at time of discovery is unnecessary because an NEA will be serendipitously reobserved by the surveys at some future apparition(s) and linked back by the Minor Planet Center to its discovery apparition. In this case, improving the accuracy of an orbit becomes a game of wait-n’-see, which argues strongly for characterization to take place during the discovery apparition as there is no guarantee a new NEA will be found at a later apparition with a targeted observation. This strategy, however, is unacceptable for mission planning, where the location of a target asteroid would need to be known with high accuracy years ahead of launch. Commercial ventures planning to send probes to many NEAs of varying sizes (Elvis and Esty, 2014) would benefit greatly from more accurate orbits being determined during the discovery apparition if they intend to be able to act quickly on newly-discovered profitable asteroids.
We have shown that a small group of dedicated telescopes (one 4 m and two 2 m, with help from smaller amateur contributions) could characterize or constrain the spectral class, albedo and spin period of most new NEA discoveries while also working through the backlog of known NEAs. There are compelling scientific reasons to do, which also have implications for planetary defence: Understanding the composition and structural make up of the smaller () NEAs will provide knowledge of the size group of asteroids most likely to impact Earth in the near future, while testing current theories of how the NEA population is fed by the Main Belt.
Acknowledgments
We thank both T. Spahr and G. Williams (MPC) for answering numerous questions, and the anonymous referees for keeping us honest and improving this paper through their inquisitiveness. C. Beeson thanks M. Trichas and J. Connolly for their guidance with Python coding; D. Polishook for an insight into NEA spectroscopy; and as F.E. DeMeo and R.P. Binzel for crucial information with regards to spectroscopy. J.L. Galache was funded by NASA Grant NNX12AE89G. This research has made use of data and/or services provided by the International Astronomical Union’s Minor Planet Center.
References
- Abell et al. (2014) Abell, P., Nuth, J. A., Mazanek, D. D., Merrill, R. G., Reeves, D. M., Naasz, B. J., Nov. 2014. NASA’s Asteroid Redirect Mission: The Boulder Capture Option. In: AAS/Division for Planetary Sciences Meeting Abstracts. Vol. 46 of AAS/Division for Planetary Sciences Meeting Abstracts. p. 403.01.
- Belskaya and Shevchenko (2000) Belskaya, I. N., Shevchenko, V. G., Sep. 2000. Opposition Effect of Asteroids. Icarus 147, 94–105.
- Birney et al. (2006) Birney, D. S., Gonzalez, G., Oesper, D., Jun. 2006. Observational Astronomy - 2nd Edition.
- Borovička et al. (2013) Borovička, J., Spurný, P., Brown, P., Wiegert, P., Kalenda, P., Clark, D., Shrbený, L., Nov. 2013. The trajectory, structure and origin of the Chelyabinsk asteroidal impactor. Nature 503, 235–237.
- Bottke et al. (2002) Bottke, W. F., Morbidelli, A., Jedicke, R., Petit, J.-M., Levison, H. F., Michel, P., Metcalfe, T. S., Apr. 2002. Debiased Orbital and Absolute Magnitude Distribution of the Near-Earth Objects. Icarus 156, 399–433.
- Brown et al. (2013) Brown, P. G., Assink, J. D., Astiz, L., Blaauw, R., Boslough, M. B., Borovička, J., Brachet, N., Brown, D., Campbell-Brown, M., Ceranna, L., Cooke, W., de Groot-Hedlin, C., Drob, D. P., Edwards, W., Evers, L. G., Garces, M., Gill, J., Hedlin, M., Kingery, A., Laske, G., Le Pichon, A., Mialle, P., Moser, D. E., Saffer, A., Silber, E., Smets, P., Spalding, R. E., Spurný, P., Tagliaferri, E., Uren, D., Weryk, R. J., Whitaker, R., Krzeminski, Z., Nov. 2013. A 500-kiloton airburst over Chelyabinsk and an enhanced hazard from small impactors. Nature 503, 238–241.
- Brown Jr. (2005) Brown Jr., G. E., 2005. NEO Survey Act, Public Law No. 109-155.
- Bus and Binzel (2002) Bus, S. J., Binzel, R. P., Jul. 2002. Phase II of the Small Main-Belt Asteroid Spectroscopic Survey. A Feature-Based Taxonomy. Icarus 158, 146–177.
- Chang et al. (2014) Chang, C.-K., Ip, W.-H., Lin, H.-W., Cheng, Y.-C., Ngeow, C.-C., Yang, T.-C., Waszczak, A., Kulkarni, S. R., Levitan, D., Sesar, B., Laher, R., Surace, J., Prince, T. A., the PTF Team, May 2014. 313 new asteroid rotation periods from Palomar Transient Factory observations. ArXiv e-prints.
- Chesley et al. (2002) Chesley, S. R., Chodas, P. W., Milani, A., Valsecchi, G. B., Yeomans, D. K., Oct. 2002. Quantifying the Risk Posed by Potential Earth Impacts. Icarus 159, 423–432.
- Chesley et al. (2014) Chesley, S. R., Farnocchia, D., Nolan, M. C., Vokrouhlický, D., Chodas, P. W., Milani, A., Spoto, F., Rozitis, B., Benner, L. A. M., Bottke, W. F., Busch, M. W., Emery, J. P., Howell, E. S., Lauretta, D. S., Margot, J.-L., Taylor, P. A., Jun. 2014. Orbit and bulk density of the OSIRIS-REx target Asteroid (101955) Bennu. Icarus 235, 5–22.
- DeMeo et al. (2009) DeMeo, F. E., Binzel, R. P., Slivan, S. M., Bus, S. J., Jul. 2009. An extension of the Bus asteroid taxonomy into the near-infrared. Icarus 202, 160–180.
- DeMeo and Carry (2013) DeMeo, F. E., Carry, B., Sep. 2013. The taxonomic distribution of asteroids from multi-filter all-sky photometric surveys. Icarus 226, 723–741.
- Denneau et al. (2013) Denneau, L., Jedicke, R., Grav, T., Granvik, M., Kubica, J., Milani, A., Vereš, P., Wainscoat, R., Chang, D., Pierfederici, F., Kaiser, N., Chambers, K. C., Heasley, J. N., Magnier, E. A., Price, P. A., Myers, J., Kleyna, J., Hsieh, H., Farnocchia, D., Waters, C., Sweeney, W. H., Green, D., Bolin, B., Burgett, W. S., Morgan, J. S., Tonry, J. L., Hodapp, K. W., Chastel, S., Chesley, S., Fitzsimmons, A., Holman, M., Spahr, T., Tholen, D., Williams, G. V., Abe, S., Armstrong, J. D., Bressi, T. H., Holmes, R., Lister, T., McMillan, R. S., Micheli, M., Ryan, E. V., Ryan, W. H., Scotti, J. V., Apr. 2013. The Pan-STARRS Moving Object Processing System. PASP 125, 357–395.
- Desmars et al. (2013) Desmars, J., Bancelin, D., Hestroffer, D., Thuillot, W., Jun. 2013. Statistical and numerical study of asteroid orbital uncertainty. A&A 554, A32.
- Elvis (2014) Elvis, M., Feb. 2014. How many ore-bearing asteroids? Planet. Space Sci. 91, 20–26.
- Elvis et al. (2014) Elvis, M., Allen, L., Christensen, E., DeMeo, F., Evans, I., Evans, J., Galache, J. L., Konidaris, N., Najita, J., Spahr, T., Mar. 2014. LINNAEUS: Boosting Near-Earth Asteroid Characterization Rates. In: Lunar and Planetary Science Conference. Vol. 45 of Lunar and Planetary Science Conference. p. 1047.
- Elvis and Esty (2014) Elvis, M., Esty, T., Mar. 2014. How many assay probes to find one ore-bearing asteroid? Acta Astronautica 96, 227–231.
- Emel’yanenko et al. (2013) Emel’yanenko, V. V., Popova, O. P., Chugai, N. N., Shelyakov, M. A., Pakhomov, Y. V., Shustov, B. M., Shuvalov, V. V., Biryukov, E. E., Rybnov, Y. S., Marov, M. Y., Rykhlova, L. V., Naroenkov, S. A., Kartashova, A. P., Kharlamov, V. A., Trubetskaya, I. A., Jul. 2013. Astronomical and physical aspects of the Chelyabinsk event (February 15, 2013). Solar System Research 47, 240–254.
- Fowler and Chillemi (1992) Fowler, J. W., Chillemi, J. R., Dec. 1992. The IRAS Minor Planet Survey. Tech. Rep. PL-TR-92-204, Phillips Laboratory, Hanscom AF Base, MA, available from http://irsa.ipac.caltech.edu/IRASdocs/surveys/PL-TR-92-2049.pdf.
- Freedman and Kaufmann (2005) Freedman, R. A., Kaufmann, W. J., 2005. Universe, 7th Edition. W.H. Freeman.
- Greenstreet et al. (2012) Greenstreet, S., Ngo, H., Gladman, B., Jan. 2012. The orbital distribution of Near-Earth Objects inside Earth’s orbit. Icarus 217, 355–366.
- Hergenrother et al. (2013) Hergenrother, C. W., Nolan, M. C., Binzel, R. P., Cloutis, E. A., Barucci, M. A., Michel, P., Scheeres, D. J., d’Aubigny, C. D., Lazzaro, D., Pinilla-Alonso, N., Campins, H., Licandro, J., Clark, B. E., Rizk, B., Beshore, E. C., Lauretta, D. S., Sep. 2013. Lightcurve, Color and Phase Function Photometry of the OSIRIS-REx Target Asteroid (101955) Bennu. Icarus 226, 663–670.
- Ivezić et al. (2001) Ivezić, Ž., Tabachnik, S., Rafikov, R., Lupton, R. H., Quinn, T., Hammergren, M., Eyer, L., Chu, J., Armstrong, J. C., Fan, X., Finlator, K., Geballe, T. R., Gunn, J. E., Hennessy, G. S., Knapp, G. R., Leggett, S. K., Munn, J. A., Pier, J. R., Rockosi, C. M., Schneider, D. P., Strauss, M. A., Yanny, B., Brinkmann, J., Csabai, I., Hindsley, R. B., Kent, S., Lamb, D. Q., Margon, B., McKay, T. A., Smith, J. A., Waddel, P., York, D. G., SDSS Collaboration, Nov. 2001. Solar System Objects Observed in the Sloan Digital Sky Survey Commissioning Data. AJ 122, 2749–2784.
- Kwiatkowski et al. (2010) Kwiatkowski, T., Buckley, D. A. H., O’Donoghue, D., Crause, L., Crawford, S., Hashimoto, Y., Kniazev, A., Loaring, N., Romero Colmenero, E., Sefako, R., Still, M., Vaisanen, P., Jan. 2010. Photometric survey of the very small near-Earth asteroids with the SALT telescope . I. Lightcurves and periods for 14 objects. A&A 509, A94.
- Lee et al. (2015) Lee, D., Elvis, M., Galache, J. L., 2015. In preparation.
- Mainzer et al. (2011) Mainzer, A., Grav, T., Bauer, J., Masiero, J., McMillan, R. S., Cutri, R. M., Walker, R., Wright, E., Eisenhardt, P., Tholen, D. J., Spahr, T., Jedicke, R., Denneau, L., DeBaun, E., Elsbury, D., Gautier, T., Gomillion, S., Hand, E., Mo, W., Watkins, J., Wilkins, A., Bryngelson, G. L., Del Pino Molina, A., Desai, S., Gómez Camus, M., Hidalgo, S. L., Konstantopoulos, I., Larsen, J. A., Maleszewski, C., Malkan, M. A., Mauduit, J.-C., Mullan, B. L., Olszewski, E. W., Pforr, J., Saro, A., Scotti, J. V., Wasserman, L. H., Dec. 2011. NEOWISE Observations of Near-Earth Objects: Preliminary Results. ApJ 743, 156.
- Moskovitz (2012) Moskovitz, N. A., Sep. 2012. Colors of dynamically associated asteroid pairs. Icarus 221, 63–71.
- Muinonen et al. (2002) Muinonen, K., Piironen, J., Shkuratov, Y. G., Ovcharenko, A., Clark, B. E., 2002. Asteroid Photometric and Polarimetric Phase Effects. Asteroids III, 123–138.
- Ostro et al. (2007) Ostro, S. J., Giorgini, J. D., Benner, L. A. M., May 2007. Radar reconnaissance of near-Earth asteroids. In: Valsecchi, G. B., Vokrouhlický, D., Milani, A. (Eds.), IAU Symposium. Vol. 236 of IAU Symposium. pp. 143–150.
- Ostro et al. (2002) Ostro, S. J., Hudson, R. S., Benner, L. A. M., Giorgini, J. D., Magri, C., Margot, J. L., Nolan, M. C., 2002. Asteroid Radar Astronomy. Asteroids III, 151–168.
- Pickles and Depagne (2010) Pickles, A., Depagne, É., Dec. 2010. All-Sky Spectrally Matched UBVRI-ZY and u’g’r’i’z’ Magnitudes for Stars in the Tycho2 Catalog. PASP 122, 1437–1464.
- Pravec and Harris (2000) Pravec, P., Harris, A. W., Nov. 2000. Fast and Slow Rotation of Asteroids. Icarus 148, 12–20.
- Pravec et al. (2012) Pravec, P., Harris, A. W., Kušnirák, P., Galád, A., Hornoch, K., Sep. 2012. Absolute magnitudes of asteroids and a revision of asteroid albedo estimates from WISE thermal observations. Icarus 221, 365–387.
- Pravec et al. (2000) Pravec, P., Hergenrother, C., Whiteley, R., Šarounová, L., Kušnirák, P., Wolf, M., Oct. 2000. Fast Rotating Asteroids 1999 TY 2, 1999 SF 10, and 1998 WB 2. Icarus 147, 477–486.
- Shoemaker (1983) Shoemaker, E. M., 1983. Asteroid and comet bombardment of the earth. Annual Review of Earth and Planetary Sciences 11, 461–494.
- Shoemaker et al. (1979) Shoemaker, E. M., Williams, J. G., Helin, E. F., Wolfe, R. F., 1979. Earth-crossing asteroids - Orbital classes, collision rates with earth, and origin. pp. 253–282.
- Simcoe et al. (2010) Simcoe, R. A., Burgasser, A. J., Bochanski, J. J., Schechter, P. L., Bernstein, R. A., Bigelow, B. C., Pipher, J. L., Forrest, W., McMurtry, C., Smith, M. J., Fishner, J., Jul. 2010. The FIRE infrared spectrometer at Magellan: construction and commissioning. In: Society of Photo-Optical Instrumentation Engineers (SPIE) Conference Series. Vol. 7735 of Society of Photo-Optical Instrumentation Engineers (SPIE) Conference Series.
- Statler et al. (2013) Statler, T. S., Cotto-Figueroa, D., Riethmiller, D. A., Sweeney, K. M., Jul. 2013. Size matters: The rotation rates of small near-Earth asteroids. Icarus 225, 141–155.
- Stuart and Binzel (2004) Stuart, J. S., Binzel, R. P., Aug. 2004. Bias-corrected population, size distribution, and impact hazard for the near-Earth objects. Icarus 170, 295–311.
- Thomas et al. (2011) Thomas, C. A., Trilling, D. E., Emery, J. P., Mueller, M., Hora, J. L., Benner, L. A. M., Bhattacharya, B., Bottke, W. F., Chesley, S., Delbó, M., Fazio, G., Harris, A. W., Mainzer, A., Mommert, M., Morbidelli, A., Penprase, B., Smith, H. A., Spahr, T. B., Stansberry, J. A., Sep. 2011. ExploreNEOs. V. Average Albedo by Taxonomic Complex in the Near-Earth Asteroid Population. AJ 142, 85.
- Warner and Harris (2011) Warner, B. D., Harris, A. W., Dec. 2011. Using sparse photometric data sets for asteroid lightcurve studies. Icarus 216, 610–624.
- Warner et al. (2009) Warner, B. D., Harris, A. W., Pravec, P., Jul. 2009. The asteroid lightcurve database. Icarus 202, 134–146.
- Williams (2015) Williams, G. V., 2015. In preparation.