Superconductivity versus structural phase transition in the closely related Bi2Rh3.5S2 and Bi2Rh3S2
Abstract
Single crystals of Bi2Rh3S2 and Bi2Rh3.5S2 were synthesized by solution growth and the crystal structures, thermodynamic and transport properties of both compounds were studied. In the case of Bi2Rh3S2, a structural first-order transition at around 165 K is identified by single crystal diffraction experiments, with clear signatures visible in resistivity, magnetization and specific heat data. No superconducting transition for Bi2Rh3S2 was observed down to 0.5 K. In contrast, no structural phase transition at high temperature was observed for Bi2Rh3.5S2, however bulk superconductivity with a critical temperature, 1.7 K was observed. The Sommerfeld coefficient and the Debye temperature() were found to be 9.41 mJ mol-1 K-2 and 209 K respectively for Bi2Rh3S2, and 22 mJ mol-1 K-2 and 196 K respectively for Bi2Rh3.5S2. Study of the specific heat in the superconducting state of Bi2Rh3.5S2 suggests that Bi2Rh3.5S2 is a weakly coupled, BCS superconductor.
I Introduction
Superconductivity and charge density waves (CDWs) are fascinating and closely linked collective phenomena. The CDW in low dimensional materials was first proposed by PeierlsPeierls (1930, 1955), who showed that a one dimensional metal was unstable against a periodic lattice distortion which creates an energy gap at the Fermi level. Superconductivity and CDW states were linked when Fröhlich proposed a mechanism of superconductivity based on a sliding, incommensurate CDWFröhlich (1954). Following the formulation of the BCS theoryBardeen et al. (1957) of superconductivity, it was appreciated that the superconducting state and the CDW state are both results of electron-phonon coupling often with the CDW state competing with and ultimately replacing the superconducting state as electron-phonon coupling is increased. In some, relatively rare, compounds both transitions can be found upon cooling; more often, though, a CDW or some other type of structural phase transition removes density of states at the Fermi surface and thus suppresses or even precludes the formation of a superconducting state.
It is interesting to study the properties of the materials which manifest the co-existence of superconducting and CDW states, so as to gain a better understanding of how they compete with each other for the density of states as each opens a gap at the Fermi levelGabovich and Voitenko (2000); Gabovich et al. (2001); Wilson et al. (1974); Harper et al. (1975); Monceau et al. (1976); Di Salvo et al. (1976); Shelton et al. (1986); Becker et al. (1999); Ramakrishnan (2002); Singh et al. (2005); Morosan et al. (2006). The electrical transport properties of some ternary, metal-rich chalcogenidesMichener and Peacock (1943); Peacock and McAndrew (1950); Brower et al. (1974), (=Sn,Pb,In,Tl and Bi; =Co,Ni,Rh and Pd; =S and Se) have been reported by Natarajan and co-workersNatarajan et al. (1988) with some members of this family showing superconductivity at low temperatureSakamoto et al. (2006, 2008); Lin et al. (2012). Recently Sakamoto and co-workers reported that parkerite-type Bi2Rh3Se2Sakamoto et al. (2007) was a new superconducting compound (with a critical temperature, , 0.7 K) with a possible higher temperature CDW transition at 250 K. Pressure studies on this compoundChen et al. (2014) found that the resistivity anomaly at 250 K shifted to higher temperature with increasing pressure, which is unusual for a conventional CDW transitionChu et al. (1977); Briggs et al. (1980); Bud’ko et al. (2006). Given that isostructural Bi2Rh3S2 is reported to have a resistive anomaly near 160 K (having been measured down to 77 K)Natarajan et al. (1988), measurements of single crystalline Bi2Rh3S2 to lower temperatures are called for.
Using solution growth out of a Rh rich Rh-Bi-S meltLin et al. (2012), our initial growth attempts produced large grain, crystalline material that showed a clear resistivity feature near 160 K but also an apparent superconducting transition near 2 K. These results indicated that there may be some form of competition or interaction between structural phase transition and superconductivity in this ternary system. A powder x-ray diffraction measurement revealed the anticipated Bi2Rh3S2 phase, but also indicated the presence of a second phase.
In order to better understand the physics and chemistry of this part of the Bi-Rh-S system, in this paper we present details of the crystal growth of both Bi2Rh3S2 and a new phase: Bi2Rh3.5S2, provide structural data, and present and analyze thermodynamic and transport data from each compound. Whereas Bi2Rh3S2 manifests a first order, structural phase transition near 160 K and does not superconduct for 0.5 K, Bi2Rh3.5S2 manifests no signs of any phase transition for 2 K 300 K has a significantly larger electronic specific heat coefficient, , and manifests bulk superconductivity below 2 K. Instead of finding the co-existence of a structural phase transition and subsequent superconductivity in one compound we found two closely related compounds: one that manifests a structural phase transition near 160 K and has a relatively lower electronic specific heat at low temperatures and another that does not undergo a structural phase transition upon cooling, has a relatively larger electronic specific heat and does become superconducting below 2 K.
II Experimental Methods
Single crystals of Bi2Rh3.5S2 and Bi2Rh3S2 were produced using solution growth techniquesCanfield and Fisk (1992); Canfield and Fisher (2001); Lin et al. (2012). For Bi2Rh3S2, a mixture of elemental Rh, Bi and S was placed in a 2 mL fritted alumina cruciblePetrovic et al. (2012) with a molar ratio of Rh:Bi:S = 42.6:28.2:29.2 and sealed in a silica ampule under partial pressure of high purity argon gas. The sealed ampule was heated to 1150 \celsius over 12 hours and held there for 3 hours. After that, it was cooled to 900\celsius over 70 hours and excess liquid was decanted using a centrifuge. For Bi2Rh3.5S2, a molar ratio of Rh:Bi:S = 55:22.5:22.5 was used, heated and cooled in a similar manner but slowly cooled to 775 \celsius before decanting.
Powder X-ray diffraction data were collected by using a Rigaku Miniflex II diffractometer at room temperature (Cu Kα radiation). Samples were prepared by grinding single crystals into powder and spreading them onto a thin grease layer coated single crystal Si, low background puck. Powder x-ray diffraction data were analyzed using GSASToby (2001); Larson and Von Dreele (2000) program.
Single crystal diffraction data were measured using a Bruker Smart Apex CCD diffractometerSMA (2003) with Mo Kα radiation ( = 0.71073 Å). Data were collected with mixed scan modes and with an exposure time of 10 s per frame. The 2 range covered from 6° to 64 °. Intensities were extracted and corrected for Lorentz and polarization effects with the SAINT program. Empirical absorption correctionsBlessing (1995) were accomplished with SADABS, which is based on modeling a transmission surface by spherical harmonics employing equivalent reflections with I 3 (I). Using the SHELXTL packageSheldrick (2002), crystal structures were solved using direct methods and refined by full-matrix least-squares on F2. Lattice parameters were refined using single crystal diffraction data and are summarized in Table 1. Atomic coordinates and displacement parameters with fully site occupation for Bi2Rh3S2 and Bi2Rh3.5S2 are given in Table 2.
The ac resistivity ( = 17 Hz) was measured as a function of temperature by the standard four probe method in a Quantum Design, Physical Property Measurement System (PPMS) instrument. Depending on the sample size Pt or Au wires (with the diameter of 25 m or 12.7 m respectively) were attached to the samples using Epotek-H20E silver epoxy or DuPont 4929N silver paint. The specific heat was measured by using the relaxation method in a Physical Property Measurement System. The 3He option was used to obtain a measurements down to 0.4 K. The DC magnetization measurements were performed in a Quantum Design, Magnetic Property Measurement System (MPMS).
| Formula | Bi2Rh3S2 (293 K) | Bi2Rh3S2 (120 K) | Bi2Rh3.5S2 (293 K) |
|---|---|---|---|
| Formula weight | 790.81 | 790.81 | 842.27 |
| -formula units | 4 | 12 | 4 |
| Space group | C2/m | C2/m | C2/m |
| (Å) | 11.291(3) | 11.542(2) | 11.5212(3) |
| (Å) | 8.378(2) | 8.341(2) | 7.9408(2) |
| (Å) | 7.942(4) | 17.768(4) | 7.8730(3) |
| 133.286(2)° | 107.614(2)° | 128.033(2)° | |
| () | 546.8(3) | 1630.4(5) | 567.33(3) |
| (g/cm3) | 9.605 | 9.664 | 9.861 |
| Atom | Wyck | Symm. | x | y | z | |
| Bi2Rh3S2 (293 K) | ||||||
| Bi1 | 4i | m | 0.0002(1) | 0 | 0.2518(2) | 0.009(1) |
| Bi2 | 4i | m | 0.5086(1) | 0 | 0.2596(2) | 0.012(1) |
| Rh1 | 4f | -1 | 0.25 | 0.25 | 0.5 | 0.009(1) |
| Rh2 | 4i | m | 0.2472(1) | 0 | 0.2472(2) | 0.015(1) |
| Rh3 | 4h | 2 | 0 | 0.2411(2) | 0.5 | 0.013(1) |
| S | 8j | 1 | 0.2235(6) | 0.2704(5) | 0.187(1) | 0.010(1) |
| Bi2Rh3S2 (120 K) | ||||||
| Bi1 | 4i | m | 0.0709(1) | 0 | 0.4167(1) | 0.017(1) |
| Bi2 | 4i | m | 0.2432(1) | 0 | 0.2599(1) | 0.018(1) |
| Bi3 | 4i | m | 0.4026(1) | 0 | 0.0830(1) | 0.018(1) |
| Bi4 | 4i | m | 0.5778(1) | 0 | 0.4148(1) | 0.017(1) |
| Bi5 | 4i | m | 0.7383(1) | 0 | 0.2464(1) | 0.018(1) |
| Bi6 | 4i | m | 0.9041(1) | 0 | 0.0831(1) | 0.018(1) |
| Rh1 | 8j | 1 | 0.3196(2) | 0.2470(3) | 0.1674(1) | 0.018(1) |
| Rh2 | 8j | 1 | 0.4092(2) | 0.2517(3) | 0.3347(1) | 0.017(1) |
| Rh3 | 4i | m | 0.1550(3) | 0 | 0.0983(2) | 0.019(1) |
| Rh4 | 4i | m | 0.1802(3) | 0 | 0.5923(2) | 0.019(1) |
| Rh5 | 4i | m | 0.4860(3) | 0 | 0.2499(2) | 0.017(1) |
| Rh6 | 4h | 2 | 0 | 0.2670(5) | 0.5 | 0.018(1) |
| Rh7 | 4e | -1 | 0.25 | 0.25 | 0 | 0.018(1) |
| S1 | 8j | 1 | 0.0187(6) | 0.2265(10) | 0.2464(4) | 0.018(1) |
| S2 | 8j | 1 | 0.1262(6) | 0.2706(10) | 0.0806(4) | 0.019(1) |
| S3 | 8j | 1 | 0.3000(6) | 0.2299(9) | 0.4232(4) | 0.016(1) |
| Bi2Rh3.5S2 (293 K) | ||||||
| Bi1 | 4i | m | 0.1896(1) | 0 | 0.1932(1) | 0.009(1) |
| Bi2 | 4i | m | 0.2525(1) | 0 | 0.7483(1) | 0.008(1) |
| Rh1 | 4i | m | 0.0200(1) | 0 | 0.3371(2) | 0.008(1) |
| Rh2 | 2d | 2/m | 0 | 0.5 | 0.5 | 0.007(1) |
| Rh3 | 4g | 2 | 0 | -0.3114(1) | 0 | 0.008(1) |
| Rh4 | 4e | -1 | 0.25 | 0.25 | 0 | 0.013(1) |
| S | 8j | 1 | -0.0031(3) | -0.2889(3) | 0.2908(4) | 0.008(1) |
III Results
III.1 Phases and structures
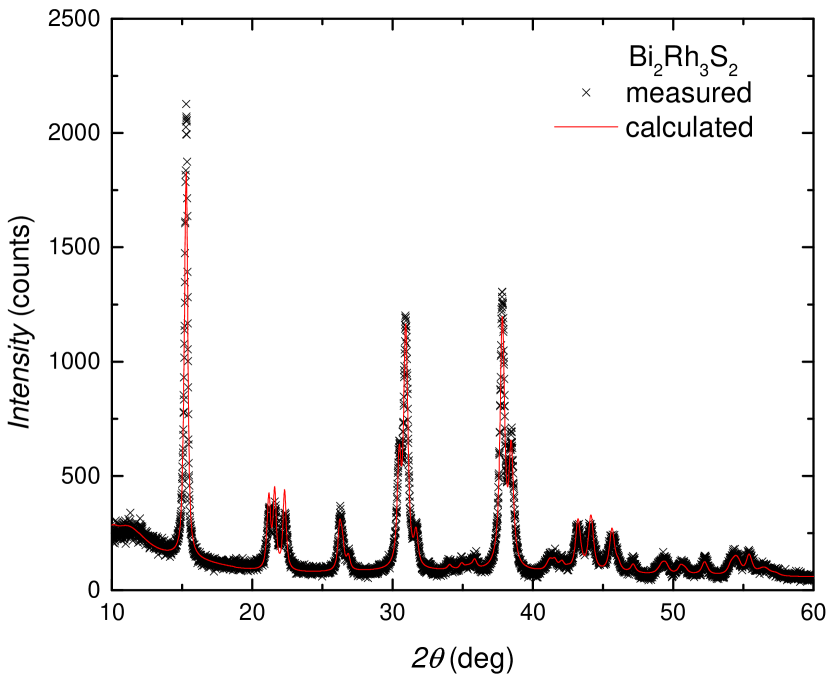
The room temperature powder X-ray diffraction pattern from ground, phase pure, single crystals of Bi2Rh3S2 are shown in Fig. 1. Single crystal x-ray diffraction used to refine the lattice parameter of Bi2Rh3S2 with monoclinic C2/m symmetry, = 11.291(3) Å, = 8.378(2) Å, = 7.942(4) Å, and = 133.286(2)°. These crystallographic parameters are within three standard deviations from literature data of Bi2Rh3S2Natarajan et al. (1988); Anusca et al. (2009). Also these lattice parameters were used to fit the powder x-ray diffraction data shown in Fig. 1. Resistivity data measured on Bi2Rh3S2 single crystals show only a single transition at 165 K (see Fig. 6 below), with no superconductivity being observed down to 0.5 K.
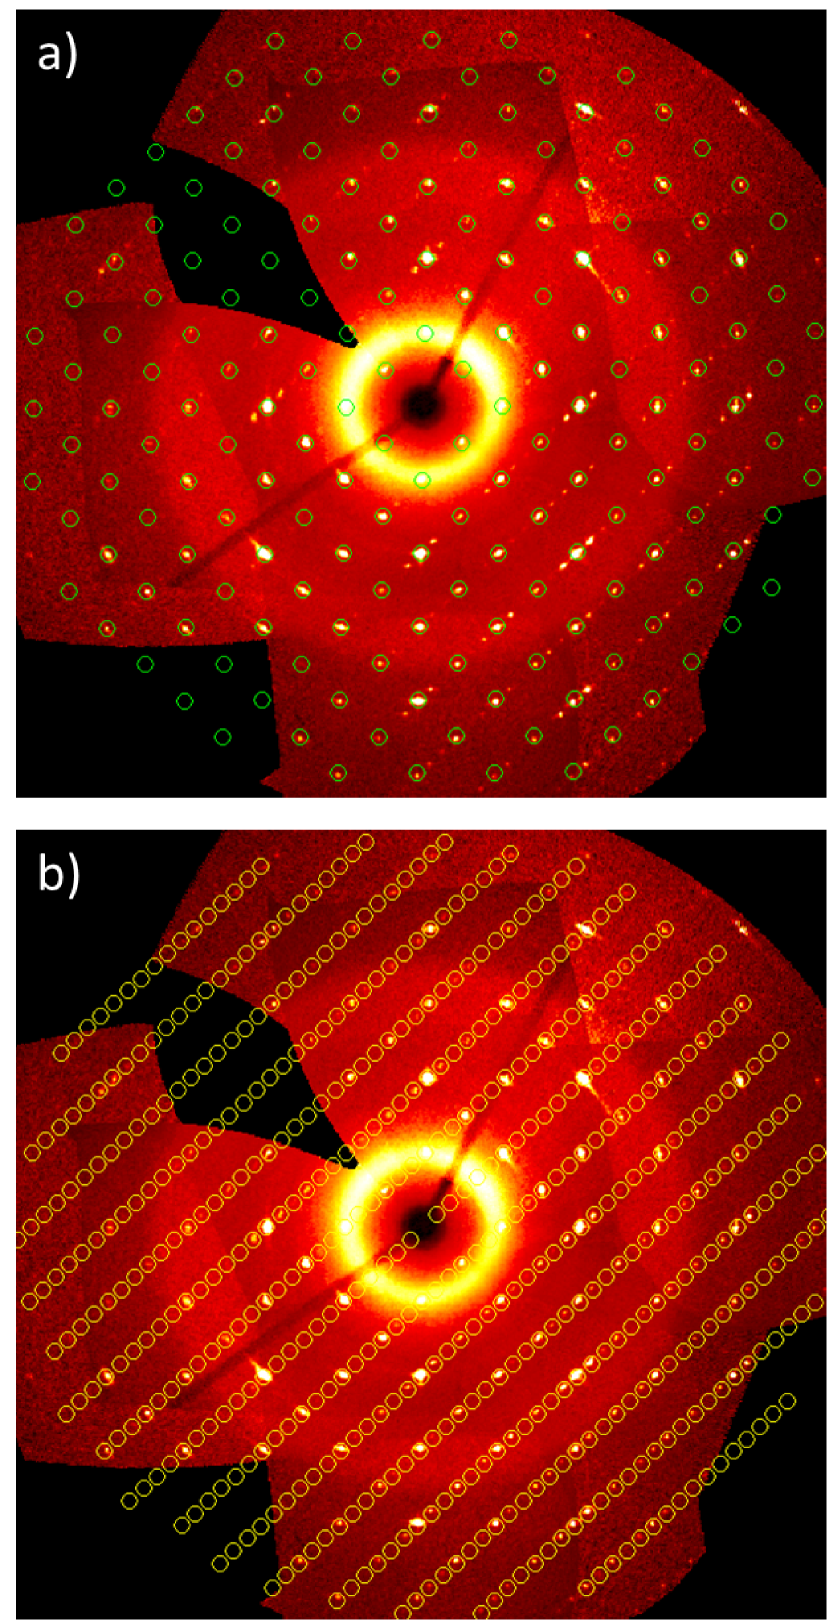
To understand the phase transition of Bi2Rh3S2 at 165 K, a set of single crystal X-ray diffraction intensity data of Bi2Rh3S2 was collected at low-temperature (LT), ca. 120 K. As shown in Fig. 2, extra diffraction spots, not belonging to the unit cell of Bi2Rh3S2 at room-temperature ( = 11.291(3)Å, = 8.378(2)Å, = 7.943(4)Å, = 133.286(2)°), were observed in the (h0l) zone prerecession image. However, all spots could be completely indexed by a larger monoclinic unit cell (C2/m, = 11.542(2)Å, = 8.341(2)Å, = 17.768(4)Å, = 107.614(2)°), which is about 3 times larger than the unit cell at room-temperature (RT), cf. Table 1. Comparison of the RT and LT structures of Bi2Rh3S2, shown in Fig. 3, indicate that the flat two-dimensional (2D) layers in the RT structure (parallel to ab-plane) are periodically puckered in the LT superstructure.
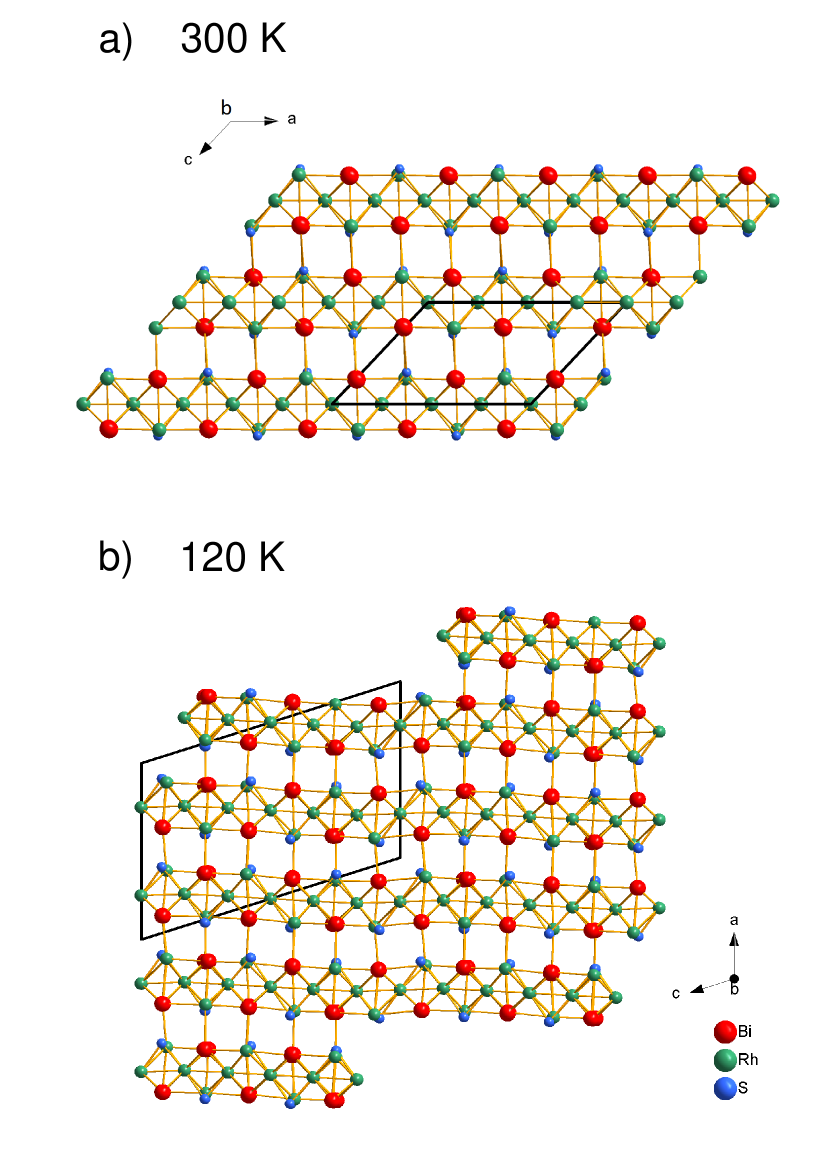
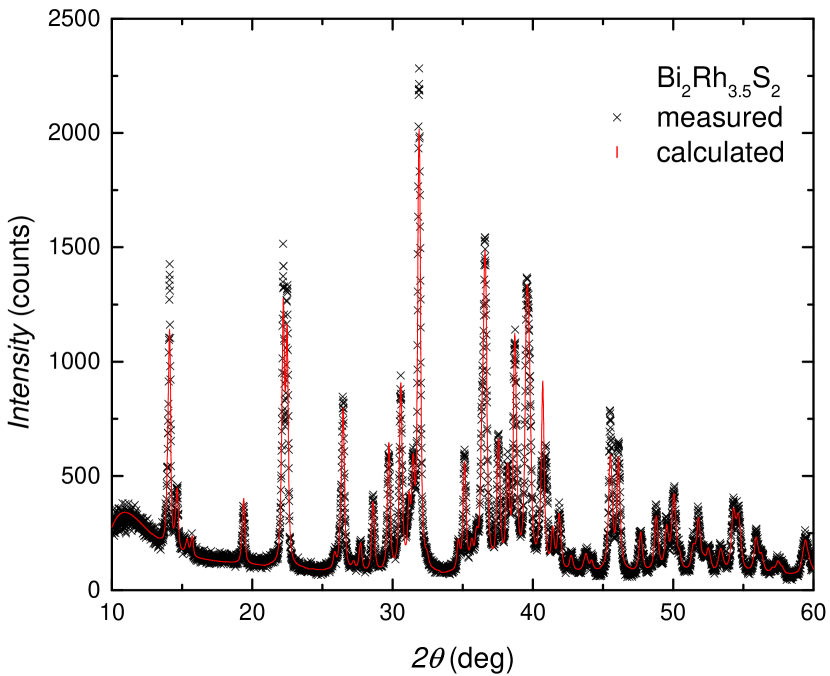
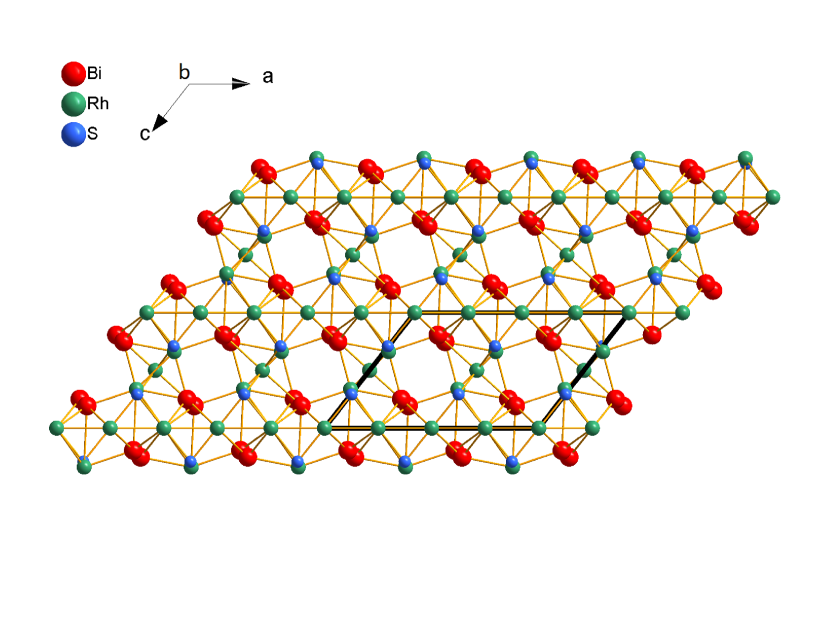
The x-ray powder diffraction pattern of a ground, phase pure, single crystal of Bi2Rh3.5S2 is shown in Fig. 4. According to single crystal X-ray diffraction analyses (Table 1), Bi2Rh3.5S2 also crystallizes in monoclinic symmetry C2/m ( = 11.5212(3) Å, = 7.9408(2) Å, = 7.8730(3) Å, and = 128.033(2) °). These lattice parameters were used to fit the powder x-ray diffraction data shown in Fig. 4. Fig. 5 shows the structure of Bi2Rh3.5S2 viewed along the (010) direction. Compared to the RT structure of Bi2Rh3S2, Fig. 3(a), the 2D layers in Bi2Rh3.5S2 are extensively puckered or distorted in response to the insertion of additional Rh atoms into octahedral vacancies between adjacent layers. As will be discussed below, the low temperature electronic specific heat of Bi2Rh3.5S2 is almost double that of Bi2Rh3S2, consist with superconductivity in the former but not the latter.
III.2 Physical properties of Bi2Rh3S2
The temperature dependent electrical resistivity data from Bi2Rh3S2(Fig.6) show a sharp feature associated with a 165 K transition with no superconducting transition observed down to 0.5 K. This material shows clear in-plane anisotropy in resistivity. Fig. 6 presents the data from two samples with current flowing along each of the edge directions indicated in the lower inset. The residual resistivity ratio (RRR) values are found to be 53 and 15 in these two directions suggesting that the in-plane scattering and/or the Fermi velocity is anisotropic. Above 170 K the resistivity increases monotonically with temperature, showing metallic behavior. Around 165 K a sudden increase or decrease of resistivity with decreasing temperature is observed in the two different, in-plane, current directions. Below 160 K, resistivity again shows metallic like behavior down to 0.5 K. The upper inset to Fig.6 shows a 2-5 K thermal hysteresis observed in the resistivity jump near 165 K, suggesting a first-order phase transition, as confirmed by our single crystal X-ray diffraction analyses. Whereas this behavior is typical for structural transition, it is less common for a CDW transitionWilson et al. (1974); Monceau et al. (1976); Di Salvo et al. (1976); Shelton et al. (1986); Sakamoto et al. (2007); Singh et al. (2005); Ramakrishnan (2002); Becker et al. (1999) which is often second order and usually manifests an increase in resistivity due to a reduction of the density of states at the Fermi energy due to opening up of a gap in the electronic density of states at the Fermi surface. We did not observe behavior of the resistivity down to our base temperature.
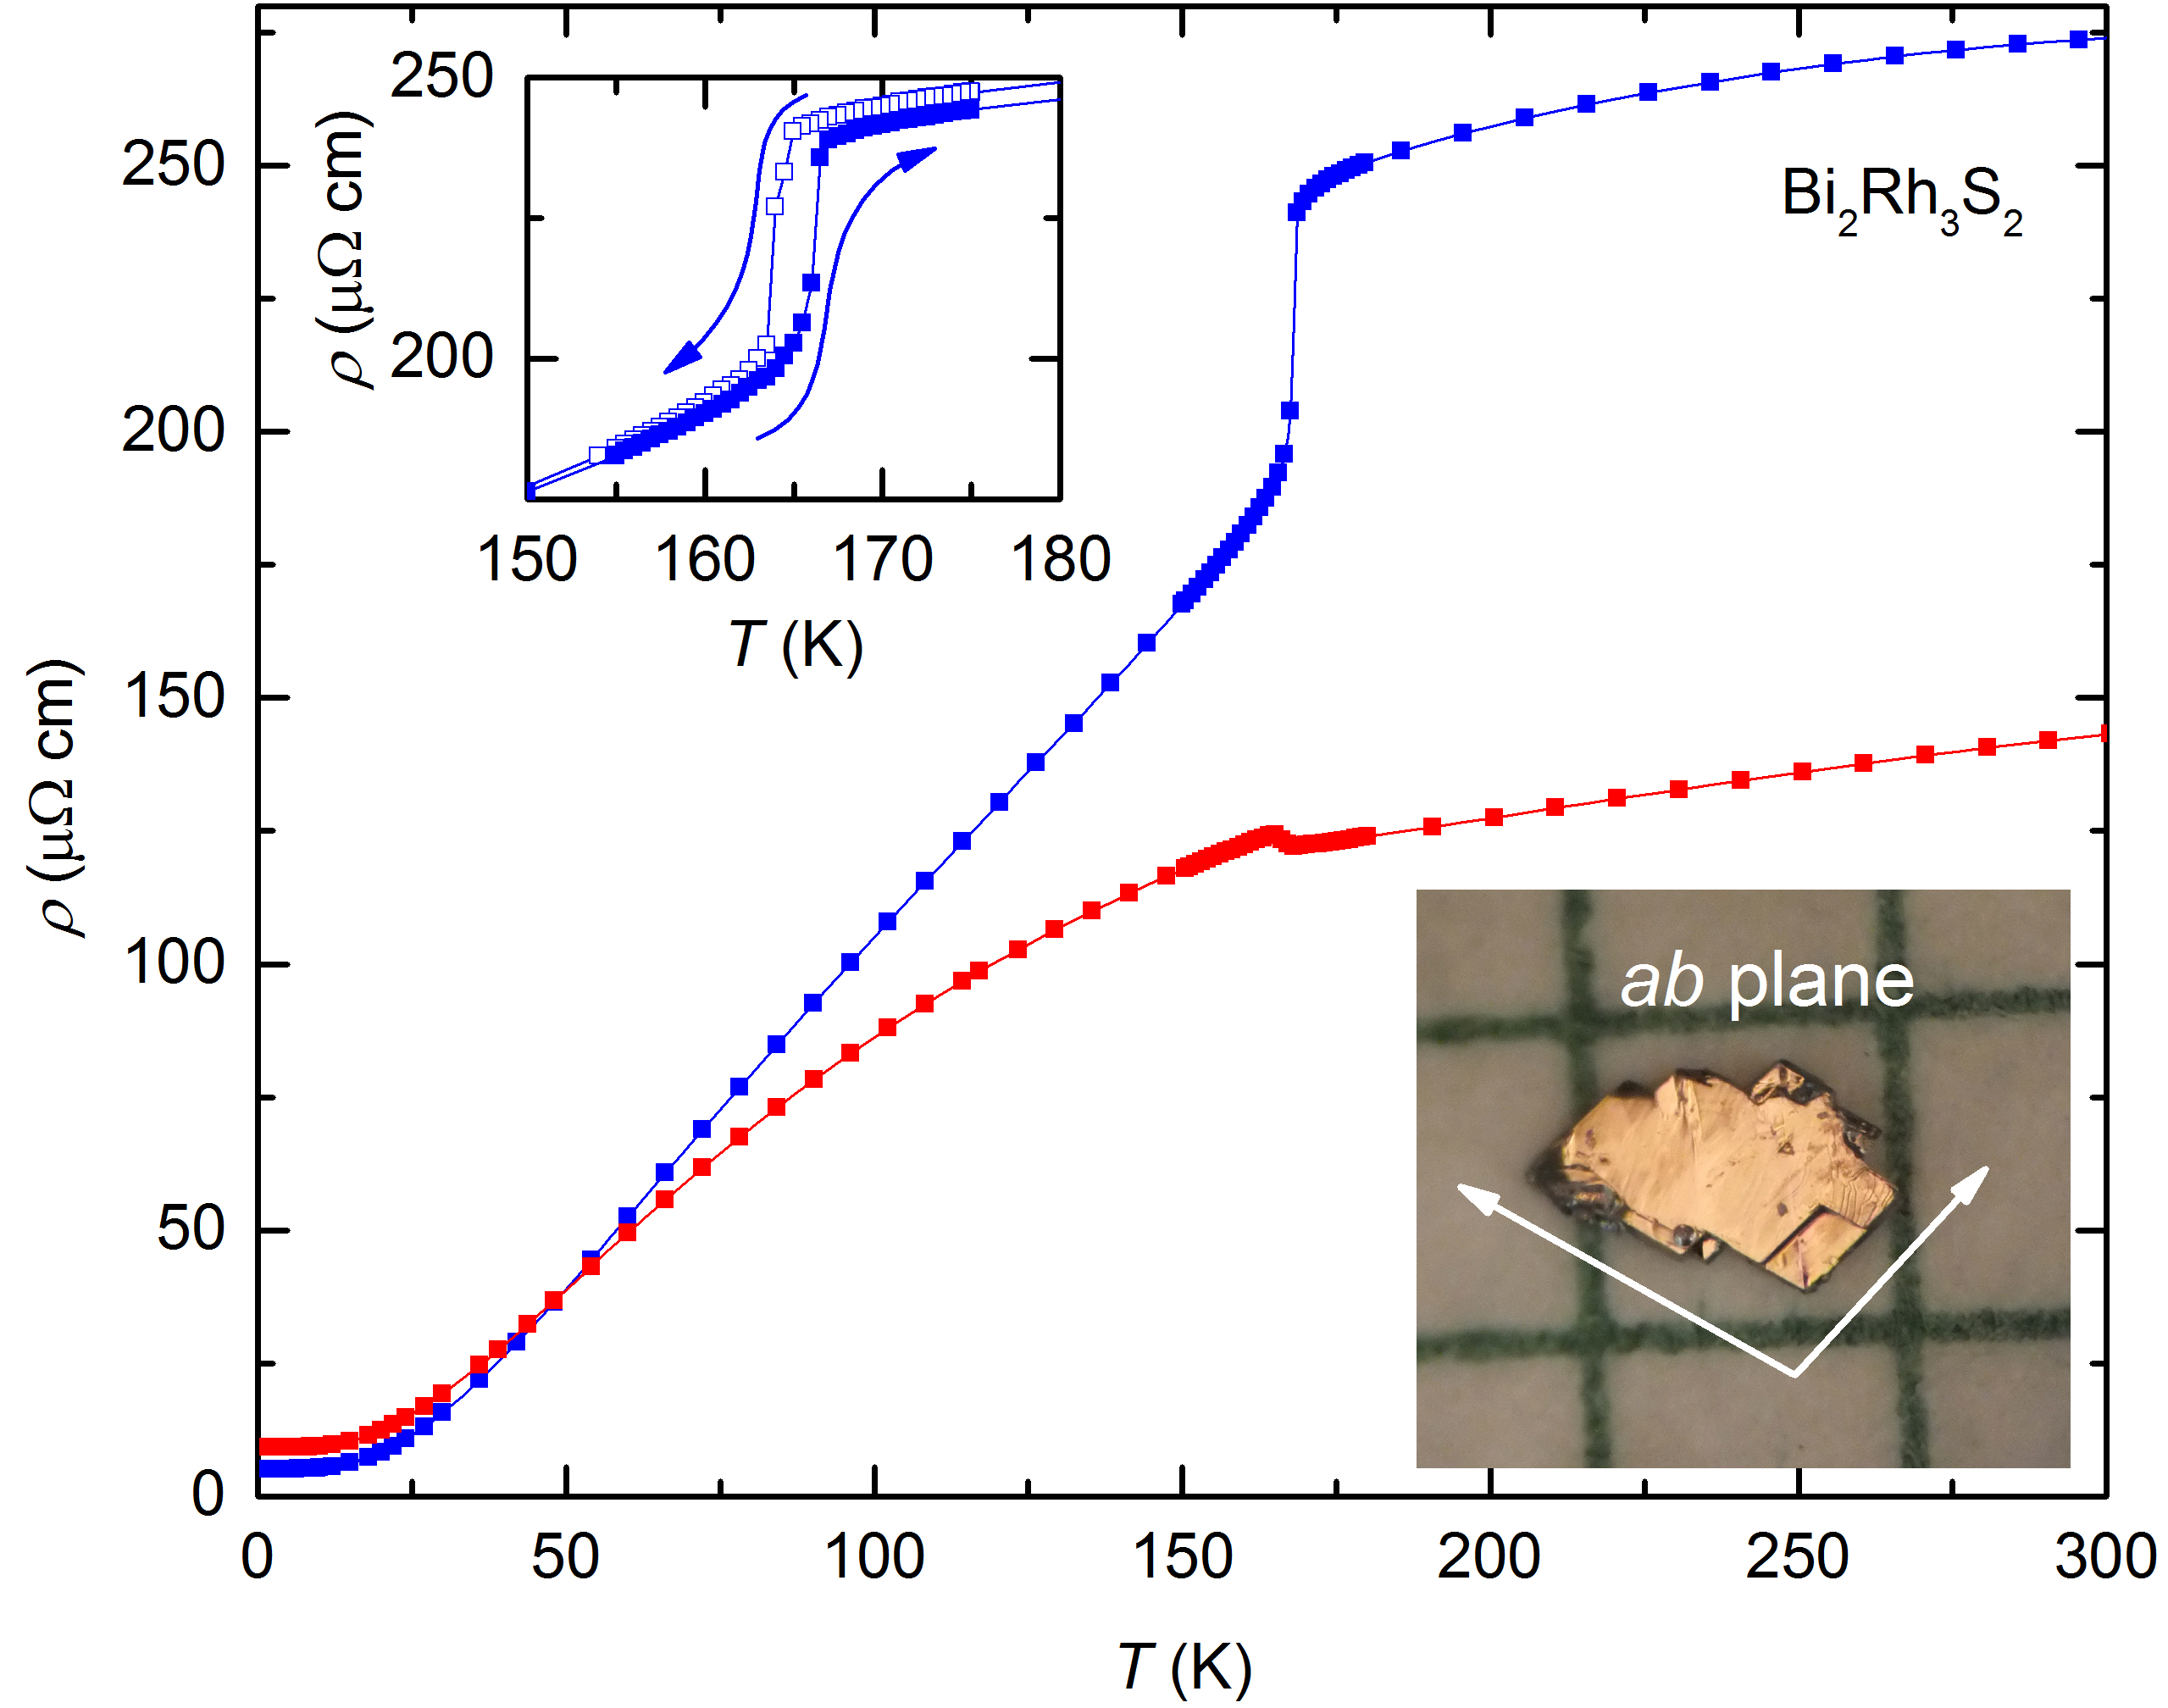
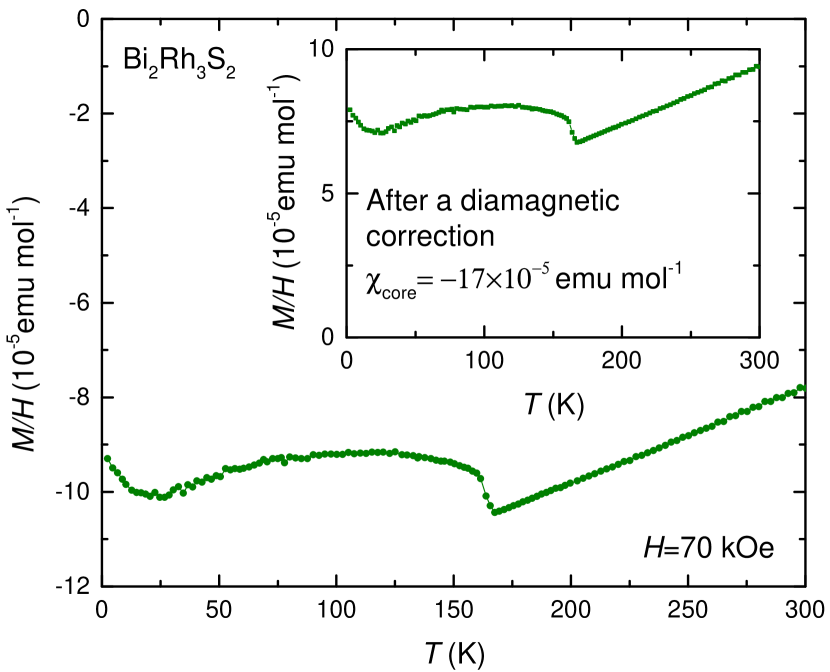
Figure. 7 shows the temperature dependence of the magnetic susceptibility . Since the signal from one piece of single crystal is very low and in order to measure the magnetic susceptibility, we measured the magnetization of several single crystals encapsulated in a sample holder and subtract the background signal due to the sample holder. The negative value of the magnetic susceptibility indicates the overall diamagnetic behavior of this compound. This is due to the dominating contribution from core diamagnetism. By subtracting the core diamagnetic contributionE.A.Boudreaux and L.N.Mulay (1976); Bain and Berry (2008) we can estimate the electronic contribution to the susceptibility. The inset of Fig.7 shows the temperature dependence of the electronic contribution to the magnetic susceptibility, after the diamagnetic correctionE.A.Boudreaux and L.N.Mulay (1976); Bain and Berry (2008) ( = - 1710-5 emu mol-1). Susceptibility linearly decreases with the decreasing temperature down to 165 K and then shows dramatic change at 165 K. Given that both Pauli paramagnetic and Landau diamagnetic susceptibility are proportional to the density of state at the Fermi level , the change in at 165 K is consistent with an increase in the density of state at the Fermi level . In a typical CDW material there is a reduction of the density of state at the Fermi energy due to opening up of a gap in the electronic density of states at the Fermi surface. An increase in density of state is not consistent with the CDW mechanism for structural phase transition. The low temperature upturn (below 25 K) in the susceptibility is probably due to the presence of a small amount of paramagnetic impurities in the sample.
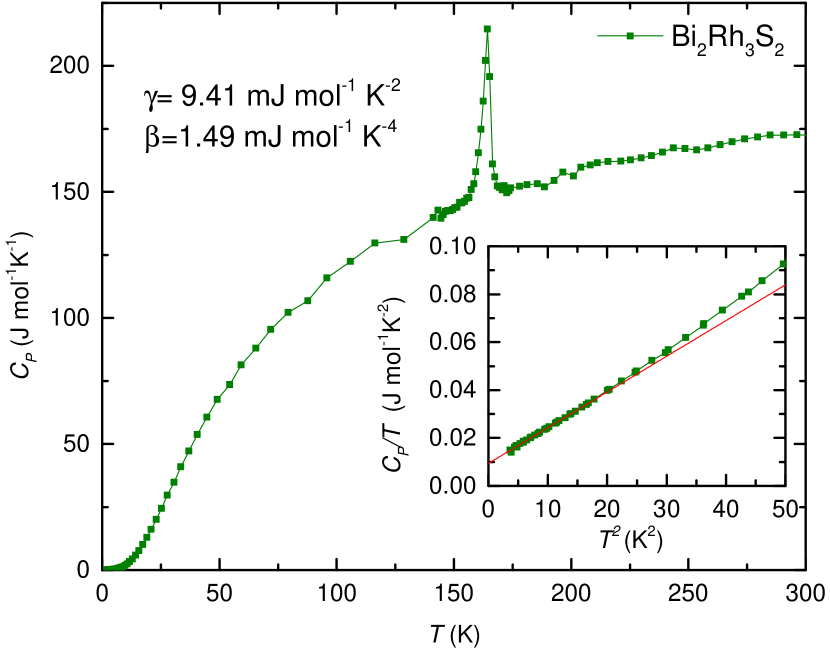
The temperature dependent specific heat of Bi2Rh3S2 (Fig. 8) shows a broadened latent heat feature, consistent with the first-order like features seen in the resistivity and magnetization data shown in the Figs. 6 and 7. The room temperature specific heat of Bi2Rh3S2, 172.6 J mol-1 K-1, is close to the Dulong–Petit limit, =3=174.6 J mol K-1. The Sommerfeld coefficient, = 9.41 mJ mol-1 K-2 and = 1.49 mJ mol-1 K-4 values were obtained for the LT phase from the low temperature data fitted with as shown in the lower inset of Fig. 8. From we obtained a Debye temperature () of 209 K by using equation 1 and slightly larger than the value of Bi2Rh3Se2. This reflects a higher phonon density of states at low energies which are likely due to the presence of the lighter element ”Sulfur” compared to ”Selenium”. A similar value of =9.5 mJ mol-1 K-2 was obtained in isostructural Bi2Rh3Se2 compoundSakamoto et al. (2007).
| (1) |
With our measurements of single crystal diffraction, resistivity, magnetization and the specific heat, we can conclude the phase transition in Bi2Rh3S2 at 165 K is a first order structural phase transition. We do not have clear evidence of a CDW being associated with this transition.
In the case of Bi2Rh3Se2, based on the results of the resistivity, magnetization, thermoelectric power, thermal expansion and low temperature x-ray measurements, Sakamoto et alSakamoto et al. (2007) conclude that the anomaly at 250 K is a CDW transition. However, Chen et alChen et al. (2014) report that, based on their experiments of pressure and selected-area electron diffraction study, phase transition at 250 K is not a CDW transition, rather structural transition. In the present case of Bi2Rh3S2 further, advanced measurements would be needed to find any support for a possible CDW.
III.3 Physical properties of Bi2Rh3.5S2
Figure. 9 presents the temperature dependence of resistivity of Bi2Rh3.5S2, which, unlike Bi2Rh3S2, does not show any transitions in the resistivity data around 165 K. However, it does manifest zero resistivity below 2 K, indicating an onset of a superconducting transition at this temperature. RRR of Bi2Rh3.5S2 is 6.4, less than the RRR of Bi2Rh3S2. We did not observe behavior in resistivity down to the base temperature of our measurement.
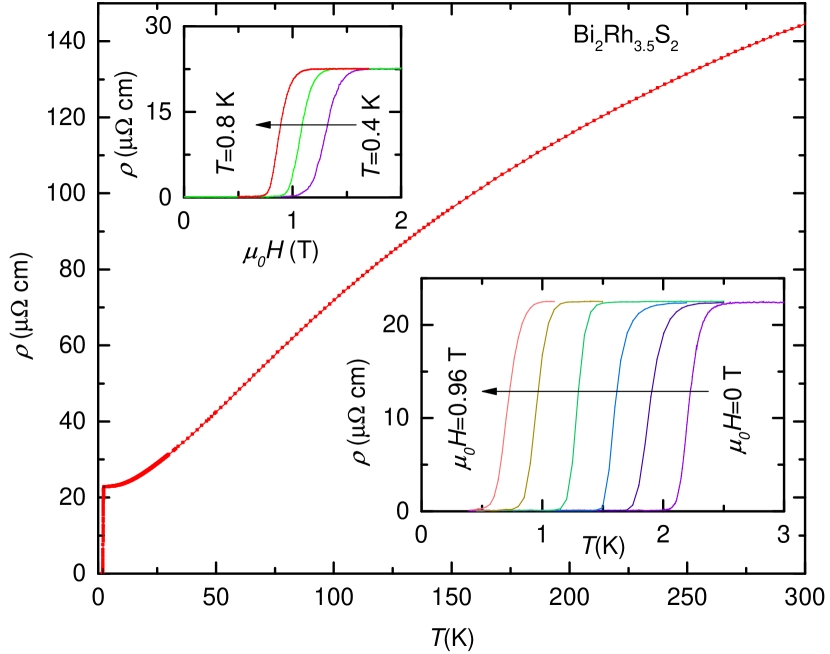
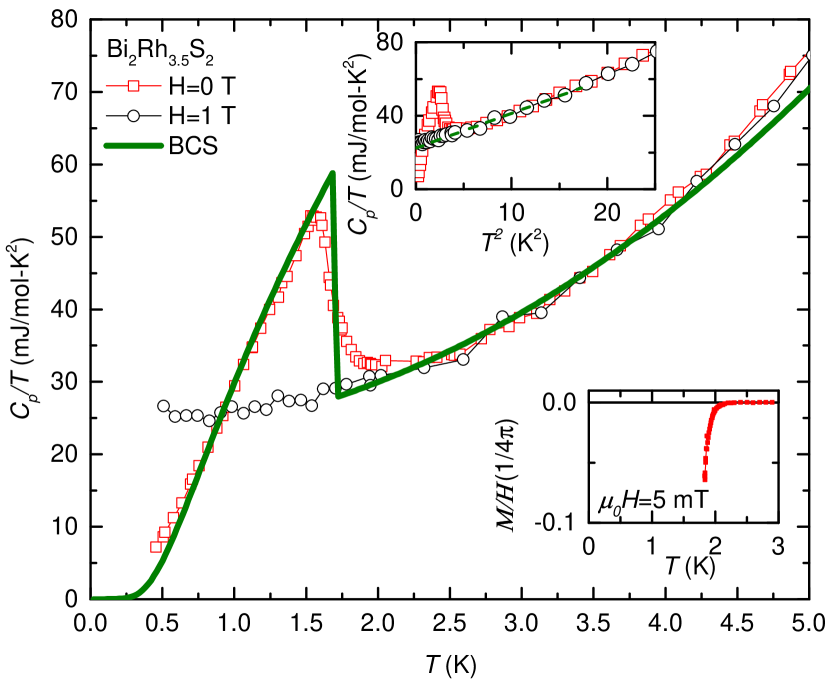
Figure. 10 shows the low temperature specific heat data of Bi2Rh3.5S2. The open red squares represent zero field measurements whereas the open black circles represent measurements under 1 T magnetic field, i.e. for the measured temperature range(see below). From the low temperature data fitted with from 2 K to 3.8 K as shown in the upper inset of Fig. 10 we find = 22 mJ mol-1 K-2 and = 1.94 mJ mol-1 K-4 and can infer that = 196 K. We can clearly see that of the superconducting Bi2Rh3.5S2 is twice as large as that for the non-superconducting Bi2Rh3S2 or Bi2Rh3Se2Sakamoto et al. (2007). Also this value is larger than the other reported parkerite-type superconductors, Bi2Ni3S2Sakamoto et al. (2006), Bi2Ni3Se2Sakamoto et al. (2006) and Bi2Pd3Se2Sakamoto et al. (2008).
On one hand, = 1.7 K was obtained by using an equal entropy construction to the low temperature specific heat data. On the other hand, the = 0 data start to separate from the = 1 T data below 2.2 K. Specific heat jump of = 52.4 mJ mol-1 K-1 gives = 1.39 which is close to the BCS value 1.43 for a weak-coupling superconductor. The green colored solid line represents a BCSBardeen et al. (1957); Tinkham (1996) calculation. The deviation above 4 K, normal-state data from the simple Debye model indicates the presence of at least a term in the lattice contribution.
The lower inset of Fig. 10 shows ZFC data of Bi2Rh3.5S2. We were not able to see the full transition in low temperature zero field cooled (ZFC) measurements because the minimum temperature which we can reach in the MPMS is 1.8 K. These data are consistent with the broadened transition seen in the resistivity and the data.
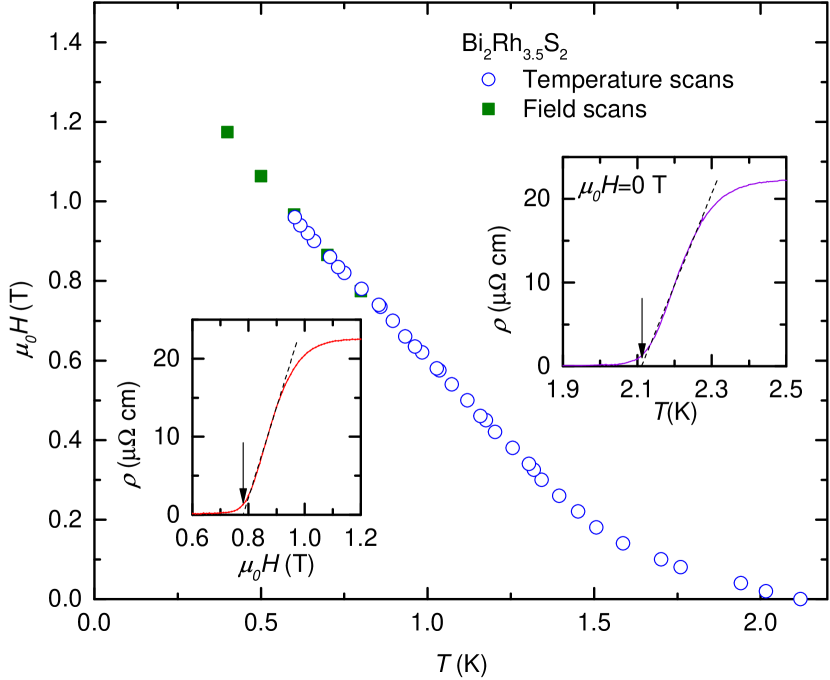
The upper inset of Fig. 9 shows the field dependence of the superconducting transition for temperatures from 0.4 K to 0.8 K and the lower inset shows the temperature dependence of the superconducting transition from 0 T to 0.96 T applied field. Figure. 11 shows (T) as a function of the critical temperature determined from the resistivity data. Lower and upper insets show the maximum slope of the resistivity extrapolated to = 0, used as a criteria to obtain the and respectively. We can estimate the Ginzburg-Landau(GL) coherence lengthTinkham (1996) at zero temperature, =150Å by using the relation (0)= , in which is the quantum flux and estimating (0) to be 1.5 T. The value of (0) is well below the Pauli paramagnetic limitClogston (1962) of = = 3.15 T, suggesting an orbital pair-breaking mechanism. The upward curvature near in the data shown in Fig. 11 may come from a distribution of values in the samplePark et al. (2008); Xiao et al. (2012a, b); Ślebarski et al. (2014) or multi-band superconductivity as was discussed by Shulga et alShulga et al. (1998) or nonlocal correctionHohenberg and Werthamer (1967); Metlushko et al. (1997) to the Ginzburg-Landau equations. Similar (T) curvatures were found for YNi2B2C as well as LuNi2B2CShulga et al. (1998).
The electron-phonon coupling constant can be estimated from the McMillan equation McMillan (1968) for the superconducting transition temperature (equation 2), for phonon mediated superconductors,
| (2) |
where , the Coulomb pseudopotential, having value often between 0.1 and 0.2 and usually taken as 0.13 McMillan (1968). Similar values of have been used in isostructural compoundsSakamoto et al. (2006, 2007, 2008). Using = 196 K and = 1.7 K we estimated = 0.54. A difference of from the assumed value of 0.13 will give a different value of . For example, = 0.48 if = 0.1 and = 0.69 if = 0.2. By using both normal state and superconducting state specific heat data, one can obtain the thermodynamic critical field, (0) as a function of temperature from equation 3
| (3) |
in which is the entropy difference between the normal and superconducting states and (8.5410-5 m3 mol-1) is the molar volume. The calculated value of (0) is 23 mT for Bi2Rh3.5S2. This value is larger than the value of Bi2Rh3Se2 and clearly reflects the larger and of Bi2Rh3.5S2.
| (4a) | |||
| (4b) | |||
| (4c) | |||
Using BCS theory resultsBardeen et al. (1957)(equation 4a and 4b) we can eliminate the D term and, for the limit of an isotropic gap function, use equation 4c to calculate the value of (0) = 21 mT. This value is close to the calculated value using specific heat.
Also the penetration depth (0) and GL parameter are found to be 7450 Å and 50 from equations 5 and 6, respectively.
| (5) |
| (6) |
From the specific heat jump and using Rutger’s relation, Welp et al. (1989) , one can obtain a similar value of 30. The obtained (0) and values of Bi2Rh3.5S2 are smaller than the values of Bi2Rh3Se2Sakamoto et al. (2007) but the value of ( 1/) is large enough to consider Bi2Rh3.5S2 is a type II superconductor.
IV Conclusions
Single crystals of the closely related Bi2Rh3S2 and Bi2Rh3.5S2 systems were synthesized by high temperature solution growth. Resistivity, magnetization, and specific heat measurements were carried out to characterize their normal states and, for Bi2Rh3.5S2, superconducting properties. Bi2Rh3S2 manifests a structural phase transition around 165 K. No superconductivity was observed down to 0.5 K. Single crystal diffraction measurements at 120 K and 300 K confirmed that a 3-fold superstructure develops. We noticed a large, in-plane, resistivity anisotropy in this compound. Thermal hysteresis and the specific heat feature at 165 K are consistent with a first-order phase transition. The Sommerfeld coefficient = 9.41 mJ mol-1 K-2 and the Debye temperature = 209 K were calculated by using low temperature specific heat data. Based on our measurements, we do not have evidence of a CDW type mechanism being responsible for this transition.
Bi2Rh3.5S2 adopts a monoclinic (C/2m) crystal structure. This material shows a signature of superconductivity in the resistivity and specific heat measurements consistent with bulk superconductivity below the critical temperature of 1.7 K. The calculated values for the Sommerfeld coefficient and the Debye temperature are 22 mJ mol-1 K-2 and 196 K respectively. Analysis of the jump in the specific heat at , suggest that Bi2Rh3.5S2 as a weak electron-phonon coupled, BCS superconductor.
ACKNOWLEDGMENTS
We would like to thank W. Straszheim, A. Jesche, X. Lin, H. Kim, E. Mun, M. Tanatar for experimental assistance and T. Kong, S. Ran, H. Hodovanets and V. G. Kogan for useful discussions. Part of this work (U.S.K, V.T) was carried out at the Iowa State University and supported by AFOSR-MURI Grant No. FA9550-09-1-0603. Part of this work(W.X,Q.L,G.J.M,S.L.B, P.C.C) was performed at the Ames Laboratory, US DOE, under Contract No. DE-AC02-07CH11358.
References
- Peierls (1930) R. Peierls, Annalen der Physik 396, 121 (1930).
- Peierls (1955) R. E. Peierls, Quantum theory of solids (Clarendon, Oxford, 1955).
- Fröhlich (1954) H. Fröhlich, P. Roy. Soc. A-Math. Phy 223, pp. 296 (1954).
- Bardeen et al. (1957) J. Bardeen, L. N. Cooper, and J. R. Schrieffer, Phys. Rev. 108, 1175 (1957).
- Gabovich and Voitenko (2000) A. M. Gabovich and A. I. Voitenko, Low. Temp. Phys 26, 305 (2000).
- Gabovich et al. (2001) A. M. Gabovich, A. I. Voitenko, J. F. Annett, and M. Ausloos, Supercond. Sci. Tech 14, R1 (2001).
- Wilson et al. (1974) J. A. Wilson, F. J. Di Salvo, and S. Mahajan, Phys. Rev. Lett. 32, 882 (1974).
- Harper et al. (1975) J. Harper, T. Geballe, and F. D. Salvo, Phys. Lett A 54, 27 (1975).
- Monceau et al. (1976) P. Monceau, N. P. Ong, A. M. Portis, A. Meerschaut, and J. Rouxel, Phys. Rev. Lett. 37, 602 (1976).
- Di Salvo et al. (1976) F. J. Di Salvo, D. E. Moncton, and J. V. Waszczak, Phys. Rev. B 14, 4321 (1976).
- Shelton et al. (1986) R. N. Shelton, L. S. Hausermann-Berg, P. Klavins, H. D. Yang, M. S. Anderson, and C. A. Swenson, Phys. Rev. B 34, 4590 (1986).
- Becker et al. (1999) B. Becker, N. G. Patil, S. Ramakrishnan, A. A. Menovsky, G. J. Nieuwenhuys, J. A. Mydosh, M. Kohgi, and K. Iwasa, Phys. Rev. B 59, 7266 (1999).
- Ramakrishnan (2002) S. Ramakrishnan, Pramana 58, 827 (2002).
- Singh et al. (2005) Y. Singh, D. Pal, S. Ramakrishnan, A. M. Awasthi, and S. K. Malik, Phys. Rev. B 71, 045109 (2005).
- Morosan et al. (2006) E. Morosan, H. W. Zandbergen, B. S. Dennis, J. W. G. Bos, Y. Onose, T. Klimczuk, A. P. Ramirez, N. P. Ong, and R. J. Cava, Nat Phys 2, 544 (2006).
- Michener and Peacock (1943) C. Michener and M. Peacock, Am. Mineral 28, 343 (1943).
- Peacock and McAndrew (1950) M. Peacock and J. McAndrew, Am. Mineral 35, 425 (1950).
- Brower et al. (1974) W. Brower, H. Parker, and R. Roth, Am. Mineral 59, 296 (1974).
- Natarajan et al. (1988) S. Natarajan, G. Rao, R. Baskaran, and T. Radhakrishnan, J. Less-Common. Met 138, 215 (1988).
- Sakamoto et al. (2006) T. Sakamoto, M. Wakeshima, and Y. Hinatsu, J Phys-Condens. Mat 18, 4417 (2006).
- Sakamoto et al. (2008) T. Sakamoto, M. Wakeshima, Y. Hinatsu, and K. Matsuhira, Phys. Rev. B 78, 024509 (2008).
- Lin et al. (2012) X. Lin, S. L. Bud’ko, and P. C. Canfield, Philos. Mag 92, 2436 (2012).
- Sakamoto et al. (2007) T. Sakamoto, M. Wakeshima, Y. Hinatsu, and K. Matsuhira, Phys. Rev. B 75, 060503 (2007).
- Chen et al. (2014) C. Chen, C. Chan, S. Mukherjee, C. Chou, C. Tseng, S. Hsu, M.-W. Chu, J.-Y. Lin, and H. Yang, Solid. State. Commun 177, 42 (2014).
- Chu et al. (1977) C. W. Chu, V. Diatschenko, C. Y. Huang, and F. J. DiSalvo, Phys. Rev. B 15, 1340 (1977).
- Briggs et al. (1980) A. Briggs, P. Monceau, M. Nunez-Regueiro, J. Peyrard, M. Ribault, and J. Richard, J. Phys. C. Solid. State 13, 2117 (1980).
- Bud’ko et al. (2006) S. L. Bud’ko, T. A. Wiener, R. A. Ribeiro, P. C. Canfield, Y. Lee, T. Vogt, and A. H. Lacerda, Phys. Rev. B 73, 184111 (2006).
- Canfield and Fisk (1992) P. C. Canfield and Z. Fisk, Philos. Mag. B 65, 1117 (1992).
- Canfield and Fisher (2001) P. C. Canfield and I. R. Fisher, Journal of Crystal Growth 225, 155 (2001) .
- Petrovic et al. (2012) C. Petrovic, P. C. Canfield, and J. Y. Mellen, Philos. Mag. 92, 2448 (2012).
- Toby (2001) B. H. Toby, Journal of Applied Crystallography 34, 210 (2001).
- Larson and Von Dreele (2000) A. Larson and R. Von Dreele, General Structure Analysis (GSAS), Los Alamos National Laboratory, report laur 86-748 ed. (2000.).
- SMA (2003) SMART version 5, Bruker AXS, Madison WI,, smart version 5 ed. (2003).
- Blessing (1995) R. H. Blessing, Acta. Crystallogr. A 51, 33 (1995).
- Sheldrick (2002) G. Sheldrick, Bruker AXS, Madison, WI, shelx, version 5.1 ed. (2002).
- Anusca et al. (2009) I. Anusca, A. Schmid, P. Peter, J. Rothballer, F. Pielnhofer, and R. Weihrich, Z. Anorg. Allg. Chem. 635, 2410 (2009).
- E.A.Boudreaux and L.N.Mulay (1976) E.A.Boudreaux and L.N.Mulay, Theory and Applications of Molecular Paramagnetism (John Wiley and Sons, New York, 1976).
- Bain and Berry (2008) G. A. Bain and J. F. Berry, J. Chem. Educ 85, 532 (2008).
- Tinkham (1996) M. Tinkham, Introduction to Superconductivity (2nd Edition) (Dover Publications, New York, 1996).
- Clogston (1962) A. M. Clogston, Phys. Rev. Lett. 9, 266 (1962).
- Park et al. (2008) T. Park, E. Park, H. Lee, T. Klimczuk, E. D. Bauer, F. Ronning, and J. D. Thompson, J Phys-Condens. Mat 20, 322204 (2008).
- Xiao et al. (2012a) H. Xiao, T. Hu, A. P. Dioguardi, N. apRoberts-Warren, A. C. Shockley, J. Crocker, D. M. Nisson, Z. Viskadourakis, X. Tee, I. Radulov, C. C. Almasan, N. J. Curro, and C. Panagopoulos, Phys. Rev. B 85, 024530 (2012a).
- Xiao et al. (2012b) H. Xiao, T. Hu, S. K. He, B. Shen, W. J. Zhang, B. Xu, K. F. He, J. Han, Y. P. Singh, H. H. Wen, X. G. Qiu, C. Panagopoulos, and C. C. Almasan, Phys. Rev. B 86, 064521 (2012b).
- Ślebarski et al. (2014) A. Ślebarski, M. Fijałkowski, M. M. Maśka, M. Mierzejewski, B. D. White, and M. B. Maple, Phys. Rev. B 89, 125111 (2014).
- Shulga et al. (1998) S. V. Shulga, S.-L. Drechsler, G. Fuchs, K.-H. Müller, K. Winzer, M. Heinecke, and K. Krug, Phys. Rev. Lett. 80, 1730 (1998).
- Hohenberg and Werthamer (1967) P. C. Hohenberg and N. R. Werthamer, Phys. Rev. 153, 493 (1967).
- Metlushko et al. (1997) V. Metlushko, U. Welp, A. Koshelev, I. Aranson, G. W. Crabtree, and P. C. Canfield, Phys. Rev. Lett. 79, 1738 (1997).
- McMillan (1968) W. L. McMillan, Phys. Rev. 167, 331 (1968).
- Welp et al. (1989) U. Welp, W. K. Kwok, G. W. Crabtree, K. G. Vandervoort, and J. Z. Liu, Phys. Rev. Lett. 62, 1908 (1989).