Fluorescence spectra of atoms in a phase-stabilized magneto-optical trap as an optical lattice
Abstract
We present a study on characteristics of a magneto-optical trap (MOT) as an optical lattice. Fluorescence spectra of atoms trapped in a MOT with a passively phase-stabilized beam configuration have been measured by means of the photon-counting heterodyne spectroscopy. We observe a narrow Rayleigh peak and well-resolved Raman sidebands in the fluorescence spectra which clearly show that the MOT itself behaves as a three-dimensional optical lattice. Optical-lattice-like properties of the phase-stabilized MOT such as vibrational frequencies and lineshapes of Rayleigh peak and Raman sidebands are investigated systematically for various trap conditions.
pacs:
37.10.Jk,I Introduction
A magneto-optical trap (MOT) Raab et al. (1987) has so far been used as a convenient tool to prepare samples of cold atoms for the first step for making ultra cold atomic ensembles. Characteristics of a MOT itself has been extensively investigated, especially on the mechanisms of laser cooling and trapping. However, studies with MOTs have been limited in some respects. The atoms trapped in MOTs always interact with near-resonant laser fields and inhomogeneous magnetic fields, which result in relatively high temperature and undefined internal states of atomic ensembles. Moreover, interference patterns and polarization states of six trapping laser beams are unstable and uncontrollable unless the phases of the laser beams are locked to each other. Consequently, microscopic features of a MOT such as quantized atomic motion observed in optical molasses or lattices Westbrook et al. (1990); Jessen et al. (1992); Hemmerich and Hänsch (1993); Grynberg et al. (1993); Gatzke et al. (1997) have often been neglected. The trapped atoms are then described as an ensemble of thermalized classical particles moving almost freely with a Gaussian velocity distribution in a large potential well.
Schadwinkel et al. Schadwinkel et al. (1999) have experimentally shown that a MOT can create an optical-lattice structure with an intrinsically phase-stabilized beam configuration Rauschenbeutel et al. (1998) and the trapped atoms can be localized well in optical micropotentials. With sub-Doppler laser cooling Dalibard and Cohen-Tannoudji (1989), the trapped atoms can be cooled down to micro-K temperature and localized well in light-induced micropotentials of the optical lattice formed by the MOT itself. The behaviors of an atomic ensemble in a MOT which behaves as an optical lattice simultaneously are nontrivial. It might pose some interesting questions: for example, one may ask if the localization of atoms in individual wells in an operating MOT would suppress light-induced intra-trap cold collisions Weiner et al. (1999); Ueberholz et al. (2000); Choi et al. (2007) like as in optical lattices Lawall et al. (1998).
There have been several nonlinear spectroscopic researches showing narrow Raman resonances having sub-natural linewidth in operating MOTs Grison et al. (1991); Tabosa et al. (1991); Brzozowski et al. (2005); Souther et al. (2010). These experiments were carried out by means of pump-probe Raman transmission spectroscopy. There also have been several researches that measure the fluorescence spectrum of the atomic ensemble confined in optical molasses by means of optical heterodyne technique Westbrook et al. (1990); Jessen et al. (1992) and the second-order correlation function of the fluorescence light emitted from the atoms in optical molasses Bali et al. (1996); Beeler et al. (2003); Nakayama et al. (2010). Recently, near-resonant fluorescence spectrum of a single atom Kim et al. (2011) confined in a three-dimensional (3D) optical lattice formed by a phase-stabilized MOT have been measured by means of the heterodyne photon-counting-based second-order correlation spectroscopy (PCSOCS) Hong et al. (2006). Here the observed single-atom spectrum showing a strong Dicke narrowing Dicke (1953) and motional Raman sidebands reveals the atom in a MOT can be bounded tightly in a light-shift micropotential. The Mollow triplet spectrum of a few atoms near the optical nanofiber Das et al. (2010) has been measured by the heterodyne PCSOCS.
A spectrum of scattered light from cold atoms gives much information on internal/external states of individual atoms and also on properties of an atomic ensemble. The spectrum of individual atoms trapped in a phase-stabilized MOT is characterized by the intrinsic properties of the optical lattice rather than by the properties of the MOT such as vibrational frequencies and linewidths of Rayleigh peak and Raman sidebands. On the other hand, the spectrum also contains information on characteristics of an atomic ensemble in the MOT such as temperature or dynamics of cold atomic collisions. In a dense atomic gas, for example, the atoms experience radiation trapping Walker et al. (1990), reabsorption of emitted photons from other atoms, which would increase the temperature and results in an additional homogeneous broadening in the spectrum. Cold collisions between trapped atoms would also introduce an additional spectral broadening. In addition, fluorescence spectroscopy allows “nondestructive” measurements on cold atomic ensembles in contrast to the pump-probe spectroscopy. However, a systematic study on fluorescence spectra of an atomic ensemble in an operating MOT as an optical lattice has not yet been reported. In this paper, motivated by these considerations, we present a comprehensive fluorescence spectroscopic study of a MOT as an optical lattice by means of the heterodyne PCSOCS.
This paper is organized as follows. In Sec. II, a beam configuration of our passively phase-stabilized MOT and the structure of a 3D optical-lattice in a MOT are discussed. In Sec. III, a detailed description of experimental scheme for photon-counting heterodyne spectroscopy is presented. We emphasize that our photon-counting heterodyne technique is a non-destructive, almost real-time measurement of the spectrum (thus the temperature information) even for a small number of cold atoms, 100. In Sec. IV, the measured atomic fluorescence spectra from the MOT in a phase-stabilized configuration and also in a standard retroreflected six-beam configuration are shown and discussed. The optical lattice properties such as Raman vibration frequencies have been investigated systematically for various trap parameters. The results are compared with the theoretical calculations of the energy-band of the optical lattices. We also discuss spectral broadening in the fluorescence spectra due to many-atom effects for dense atomic ensembles. Finally, we summarize our work in Sec. V.
II MOT as an Optical Lattice
In a stable optical lattice, phase fluctuations in the laser beams forming the lattice should just induce an overall translation of the lattice structure, not affecting the topography of micropotential significantly. It is known that one has to use only four beams in order to construct such a stable lattice in 3D Grynberg et al. (1993). For a standard MOT in beam configuration, however, six trapping laser beams are usually used. The relative time phases of individual trapping laser beams change independently and randomly in time due to mechanical vibrations or thermal drifts of optics. It is thus difficult to establish a stable optical lattice with its own trapping laser fields in a typical MOT configuration. A stable optical lattice, indeed, can be established in a MOT by using a phase-stabilized-beam configuration, i.e., by introducing the two-beam configuration which has been demonstrated by Rauscheneutel et al. in Ref. Rauschenbeutel et al. (1998). In this configuration, effectively one standing wave is formed by two phase-related beams and it is folded and intersecting with itself twice. The time phases of the trapping beams are related to each other and thus the interference pattern is intrinsically stable. The beam configuration for the phase-stabilized MOT used in our experiments is described in Ref. Kim et al. (2010) in more detail.
The intensity of total electric field of the MOT with proper axes and origin is then given by , where the is the intensity of a single beam and having a value between 0 to 1 is a geometrical structure function of the interference pattern given by . The local polarization of the total electric field is linear everywhere but its orientation varies in space. The optical dipole potential for a multi-level atom in a hyperfine Zeeman ground sublevel interacting with a linearly polarized electric field of the MOT is given by
| (1) |
where is the laser detuning, is the normalized Clebsch-Gordan coefficient for transition (), and is the detuning-dependent saturation parameter givin by
with the maximum intensity of . The saturation intensity is 1.67 mW/cm2 for cycling transition of 85Rb atom with circularly () polarized light and MHz is the full-width-at-half-maximum (FWHM) natural linewidth of the transition.
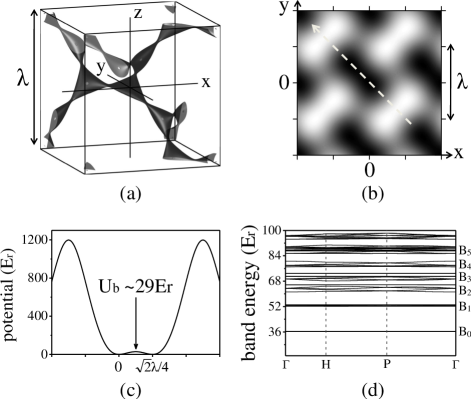
The 3D structure of the lattice and the contour map for a specific two-dimensional (2D) plane for the optical potential are depicted in Fig. 1. The lattice forms a body-centered-cubic structure containing eight local minima in a unit cell. Each minimum has three nearest neighboring minima and these minima are connected to each other through a relatively shallower potential barrier with a height of . The potential height in the direction perpendicular to the plane defined by three nearest-neighbor minima is much more higher than the barrier height . Hence, the structure of the optical lattice looks like an array of chained anisotropic double-well potentials in 3D space. For more details see Ref. Kim et al. (2011).
The intrinsic characteristic of the optical lattice in a MOT with the double-well barrier is determined only by , the geometrical structure of the interference pattern. The height of the double-well barrier between two adjacent potential minima is given by
| (2) |
where and for transition of a rubidium atom. The barrier does not increase linearly as the intensity increases at a fixed detuning and is saturated to a finite level when intensity increases to infinity. The maximum height of the barrier is then , where is a recoil kinetic energy of an atom. For example, when the detuning of the trap laser is , the barrier height is limited to corresponds to K in one-dimensional temperature for a rubidium atom with a recoil energy kHz. Since the is too shallow for a usual trapping condition with a detuning of and a intensity , only the motional ground and first excited bands (B0 and B1) can be tightly bound three dimensionally as shown in a diagram of energy-band structure depicted in Fig. 1(d). The atoms populated in higher excited bands can move relatively freely through the shallow channels but are still confined in other directions.
III Experimental Setup
III.1 Setup for MOT
In this experiment 85Rb atoms are trapped in a vapor-loaded MOT. Only two phase-related beams are used in order to allow a stable 3D optical lattice in the MOT. The frequency of the trap laser is locked to D2 transition line (5S1/2, 5P3/2, ) of 85Rb atom by means of frequency modulation technique and is typically detuned to from the atomic resonance. A Rubidium dispenser is mounted about 3 cm below the MOT center. Only the number of trapped atoms in a MOT can be varied by changing the driving current on the dispenser while the other trap parameters are all fixed. When a magnetic field gradient is set to 60 G/cm, typically about atoms are loaded to the MOT and the size of the atom cloud is about 50 m in the 1/e radius.
III.2 Setup for heterodyne measurement
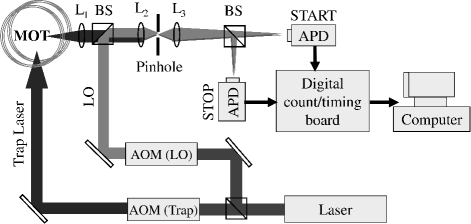
The setup for the spectrum measurement based on the heterodyne PCSOCS is shown in Fig. 2. A local oscillator (LO) is derived from the same laser as the trapping laser and the frequency is shifted by an acousto-optic modulator (AOM) and actively locked to 10 MHz apart from the trapping laser frequency. The fluorescence emitted from the atoms trapped in a MOT is collected by an objective lens (=25 mm, numerical aperture of 0.26) and combined with LO by a beam splitter (BS). The combined lights are then spatially filtered in order to match the spatial mode. Finally it is split into two beams and detected by two avalanche photo diodes (APDs) operating in photon counting mode. A detection volume is about 15 m in diameter and the mean photon count rate of the fluorescence light was typically about cps for each APD. A background count rate is lower than 100 cps, which is negligibly small compare to the fluorescence signal. The photon pulses detected by two APDs are fed into two counter/timing boards (NI-6602, National Instruments) as START and STOP pulses, respectively. By accumulating a histogram of the number of stop photons arriving at time separation of , the intensity correlation function is obtained. Since this contains the first-order correlation function of the fluorescence Hong et al. (2006), the fluorescence spectrum can be obtained by performing a digital fast Fourier transform of and displayed on a computer monitor almost in real time. In this setup, we typically use a bin time of 12.5 ns and a span time of 10 ms, which correspond to 0.1 kHz frequency resolution and 40 MHz maximum span frequency, respectively. The spectral resolution of our detection system is measured to be 1.4 kHz which is mainly determined by the phase fluctuations of the rf signal driving the AOM used for frequency shift of LO laser.
IV Results
IV.1 Phase-stabilized MOT
IV.1.1 Characteristic fluorescence spectrum

A characteristic fluorescence spectrum with the phase-stabilized MOT is shown in Fig. 3. Typically a small number of atoms () are loaded in the MOT with an atomic number density /cm3. In contrast to a usual MOT where one might expect a Doppler broadened spectrum, the spectrum in Fig. 3 does not show Doppler broadening. Instead, it shows a sharp central peak and small sidebands. We interpret that the central peak is due to elastic Rayleigh scattering or photon emission without changing both the vibrational band and Zeeman -sublevel of ground state. The first two sidebands at positions with respect to the central peak correspond to Raman transitions between the two lowest vibrational bands, and . On the outside of them, two more broader and much smaller sidebands are barely seen. We attribute them to the transition between the first and third vibrational bands, and . The spectrum is well fit by five Lorentzians for the Rayleigh peak and the four Raman sidebands without considering Doppler broadening. The disappearance of Doppler broadening in the spectrum is associated with Dicke narrowing of strongly confined atoms in space, i.e., a strong 3D confinement of atoms inside the shallow lattice potentials of the MOT.
We consider here that the local polarization of the total electric filed of the MOT’s trapping lasers is linear everywhere. Due to the optical pumping, the atoms are mostly populated in =0 and = Zeeman sublevels of the ground state with relative populations, =0.38 and =0.24 Schadwinkel et al. (1999); Brzozowski et al. (2005). The different Clebsch-Gordan coefficients will induce different light-shift potential depths for different sublevels Souther et al. (2010): the difference of potential well depths between and ground-state Zeeman sublevels is expected to be in the range of 200400 kHz under the typical MOT conditions. Thus, it is expected to observe additional peaks due to the electronic spontaneous Raman transitions () in the vicinity of several hundred kHz as shown in probe transmission spectra Schadwinkel et al. (1999); Brzozowski et al. (2005); Souther et al. (2010). In the fluorescence spectra, however, we could not find any observable peaks to be considered as such electronic Raman transitions between different Zeeman sublevels. A possible reason would be an inhomogeneous magnetic field near the center of the magnetic quadrupole of MOT. Due to the finite size of atomic cloud, the atoms experience different Zeeman shifts for sublevels at different locations. Moreover, the atomic transition by the locally linearly polarized trapping laser cannot be regarded as a pure transition in the presence of arbitrary oriented magnetic fields. All of these would induce position-dependent light shits and inhomogeneous broadening in Raman transition spectra.
IV.1.2 Vibrational frequency
The vibrational frequency corresponding to the peak position of the first sidebands is measured as a function of the saturation parameter by varying the intensity of the trapping laser at a fixed detuning of . The measurements are compared with the band structure calculations in Fig. 4. From the band structures calculated for the mostly populated atomic states and , the first energy gap between the ground () and first-excited () bands are obtained and plotted in solid and dotted lines, respectively. The shapes of the potentials for and are not significantly different and thus the vibrational frequencies corresponding to and transitions can not be distinguished clearly from the observed spectra.
Both the theoretical and measured oscillation frequencies clearly show saturation trends with the saturation parameter . We confirmed that the square of the vibrational frequency is linearly proportional to the shallow barrier rather than the maximum potential depth, over a large range of . As we discussed in Sec. II, this saturation trend in the intensity dependence of can be interpreted as the saturation effect of . It is interesting to note that the optical lattice formed by the MOT’s field is characterized by the height of the shallow barrier rather than .
It is noted that the measured oscillation frequencies are about 1.4 times higher than those predicted by calculations, which means that the actual height of is roughly two times higher than the predicted in Eq. (2). We are not able to clearly explain the discrepancy between the measurements and the calculations. It might be attributed to various experimental imperfections such as intensity imbalance, imperfect polarization or misalignment of the trap lasers, any of which can induce an unexpected distortion in the special interference pattern , especially in the fine microstructure of the double-well potentials. However, such imperfection is unlikely since in the experiments the trapping beams and position of the atom cloud were adjusted for the best lattice formation by monitoring changes in the spectral line shapes in real time. The peak intensity of the Gaussian-shaped trapping beam is used to calibrate saturation parameter . It has been checked that the calibrated saturation parameter used in Fig. 4 is in good agreement with that obtained from the saturation curve of single-atom fluorescence Yoon et al. (2007).

IV.1.3 Spectral linewidth
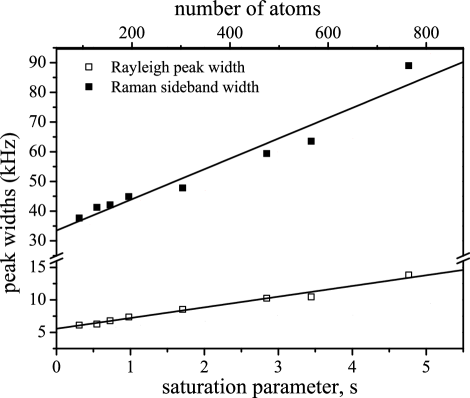
The linewidths of the Rayleigh peak and the Raman sidebands are shown as a function of saturation parameter in Fig. 5. Both the Rayleigh and Raman linewidths increase as increases. There are several possible effects affecting the lineshape of the fluorescence spectrum.
The Rayleigh linewidth is related to the finite lifetimes of the vibrational states Courtois and Grynberg (1992). In the fluorescence spectrum of a single atom in the MOT of Ref. Kim et al. (2011), it was observed that the optical pumping into hyperfine ground state, which is proportional to the atomic excited-state population or equivalently the trap-laser intensity, gives the main spectral broadening of the Rayleigh peak. The tunneling rate of the bound atom from one lattice site to nearest neighbors gives additional broadening in the spectrum, but it is relatively small compare to the optical pumping at a large , i.e., a deep potential well. In a deep harmonic potential limit, the tunneling rates of the atoms in the deepest bound states would decrease as the potential depth increases and thus the Rayleigh linewidth is inversely proportional to . The measured linewidth of the Rayleigh peak in a single-atom spectrum in Ref. Kim et al. (2011) was varied only in a range of kHz under various trap conditions due to the above broadening effects.
In Fig. 5, however, the linewidth of Rayleigh peak is larger, varying linearly from 6 to 14 kHz as is increased and consequently as the number (density) of trapped atoms is varied from 100 (/cm3) to 800 (/cm3). Nonetheless, the linear fit of the observed Rayleigh linewidth has a finite intercept of 5.6 kHz, which is quite comparable to the linewidth of a single-atom spectrum Kim et al. (2011). The increased widths of the Rayleigh peak and the Raman sidebands observed in this measurement must be interpreted as extra homogeneous line broadenings due to many-atom effects such as atomic density-induced radiation trapping and intra-trap cold collisions. Due to the radiation trapping, a large number of atoms in a MOT usually give rise to a high atomic temperature. The hotter atoms become more populated in high-lying vibrational levels, which lead to higher tunneling rate of the atoms between adjacent potential minima through the shallow potential well and consequently give broader linewidth of the Rayleigh line.
The main cause of the broadening in the Raman sidebands is evidently the high temperature of the atoms in the fully anharmonic potential well of the MOT as in Ref. Morsch et al. (2000). Consequently, the larger atomic populations in high-lying vibrational levels at a large saturation parameter result in asymmetric Lorentzian lineshapes of the Raman sidebands and broadening of the whole spectrum. We attribute such frequency shifts, as well as broadenings and asymmetric lineshapes of the Raman sidebands to the increase of atomic temperature in a strongly anharmonic band structure [as shown in Fig. 1(d)].
IV.1.4 Spectrum vs. density
It is known that the effects of the radiation trapping become observable only in dense atomic gases with densities of /cm3 in general. It has been shown that the coherence properties of the scattered light measured by intensity correlation function can be extremely sensitive to the presence of the radiation trapping even for a dilute atomic gas with densities of /cm3 Beeler et al. (2003).
In order to demonstrate how the spectral lineshape can be affected by the number density of atomic cloud, the fluorescence spectra were measured for various numbers of trapped atoms. Only the number of trapped atoms is varied by changing the current applied on the Rubidium getter dispenser, while other trapping parameters are all fixed (, ). The density of atomic cloud is varied from /cm3 to /cm3, as the number of atoms is being increased from about to . The resulting spectra are shown in Fig. 6. The widths of Rayleigh and Raman peaks become broader as the atomic density increases.

It is interesting that the spectral shape starts to change substantially when the density is increased beyond /cm3: The Rayleigh peak and Raman sidebands gradually disappear and a much broader Gaussian-shaped Doppler-broadened spectrum emerges. We interpret this as a result of increase in atomic temperature due to the radiation trapping. The increase in atomic kinetic energy leads to changing the atomic motional state from bound states in double-wells to upper continuum states. In fact, we have confirmed that the spectrum is changed in the same way when the atoms are heated up by shining a resonant laser beam directly to the atom cloud even at a low atomic density.
As the getter current increases linearly, the density and number of trapped atoms increase to their maxima /cm3 and , respectively, and then start to decrease, but the spectrum still continues to become broader as shown in Fig. 6 (g) and (h). These behaviors are due to the background gas collisions: the density of background Rubidium atoms increases with the getter current and thus induces collisions with the trapped atoms, thereby decreasing the number of trapped atoms and increasing the collisional broadening. In this regime, the size of atom cloud increases without increasing in the atomic density.
For a dilute atom cloud with a density of /cm3 in our phase-stabilized MOT, only a small fraction of the total number of the lattice sites ( sites/cm3) is occupied by the atoms. One of the interesting feature in this situation with a small filling factor is that the tightly bound atoms in the lattice sites would collide rarely with each others. It is expected that light-induced two-atom collisions Ueberholz et al. (2000); Choi et al. (2007) are greatly suppressed.
On the contrary, as the number (density) of trapped atoms are increased (/cm3), the mean kinetic energy of the atoms becomes higher than the double-well barrier due to the radiation trapping and they start to move freely over the barrier. However, the atoms are still well confined in effective 2D space because of the higher potential depth along other directions. In this case the effective trap volume should be introduced as the volume in which the atoms can move freely. This volume is typically about 50 times smaller than the volume defined by the size of atomic cloud in an ordinary MOT without the lattice structure. The density of atoms in terms of the effective volume has already reached the maximum (/cm3) in Fig. 6(f) and cannot be increased further due to the light-induced intra-trap cold collisional loss. A substantial increase in two-atom collisions is expected there.
IV.2 Fluorescence spectra in a standard MOT
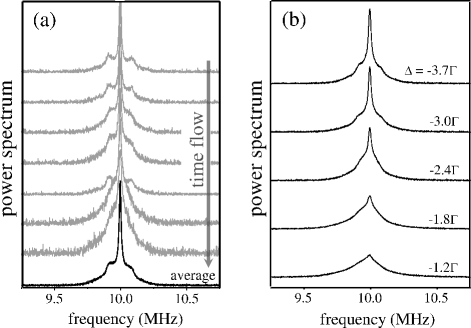
We have also measured fluorescence spectra of trapped atoms in a MOT in a standard retroreflected six-beam configuration, where three trapping laser beams propagating along orthogonal axes are retro-reflected. The effects of phase fluctuations between the trapping beams on the fluorescence spectrum are shown in Fig. 7(a). The each spectrum is recorded sequentially in every 30 seconds and shown in chronological order from the top. The spectrum at the bottom is a total accumulated spectrum of all recorded spectra. Strong Dicke narrowing and even Raman sidebands are clearly shown in some spectra, but Doppler-broadened distribution is dominant in most cases. In this case, small changes in phase relation between the trap beams would generate significant changes in topography of light-induced micropotentials. Especially, the structures of shallow micropotentials are easly destroyed by small mechanical vibrations in optics. The mechanical vibration is usually slow compare to the timescale of the atomic vibrational motion in micropotentials ( kHz).

Figure 7(b) shows time-averaged spectra measured at various detunings. The spectral shapes with a narrow peak at the center and a Doppler-broadened pedestal are similar to those of the phase-stabilized MOT with high atomic densities and also similar to the spectra firstly observed in the 3D optical molasses Westbrook et al. (1990). The linewidth of the Doppler-broadened pedestal increases from 200 kHz to 500 kHz as the detuning is decreased.
The atomic temperatures can be extracted from the widths of the Doppler-broadened spectra by ignoring the narrow peak at the center. In the simple one-dimensional sub-Doppler cooling theory Dalibard and Cohen-Tannoudji (1989); Chang and Minogin (2002), the temperature of sub-Doppler cooled atoms in a MOT is proportional to the trap intensity and inversely proportional to the detuning, , where is the Rabi frequency per single trapping beam. The measured temperatures for various trap parameters shown in Fig. 8 are consistent with the sub-Doppler cooling theory and also show a reasonable agreement with earlier measurements of the MOT temperature. The Doppler-cooling limit temperature for a rubidium atom is , which corresponds to spectral broadening of 600 kHz. The measured temperatures are well below the Doppler-cooling limit as expected.
V Summary
We have built a high-speed precision spectrum measurement system for a small number of cold atoms based on the heterodyne photon-counting-based second-order correlation spectroscopy. Fluorescence spectra of the trapped atoms in a phase-stabilized optical-lattice-like MOT have been measured under various trap conditions. The optical lattice created by trapping lasers of the MOT itself forms an array structure of chained anisotropic double-well potentials in 3D space. A narrow Rayleigh peak and well-resolved Raman sidebands which are observed in fluorescence spectra show that the MOT behaves as a stable 3D optical lattices simultaneously and the atoms can be well confined in the sub-wavelength-size double-well potentials. We have also shown that the linewidths of the fluorescence spectra can be affected significantly by the radiation trapping even in a dilute atomic gas (/cm3). The increase in the atomic temperature due to the radiation trapping gives rise to the excitation of atoms in bound motional states of the shallow double-well potentials to upper continuum states. This results in the line broadening in the fluorescence spectrum. With a high atomic density, the radiation trapping as well as the intra-trap and background gas collisions induce more substantial spectral broadenings. The rate of light-induced intra-trap cold collisions in an optical-lattice-like MOT is enhanced with high atomic densities (/cm3) because of the reduction of the effective trap volume. However, the cold collisions are expected to be suppressed dramatically for low atomic temperature with relatively low atomic densities in the range of /cm3.
Acknowledgements.
The authors acknowledge fruitful discussions with Jai-Hyung Lee and Changwon Park.References
- Raab et al. (1987) E. L. Raab, M. Prentiss, A. Cable, S. Chu, and D. E. Pritchard, Phys. Rev. Lett. 59, 2631 (1987).
- Westbrook et al. (1990) C. I. Westbrook, R. N. Watts, C. E. Tanner, S. L. Rolston, W. D. Phillips, P. D. Lett, and P. L. Gould, Phys. Rev. Lett. 65, 33 (1990).
- Jessen et al. (1992) P. S. Jessen, C. Gerz, P. D. Lett, W. D. Phillips, S. L. Rolston, R. J. C. Spreeuw, and C. I. Westbrook, Phys. Rev. Lett. 69, 49 (1992).
- Hemmerich and Hänsch (1993) A. Hemmerich and T. W. Hänsch, Phys. Rev. Lett. 70, 410 (1993).
- Grynberg et al. (1993) G. Grynberg, B. Lounis, P. Verkerk, J.-Y. Courtois, and C. Salomon, Phys. Rev. Lett. 70, 2249 (1993).
- Gatzke et al. (1997) M. Gatzke, G. Birkl, P. S. Jessen, A. Kastberg, S. L. Rolston, and W. D. Phillips, Phys. Rev. A 55, R3987 (1997).
- Schadwinkel et al. (1999) H. Schadwinkel, U. Reiter, V. Gomer, and D. Meschede, Phys. Rev. A 61, 013409 (1999).
- Rauschenbeutel et al. (1998) A. Rauschenbeutel, H. Schadwinkel, V. Gomer, and D. Meschede, Opt. Comm. 148, 45 (1998).
- Dalibard and Cohen-Tannoudji (1989) J. Dalibard and C. Cohen-Tannoudji, J. Opt. Soc. Am. B 6, 2023 (1989).
- Weiner et al. (1999) J. Weiner, V. S. Bagnato, S. Zilio, and P. S. Julienne, Rev. Mod. Phys. 71, 1 (1999).
- Ueberholz et al. (2000) B. Ueberholz, S. Kuhr, D. Frese, D. Meschede, and V. Gomer, J. Phys. B: At. Mol. Opt. Phys. 33, L135 (2000).
- Choi et al. (2007) Y. Choi, S. Yoon, S. Kang, W. Kim, J.-H. Lee, and K. An, Phys. Rev. A 76, 013402 (2007).
- Lawall et al. (1998) J. Lawall, C. Orzel, and S. L. Rolston, Phys. Rev. Lett. 80, 480 (1998).
- Grison et al. (1991) D. Grison, B. Lounis, C. Salomon, J. Y. Courtois, and G. Grynberg, Europhys. Lett. 15, 149 (1991).
- Tabosa et al. (1991) J. W. R. Tabosa, G. Chen, Z. Hu, R. B. Lee, and H. J. Kimble, Phys. Rev. Lett. 66, 3245 (1991).
- Brzozowski et al. (2005) T. M. Brzozowski, M. Brzozowska, J. Zachorowski, M. Zawada, and W. Gawlik, Phys. Rev. A 71, 013401 (2005).
- Souther et al. (2010) N. Souther, R. Wagner, P. Harnish, M. Briel, and S. Bali, Laser Physics Letters 7, 321 (2010).
- Bali et al. (1996) S. Bali, D. Hoffmann, J. Simán, and T. Walker, Phys. Rev. A 53, 3469 (1996).
- Beeler et al. (2003) M. Beeler, R. Stites, S. Kim, L. Feeney, and S. Bali, Phys. Rev. A 68, 013411 (2003).
- Nakayama et al. (2010) K. Nakayama, Y. Yoshikawa, H. Matsumoto, Y. Torii, and T. Kuga, Opt. Express 18, 6604 (2010).
- Kim et al. (2011) W. Kim, C. Park, J.-R. Kim, Y. Choi, S. Kang, S. Lim, Y.-L. Lee, J. Ihm, and K. An, Nano Letters 11, 729 (2011).
- Hong et al. (2006) H.-G. Hong, W. Seo, M. Lee, W. Choi, J.-H. Lee, and K. An, Opt. Lett. 31, 3182 (2006).
- Dicke (1953) R. H. Dicke, Phys. Rev. 89, 472 (1953).
- Das et al. (2010) M. Das, A. Shirasaki, K. P. Nayak, M. Morinaga, F. L. Kien, and K. Hakuta, Opt. Express 18, 17154 (2010).
- Walker et al. (1990) T. Walker, D. Sesko, and C. Wieman, Phys. Rev. Lett. 64, 408 (1990).
- Kim et al. (2010) W. Kim, C. Park, J.-R. Kim, Y.-L. Lee, J. Ihm, and K. An, arXiv:1010.6023v2 (2010).
- Yoon et al. (2007) S. Yoon, Y. Choi, S. Park, W. Ji, J.-H. Lee, and K. An, Journal of Physics: Conference Series 80, 012046 (2007).
- Courtois and Grynberg (1992) J.-Y. Courtois and G. Grynberg, Phys. Rev. A 46, 7060 (1992).
- Morsch et al. (2000) O. Morsch, P. H. Jones, and D. R. Meacher, Phys. Rev. A 61, 023410 (2000).
- Chang and Minogin (2002) S. Chang and V. Minogin, Physics Reports 365, 65 (2002).