reception date \Acceptedacception date \Publishedpublication date \SetRunningHeadAstronomical Society of JapanUsage of pasj00.cls
stars: dwarf novae —accretion, accretion disks — magnetic fields — stars: individual: WZ Sge, EG Cnc, V585 Lyr, V1504 Cyg
SU Uma stars: Rebrightenings after superoutburst
Abstract
SU Uma stars after their long superoutbursts often show single or multiple rebrightenings. We show how this phenomenon can be understood as repeated reflections of transition waves which mediate changes between the hot and the cool state of the accretion disk and travel back and forth in the outer disk region, leaving an inner part permanently hot. This points to a temporarily increased viscosity, possibly related to the formation of large-scale and longer persisting magnetic fields by the dynamo operation during the long superoutburst. The ’mini-rebrightenings’ in the early post-outburst light curve of V585 Lyr discovered by Kato and Osaki in Kepler observations seem to be understandable as a small limit cycle of low luminosity changes originating from a wiggle-feature in the thermal equilibrium curve of the cool optically thick disk.
F. Meyer and E. Meyer-Hofmeister Rebrightening in WZ Sge stars
1 Introduction
The SU UMa stars, a subgroup of dwarf novae, have long-lasting and bright superoutbursts with regular dwarf nova outbursts in between. A further subgroup of these, the WZ Sge stars, show only long-lasting and very bright superoutbursts. For both kinds of sources, mainly for WZ Sge stars, rebrightenings are observed right after the decline from a superoutburst. During the rebrightening phase repetitive brightness variations of one to three magnitudes, lasting several days, are found. The light curves show an interesting pattern of slightly steeper rise and slower decay. This brightness variation may be the mark of the two kinds of transition waves mediating the change of an accretion disk from cold to hot and from hot to cold state. Such a pattern of steeper rise and slower decay can also be seen in light curves of ordinary dwarf nova outbursts (e.g. see Cannizzo et al. 2012).
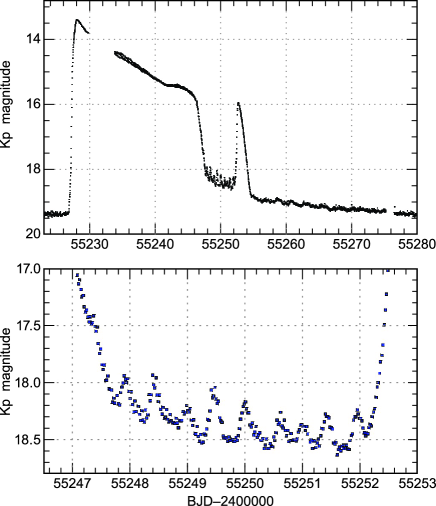
The so-called ’mini-rebrighenings’ in the Kepler observations of the superoutburst of V585 Lyr, found and discussed by Kato and Osaki (2013), marginally also show this pattern. These repetitive semi-periodic brightness variations of 0.4-0.5 mag, with a period of 0.5d, lasting about 4 days, are a new feature of dwarf nova outburst behavior. V585 Lyr was classified as a borderline object between SU UMa and WZ Sge-type dwarf novae (Kato and Osaki 2013). Such light variations as recorded by the Kepler satellite in January-February 2010, have never been documented before. In Fig.1 the light curve is shown. As Kato and Osaki (2013) pointed out the amplitudes appear to be too large to be explained by a beat between some period and another, and the periods appear to be too short to be explained by a beat phenomenon, so the feature should be seen as a real brightness variation with these timescales.
Rebrightenings are observed in several SU UMa stars. Especially the observation of six consecutive rebrightenings of EG Cnc after its main outburst in 1996/97 (Patterson et al. 1998) raised the question how these brightness variations could come about. Hameury (2000), Hameury et al. (2000) and Buat-Ménard and Hameury (2002) suggested that the rebrightenings could be explained by enhanced mass transfer due to illumination of the secondary star. But the investigation of mass transfer lead to the result that the mass transfer enhancement is neglegible: (1) the critically examined observations do not show enhanced mass transfer and (2) the theoretical analysis shows the problems with an irradiation effect, the shadow of the accretion disk cast on the point, the high opacity in the extreme ultraviolet band (which prevents the bulk of radiative flux from reaching the stellar photosphere) and the strong Coriolis forces (which prevent the heated material from moving towards ) (Osaki & Meyer 2003, 2004). The analytic result was confirmed in a numerical way by Viallet & Hameury (2008).
Osaki et al. (2001) explained the rebrightenings of EG Cnc as originating from increased viscosity. If the dynamo created magnetic fields in the accretion disk are responsible for the viscosity and stay on for a while when the dynamo action has already ended, as magneto-hydrodynamic simulations show (Balbus and Hawley 1991), then an outburst created increase of the viscosity also can stay on for some time after the superoutburst and during that period lead to a sequence of brightness variations until hot and cold state viscosities have resumed their normal values and the regular outburst behavior is established. The mini-rebrightenings are different from the regular rebrightenings with respect to their rapid repetition, their small amplitude and the occurrence at almost quiescence luminosity.
In this paper we suggest that the many features in the regular rebrightenings can be understood in the context of the general model of enhanced viscosities at the end of the superoutburst. Our aim is not the modeling of rebrightenings with the help of detailed computer simulations, but to show how this phenomenon might be understood as originating from properties of the viscosity related to the disk magnetic fields, generally accepted as the cause of the disk viscosity.
In Section 2 we give a short summary of the physics of dwarf nova outbursts and the underlying mechanism of the cyclic changes between a cold unionized and a hot ionized state of the accretion disk. In Section 3 we give a short discussion of features of disk magnetic fields and the consequences for the viscosity they generate. In Section 4 and 5 we report on the observations of rebrightenings and discuss how the rebrightenings can be interpreted as resulting from transition waves changing the disk structure back and forth between hot and cool state, propagating in a limited part of the disk. In Section 6 we discuss a possibility how the mini-rebrightening phenomenon could be understood. Discussion and conclusions follow in Section 7 and 8.
2 Disk structure and dwarf nova outbursts
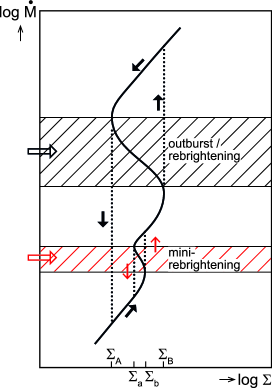
The evolution of the surface density distribution depends on the mass flow and angular momentum transport in the disk and the mass of the central star. The angular momentum transport is determined by friction, traditionally parametrized as the ratio of viscous stress to gas pressure (Shakura and Sunyaev 1973), its physical cause now seen in the magneto-rotational turbulence documented by many MHD simulations. The surface density is determined by vertical structure computations. Fig.2 shows an example of the relation between surface density and mass flow rate (or effective temperature, or emitted flux). The characteristic S-shape of the equilibrium solution is due to hydrogen ionization in this temperature range. In this region for the same surface density a hot, high mass flow rate stable solution and a cool, low mass flow rate stable solution exist, with an unstable part in between. The equilibrium solution curve, here is shown for cm, the shape is about similar for all the distances from the central star.
We show the equilibria solutions for the two viscosity values 0.05 and 0.2 (for all examples shown here we used the vertical structure results put together by Ludwig et al. (1994)). The existence of an unstable branch causes relaxation oscillations, the dwarf nova outburst cycles. Already in the beginning of modeling of the observed dwarf nova outbursts it became clear that for a proper description of the outburst it is necessary to assume a lower viscosity value, by about a factor of 4, for the cool state than for the hot state, e.g. =0.05, =0.2 (Smak 1984). The features of the disk instability were modeled in many investigations (Meyer and Meyer-Hofmeister 1981, 1984, Smak 1982, Cannizzo et al. 1982, Mineshige and Osaki 1983, for a review see Cannizzo 1993, Osaki 1996, Hameury et al. 1998). Comparison of models with observations including recent Kepler light curves (Cannizzo et al. 2012) allows to understand detailed properties of the different dwarf nova systems.
During the disk evolution hot and cool state cannot exist side by side, instead transition waves move across the bi-stable region and there mediate the change from the cold to the hot state and back (Meyer 1984). If a transition wave reaches the boundary of a bi-stable region it cannot continue and is reflected as a transition wave of the opposite type. In a standard dwarf nova outburst cycle (see e.g. Meyer and Meyer-Hofmeister 1984, Ludwig and Meyer 1998) mass accumulation in quiescence leads to a general increase of surface density at all distances until somewhere in the disk the critical surface density is reached, and the transition waves spread outward and inward, inducing the change to the hot ionized state in the whole disk. In the hot disk the mass flow is high, the surface density decreases until the critical value is reached at the outer edge of the disk and with the propagation of the cooling wave the whole disk transits to the cold state, appearing as quiecence.
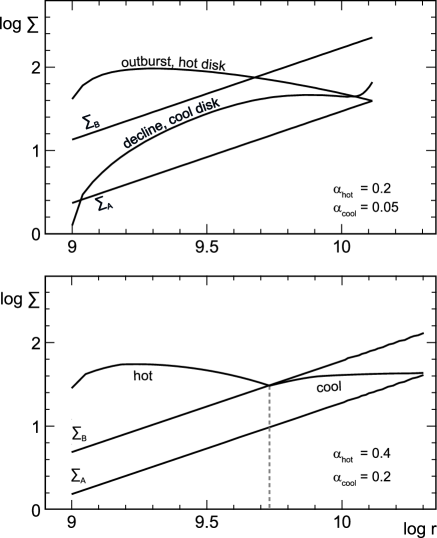
Fig.3 shows two examples of disk evolution. For the first computation standard viscosity values =0.2, =0.05 were used, for the second enhanced viscosity values =0.4=0.2 (white dwarf mass 1, outer disk edge at cm in all computations). Fig.3, top panel, shows surface density distributions for the standard case, first at the moment when during decline from outburst is reached at the outer disk edge (upper curve). The second curve describes the distribution after the surface density had at the outer edge decreased to , a cooling wave propagated inward and reached the inner edge. Then the disk is completely cool. The bottom panel shows the surface density distribution for the enhanced viscosity values, also during outburst decline after was reached and the cooling wave propagated inward. With the enhanced values the critical value is closer to and the cooling wave reaches before the whole disk becomes cool. Since for surface densities higher than no cool state exists anymore, the cooling wave is reflected as an outward propagating heating wave, and the brightness increases again leading to a rebrightening of the disk. The further disk evolution is discussed in Section 5.
These two examples of disk evolution were computed with our code (Meyer and Meyer-Hofmeister 1984) with separately computed transition wave velocities (Ludwig et al. 1994). With the localized front approximation in this code, the decrease of surface density in the hot region near the transition is not resolved. But at which time the critical surface density is reached is practically independent of this feature (compare Ludwig and Meyer 1998).
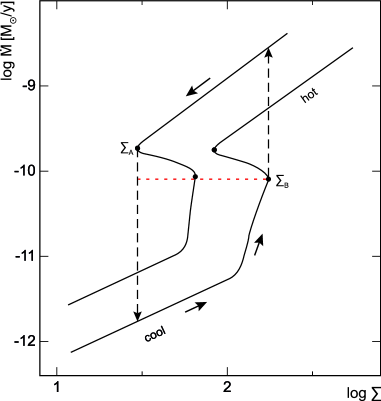
Whether reflection of the cooling wave occurs depends on the difference between the values and (marked in Fig.2 by a the dotted red line), and on the transition wave velocities, which all depend on the viscosity values taken.
For SU UMa stars the complete outburst cycles including the superoutbursts were explained by a combination of thermal instability with the tidal instability, the tidal forces caused by the 3:1 resonance between disk and binary orbit (Osaki 1989).
3 Viscosity, magnetic fields and dynamos
In this section we are interested in the aspect that the magnetic origin of viscosity introduces into the accretion physics of dwarf nova outbursts, in particular for the rebrightening phenomena during the outburst cycles of SU Uma stars.
Even before Balbus and Hawley (1991) discovered the fundamental importance of the magneto-rotational instability (MRI) for the dynamo generation of magnetic fields and the viscosity in accretion disks Smak (1984) pointed out that in order to obtain good DN outburst simulations the viscosity must differ between hot and cool state of the accretion disk.
Now many MHD simulations support the generally accepted concept that dynamo-created magnetic fields are responsible for the high viscosity in the outburst. The MRI in the disk is a small-scale phenomenon that operates on magnetic fields of the scale of the disk height producing flux bundles of opposite polarity. These flux bundles connect neighboring regions and exchange angular momentum between them. Magnetic buoyancy leads to rising and sinking of flux tubes. The whole process is turbulent. As magnetic flux penetrates the disk surface one obtains locally separated regions of positive and negative polarity. The turbulent character constitutes diffusivity for magnetic fields and angular momentum.
In quiescence in ordinary dwarf novae electrical conductivity becomes too poor to allow dynamo action (Gammie and Menou 1998). But the required viscosity can now still be provided by the magnetic fields of the secondary star that penetrate the disk or are entrained with the accretion, since even at the lower temperature of quiescence the conductivity is high enough to give a significant coupling between matter and magnetic field. In WZ Sge stars the large accumulation of matter during the extremely long quiescence indicates an even lower viscosity, e.g. in WZ Sge itself a value of order 0.001 (Smak 1993, Meyer-Hofmeister et al. 1998). In this binary during the long lasting evolution the companion star has become a degenerate brown dwarf, which neither can operate a stellar dynamo nor hold magnetic fields from earlier dynamo action, so that this source of quiescence viscosity disappears (Meyer and Meyer-Hofmeister 1999).
The concept of dynamo-created magnetic fields brings interesting aspects into the scheme of accretion disk viscosity. The continuous local dynamo generation and decay of magnetic flux and its diffusion can lead to large-scale components in the radial distribution. As shown by MHD simulations of turbulent plasma by Brandenburg (2000) these large-scale components are built up on their respective diffusive timescale (’inverse cascade’). With their appearance also the local saturation field strength increases. This means an increase of the local friction and angular momentum transport, in the alpha-parametrization an increase of the alpha value. Thus in the course of a long lasting outburst large-scale magnetic flux distributions stochastically evolve (Park 2014). The complete picture is complex and also includes vertical differences in the formation and transport of magnetic fields (e.g. Suzuki and Inutsuka 2014).
When the dynamo action stops and the disk returns to the cool state, MRI and turbulence remain since the electrical conductivity is still sufficiently high to couple matter and magnetic fields, though not sufficiently high to operate a dynamo. Thus no new flux is generated and the existing flux distributions will decay on their turbulent diffusive timescales by mixing of positive and negative polarities. For the locally generated fields of size of the order of a few scale heights the decay time then is very short, about a few times the Kepler orbital time divided by alpha, about hours. But the components of the large-scale polarity distribution can only be annihilated on the long large-scale diffusion time, which is the diffusion time for the whole disk, the characteristic time of outburst decline, of the order of weeks.
This character has consequences for the formation of the viscosity in short and long lasting outbursts. While in ordinary outbursts the matter is exhausted in one diffusion time of the hot disk, in the long lasting superoutbursts the flux distributions stay on for much longer time. This character is mirrored in the magnetically induced viscosity after the outburst. Also the viscosity for the cool state remaining after a superoutburst can be significantly enhanced, even more than the hot state viscosity, because of the additional presence of those dynamo-created fields in quiescence. This has the effect that the critical values log() and log() become closer together, in contrast to the situation in ordinary outbursts where the dynamo fields have quickly disappeared. This is an important feature for either standard DN outbursts or the occurrence of reflection of transition waves.
For our modeling of rebrightenings we get the picture of increased alpha-values in long duration superoutbursts while persisting over weeks.
The idea of an enhanced cool state viscosity was already used in the modeling of the rebrightenings of EG Cnc (Osaki et al. 2001). The emerging picture of accretion disk dynamo processes and magnetic viscosity now opens the possibility to understand the rebrightenings of the WZ Sge stars in their many different aspects.
4 Rebrightening observations
The rebrightenings or ’echo outbursts’ here to be discussed are only observed in SU UMa stars, a subgroup of dwarf nova, which besides the regular outbursts show the more luminous and longer duration superoutbursts. The number of regular outbursts between the superoutbursts decreases with the orbital period until finally the lowest period WZ Sge stars only show long-lasting superoutbursts. After the luminosity decline at the end of a superoutburst sometimes a short rebrightening, an increase of luminosity by to 2-3 magnitudes, lasting only a few days, is observed. Such single or repetitive rebrightenings differ from regular outbursts in the way that the rebrightening is shorter, the brightness increase is smaller, but are followed by the usual long quiescence. Imada et al. (2006) classified the rebrightenings by their light curve shapes as the types long-duration, multiple and single. One source can display different types after different superoutbursts, as e.g. observed for UZ Boo, EZ Lyn and WZ Sge (Arai et al. 2009, Nakata et al. 2013), which might be interesting with respect to the understanding of the physics involved. Information on rebrightenings is summarized in the surveys by Kato et al. (2009, 2010, 2012, 2013, 2014), in the recent papers by Mróz et al. (2013) on OGLE objects, and by Nakata et al. (2013) on MASTER OT objects. Generally in quite a number of sources indications of rebrightening are found, but often due to only few observations or intrinsic faintness the detailed features cannot be seen clearly.
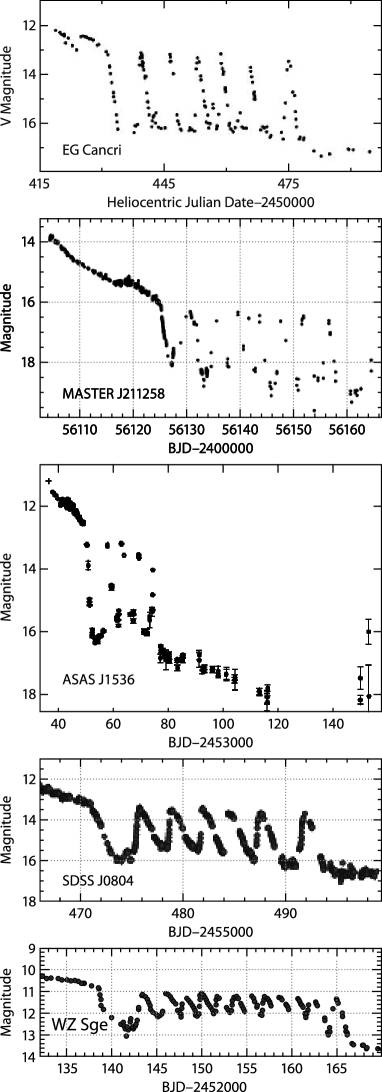
In Fig.4 we show various patterns of multiple rebrightenings, a series of individual brightness changes of the same amplitude, following the superoutburst in SU UMa stars. In EG Cnc the sequence of the rebrightenings resembles that of regular outbursts with short quiescence intervals in between, but with an abrupt end after 40 days. The observations of the source MASTER J211258.65+242145.4 (hereafter MASTER J211258) show almost the same brightness variation, also seem to reach the quiescence level (level after the end of the rebrightenings), but no quiescence intervals. The rebrightenings in QZ Lib (ASAS J1536) do not seem to come down to the quiescence level. Such a feature shows more clearly in the better observed EZ Lyn (SDSS J0804). The light curve for WZ Sge an even smaller rebrightening amplitude can be seen, the luminosity again not coming down to the later quiescence level. In all these examples the peak luminosity appeared to reach that at the beginning of the steep decline before the end of the superoutburst. In stark contrast to these observations the mini-rebrightenings of V585 Lyr (Kato and Osaki 2013) show luminosity changes of small amplitude at nearly the quiescence level (Fig.1). Such variations had never been documented before.
In Table 1 we list sources with a relatively good documentation of multiple rebrightenings: The number of rebrightenings (for some sources only an estimate), the derived average duration of one individual rebrightening and the average brightness variation during the rebrightening phase. The amplitude of the individual brightness change varies somewhat during the rebrightening phase. Our average values should only be taken as typical values for the objects. For MASTER J211258 it seemed more probable that only 7 rebrightenings happened (compared to 8 rebrightenings sometimes listed in the literature). For OT J012059.6+325545 (hereafter OT J0120) where apparently not all minima were clearly documented (Kato et al. 2012, Fig. 52) we took =1. With respect to the different appearance of the rebrightenings of EZ Lyn in 2006 and 2010, and similar behavior for other sources, we note that in the model of magnetic field produced viscosity this feature could be attributed to the stochastic nature of the dynamo process. The mini-rebrightenings of V585 Lyr occur on a very short timescale.
| Object | Year | Ref. | |||
|---|---|---|---|---|---|
| [d] | [mag] | ||||
| DY CMi (OT J0747) | 2008 | 6 | 4.7 | 2.9 | 1 |
| EG Cnc | 1996 | 6 | 7.3 | 3.3 | 2 |
| VX For | 2009 | 5 | 4.5 | 2.9 | 3 |
| QZ Lib (ASAS J1536) | 2004 | 4 | 5.5 | 2.8 | 1 |
| EZ Lyn (SDSS J0804) | 2006 | 11 | 2.7 | 1.6 | 4 |
| EZ Lyn (SDSS J0804) | 2010 | 6 | 4.9 | 2.5 | 5 |
| V585 Lyr | 2010 | 9 | 0.5 | 0.4 | 6 |
| WZ Sge | 2001 | 12 | 2.1 | 1.2 | 1 |
| OT J0120 | 2010 | 9 | 1.9 | 1.0 | 7 |
| MASTER J211258 | 2012 | 7 | 4.7 | 2.6 | 8 |
number of rebrightenings
and average values of duration of the
rebrightenings and brightness variation
References:(1) Kato et al. (2009), (2) Patterson et
al. (2002), (3) Kato et al. (2010), (4) Kato et al. (2009a), (5) Pavlenko et al. (2007), (6) Kato and
Osaki (2013), (7) Kato et al. (2012), (8) Nakata et al. (2013)
5 Rebrightenings: Transitions between hot and cold state
We interpret the appearance of rebrightenings as due to enhanced viscosity possibly caused by the continuous dynamo action during the long superoutburst.
For standard viscosity values =0.2, =0.05 (Fig.3, upper panel) the critical lines and are far apart, the inward moving cooling wave never reaches , and the whole disk becomes cool and enters into quiescence.
For increased viscosity values =0.4, =0.2 (Fig.3, lower panel) however and are closer together, the cooling front at some inner point reaches and is reflected as an outward propagating heating wave, which results in the rebrightening of the disk. When this heating wave has reached the outer edge of the disk, where the surface density distribution peters out to values below (here taken as the 3:1 resonance radius) it is reflected as a cooling wave. At this moment (almost) the whole disk is in hot state and the brightness is at its maximum. Where exactly the reflection point lies depends on how the angular momentum loss by the 3:1 resonance is distributed and would require detailed modeling to be determined. The whole process then can repeat.
But we note that to model the observed rebrightenings with the approximately same brightness maximum during the repetitions a part of the disk has to be in a quasi-stationary state, modulated by the repeated rebrightening and requiring a continuous mass inflow from the outermost regions. This seems plausible due to the storage of matter beyond the 3:1 resonance radius (Osaki et al. 2001). Hellier (2001) has pointed out the large extension and the eccentricity of the accretion disk in EG Cnc and that the enhanced angular momentum transport from the 3:1 resonance ensures an enhanced mass flow into the inner disk for the entire period of the superoutburst and consecutive rebrightenings, documented by the persistent superhumps. The eccentricity important for the inflow of matter would not lead to dynamo action since the temperature increase involved appears too low. (A simple estimate of the effective temperature resulting from the standard viscous transport of mass and the additional heating by the tidal transfer of angular momentum yields , with mass transfer rate in units of g/s, resonance radius in units of cm and an assumed concentration of the effective dissipation region to 1/10 of the radius.)
Our model interprets the repeated rebrightenings as the multiple reflections of transition waves in the outer disk area, while an inner part of the disk remains in the hot state. Dependent on at which disk radius the reflection of the cooling wave occurs the extension of the inner hot region is smaller or larger, resulting in a lower or higher luminosity at minimum.
The light curves of superoutbursts show at first a gradual decrease when the whole disk is still hot, then a steep decline when the surface density has decreased to and the cooling front propagates inward decreasing the extent of the still hot region. The luminosity when the steep decline begins is the same as the maximum luminosity during rebrightenings. In our computation the luminosity decrease, from erg/s (completely hot disk) to erg/s (a still hot inner part at cm) (the minimum during rebrightening), that is the transition of the outer part to the cool state, occurs within 2.1 days. The heating wave which leads to the luminosity increase during the rebrightening propagates faster, the change occurs within less than 1 day. Such brightness changes of almost 2 magnitudes with a repetition time of 2-3 days would be typical for observed rebrightenings.
The enhanced viscosities used in our example for rebrightenings (present after the long superoutburst) seem in agreement with the picture of the magnetic origin of the viscosity discussed in Sect.3.
With this in mind we distinguish the following types of rebrightening:
-
•
type a: The cooling wave can propagate (almost) to the inner edge, therefore the luminosity is almost as low as in quiescence. This is similar to ordinary dwarf nova outbursts, except the shorter outburst and the existence of a very short (or no) quiescence.
-
•
type b: If the critical value is reached early by the cooling wave, a larger inner disk stays hot, consequently the amplitude of brightness variation is smaller. The quiescence luminosity, i.e. the luminosity of a completely cool disk, is not reached.
These different types are visible in the examples in Fig.4. The rebrightenings in EG Cnc (1996/1997) show very short quiescence intervals, type a. In MASTER J211258 (2012) only variations up and down are visible, probably without quiescence, so a marginal type a. In the light curve of ASAS J1536 (2004) the minimum luminosity of the rebrightenings seems to be higher than the quiescence level. In the following example, SDSS J0804, the brightness minimum is above the quiescence level, at least during the early rebrightenings. Clearly visible is this effect for WZ Sge , (and is also the case for the light curve of OT J0120 (Kato et al. 2012), not shown here), all examples type b.
Another pattern appears in V585 Lyr (Fig.1), which stands out in a much more rapid and low amplitude brightness variation in a nearly quiescent disk. We come back to this case in the following section.

In these examples of rebrightening, if sufficiently resolved, one can recognize the more rapid brightness increase and the slower brightness decrease, a sign of the faster moving heating waves and the more slowly moving cooling waves. The same pattern is present in the rise and decline of regular dwarf nova outbursts (e.g. in recent Kepler light curves, Cannizzo et al. 2012).
Fig.5 shows a relation between and (listed in Table 1). In our interpretation is the time needed for the transition waves to propagate through that region of the disk which changes back and forth between the hot and cool state, a larger brightness variation and a longer time for a larger region. (For EG Cnc, which has short quiescent intervals in between the rebrightenings, one should subtract these quiescent times, when determining as indicated by the arrow.) The proportionality of and suggests that the transition wave velocities in all these rebrightenings are about the same, as theory predicts, supporting this interpretation.
6 The mini-rebrightenings
Kato and Osaki (2013) found and discussed a new feature in the Kepler observations of the superoutburst of V585 Lyr, repetitive semi-periodic brightness variations of 0.4-0.5 mag, with a period of 0.5d, lasting for about 4 days, as shown in Fig.1. As the authors pointed out the origin of these mini-rebrightenings is not clear. How can such short-time brightness variations come about? Besides their rapid oscillations these mini-rebrightenings are also peculiar in their low brightness and small amplitude variation.
Already during early dwarf nova outburst modeling Mineshige and Osaki (1985) for constant viscosity values =, and close together, had found small amplitude continuous luminosity variations (one fluctuation lasting 4 days), where the inner part of the disk remains in hot state, the outer part in cold state, and the transition fronts travel back and forth in an in-between unstable region, never turning the disk completely hot or cold. For the thermal instability of accretion disks in galactic nuclei Mineshige and Shields (1990) similarly found fast small variations in the V-magnitude, called “purr” outbursts, using a viscosity description with critical surface density values close together, log() - log() = 0.25 (see their Fig. 2). They described these variations as ’caused by heating and cooling fronts which rapidly traverse back and forth across the unstable zone’. In both these investigations an inner part of the disk remains always hot, which results in a luminosity minimum higher than the quiescence value.
If this picture should also be applicable to mini-rebrightenings the very short duration of their individual brightening together with the velocity of transition waves requires a very small width of the unstable region. As the mass flow rate in the cold and in the hot state at the two boundaries would be approximately the same this translates into a very small difference between the two critical values and . In our case this would require even significantly larger than , an implausible choice of viscosity. If such a change between a hot and a cold state is excluded the question arises whether the mini-rebrightening phenomenon could be caused by a small limit cycle in the cold state alone. This seems possible.
6.1 ’Wiggles’ in the thermal equilibrium curve
We here consider whether the mini-rebrightenings can be due a negative slope in a small part in the cold optically thick region of the thermal equilibrium curve, causing a small limit cycle. The appearance of a ’wiggle’ in the lower part of the S-shaped equilibrium curve as shown in Fig.6 can lead to small amplitude brightness variations near the quiescent level. This is a similar limit-cycle behavior as during the large cycle between hot and cold state, responsible for a dwarf nova outburst, but at much lower temperatures, with transition waves mediating the changes between the two states. The velocity of transition waves is of the order of the sound velocity multiplied by an value, leading to a small difference between heating and cooling wave velocity, and to a marginally faster rise and a slower decline of brightness. Indeed in the mini-rebrightenings of V585 Lyr such a pattern might be marginally indicated. It is perhaps interesting that the data for mini-rebrightening duration and brightness variation of V585 Lyr lie on the correlation track for regular rebrightenings shown in Fig.5. But this needs further evaluation.
To find out whether wiggles can cause the mini-rebrightenings it has to be clarified, (1) under which conditions wiggles (with an unstable negative slope) are present in the equilibrium curve, and (2) how the initiated small limit cycles show up in the light curve.
Wiggles are indicated in a number of vertical structure computations. Cannizzo and Wheeler (1984) had found wiggles already in their early work (see their Fig.11). They discussed in detail how a non-monotonic relation between effective temperature and surface density can result from an opacity decrease at T 6000-7000K and the onset of convection. The thermal equilibrium curve of Mineshige and Osaki (1985, their Fig.2) clearly has a wiggle around the effective temperature log 3.6. The effect of different low temperature opacities on the shape of the equilibrium curve was also discussed by Meyer-Hofmeister (1987, Fig.1). The treatment of convection influences the vertical structure. Besides the choice of the standard mixing-length parameter especially the way of limiting the mixing-length itself near the midplane where the pressure scale height formally becomes infinite can lead to the appearance of an unstable part in the low temperature optically thick equilibrium curve Ludwig 1992, Ludwig et al. 1994).
In the investigation of the instability in galactic nuclei Mineshige and Shields (1990) found equilibrium curves with slight wiggles (see their Figs.1 and 2). Janiuk et al. (2004) mentioned the appearance of wiggles in equilibrium curves for stellar and galactic disks (their Figs.1 and 2). In the study of the disk instability models for AGN Hameury et al. (2009) also found equilibrium curves with wiggles (their Fig.1). They attributed their appearance to the partial dissociation of molecular hydrogen which influences the adiabatic gradient in convection.
Thus the shape of the equilibrium curve, especially a presence of wiggles, depends on the assumptions and approximations used to calculate the equilibrium curve, on the opacities used, on the parametrization of , on the treatment of convection and assumptions on the mixing length description. High resolution observations like the Kepler light curves of V344 Lyrae might allow to learn about the viscosity values from modeling the outburst behavior (Cannizzo et al. 2010).
6.2 The luminosity variation
An essential feature of the cold disk during all changes initiated by the unstable part is the long diffusion time of the cold disk. The diffusion time with Kepler frequency and scale height , white dwarf mass, for T=K, =cm and is 30 days. This means that during the mini-rebrightening phase of 5 days the surface density cannot change significantly. It also means that the rapid fluctuations in the unstable band have little effect on the surrounding stable areas and the luminosity variation is only due to the brightness variation in the unstable region. The variation there can be roughly estimated from its range in and the difference of brightness on the two stable branches of the wiggles.
When the calculated equilibrium curves at some distance show a wiggle with an unstable part it lies in a small range of values somewhat below the critical value , about the same for different values of , since both features occur at their fairly constant characteristic temperatures (compare the curves calculated by Mineshige and Shields for AGN, 1990). In a - diagram then the surface density values for which wiggles appear lie in a band, roughly parallel to .
Model computations give a shape of the surface density distribution left over by the inward propagating cooling wave in outburst decline, a ’common’ shape present in outburst computations for different parameters (an example in our Fig.3, top panel). In order that a mini-rebrightening phenomenon appears this left over surface density must reach the wiggle band, but not overshoot too much, otherwise it would also reach and we would have the case of standard rebrightening. If the wiggle band and the line lie close together this means that the left over density distribution should pass nearly tangentially through the wiggle band and therefore in a somewhat extended region of . Thus one expects that the brightness variations occur in a range roughly of order .
The expected surface brightness variation follows from the difference between on the two stable branches of the wiggles which we take here as about a factor of 1.6 (see the calculated curves referred to above). We note there is almost no change in mass flow rate, only the temperature changes between higher and lower values.
The region of extension around cm (the ’tangential’ point) with an effective temperature of K radiates a bolometric luminosity == erg/s (both sides of the disk), Stefan-Boltzman constant. A bolometric correction of 0.4 magnitude leads to a visual luminosity of about erg/s. By this amount the light would fluctuate.
In order to obtain the corresponding variation in magnitude we need the luminosity of the whole accretion disk in the beginning quiescence. As the distance to V585 Lyr is not known we cannot use the observed apparent magnitude to get the absolute visual luminosity from the observations. Thus for comparison we give here only some values from model calculations for post outburst luminosity in some cataclysmic variables. In the model computations of Meyer and Meyer-Hofmeister (1984) the distribution of the bolometric luminosity in the cold disk after outburst decline is shown, with a luminosity of erg/s for a disk size of cm, and visual luminosities of the total disk in the range of erg/s for OY Car, and erg/s for U Gem. Typical values found by Mineshige and Osaki (1985) for a relatively large disk are = to erg/s). A brightness variation of half a magnitude as observed for V585 Lyr would correspond to a visual luminosity of erg/s and lie within this very wide range.
6.3 Repetition rate of the mini-rebrightenings
The mini-rebrightenings in Fig.1 repeat in about s. During this time the transition waves should have traveled back and forth through the unstable region, extending about cm. Taking their velocity as times the sound velocity, where is a mean value of parameters for vertical thermal relaxation and radial diffusion in the transition fronts, a sound speed of cm/s (T=K, neutral hydrogen), would be 0.2, a perhaps not unreasonable cold value after the long superoutburst.
These estimates for both, the amplitude and duration of the fluctuations, indicate that the appearance of wiggles could be a promising candidate for the understanding of mini-rebrightenings.
6.4 Mini-outbursts in V1504 Cygni
We mention here that the occurrence of a limit cycle smaller than the large cycle in standard outburst modeling, though not as small as discussed here for the mini-rebrightenings, was already suggested by Osaki and Kato (2014) for the explanation of ’mini-outbursts’, oubursts of small amplitude, found in the recent Kepler light curve of the SU Uma star V1504 Cygni appearing in the second half of a supercycle. In this model the structure of the accretion disk changes between the cold state and an intermediate warm state. Such an intermediate stable state can be seen in the thermal equilibrium curve computed by Mineshige and Osaki (1985, Fig.2). Osaki and Kato (2014) attributed the appearance of this feature to a possible additional heating by increased tidal interaction.
7 Discussion
7.1 The probability of occurrence of rebrightenings
One might ask, how often the superoutburst caused magnetic field structure leads to a viscosity enhancement that brings about rebrightenings. The observations tell us, that it is not a rare phenomenon: The first survey of superhumps of SU UMa stars by Kato et al. (2009) includes several hundred observations of SU UMa stars, of which 34 WZ Sge stars are listed. In 20 of those sources rebrightenings were found, about half of them multiple. This indicates that the viscosity after the superoutburst is frequently enhanced.
To obtain a full MHD picture of these derived features will require a global accretion disk simulation with high spatial and time resolution, not yet in reach.
7.2 A relation between superoutburst duration and viscosity enhancement ?
If during a long lasting superoutburst large-scale magnetic fields are generated and persist for longer time after the end of the superoutburst the ensuing viscosity enhancement stays on longer, leading to a larger number of rebrightenings. If the viscosity increase also becomes larger by the superposition of large-scale magnetic fields the reflection of the cooling wave occurs earlier and the region always staying hot becomes larger, i.e. the minimum brightness is larger.
Such a behavior would be expected predominantly in WZ Sge stars with long lasting outbursts. This is indeed true for the examples shown here: the longest rebrightening phase and a higher minimum brightness are found for WZ Sge itself.
8 Conclusions
Accretion disks with mass flow rates as usually present in cataclysmic variables can be in a hot or a cool state, corresponding to the high luminosity in a dwarf nova outburst and the low luminosity in quiescence. The change between hot and cool state is mediated by transition waves which propagate across the disk. In standard dwarf nova outbursts and in rebrightenings the steeper rise and the more slow decline of luminosity is a clear indication of faster moving heating waves and more slowly moving cooling waves.
We suggest that the various forms of rebrightening in SU UMa stars, occurring only after superoutburst, can be understood as the consequences of enhanced viscosities left over from the superoutburst. They affect the critical surface densities and and thereby the location and the range of the region where transition fronts move. This determines maximum luminosity, amplitude and duration of the individual rebrightening. Our modeling is based on simple computations of disk structure evolution, but allows to understand the consequences of the enhancement of viscosities following a superoutburst. Such an enhancement would be related to the long-time dynamo action during the superoutburst and could explain why rebrightenings only happen after superoutburst. The intrinsically stochastic nature of the produced magnetic field structure could also explain why one and the same system after different superoutbursts can show a different course of its rebrightenings. The magnetic origin of the disk viscosity is in general agreement with the now widely accepted magneto-rotational instability modeling.
We consider whether the mini-rebrightenings could also be understood due to a limit cycle, but this time caused by small S-shaped ’wiggles’ in the cool optically thick part of the thermal equilibrium curve. Without more detailed calculations of the outburst decline our estimates seem to indicate that the short period and the small amplitude of the mini-rebrightenings could be due to vthis instability. This would be further insight into a special feature of the thermal viscous accretion disk instability and will deserve more detailed investigation.
We thank Hans Ritter for many fruitful discussions and the referee for interesting, helpful comments.
References
- [1] Arai, A., Uemura, M., Sasada, M., Schmeer, P., & Miller, I. 2009, in The Pacific Rim Conference on Stellar Astrophysics, eds. B. Soonthornthum et al., ASP Conf. Ser., 404, 87
- [2] Balbus, S.A., & Hawley, J.F. 1991, ApJ, 376, 214
- [3] Brandenburg, A. 2000, in Dynamo and dynamics, a mathematical challenge, ed. P. Chossat, Nato ASI Ser., 26, 125
- [4] Buat-Ménard, V. & Hameury, J.-M. 2002, A&A 386, 891
- [5] Cannizzo, J.K. 1993, in Accretion Disks in Compact Stellar Systems, ed. J.C. Wheeler (World Scientific), 6
- [6] Cannizzo, J.K., & Wheeler, J.C. 1984, ApJS 55, 367
- [7] Cannizzo, J.K., Ghosh, P., & Wheeler, J.C. 1982, ApJ 260, 83
- [8] Cannizzo, J.K., Still, M.D., & Howell, S.B. et al. 2010, ApJ 725, 1393
- [9] Cannizzo, J.K., Smale, A.P., Wood, M.A. et al. 2012, ApJ 747, 117
- [10] Gammie, C.F., & Menou, K. 1998, ApJL 492, L75
- [11] Hellier, C. 2001, PASP 113, 469
- [12] Hameury, J.-M. 2000, New Astronomy Reviews 44, 15
- [13] Hameury, J.-M., Lasota, J.-P., & Warner, B. 2000, A&A 353, 244
- [14] Hameury, J.-M., Menou, K., Dubus, G. et al. 1998, MNRAS 298, 1048
- [15] Hameury, J.-M., Viallet, M., Lasota, J.-P. 2009, A&A 496, 413
- [16] Imada,A., Kubota, K., Kato, T. et al. 2006, PASJ 58, L23
- [17] Janiuk, A., Czerny, B., Siemiginowska, A. et al. 2004, ApJ 602, 595
- [18] Kato, T. & Osaki, Y. 2013, PASJ 65, 97
- [19] Kato, T. & Osaki, Y. 2014, PASJ 66, 150
- [20] Kato, T., Imada, A., Uemura, M. et al. 2009, PASJ 61, 395
- [21] Kato, T., Pavlenlo, E., Maehara, H. et al. 2009a, PASJ 61, 601
- [22] Kato, T., Maehara, H., Uemura, M. et al. 2010, PASJ 24, 1525
- [23] Kato, T., Maehara, H., Miller, I. et al. 2012, PASJ 64, 21
- [24] Kato, T., Hambsch, F.-J., Maehara, H. et al. 2013, PASJ 65, 23
- [25] Kato, T., Hambsch, F.-J., Maehara, H. et al. 2014, PASJ 66, 30
- [26] Ludwig, K. 1992, Diploma Thesis, Ludwig-Maximilians-Universität München, Germany
- [27] Ludwig, K. & Meyer. F. 1998, A&A 329, 559
- [28] Ludwig, K., Meyer-Hofmeister, E., & Ritter, H. 1994, A&A 290, 473
- [29] Meyer. F. 1984, A&A 131, 303
- [30] Meyer, F., & Meyer-Hofmeister, E. 1981, A&A 104, L10
- [31] Meyer, F., & Meyer-Hofmeister, E. 1984, A&A 132, 143
- [32] Meyer, F., & Meyer-Hofmeister, E. 1999, A&A 341, L23
- [33] Meyer-Hofmeister, E. 1987, A&A 175, 113
- [34] Meyer-Hofmeister, E., Meyer, F., & Liu, B.F. 1998, A&A 339, 507
- [35] Mineshige,S., & Osaki, Y. 1983, PASJ 35, 377
- [36] Mineshige,S., & Osaki, Y. 1985, PASJ 37, 1
- [37] Mineshige,S., & Shields, G.A. 1990, ApJ 351, 47
- [38] Mróz, P., Pietrukowicz, P., Poleski, R. et al. 2013, Acta Astron. 63, 135
- [39] Nakata,C., Ohshima, T., Kato et al. 2013, PASJ 65, 117
- [40] Osaki, Y. 1989, PASJ 41,1005
- [41] Osaki, Y. 1996, PASP 108,39
- [42] Osaki, Y., & Meyer, F. 2003, A&A 401, 325
- [43] Osaki, Y., & Meyer, F. 2004, A&A 428, L17
- [44] Osaki, Y., & Kato, T. 2014, PASJ 66, 150
- [45] Osaki, Y., Meyer, F. & Meyer-Hofmeister, E. 2001, A&A 370, 488
- [46] Park, K., 2014, arXiv:1403.1328
- [47] Patterson, J., Kemp, J., Skilman, D.R., et al. 1998, PASP 110, 1290
- [48] Patterson, J., Masi, G., Richmond, M.W. et al. 2002, PASJ 114, 721
- [49] Pavlenko, E., Shugarov, S. Yu, Katysheva, N.A. et al., 2007, in European Workshop on White Dwarfs, eds. R. Napiwotzki & M.R. Burleigh, ASP Conf. Ser., 372, 511
- [50] Shakura, N.I., & Sunyaev, R.A. 1973, A&A, 24, 337
- [51] Smak, J. 1982, Acta Astron. 32, 199
- [52] Smak, J. 1984, PASJ 96, 5
- [53] Smak, J. 1993, Acta Astron. 43, 101
- [54] Suzuki, T.K., & Inutsuka, S.-I. 2014, ApJ 784, 121
- [55] Viallet, M., & Hameury, J.-M. 2008, A&A 489, 699