Phase reconstruction of strong-field excited systems
by transient-absorption spectroscopy
Abstract
We study the evolution of a V-type three-level system, whose two resonances are coherently excited and coupled by two ultrashort laser pump and probe pulses, separated by a varying time delay. We relate the quantum dynamics of the excited multi-level system to the absorption spectrum of the transmitted probe pulse. In particular, by analyzing the quantum evolution of the system, we interpret how atomic phases are differently encoded in the time-delay-dependent spectral absorption profiles when the pump pulse either precedes or follows the probe pulse. We experimentally apply this scheme to atomic Rb, whose fine-structure-split and transitions are driven by the combined action of a pump pulse of variable intensity and a delayed probe pulse. The provided understanding of the relationship between quantum phases and absorption spectra represents an important step towards full time-dependent phase reconstruction (quantum holography) of bound-state wave-packets in strong-field light-matter interactions with atoms, molecules and solids.
- PACS numbers
-
32.80.Qk, 32.80.Wr, 42.65.Re
A long-standing dream in the physics of light-matter interaction is the observation of the quantum dynamics of electrons bound in atoms and molecules Brabec and Krausz (2000); Krausz and Ivanov (2009); Leone et al. (2014). Traditional spectroscopy methods enable one to access the evolution of the amplitudes, related to the probability that a quantum system is in a given state. Much more demanding is the extraction of the associated quantum phases.
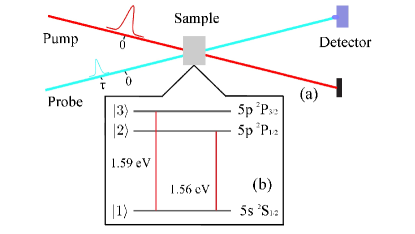
With the development of femtosecond and attosecond laser pulses, transient-absorption spectroscopy (TAS) has emerged as a powerful method to gain amplitude and phase information on the evolution of a quantum system Mathies et al. (1988); Pollard and Mathies (1992); Loh et al. (2007); Wang et al. (2010); Goulielmakis et al. (2010); Holler et al. (2011). In such pump-probe geometry [Fig. 1(a)], a short pump pulse of tunable intensity excites a quantum system, whose ensuing dynamical evolution is measured by a weak probe pulse. The absorption spectrum of the transmitted field results from the interference of the incoming probe pulse with the electric field emitted by the system Fano and Cooper (1968). Since this interference pattern depends on the state of the system at the arrival of the probe pulse, its quantum-mechanical evolution can be time resolved by modifying the inter-pulse delay. Furthermore, in contrast to most strong-field studies relying on the ionization of the system Kienberger et al. (2003); Mauritsson et al. (2010), TAS enables direct access to bound-state dynamics.
Very recently, experiments started to investigate the absorption spectrum of a probe pulse which excites a coherent superposition of quantum states and is followed by a strong laser field Wang et al. (2010); Chen et al. (2012); Kaldun et al. (2014). For nonautoionizing bound states, in the absence of this subsequent pulse, well known symmetric Lorentzian line shapes are observed. However, an additional strong pulse can be employed to nonlinearly drive the state generated by the probe field, thus manipulating the absorption lines into, e.g., asymmetric Fano-like shapes Fano (1961); Ott et al. (2013); Heeg et al. (2014). Although this method opens interesting prospects for line-shape quantum control Cavaletto et al. (2014); Liu et al. (2014), it still remains an open question how phase information is encoded in the time-delay-dependent strong-field absorption spectrum.
Here, we investigate theoretically and experimentally the phase information which can be extracted from transient-absorption spectra for both above-mentioned scenarios, i.e., when the dynamics are either triggered or modified by an intense pump pulse. We use the V-type three-level scheme depicted in Fig. 1(b) to describe an ensemble of Rb atoms, with fine-structure-split excited states. From the ground state, the single-electron transitions ( at ) and ( at ) are excited by fs-duration pump/probe optical pulses centered at and separated by a time delay . We focus on the oscillations in exhibited by the absorption spectrum Netz et al. (2002) and show how these oscillating features differently encode the information on the intensity-dependent atomic phases for positive and negative time delays.
The atomic system is described by the density matrix Scully and Zubairy (1997), of elements , . An off-diagonal element , , represents the coherence between states and , while a diagonal element quantifies the population of level at energy , with transition energies given by and . Here, atomic units are used unless otherwise stated. The probe pulse is centered at and is modeled by the classical field , with the unit polarization vector along the direction, the laser frequency , the initial phase , and the peak field strength related to the peak intensity and the fine-structure constant . The envelope function is modeled by , where is defined in terms of the Heaviside step function . Consequently, is nonvanishing in an interval of duration , with being the full width at half maximum of . Similarly, the pump pulse is modeled by , with initial phase , peak field strength , and peak intensity . The pump pulse is centered at , such that it precedes the probe pulse for (pump-probe) and follows it for (probe-pump). Both linearly polarized pulses couple the ground state , with magnetic quantum number , to the two closely lying states and , also with Foot (2005). For the pulse intensities used, we consider only electric-dipole-(-)allowed transitions with , for which the dipole-moment matrix elements are , , with Netz et al. (2002); Johnson (2007). This allows us to introduce the two complex, time-dependent Rabi frequencies , such that .
The atomic system is initially in its ground state, i.e., , with the Kronecker symbol . The dynamical evolution of the system results from the Liouville–von Neumann equation , with and Scully and Zubairy (1997). Here, is the electronic-structure Hamiltonian, with ladder operators , while is the -light-matter-interaction Hamiltonian in the rotating-wave approximation. The diagonal matrix has elements , with and . These decay rates are much larger than the spontaneous decay rates of the system and effectively account for broadening effects at work in the experiment.
The measured optical-density (OD) absorption spectrum is given by , where and are the spectral intensities of the incoming and transmitted probe pulse, respectively. The absorption spectrum is related to the single-particle dipole response of the system, i.e., the evolution of the atomic coherences and , via Fano and Cooper (1968)
| (1) |
with Fourier transforms centered at the arrival time of the probe pulse. In the presence of a single pulse, the system, excited at into the state , decays with time-dependent coherences , giving rise [Eq. (1)] to stationary lines centered on the transition energies and , with linewidths given by the decay rates and , respectively. However, if two pulses are used, the coherences become explicitly time-delay-dependent, implying a modulation in of intensity and shape of the spectral lines. Although rapid oscillations in characterize the absorption spectrum in Eq. (1), these fast oscillating features are averaged out for the noncollinear experimental geometry in Fig. 1(a). We include this effect in our model via convolution of the spectrum in Eq. (1) with a normalized Gaussian function of width , thus obtaining
| (2) |
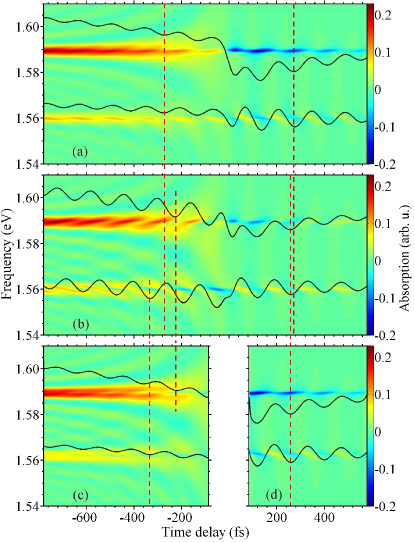
In order to investigate the intensity-dependent phase information which can be extracted from , in Fig. 2 we compare numerical calculations of Eq. (2) for a probe intensity of and different pump intensities. As shown in Fig. 2(a) for a peak intensity of , the spectrum consists of two lines centered on the -allowed-transition energies and . Furthermore, for both positive and negative time delays, amplitude and shape of the two absorption lines oscillate in , with a periodicity determined by the beating frequency and a discontinuity across , where the pulses overlap. The black lines in Fig. 2(a) highlight this behavior, by displaying and evaluated at the atomic transition energies. Absorption strengths are shown in arbitrary units, as they depend on the gas pressure in the cell, which is not included in the simulation.
Figure 2(b) displays analogous features for a pump intensity of . Here, however, different phases of the time-delay-dependent oscillations can be recognized. This is apparent from the time delays at which and exhibit, e.g., their minima, as highlighted by the red, dashed lines. For , these minima are aligned both in Fig. 2(a) and 2(b), although a common phase shift can be distinguished. In contrast, for , the minima are aligned in Fig. 2(a), while in Fig. 2(b) they appear shifted towards opposite directions as a consequence of the larger pump intensity. The different behavior displayed at positive and negative delays reflects the different excitation sequence undergone by the system. While at the pump pulse generates the initial coherences, for it strongly modifies the coherent superposition of states generated by the probe pulse.
In Figs. 2(c) and 2(d) we show that the phase of the oscillations in encodes the key information about the intensity-dependent phases of the atomic system. In both panels, a pump intensity of is used as in Fig. 2(a). Here, however, we modify the phases of the atomic system by artificially transforming the density matrix —describing the state of the system at immediately after the interaction with the pump pulse—into
| (3) |
The usual equations of motion are employed to calculate the subsequent dynamics of the system. In Eq. (3), is a diagonal matrix of elements , with , while and represent shifts in the phase of levels and , respectively, such that .
These artificial shifts effectively model phase changes undergone by the system at varying pump intensities, to which the time-delay-dependent absorption spectra are sensitive. For instance, in Fig. 2(c), each is set equal to the difference between the phase changes caused by a pump intensity of [Fig. 2(b)] and of [Fig. 2(a)], which can be extracted from the corresponding dynamics of the density matrix. The resulting absorption spectrum features time-delay-dependent oscillations with the same amplitudes as in Fig. 2(a), but whose phases are now equal to those displayed in Fig. 2(b). An analogous procedure is applied in Fig. 2(d) for positive time delays, with new phases .
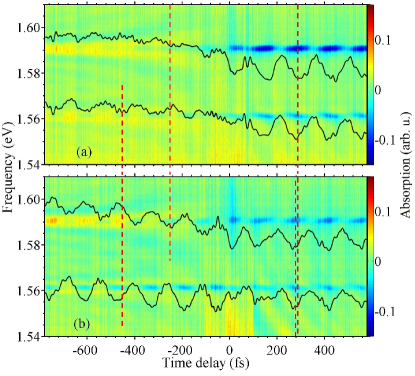
In order to test the relation between intensity-dependent atomic phases and time-delay-dependent absorption spectra, in Fig. 3 we show results from the experimental measurement of the OD absorption spectrum of a probe pulse transmitted through an ensemble of Rb atoms. A Ti:Sapphire laser is utilized, with a repetition rate of , pulse energy of , FWHM of , and central wavelength of . The laser beam is split by a spatial mask with two irises into two beams, which are used as probe and pump beams in Fig. 1(a). A delay line is included into the pump beam path by means of a piezo translation stage at close-to-normal incidence, allowing one to scan the time delay between the two pulses. Rb vapor is supplied in a cell with length, which is heated to by a home-made heating and control system. Using the known vapor pressure of Rb, the atomic density is estimated to be . The pump and probe pulses, with beam sizes of and , respectively, are focused by a concave mirror with a focusing length of . After passing through the sample, the probe beam is picked up by an identical concave mirror and coupled into a fiber-pigtailed spectrometer (Ocean Optics, USB2000+). The probe pulse has an intensity of , and Figs. 3(a) and 3(b) show experimental results for a pump intensity of and , respectively. The absorption lines at each resonance are broadened to a measurable width as a result of Doppler and collision-induced pressure broadening, as well as additional broadening in the nanosecond pedestal of the femtosecond pulses. For low pump intensities [Fig. 3(a)], at , the small amplitude of the oscillations in renders the associated phases not straightforwardly extractable. Apart from that, the experimental results are in good agreement with the theoretical predictions from Fig. 2, showing analogous intensity-dependent phase shifts in the oscillating features of the absorption spectra.
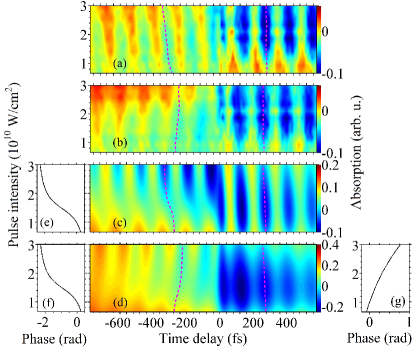
Finally, we focus on the dependence of phase effects upon the intensity of the pump pulse. Figures 4(a) and 4(b) display the experimental absorption spectra and at the transition energies and , respectively, for varying pump intensities. These measurement results quantify intensity-dependent shifts in the phase of the time-delay-dependent spectra, which are in good agreement with the theoretical predictions in Figs. 4(c) and 4(d) and confirm the observations from Figs. 2 and 3.
The experimentally observable phase properties displayed by and reflect the different physical mechanisms acting at negative and positive time delays. This is further analyzed by implementing the artificial-phase method introduced in Eq. (3) to reproduce intensity-dependent phase effects. For , the pump pulse strongly modifies the excited state generated at by the probe pulse. The intensity-dependent phases of the oscillations in featured in Figs. 4(c) and 4(d) enable one to quantify the shifts in the phase of the atomic coherences ensuing from the interaction with strong pump pulses of varying intensity, as captured by and in Figs. 4(e) and 4(f), respectively. In contrast, for , the pump pulse is responsible for the initial excitation of the system. The parallel shift undergone by and at increasing pump intensities [Figs. 4(c) and 4(d)] is therefore a consequence of the dependence of the initial coherences—and their relative phase—upon the intensity of the pump pulse. Artificial phases can be used to effectively reproduce this behavior. In this case, however, the phases of the resulting spectra and are identically affected only by the phase difference , which is shown in Fig. 4(g) for .
In conclusion, we have used a V-type three-level system to investigate strong-field-induced phase effects in transient-absorption spectra for both positive and negative time delays and for pump pulses of variable intensity. Furthermore, we have developed an artificial-phase method to interpret time-delay-dependent absorption spectra and relate them to the phase evolution and intensity dependence of atomic quantum coherences. Although this method was here introduced to analyze intensity-dependent phase effects, the level-specific phases could also be employed to model additional interactions of the atomic system with external fields selectively modifying the two excited states. Understanding the phase-sensitive link between quantum dynamics and transient-absorption spectra represents an essential step towards the application of TAS to the extraction of quantum phases in bound-state atomic systems interacting with strong-field pulses and to sensitive tests of quantum-dynamics theory.
Acknowledgements.
The authors acknowledge support from the Max-Planck Research Group program and the DFG (grant PF790/1-1). Z. Liu acknowledges the scholarship award for excellent doctoral students granted by the Ministry of Education of China.References
- Brabec and Krausz (2000) T. Brabec and F. Krausz, “Intense few-cycle laser fields: Frontiers of nonlinear optics,” Rev. Mod. Phys. 72, 545–591 (2000).
- Krausz and Ivanov (2009) F. Krausz and M. Ivanov, “Attosecond physics,” Rev. Mod. Phys. 81, 163–234 (2009).
- Leone et al. (2014) S. R. Leone, C. W. McCurdy, J. Burgdorfer, L. S. Cederbaum, Z. Chang, N. Dudovich, J. Feist, C. H. Greene, M. Ivanov, R. Kienberger, U. Keller, M. F. Kling, Z.-H. Loh, T. Pfeifer, A. N. Pfeiffer, R. Santra, K. Schafer, A. Stolow, U. Thumm, and M. J. J. Vrakking, “What will it take to observe processes in ‘real time’?” Nature Photonics 8, 162 (2014).
- Mathies et al. (1988) R. A. Mathies, C. H. Brito Cruz, W. T. Pollard, and C. V. Shank, “Direct observation of the femtosecond excited-state cis-trans isomerization in bacteriorhodopsin,” Science 240, 777–779 (1988).
- Pollard and Mathies (1992) W. T. Pollard and R. A. Mathies, “Analysis of femtosecond dynamic absorption spectra of nonstationary states,” Annu. Rev. Phys. Chem. 43, 497–523 (1992).
- Loh et al. (2007) Z.-H. Loh, M. Khalil, R. E. Correa, R. Santra, C. Buth, and S. R. Leone, “Quantum state-resolved probing of strong-field-ionized xenon atoms using femtosecond high-order harmonic transient absorption spectroscopy,” Phys. Rev. Lett. 98, 143601 (2007).
- Wang et al. (2010) H. Wang, M. Chini, S. Chen, C.-H. Zhang, F. He, Y. Cheng, Y. Wu, U. Thumm, and Z. Chang, “Attosecond time-resolved autoionization of argon,” Phys. Rev. Lett. 105, 143002 (2010).
- Goulielmakis et al. (2010) E. Goulielmakis, Z.-H. Loh, A. Wirth, R. Santra, N. Rohringer, V. S. Yakovlev, S. Zherebtsov, T. Pfeifer, A. M. Azzeer, M. F. Kling, S. R. Leone, and F. Krausz, “Real-time observation of valence electron motion,” Nature 466, 739–743 (2010).
- Holler et al. (2011) M. Holler, F. Schapper, L. Gallmann, and U. Keller, “Attosecond electron wave-packet interference observed by transient absorption,” Phys. Rev. Lett. 106, 123601 (2011).
- Fano and Cooper (1968) U. Fano and J. W. Cooper, “Spectral distribution of atomic oscillator strengths,” Rev. Mod. Phys. 40, 441–507 (1968).
- Kienberger et al. (2003) R. Kienberger, E. Goulielmakis, M. Uiberacker, A. Baltuska, V. Yakovlev, F. Bammer, A. Scrinzi, Th. Westerwalbesloh, U. Kleineberg, U. Heinzmann, M. Drescher, and F. Krausz, “Atomic transient recorder,” Nature 427, 817–821 (2003).
- Mauritsson et al. (2010) J. Mauritsson, T. Remetter, M. Swoboda, K. Klünder, A. L’Huillier, K. J. Schafer, O. Ghafur, F. Kelkensberg, W. Siu, P. Johnsson, M. J. J. Vrakking, I. Znakovskaya, T. Uphues, S. Zherebtsov, M. F. Kling, F. Lépine, E. Benedetti, F. Ferrari, G. Sansone, and M. Nisoli, “Attosecond electron spectroscopy using a novel interferometric pump-probe technique,” Phys. Rev. Lett. 105, 053001 (2010).
- Chen et al. (2012) S. Chen, M. J. Bell, A. R. Beck, H. Mashiko, M. Wu, A. N. Pfeiffer, M. B. Gaarde, D. M. Neumark, S. R. Leone, and K. J. Schafer, “Light-induced states in attosecond transient absorption spectra of laser-dressed helium,” Phys. Rev. A 86, 063408 (2012).
- Kaldun et al. (2014) A. Kaldun, C. Ott, A. Blättermann, M. Laux, K. Meyer, T. Ding, A. Fischer, and T. Pfeifer, “Extracting phase and amplitude modifications of laser-coupled Fano resonances,” Phys. Rev. Lett. 112, 103001 (2014).
- Fano (1961) U. Fano, “Effects of configuration interaction on intensities and phase shifts,” Phys. Rev. 124, 1866–1878 (1961).
- Ott et al. (2013) C. Ott, A. Kaldun, P. Raith, K. Meyer, M. Laux, J. Evers, C. H. Keitel, C. H. Greene, and T. Pfeifer, “Lorentz meets Fano in spectral line shapes: A universal phase and its laser control,” Science 340, 716–720 (2013).
- Heeg et al. (2014) K. P. Heeg, C. Ott, D. Schumacher, H.-C. Wille, R. Röhlsberger, T. Pfeifer, and J. Evers, “Two-dimensional spectral interpretation of time-dependent absorption near laser-coupled resonances,” http://arxiv.org/abs/1411.1545 (2014).
- Cavaletto et al. (2014) S. M. Cavaletto, Z. Harman, C. Ott, C. Buth, T. Pfeifer, and C. H. Keitel, “Broadband high-resolution x-ray frequency combs,” Nature Photonics 8, 520 (2014).
- Liu et al. (2014) Z. Liu, C. Ott, S. M. Cavaletto, Z. Harman, C. H. Keitel, and T. Pfeifer, “Generation of high-frequency combs locked to atomic resonances by quantum phase modulation,” New J. Phys. 16, 093005 (2014).
- Netz et al. (2002) R. Netz, T. Feurer, G. Roberts, and R. Sauerbrey, “Coherent population dynamics of a three-level atom in spacetime,” Phys. Rev. A 65, 043406 (2002).
- Scully and Zubairy (1997) M. O. Scully and M. S. Zubairy, Quantum Optics (Cambridge University Press, Cambridge, 1997).
- Foot (2005) C. J. Foot, Atomic Physics (Oxford University Press, Oxford, 2005).
- Johnson (2007) W. R. Johnson, Atomic Structure Theory: Lectures on Atomic Physics (Springer, Berlin Heidelberg, New York, 2007).