Comparative study of the two versions of the Microsoft KinectTM sensor in regard to the analysis of human motion
Abstract
The present paper is part of a broader programme, exploring the possibility of involving the Microsoft KinectTM sensor in the analysis of human motion. In this study, the output obtained from the two
available versions of this sensor is critically examined. We demonstrate that the two outputs differ in regard to the variation of the physical quantities involved in the modelling of the human motion. As the original sensor
has been found unsuitable for applications requiring high precision, the observed differences in the output of the two sensors call for the validation of the upgraded sensor on the basis of a marker-based system.
PACS: 87.85.gj; 07.07.Df
keywords:
Biomechanics, motion analysis, treadmill, Kinect,
∗E-mail: evangelos[DOT]matsinos[AT]zhaw[DOT]ch, evangelos[DOT]matsinos[AT]sunrise[DOT]ch
1 Introduction
Microsoft KinectTM (hereafter, simply ‘Kinect’) [1], a low-cost, portable motion-sensing hardware device, was developed by the Microsoft Corporation (Microsoft, USA) as an accessory to the Xbox video-game console (2010). The sensor is a webcamera-type, add-on peripheral device, enabling the operation of Xbox via gestures and spoken commands. In 2011, Microsoft released the software-development kit (SDK) for Kinect, thus enabling the development of applications in several standard programming languages. The first upgrade of the sensor (‘Kinect for Windows v2’), both hardware- and software-wise, tailored to the needs of Xbox One, became available (in July 2014) for general development and use. The present paper is part of our research programme, aiming at investigating the possibility of involving either of the Kinect sensors in the analysis of motion data of subjects walking or running ‘in place’ (e.g., on commercially-available treadmills). If successful, Kinect could become an interesting alternative to marker-based systems (MBSs) in capturing data for motion analysis, one with an incontestably high benefit-to-cost ratio.
It is rather surprising that only one study, addressing the possibility of involving Kinect in the analysis of walking and running motion (i.e., not in a static mode or in slow motion), has appeared so far [2]. Using similar methodology to the one followed herein, the authors in that study came to the conclusion that the original sensor is unsuitable for applications requiring high precision. Of course, it remains to be seen whether any improvement in the overall quality of the output can be obtained with the upgraded sensor. The present study investigates the similarity of the output of the two sensors; in case of significant differences, the validation of the upgraded sensor, on the basis of a marker-based system (MBS), would be called for.
The detailed description of the methodology we follow herein may be found in Ref. [3]; we will refer to that paper whenever necessary. The present paper has been organised in five sections. In Section 2, we provide a short description of the hardware used in our study and give a summary of our methodology in the analysis of the human-motion data. In Section 3, we give details on the experimental part of the study. The results, obtained from the analysis of the data of Section 3, are presented in Section 4. We discuss the main conclusions of the paper in the last section.
2 Data acquisition and analysis
2.1 The Kinect sensors
In the original sensor, the skeletal data (‘stick figure’) of the output comprises time series of three-dimensional (3D) vectors of spatial coordinates, i.e., measurements of the (,,) coordinates of the nodes which the sensor associates with the axial and appendicular parts of the human skeleton. In coronal (frontal) view of the subject (sensor view), the Kinect coordinate system is defined with the axis (medial-lateral) pointing to the left (i.e., to the right part of the body of the subject being viewed), the axis (vertical) upwards, and the axis (anterior-posterior) away from the sensor.
The nodes to are main-body nodes, identified as HIP_CENTER, SPINE, SHOULDER_CENTER, and HEAD. The nodes to relate to the left arm: SHOULDER_LEFT, ELBOW_LEFT, WRIST_LEFT, and HAND_LEFT; similarly, the nodes to on the right arm are: SHOULDER_RIGHT, ELBOW_RIGHT, WRIST_RIGHT, and HAND_RIGHT. The eight remaining nodes pertain to the legs, the first four to the left (HIP_LEFT, KNEE_LEFT, ANKLE_LEFT, and FOOT_LEFT), the remaining four to the subject’s right (HIP_RIGHT, KNEE_RIGHT, ANKLE_RIGHT, and FOOT_RIGHT) leg 111The subject’s left and right parts refer to what the subject perceives as the left and right parts of his/her body..
In the upgraded sensor, some modifications have been made in the naming (and placement) of some nodes. The original node HIP_CENTER has been replaced by SPINE_BASE (and appears slightly shifted downwards); the original node SPINE has been replaced by SPINE_MID (and appears slightly shifted upwards); finally, the original node SHOULDER_CENTER has been replaced by NECK (and also appears slightly shifted upwards). Five new nodes have been appended at the end of the list, one of which is a body node (SPINE_SHOULDER, node ), whereas four nodes pertain to the subject’s hands, HAND_TIP_LEFT (), THUMB_LEFT (), HAND_TIP_RIGHT (), and THUMB_RIGHT ().
In both versions, parallel to the captured video image, Kinect acquires an infrared image; captured with a CCD camera, this infrared image enables the extraction of information on the depth . The sampling rate in the Kinect output (for the video and the skeletal data, for both versions of the sensor) is Hz.
2.2 Stray motion
The subject’s motion on the treadmill is split into two components: the motion of the subject’s ‘centre of mass’ (CM), which should be considered as one reference point, moving synchronously with the subject’s physical CM, and the motion of the subject’s body parts relative to the CM. The coordinates of the CM are extracted from the main-body, the shoulder, and the hip nodes. Prior to further processing, the CM offsets (,,) are removed from the data at all times; thus, the motion is defined relative to the subject’s CM. The largeness of the subject’s ‘stray’ motion on the treadmill is assessed on the basis of the root-mean-square (rms) of the distributions of , , and .
2.3 Period of the gait cycle
Ideally, the period of the gait cycle is defined as the time lapse between successive time instants corresponding to identical postures of the human body (position and direction of motion of the human-body parts with respect to the CM). (Of course, the application of ‘identicalness’ in living organisms is illusional; no two postures can ever be expected to be identical in the formal sense.) We define the period of the gait cycle as the time lapse between successive most distal positions of the same lower leg, which is identified herein as the ankle; one could also use the midpoints of the ankle and foot nodes, yet our past experience with the original sensor suggests caution with the foot nodes due to frequent artefacts, in particular in dorsal positions. The arrays of the time instants, at which the left or right lower leg is at its most distal position with respect to the instantaneous CM of the subject, are used in timing the motion of the left or right part of the human body.
The period of the gait cycle is related to two other quantities which are used in the analysis of motion data.
-
•
The stride length is the product of the velocity and the period of the gait cycle: .
-
•
The cadence is defined as the number of steps per unit of time; a commonly-used unit is the number of steps per min.
2.4 Waveforms
Using the time-instant arrays from the analysis of the left and right lower-leg signals (as described in Subsection 2.3), each time series (involving one specific node and spatial direction) was split into one-period segments, which were subsequently superimposed and averaged, to yield a representative movement for the node and spatial direction over the gait cycle. Average waveforms for all nodes and spatial directions, representing the variation of the motion of that node (in 3D) within the gait cycle, were extracted separately for the left and right nodes of the extremities; waveforms were also extracted for the important angles introduced in Subsection 3.1 of Ref. [3]. In case that left/right (L/R) information is not available (as, for example, in the case of the trunk angle), the right lower leg was used in the timing. All waveforms were subsequently -centred; the removal of the average offsets is necessary, given that the two systems yield output which cannot be thought of as corresponding to the same anatomical locations.
The left and right waveforms yield two new waveforms, identified as the ‘L/R average’ (LRA) and the ‘right-minus-left difference’ (RLD); the L/R differences in the output must be investigated as we intend to use Kinect in order to extract the asymmetrical features in the motion.
2.5 Scoring options when comparing waveforms
The similarity of corresponding waveforms is judged on the basis of five scoring options: Pearson’s correlation coefficient, the Zilliacus error metric, the RMS error metric, Whang’s score, and Theil’s score. Assuming that a (-centred) waveform, obtained from the original sensor, is denoted by and the corresponding (-centred) waveform from the upgraded sensor by , the five scoring options are defined in Eqs. (8)-(12) of Ref. [3] (where alternative ways for testing the similarity of the output of different systems are also discussed). All waveforms are obtained herein using histogram bins in the data processing.
At fixed velocity of the treadmill belt, we will investigate the variation of these scores for the nodes and spatial directions of the extremities. Tests will be performed on the LRA waveforms, as well as on those corresponding to the RLD waveforms. After studying the goodness of the association of the waveforms at fixed velocity, we will investigate velocity-dependent effects.
3 Data acquisition
The data acquisition involved one male adult (ZHAW employee), with no known motion problems, walking and running on a commercially-available treadmill (Horizon Laufband Adventure 5 Plus, Johnson Health Tech. GmbH, Germany). The placement of the treadmill in the laboratory of the Institute of Mechatronic Systems (School of Engineering, ZHAW), where the experimentation took place, was such that the subject’s motion be neither hindered nor influenced in any way by close-by objects. Prior to the data-acquisition sessions, the Kinect sensors were properly centred and aligned. The sensors were then left in the same position, untouched throughout the data acquisition.
The original sensor also provides information on the elevation (pitch) angle at which it is set. During our extensive tests, we discovered that this information is not reliable, at least for the particular device we used in our experimentation. To enable the accurate determination of the elevation angle of the sensor, we set forth a simple procedure. The subject stands (in the upright position, not moving) at a number of positions on the treadmill belt, and static measurements (e.g., s of Kinect data) at these positions are obtained and averaged. The elevation angle of the sensor may be easily obtained from the slope of the average (over a number of Kinect nodes, e.g., of those pertaining to the hips, knees, and ankles) (,) coordinates corresponding to these positions. The output data, obtained from the original sensor, were corrected (off-line) accordingly, to yield the appropriate spatial coordinates of the Kinect nodes in the ‘untilted’ coordinate system. To prevent the original sensor from re-adjusting the elevation angle during the data acquisition (which is a problematic feature), we attached its body unto a plastic structure mounted on a tripod. Mounted on the same structure, about cm above the original sensor, was the upgraded sensor. A dedicated correction for the tilt effects in the output of the upgraded sensor (which does not provide information on the elevation angle) was performed as aforementioned. The data from the original sensor were corrected by (a rotation around the axis by) , whereas those from the upgraded sensor by . These corrections were confirmed by measurements taken with a laser distance meter. Interestingly, the value of the elevation angle, obtained from the SDK of the original sensor in this configuration, was only .
It is worth mentioning that, as we are interested in capturing the motion of the subject’s lower legs (i.e., of the ankle and foot nodes), the Kinect sensors must be placed at such a height that the number of lost lower-leg signals be kept reasonably small. Our past experience dictated that the Kinect sensor be placed close to the minimal height recommended by the manufacturer, namely around ft off the (treadmill-belt) floor. Placing the sensor higher (e.g., around the midpoint of the recommended interval, namely at ft off the treadmill-belt floor) leads to many lost lower-leg signals (the ankle and foot nodes are not tracked), as the lower leg is not visible by the sensor during a sizeable fraction of the gait cycle, shortly after toe-off (TO).
The Kinect sensor may lose track of the lower parts of the subject’s extremities (wrists, hands, ankles, and feet) for two reasons: either due to the particularity of the motion of the extremity in relation to the position of the sensor (e.g., the identification of the elbows, wrists, and hands becomes problematic in some postures, where the viewing angle of the ulnar bone by Kinect is small) or due to the fact that these parts of the human body are obstructed (behind the subject) for a fraction of the gait cycle. Assuming that these instances remain rare (e.g., below about of the available data in each time series, i.e., one frame in ), the missing values may be reliably obtained (interpolated) from the well-determined (tracked) data. Although, when normalised to the total number of the available values, the untracked signals usually appear ‘harmless’, particular attention was paid in order to ensure that no node be significantly affected, as in such a case the interpolation could have yielded unreliable results.
Five velocities were used in the data acquisition: walking-motion data were acquired at km/h; running-motion data at , , , and km/h. At each velocity setting, the subject was given min to adjust his movements comfortably to the velocity of the treadmill belt. The Kinect output spanned slightly more than min at each velocity. The variation of the distance between the subject and the Kinect sensors was monitored during the data acquisition; it ranged between about and m, i.e., well within the limits for the use of the sensors set by the manufacturer. The recording on the two measurement systems started simultaneously.
Regarding the subject’s ‘stray’ motion, the rms average values (over all velocities) of the , , and distributions from the original sensor were: , , and mm; the corresponding values from the upgraded sensor were: , , and mm. Averages of the period of the gait cycle , of the cadence , and of the stride length are given in Table 1, separately for the two measurement systems at all velocities; the agreement between corresponding values is very satisfactory.
4 Comparison of the results obtained from the two Kinect sensors
We commence with the LRA waveforms. The goodness of the association of the waveforms obtained with the two measurement systems for the eight node levels of the extremities (SHOULDER, ELBOW, WRIST, HAND, HIP, KNEE, ANKLE, and FOOT) and spatial directions was investigated as follows. Separately for each of the five scoring options of Section 2.5, velocity, and spatial direction, each node level was ranked according to the goodness of the association between the waveforms obtained from the two measurement systems. The node level with the worst association was given the mark of , whereas the one with the best association was assigned the mark of . The sum of the ranking scores over all velocities and scoring options yielded an ‘matrix of goodness of the association’ ( node levels of the extremities, spatial directions); the minimal entry in this matrix may be as small as (which, in fact, was the overall score of the hips in the direction!), whereas the maximal value may be as large as (the maximal value was obtained for the foot nodes in the direction, a score of ). It was found that the nodes with the worst association (henceforth, NWA) between the two measurement systems correspond to the shoulders (in all three spatial directions) and the hips (in the and directions); the knees in the direction complete the first quartile of the similarity-index distribution. The average value of Pearson’s correlation coefficient for the NWA was found equal to and the rms of the distribution to .
We subsequently pursued the investigation of systematic differences in the performance of the sensors regarding: a) the upper and lower parts of the human body (i.e., upper- versus lower-extremity nodes) and b) the three spatial directions.
-
•
To assess the similarity of the waveforms, obtained from the two measurement systems for the nodes of the upper and lower extremities, one-factor ANOVA tests were performed, separately for each of the five scoring options of Subsection 2.5, on the scores extracted at each velocity, for all upper-extremity nodes and spatial directions, and all lower-extremity nodes and spatial directions. Assuming a significance level (the value which most statisticians adopt as the outset of the statistical significance), none of these tests resulted in significant effects, at any velocity; the minimal p-value from these tests was about . The exclusion of the scores of the NWA does not affect the results significantly, except at km/h where the resulting p-value dropped to (which, nonetheless, exceeds the adopted level). We thus conclude that the analysis cannot support any significant differences in the performance of the two sensors for the upper and lower extremities.
-
•
We next addressed the goodness of the association of the waveforms with regard to the three spatial directions , , and . Although the corresponding ANOVA tests did not reveal significant effects (except at km/h, where the p-value was ), the p-values were generally small, i.e., close to our threshold. After the exclusion of the scores of the NWA, all running-motion data yielded p-values below . The best-matching waveforms correspond to the depth ; the average values of Pearson’s correlation coefficient in the , , and directions were found to be: , , and , respectively.
It must be mentioned that pronounced velocity-dependent effects were observed in the overall similarity of the output of the two sensors. The association of the waveforms, obtained from the two Kinect sensors, appears to deteriorate with decreasing velocity; for instance, the average value (over all the nodes and spatial directions) of Pearson’s correlation coefficient dropped (almost linearly) from (at km/h) to (at km/h). The exclusion of the scores of the NWA increases the overall similarity, leaving its velocity dependence almost intact; for instance, the average value of Pearson’s correlation coefficient dropped (almost linearly) from (at km/h) to (at km/h). Similar conclusions were drawn after examining the results obtained with the other four scoring options. We have not found a plausible explanation of such a velocity dependence in the similarity of the output of the two sensors.
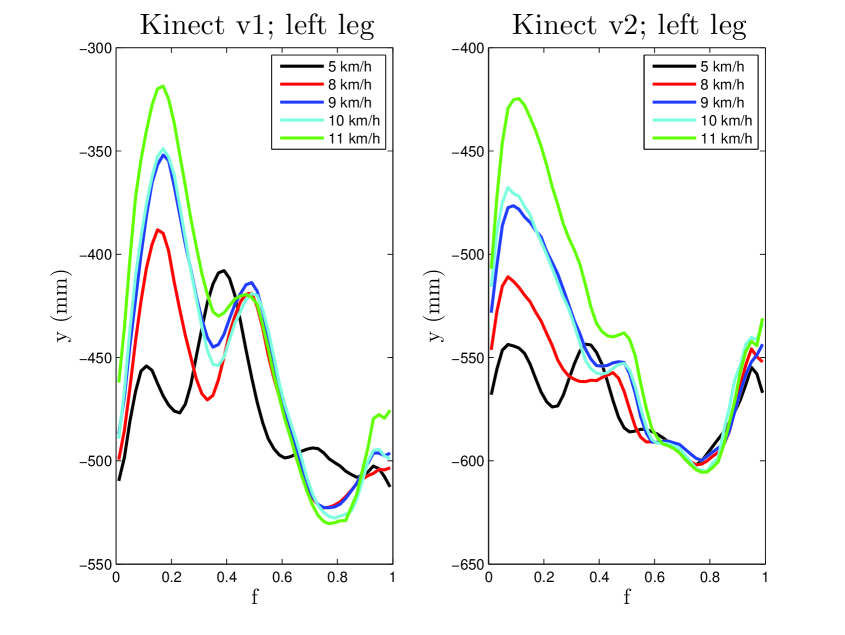
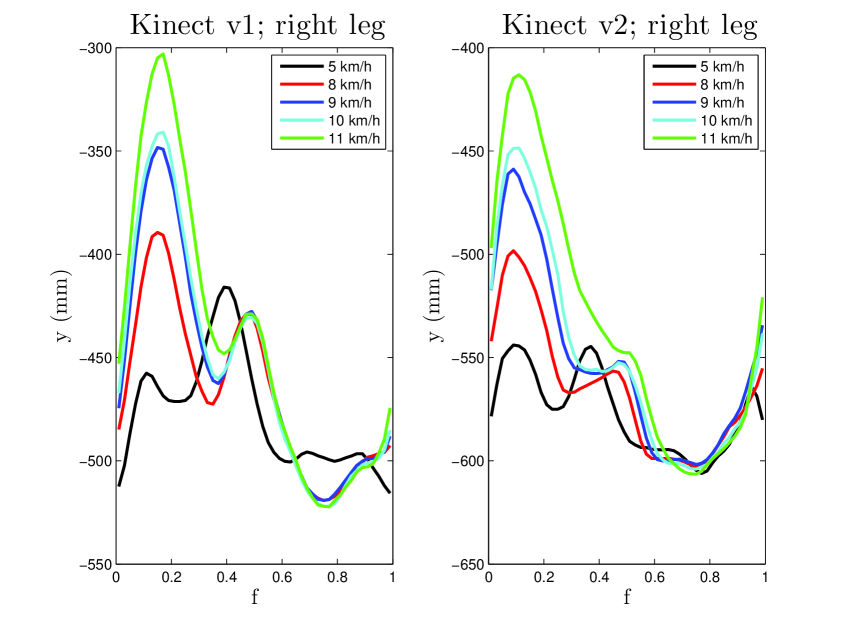
We also compared the waveforms of the lower legs. This comparison is interesting for two reasons. First, the lower-leg signals are used in timing the motion; second, we intend to use these signals in order to obtain the times (expressed as fractions of the gait cycle) of the initial contact (IC) and the TO [4, 5]; the difference of these two values is the stance fraction. Shown in Figs. 1 and 2 are the waveforms obtained from the outputs of the two measurement systems, separately at each velocity. The waveforms represent the variation of the raw signals, i.e., the offsets of the subject’s CM have not been removed. The salient feature in the waveforms obtained with the original sensor is a pronounced peak appearing around the IC; this peak is reduced in the waveforms obtained with the upgraded sensor.
We also investigated the goodness of the association of the RLD waveforms. To this end, two-sided t-tests were performed on the score distributions between corresponding LRA and RLD waveforms, a total of tests: five scoring options, three tests per scoring option (paired, homoscedastic, and unequal-variance), and five velocities. The p-values, obtained from the majority of these tests for the running-motion data, were found to be small, below ; the median p-value was equal to , whereas the minimal one was . (After the exclusion of the scores of the NWA, the median p-value dropped to , whereas the minimal one to .) The analysis showed that Pearson’s correlation coefficients of the tests on the RLD waveforms were systematically below those of the LRA waveforms, whereas all other scores were larger for the RLD waveforms, thus indicating a poorer association of the waveforms obtained from the two measurement systems for the RLDs compared to the LRAs. As a result, the similarity between the RLD waveforms, obtained with the two Kinect sensors, is weaker than between the LRA waveforms.
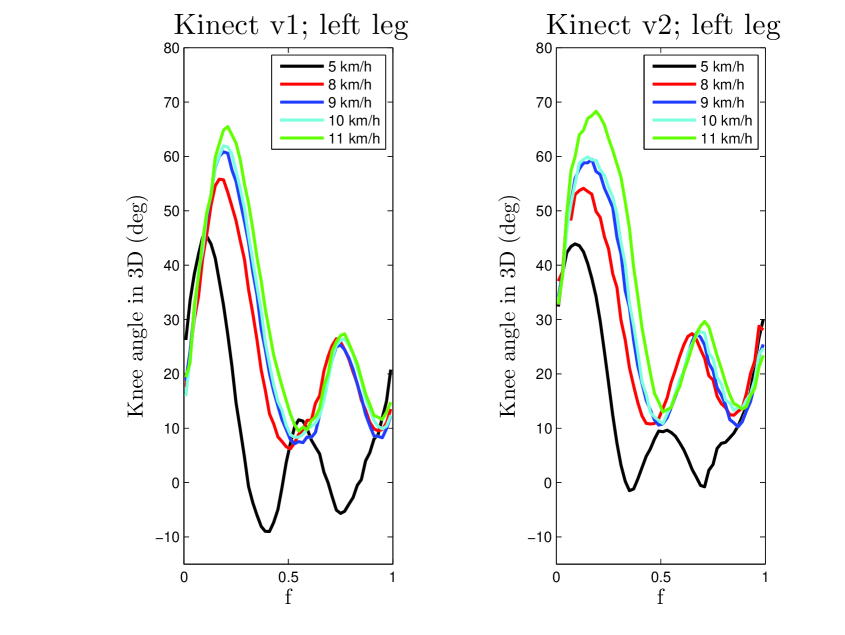
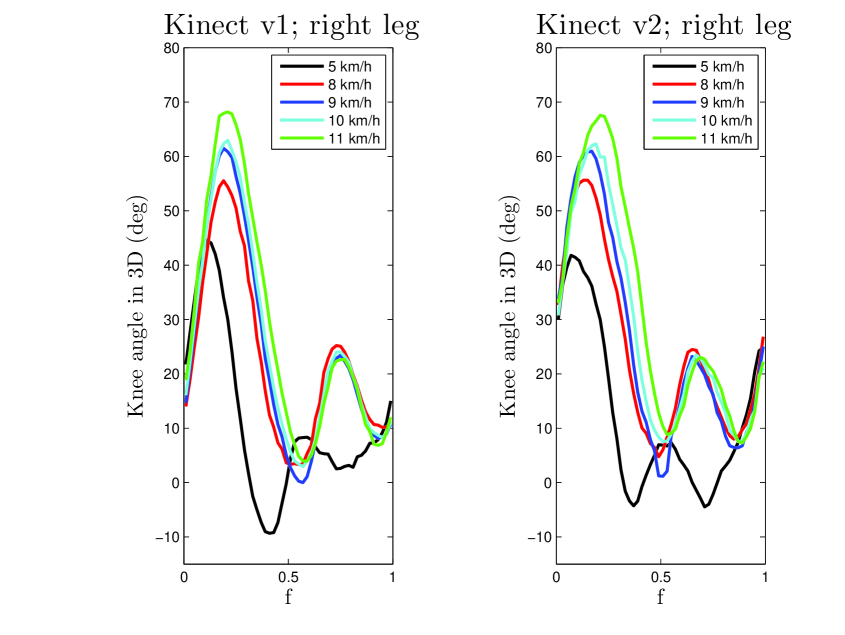
We also examined the similarity of the waveforms for the important angles, introduced in Subsection 3.1 of [3]. The only waveforms which match well are those for the hip and knee angles in the sagittal plane, and (to a lesser degree) those for the hip angles in the coronal plane. In the sagittal plane, the average values of Pearson’s correlation coefficients for the LRAs were equal to and for the hip and knee angles, respectively. In the coronal plane, the average value of Pearson’s correlation coefficient for the LRAs was equal to for the hip angles. The corresponding RLD waveforms do not much well; in the sagittal plane, the average values of Pearson’s correlation coefficients were equal to and ; the agreement for the hip angles in the coronal plane was found to be even poorer (Pearson’s correlation coefficient came out around ). The average value of Pearson’s correlation coefficients for the LRAs in the case of the knee angle in 3D was ; for the corresponding RLDs, ; the left and right knee angles in 3D are shown in Figs. 3 and 4.
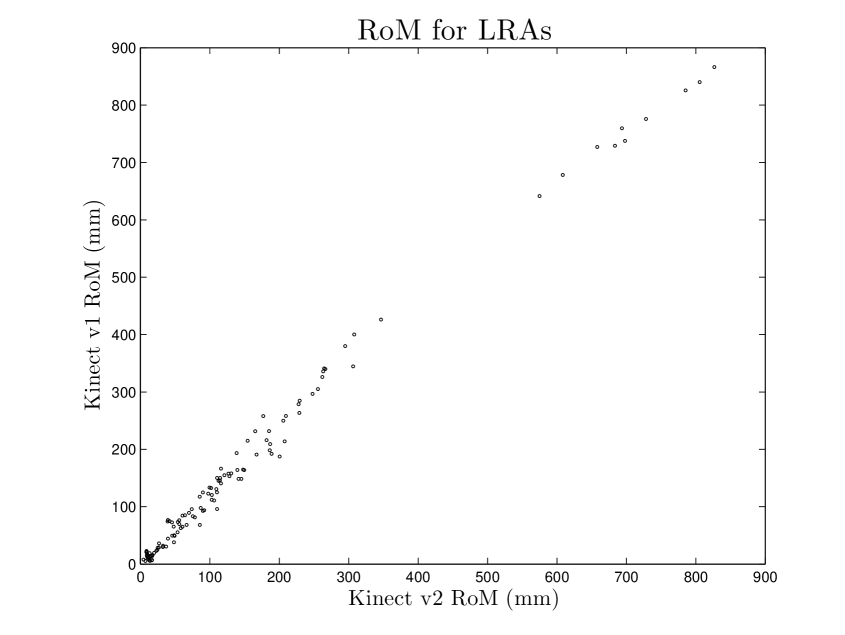
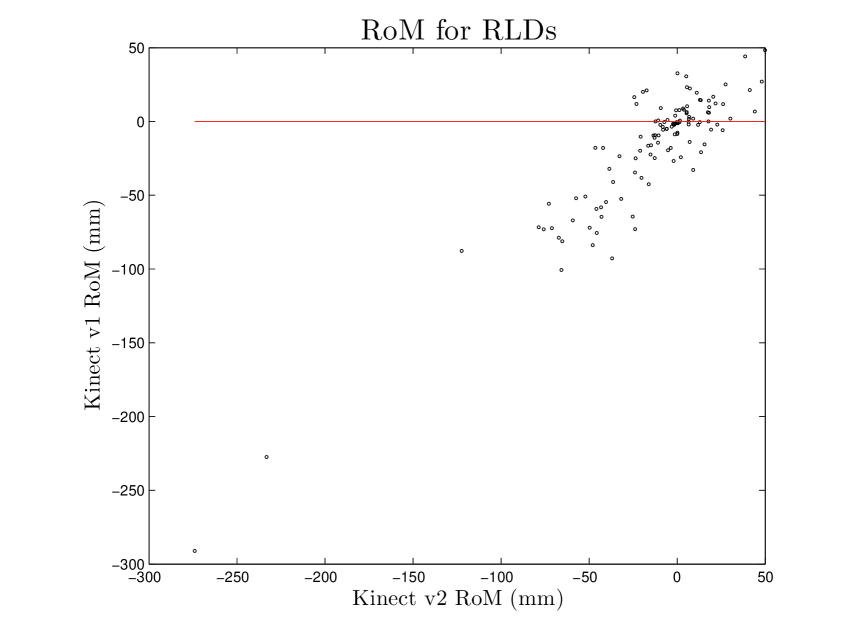
We finally address the comparison of the RoMs obtained from the waveforms of two measurement systems waveforms. It might be argued that one could simply use in a study the RoMs, rather than the waveforms, as representative of the motion of each node. Of course, given that each waveform is essentially replaced by one number, the information content in the RoMs is drastically reduced compared to that contained in the waveforms. Shown in Fig. 5 is a scatter plot of the RoMs of the LRA waveforms. The ideal relation between these two quantities is a straight line with slope equal to ; Pearson’s correlation coefficient between the two RoM arrays came out equal to . Shown in Fig. 6 is a scatter plot of the RoMs of the RLD waveforms. A straight line with slope equal to is the expected relation here too; however, the scattering of the values is larger and Pearson’s correlation coefficient dropped to . Again, we draw the conclusion that the similarity of the RLD waveforms, obtained with the two Kinect sensors, is smaller to that of the LRA waveforms. An unweighted quadratic fit, constrained to pass through the origin of the plot, to the RoMs of the LRA waveforms resulted in curvature and slope values equal to mm-1 and , respectively, indicating that (in comparison to the upgraded sensor) the original sensor overestimates (on average) the RoMs (in the domain of the values of Fig. 5) by about . These results do not change significantly after the exclusion of the scores of the NWA.
5 Discussion and conclusions
The present study is part of a broader programme, aiming at investigating the involvement of the Microsoft KinectTM (hereafter, ‘Kinect’) sensor in the analysis of human motion. In this work, we set on assessing the similarity in the performance of the two (original and upgraded) versions of the sensor for data acquired from one subject walking and running on a commercially-available treadmill. An estimate of the degree of the association of the output of these systems is obtained after following the methodology of Ref. [3] and comparing the waveforms extracted for the nodes of the extremities from the two measurement systems, as well as of those for the important angles (defined in Subsection 3.1 therein). Our comparative study of the two Kinect sensors identifies the similarities and the differences in their performance, but (of course) cannot enable conclusions regarding which of the two sensors performs better.
In this work, we came up with a number of significant differences in the performance of the two sensors.
-
•
The worst association is obtained for the waveforms of the shoulders (in all three spatial directions), of the hips (in the and directions), and of the knees (in the direction).
-
•
The association of the waveforms in the two lateral directions ( and ) is poorer than that in the direction (depth).
-
•
The association of the waveforms deteriorates with decreasing velocity of the walker/runner.
-
•
The waveforms of the lower legs come out different. A characteristic peak, which is present in the data of the original sensor shortly before the initial contact, appears reduced in the data of the upgraded sensor.
-
•
Exempting the hip and knee angles in the sagittal plane, and the lateral hip angles in the coronal plane, the association of the waveforms of the important angles is poor.
-
•
The association of the ranges of motion (RoMs) is poor. It appears that the original sensor overestimates the RoMs (in the domain of the values of the present paper) by about .
-
•
The association between the waveforms, entering the investigation of the asymmetry of the motion, is poorer than the results obtained for the average waveforms for the left and right parts of the human body.
As the original sensor has been proven unsuitable for applications requiring high precision [2], it must be investigated whether the differences detailed herein constitute an improvement in the performance of the upgraded sensor. As a result, a dedicated validation study for the upgraded sensor, on the basis of a marker-based system, is called for.
Conflict of interest statement
The authors certify that, regarding the material of the present paper, they have no affiliations with or involvement in any organisation or entity with financial or non-financial interest.
References
- [1] http://www.xbox.com/en-GB/Kinect/, http://www.microsoft.com/en-us/Kinectforwindows/
- [2] A. Pfister, A.M. West, S. Bronner, J.A. Noah, Comparative abilities of Microsoft Kinect and Vicon 3D motion capture for gait analysis, J. Med. Eng. Technol. 38 (2014) 274-280.
- [3] M.J. Malinowski, E. Matsinos, S. Roth, On using the Microsoft KinectTM sensors in the analysis of human motion, arXiv:1412.2032 [physics.med-ph].
- [4] S. Õunpuu, The Biomechanics of walking and running, Clin. Sport Med. 13 (1994) 843-863.
- [5] T.F. Novacheck, The biomechanics of running, Gait Posture 7 (1998) 77-95.
The average values of the period of the gait cycle , of the cadence , and of the stride length at the five velocity settings used in the data acquisition (see Section 3), separately for the two Kinect sensors.
| km/h | km/h | km/h | km/h | km/h | |
| Original Kinect sensor | |||||
| (s) | |||||
| (steps/min) | |||||
| (m) | |||||
| Upgraded Kinect sensor | |||||
| (s) | |||||
| (steps/min) | |||||
| (m) | |||||