Measuring stellar rotation periods with Kepler
Abstract
We measure rotation periods for 12 151 stars in the Kepler field, based on the photometric variability caused by stellar activity. Our analysis returns stable rotation periods over at least six out of eight quarters of Kepler data. This large sample of stars enables us to study the rotation periods as a function of spectral type. We find good agreement with previous studies and measurements for F, G and K stars. Combining rotation periods, B-V color, and gyrochronology relations, we find that the cool stars in our sample are predominantly younger than Gyr.
1 Introduction
Stellar rotation is a key aspect of stellar evolution, stellar activity, and mass loss through stellar winds. The spin down experienced by stars during their main sequence lifetimes is also a measure of their ages (e.g. Barnes 2007). The Kepler mission provides us with a unique opportunity to study stellar rotation over a large and consistent sample of stars covering a wide range of spectral types.
Among the high-quality photometric light curves of Kepler, a significant fraction of stars show periodicities associated with active regions. Using spectral analysis, we extract stable rotation periods from 8 quarters of Kepler observations. Here we summarize the results published by Nielsen et al. (2013) and further comment on the prospects for inferring ages of stars through gyrochronology.
2 Method
We use the white-light photometric Kepler time series, which consist of day segments (quarters). We analyzed quarters 2 to 9 for a total of stars. We considered the data processed by PDC_MAP reduction pipeline (Smith et al. 2012) and also the more recent data from the msMAP pipeline (Thompson et al. 2013) for comparison purposes. Periods longer than days are treated differently by the two pipelines and so may lead to different stellar rotation periods (Garcia private communication, Nielsen et al. 2013).
For each star and each quarter we computed the Lomb-Scargle periodogram using PDC_MAP data. We then identified the peak of maximum power in the period range 1 - 100 days, discarding periods longer than 30 days (which are potentially subject to instrumental effects). Detected periods are subjected to a statistically analysis in order to only extract stable periods, namely at least 6 periods must fall within 2 median absolute deviations (MAD), with a maximum MAD of 1 day. These stable periods are adopted as stellar rotation periods.
3 Rotation Periods
The PDC_MAP rotation periods for 12 151 stars are published as online material via the CDS 111http://cdsarc.u-strasbg.fr/viz-bin/qcat?J/A+A/557/L10. The msMAP data yielded only 9617 stars with measured rotation periods. The msMAP tends to suppress long term variability and is therefore ill suited for studying slow rotators.

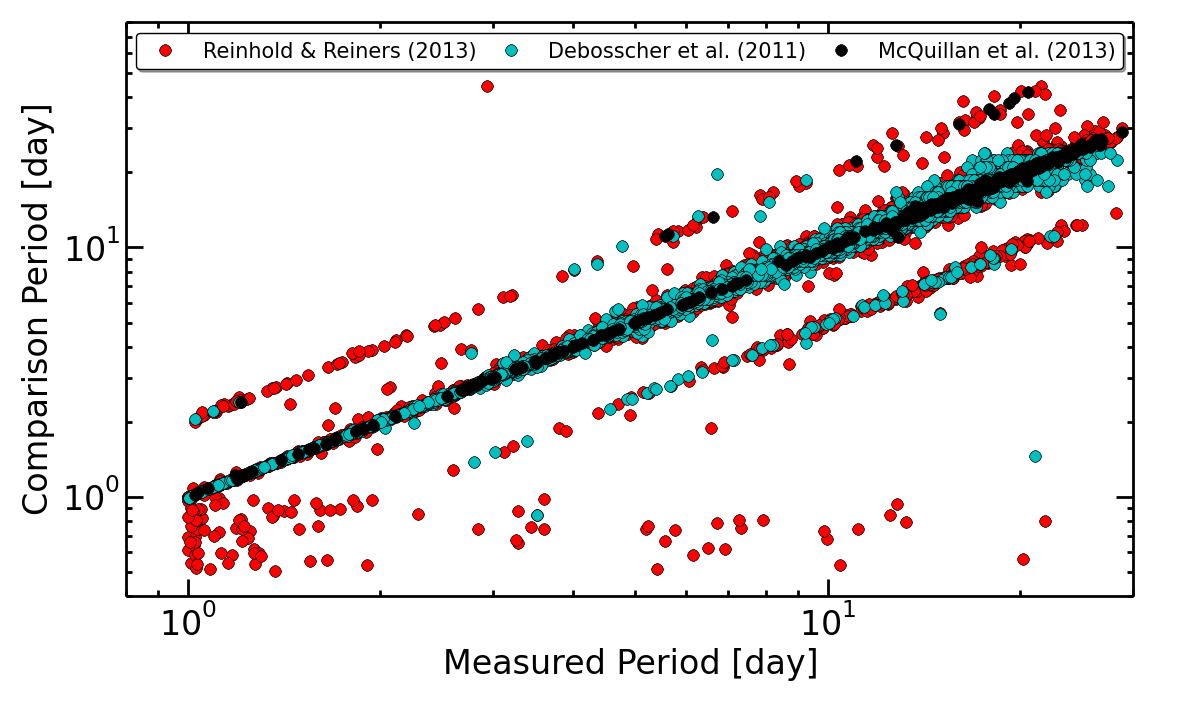
We compared our results with those of Debosscher et al. (2011) (8654 stars), Reinhold & Reiners (2013) (24 124 stars), and McQuillan et al. (2013) (1570 stars). In Figure 1 we show periods for the stars in our sample that are also present in each of the respective comparison samples. It is clear that the vast majority () of detected periods are consistent among the different samples. It is also evident that some periods differ, as seen by the points that lie at twice or half our measured period. Reinhold & Reiners (2013) and McQuillan et al. (2013) consider periods longer than our limit of days, this means that a few of our periods above 30 days are likely harmonic periods. Debosscher et al. (2011) use a similar period range as ours, and so it is unclear why in some cases their analysis yields what appears to be sub-harmonic to our measured periods. Similarly Reinhold & Reiners (2013) analyzed periods shorter than one day, giving rise to the scatter of points in the lower part of the figure. The comparison periods from Reinhold & Reiners (2013) and Debosscher et al. (2011) that are found at half our measured period are likely caused be the fact that these studies only considered one quarter of Kepler data.
4 Rotation vs. spectral type
Nielsen et al. (2013) presented an additional comparison with measurements from the Gł\kebocki & Gnaciński (2005) catalog. Using radii from the Kepler Input Catalog, we converted the starspot periods into equatorial velocities and found a very good agreement between the two samples for spectral types F, G and K. For later type stars (late-K and M dwarfs), the rotational velocities from Kepler photometry are lower by up to an order of magnitude than implied by the catalog, which predominantly contains younger stars in open clusters. For earlier type stars, there is also a disagreement, likely due to incorrect KIC radii.
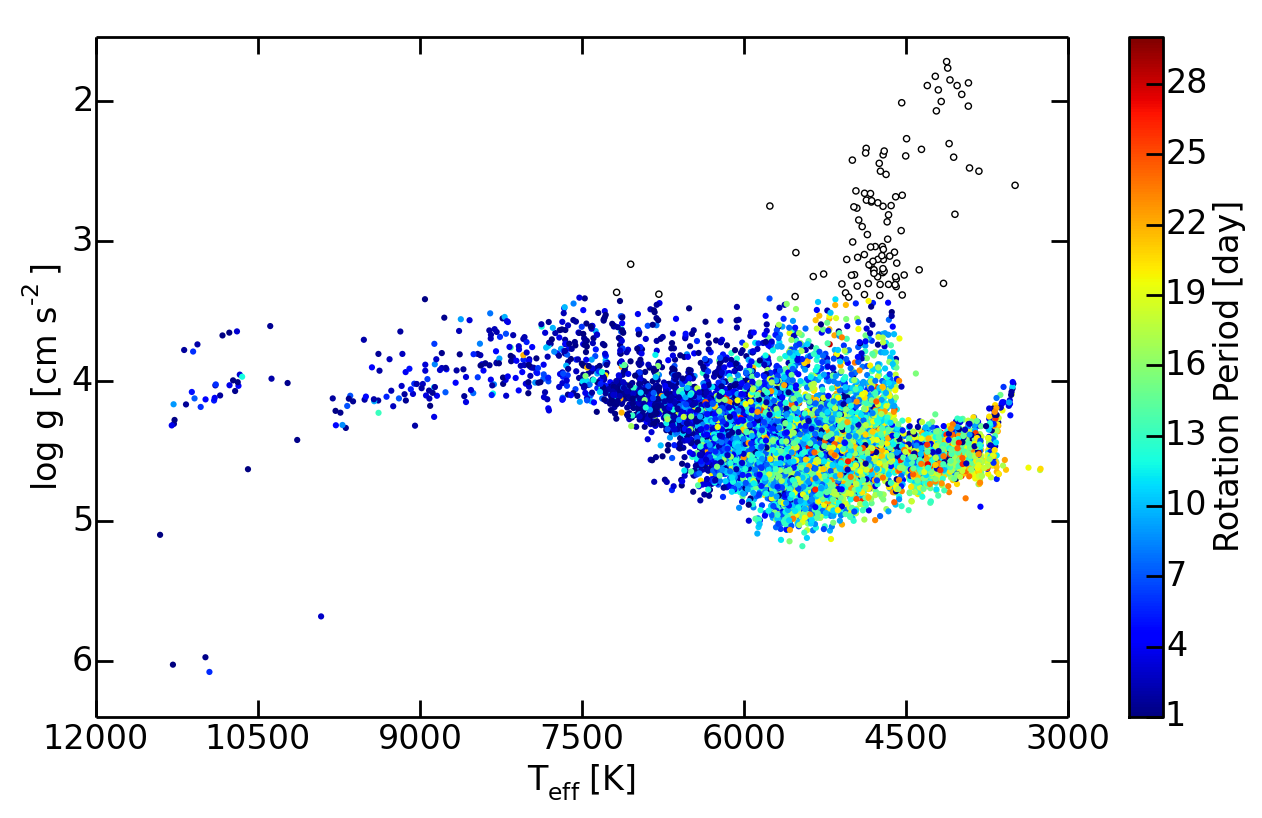
Figure 2 shows a (, )-diagram of the stars for which we measure a rotation period. A strong change in rotation period with temperature along the main sequence is immediately evident around K. This indicates the transition from cool stars with outer convective envelopes to hotter stars with only a shallow convective shell.

5 Toward age determination
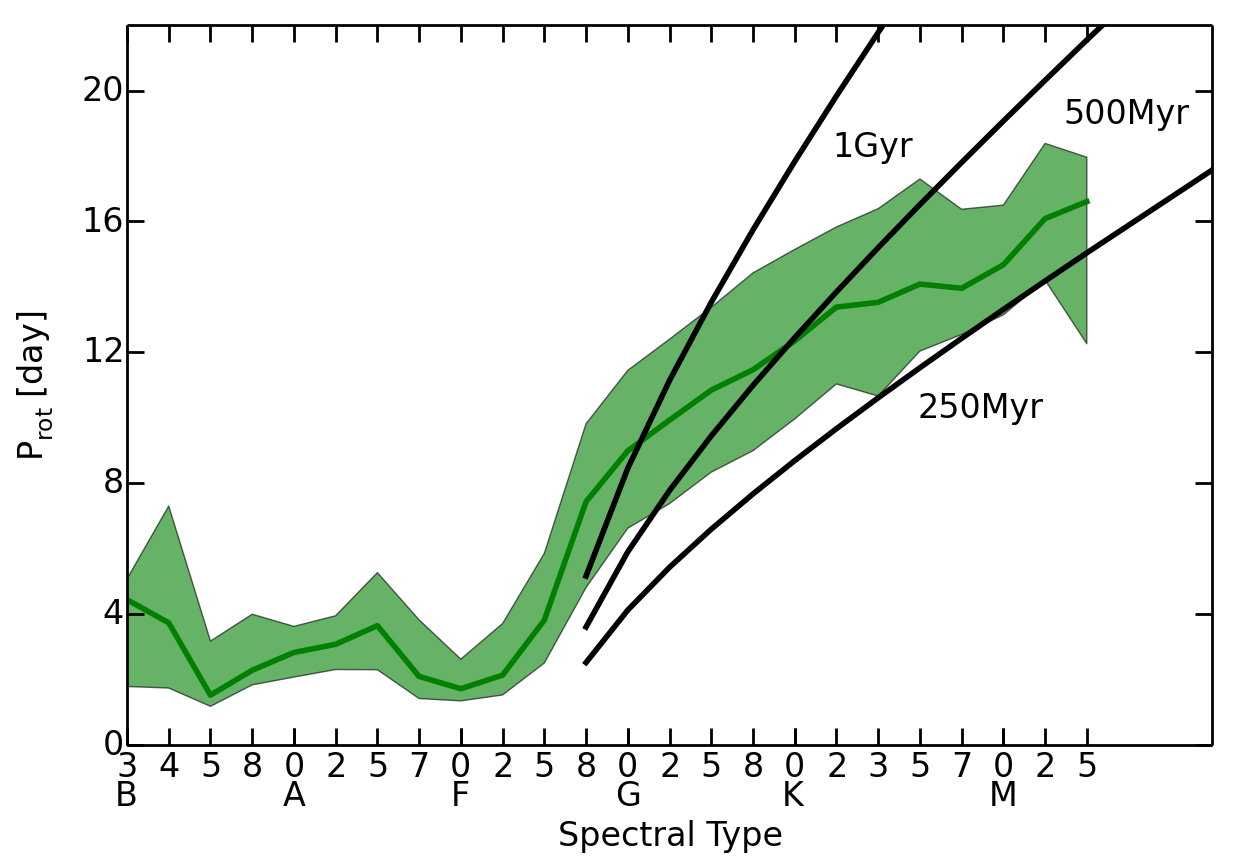
Stars rotate slower as they age because of magnetic braking. Cool stars with a deep convective zone exhibit stronger magnetic fields and so lose angular momentum faster via stellar winds. This spin down is described by the relationship between stellar rotation period, stellar age, and B-V color index (Barnes 2007). Three isochrones (250 Myr, 500 Myr, and 1 Gyr) are plotted as a function of rotation period and spectral type (Fig. 3). By comparison with the starspot rotation periods, some information about stellar ages can be obtained. The isochrones indicate that the stars in our sample cover a range of ages up to about 1 Gyr, thus confirming that they are predominantly young active stars.

Acknowledgments
M.N., L.G., and H.S. acknowledge research funding by the Deutsche Forschungsgemeinschaft (DFG) under grant SFB 963/1 “Astrophysical flow instabilities and turbulence” (Project A18). Funding for the Stellar Astrophysics Centre is provided by The Danish National Research Foundation. The research is supported by the ASTERISK project (ASTERoseismic Investigations with SONG and Kepler) funded by the European Research Council (Grant agreement no.: 267864). This paper includes data collected by the Kepler mission. Funding for the Kepler mission is provided by the NASA Science Mission directorate. Some of the data presented in this paper were obtained from the Mikulski Archive for Space Telescopes (MAST). STScI is operated by the Association of Universities for Research in Astronomy, Inc. under NASA contract NAS5-26555. Support for MAST for non-HST data is provided by the NASA Office of Space Science via grant NNX09AF08G and by other grants and contracts.
References
- Barnes (2007) Barnes, S. A. 2007, ApJ, 669, 1167
- Debosscher et al. (2011) Debosscher, J., Blomme, J., Aerts, C., & De Ridder, J. 2011, A&A, 529, A89
- Gł\kebocki & Gnaciński (2005) Gł\kebocki, R., & Gnaciński, P. 2005, VizieR Online Data Catalog, 3244, 0
- Kjeldsen & Bedding (2011) Kjeldsen, H., & Bedding, T. R. 2011, A&A, 529, L8
- McQuillan et al. (2013) McQuillan, A., Aigrain, S., & Mazeh, T. 2013, MNRAS, 432, 1203
- Nielsen et al. (2013) Nielsen, M., Gizon, L., Schunker, H., & Karoff, C. 2013, arXiv preprint: 1305.5721
- Reinhold & Reiners (2013) Reinhold, T., & Reiners, A. 2013, arXiv preprint:1306.2176
- Smith et al. (2012) Smith, J. C., Stumpe, M. C., Van Cleve, J., Jenkins, J. M., Barclay, T. S., Fanelli, M. N., Girouard, F. R., Kolodziejczak, J. J., McCauliff, S. D., Morris, R. L., & Twicken, J. D. 2012, PASP, 124, 1000. arXiv:1203.1383v1, URL http://arxiv.org/abs/1203.1383
- Thompson et al. (2013) Thompson, S. E., Christiansen, J. L., Jenkins, J. M., Caldwell, D. A., Barclay, T., Bryson, S. T., Burke, C. J., Campbell, J. R., Catanzarite, J., Clarke, B. D., Coughlin, J. L., Girouard, F., Haas, M. R., Ibrahim, K., Klaus, T. C., Kolodziejczak, J. J., Li, J., McCauli, S. D., Morris, R., Mullally, F., Quintana, E. V., Rowe, J., Sabale, A., Seader, S., Smith, J. C., Still, M. D., Tenenbaum, P. G., Twicken, J. D., & Uddin, A. K. 2013, Kepler Data Release 21 Notes (KSCI-19061-001), Tech. rep.