Structural and magnetic phase transitions near optimal superconductivity in BaFe2(As1-xPx)2
Abstract
We use nuclear magnetic resonance (NMR), high-resolution x-ray and neutron scattering to study structural and magnetic phase transitions in phosphorus-doped BaFe2(As1-xPx)2. Previous transport, NMR, specific heat, and magnetic penetration depth measurements have provided compelling evidence for the presence of a quantum critical point (QCP) near optimal superconductivity at . However, we show that the tetragonal-to-orthorhombic structural () and paramagnetic to antiferromagnetic (AF, ) transitions in BaFe2(As1-xPx)2 are always coupled and approach to ( K) for before vanishing abruptly for . These results suggest that AF order in BaFe2(As1-xPx)2 disappears in a weakly first order fashion near optimal superconductivity, much like the electron-doped iron pnictides with an avoided QCP.
pacs:
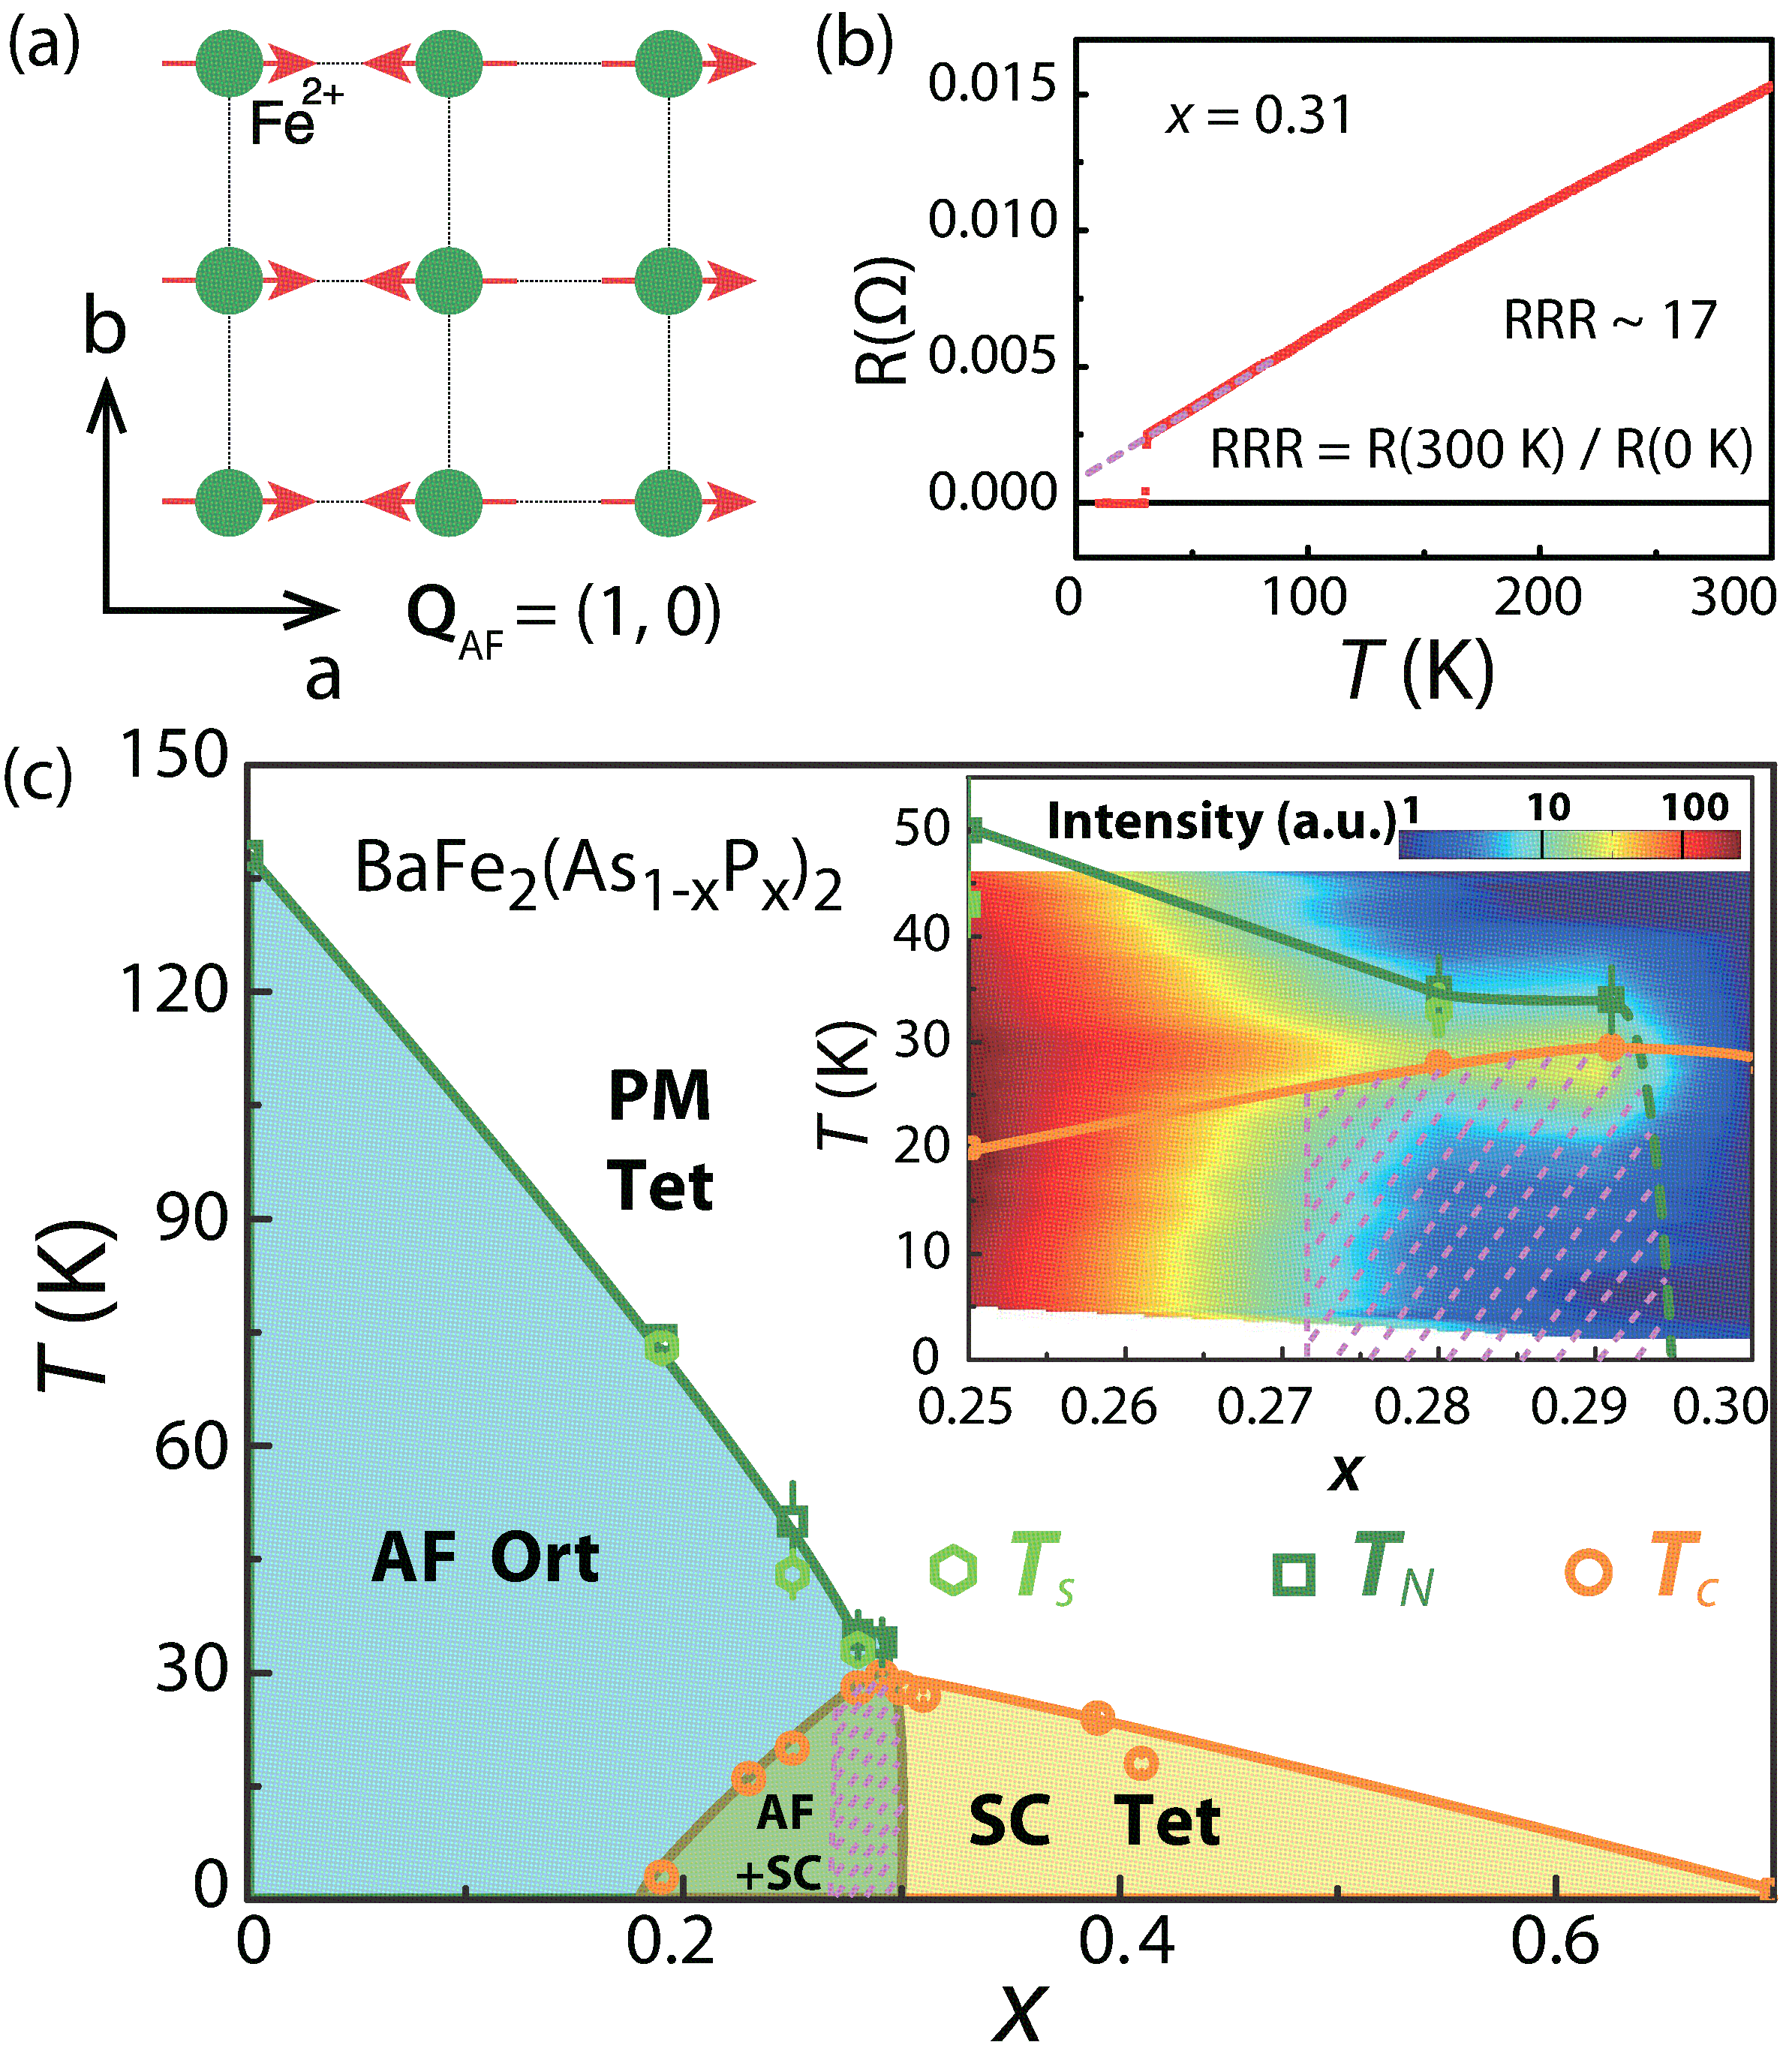
74.70.Xa, 75.30.Gw, 78.70.NxA determination of the structural and magnetic phase diagrams in different classes of iron pnictide superconductors will form the basis from which a microscopic theory of superconductivity can be established kamihara ; cruz ; qhuang ; mgkim11 ; dai . The parent compound of iron pnictide superconductors such as BaFe2As2 exhibits a tetragonal-to-orthorhombic structural transition at temperature and then orders antiferromagnetically below with a collinear antiferromagnetic (AF) structure [Fig. 1(a)] qhuang ; mgkim11 . Upon hole-doping via partially replacing Ba by K or Na Rotter ; Gil , the structural and magnetic phase transition temperatures in BaFe2As2 ( K, Na) decreases simultaneously with increasing and form a small pocket of a magnetic tetragonal phase with the -axis aligned moment before disappearing abruptly near optimal superconductivity Avci2012 ; Avci2014 ; Waber ; bohmer . For electron-doped Ba(Fe)2As2 (Co,Ni), transport canfield ; fisher , muon spin relaxation (SR) bernhard , nuclear magnetic resonance (NMR) ning ; zhou2013 ; dioguardi , x-ray and neutron scattering experiments clester ; nandi ; dkpratt11 ; hqluo ; xylu ; xylu14 have revealed that the structural and magnetic phase transition temperatures decrease and separate with increasing clester ; nandi ; dkpratt11 ; hqluo ; xylu ; xylu14 . However, instead of a gradual suppression to zero temperature near optimal superconductivity as expected for a magnetic quantum critical point (QCP) ning ; zhou2013 , the AF order for Ba(Fe)2As2 near optimal superconductivity actually occurs around 30 K () and forms a short-range incommensurate magnetic phase which competes with superconductivity and disappears in the weakly first order fashion, thus avoiding the expected magnetic QCP dkpratt11 ; hqluo ; xylu ; xylu14 .
Although a QCP may be avoided in electron-doped Ba(Fe)2As2 due to disorder and impurity scattering in the FeAs plane induced by Co and Ni substitution, phosphorus-doped BaFe2(As1-xPx)2 provides an alternative system to achieve a QCP since substitution of As by the isovalent P suppresses the static AF order and induces superconductivity without appreciable impurity scattering eabrahams11 ; SJiang ; Shishido10 ; Beek10 . Indeed, experimental evidence for the presence of a QCP at in BaFe2(As1-xPx)2 has been mounting, including the linear temperature dependence of the resistivity Kasahara10 , an increase in the effective electron mass seen from the de Haas-van Alphen Shishido10 , magnetic penetration depth Hashimoto12 ; Shibauchi14 , heat capacity Walmsley , and normal state transport measurements in samples where superconductivity has been suppressed by a magnetic field Analytis14 . Although these results, as well as NMR measurements Nakai10 , indicate a QCP originating from the suppression of the static AF order near , recent neutron powder diffraction experiments directly measuring and in BaFe2(As1-xPx)2 as a function of suggest that structural quantum criticality cannot exist at compositions higher than allred . Furthermore, the structural and magnetic phase transitions at all studied P-doping levels are first order and occur simultaneously within the sensitivity of the measurements (0.5 K), thus casting doubt on the presence of a QCP allred . While these results are interesting, they were carried out on powder samples, and thus are not sensitive enough to the weak structural/magnetic order to allow a conclusive determination on the nature of the structural and AF phase transitions near optimal superconductivity.
In this Letter, we report systematic transport, NMR, x-ray and neutron scattering studies of BaFe2(As1-xPx)2 single crystals focused on determining the P-doping evolution of the structural and magnetic phase transitions near . While our data for are consistent with the earlier results obtained from powder samples allred , we find that nearly simultaneous structural and magnetic transitions in single crystals of BaFe2(As1-xPx)2 occur at K for and 0.29 (near optimal doping) and disappear suddenly at . While superconductivity dramatically suppresses the static AF order and lattice orthorhombicity below for and 0.29, the collinear static AF order persists in the superconducting state. Our neutron spin echo and NMR measurements on the sample reveal that only part of the sample is magnetically ordered, suggesting its mesoscopic coexistence with superconductivity. Therefore, in spite of reduced impurity scattering, P-doped BaFe2As2 has remarkable similarities in the phase diagram to that of electron-doped Ba(Fe)2As2 iron pnictides with an avoided QCP.
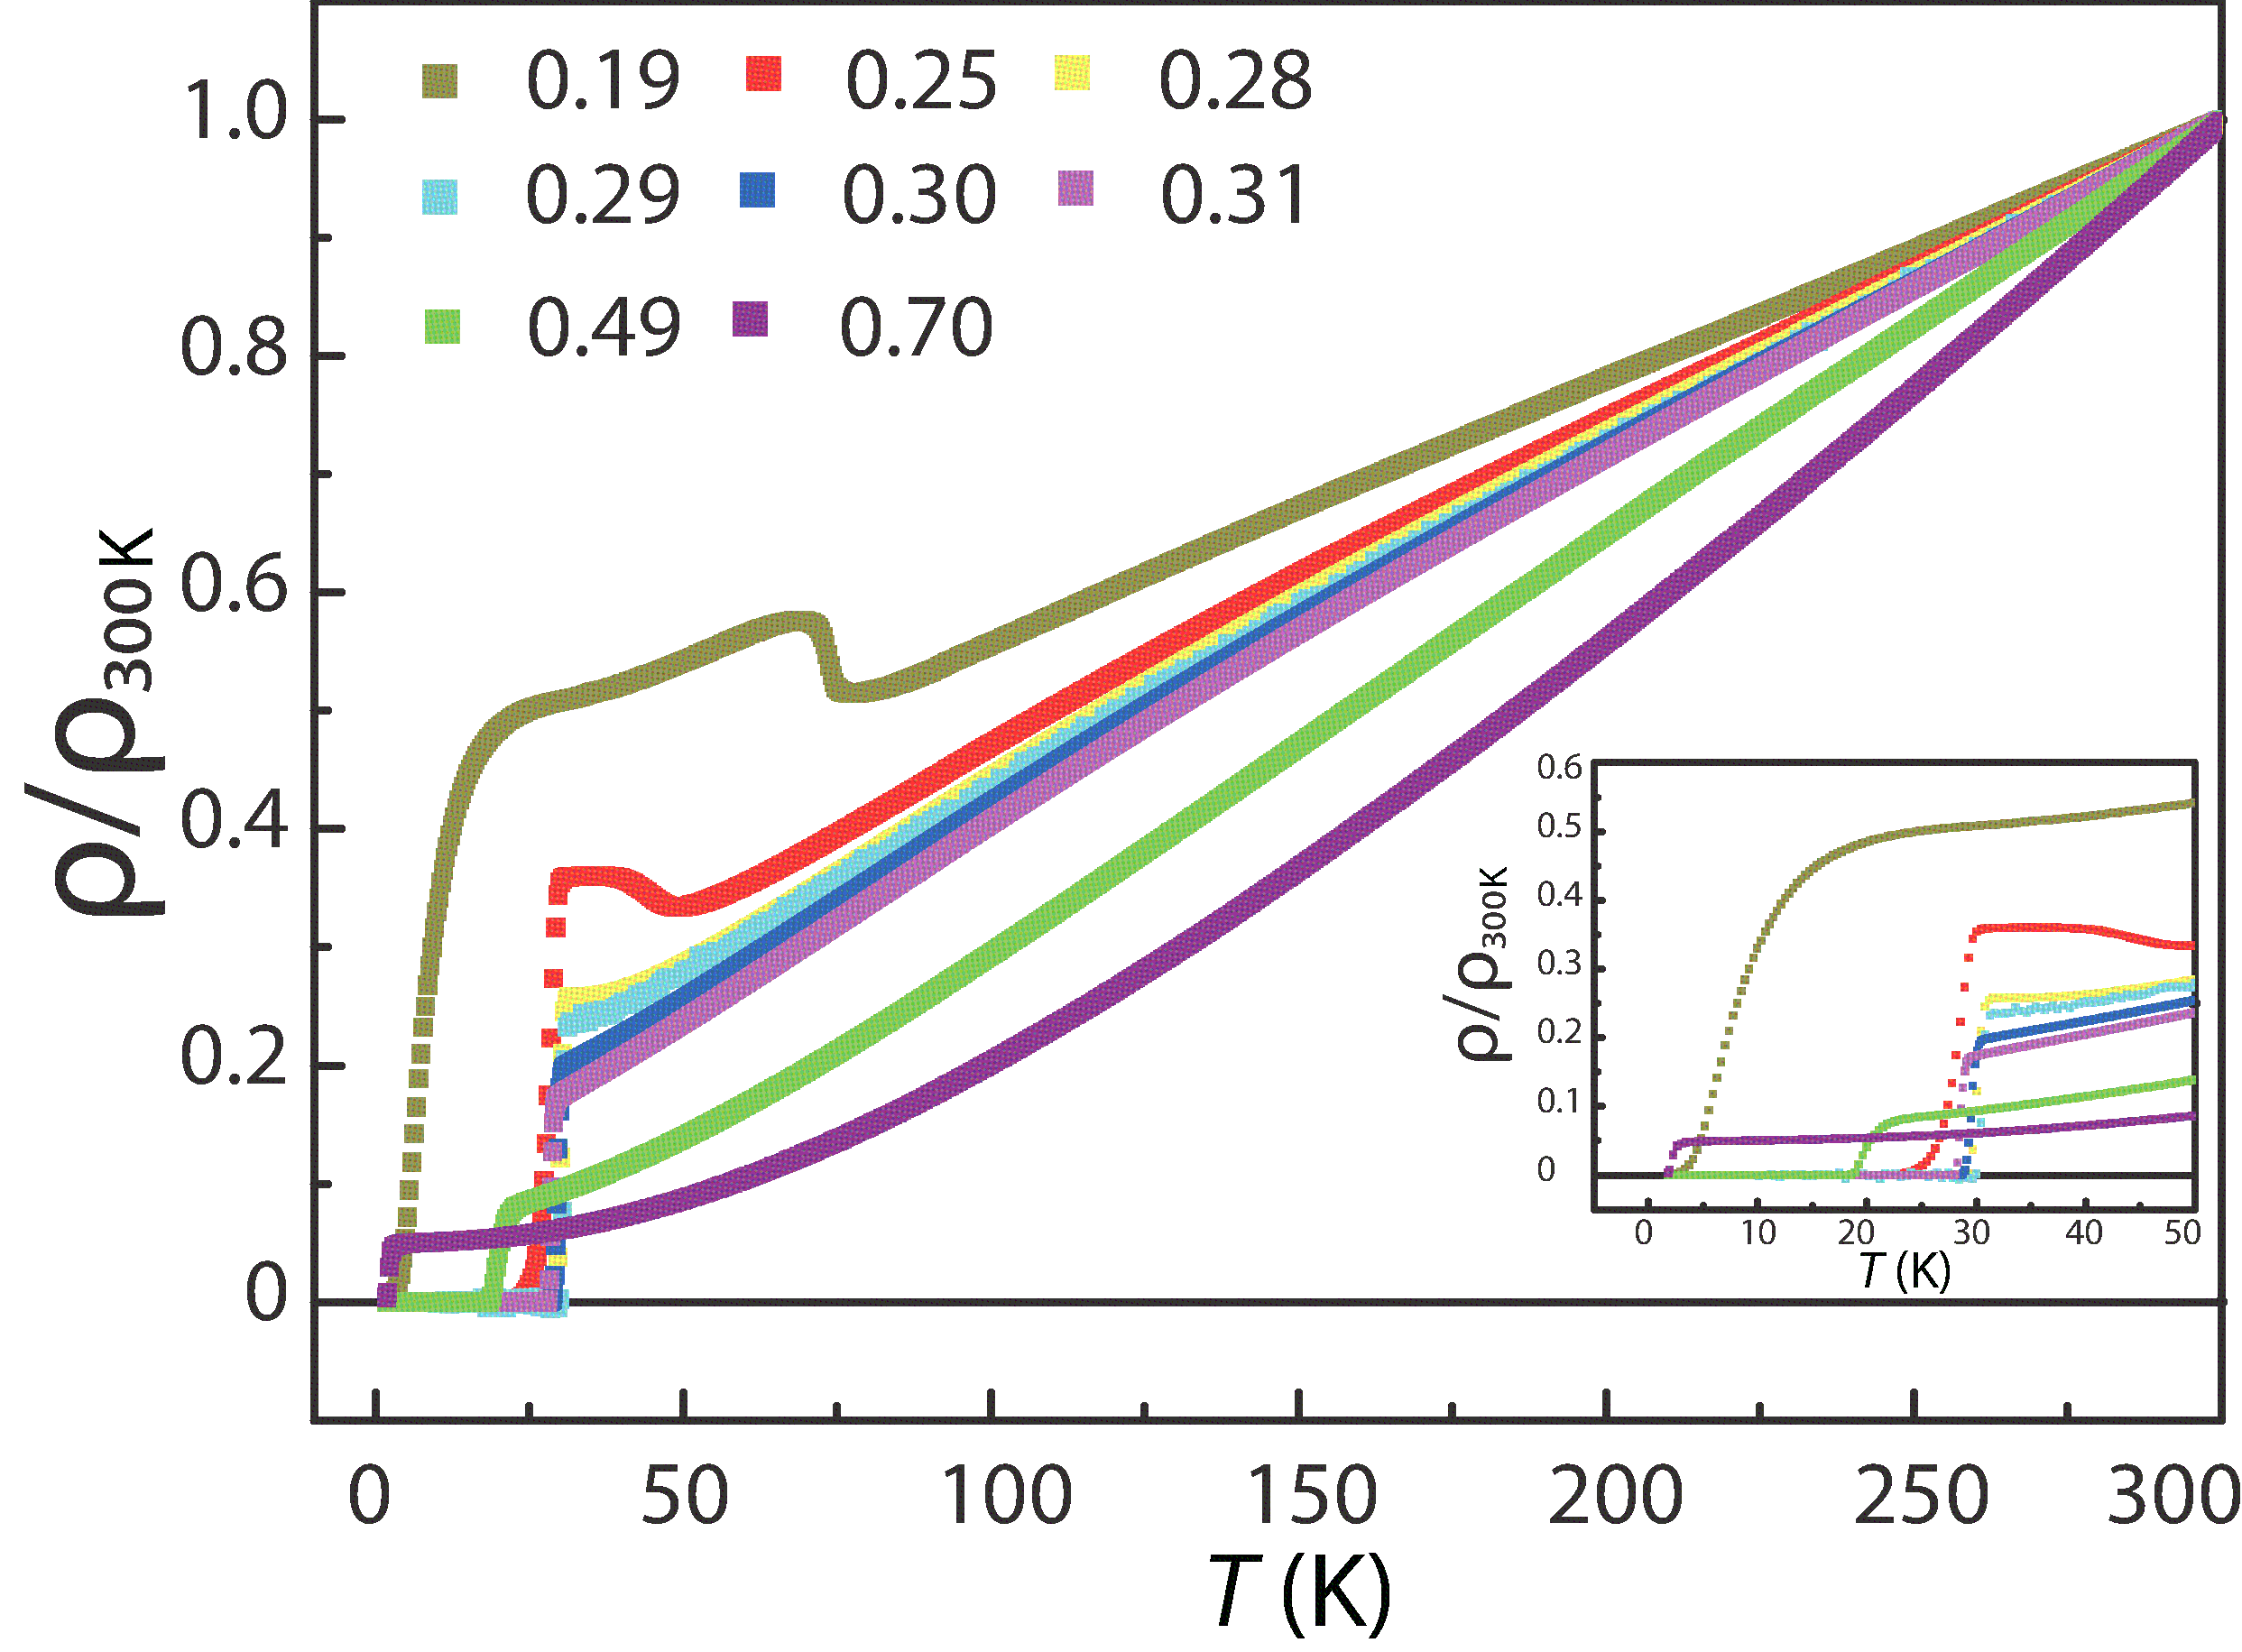
We have carried out systematic neutron scattering experiments on BaFe2(As1-xPx)2 with , and 0.31 sample using the C5, RITA-II, and MIRA triple-axis spectrometers at the Canadian Neutron Beam center, Paul Scherrer Institute, and Heinz Maier-Leibnitz Zentrum (MLZ), respectively. We have also carried out neutron resonance spin echo (NRSE) measurements on the sample using TRISP triple-axis spectrometer at MLZ keller . Finally, we have performed high-resolution x-ray diffraction experiments on identical samples at Ames laboratory and Advanced Photon Source, Argonne National Laboratory supplementary . Our single crystals were grown using Ba2As2/Ba2P3 self-flux method and the chemical compositions are determined by inductively coupled plasma analysis with 1% accuracy sample . We define the wave vector at as reciprocal lattice units (rlu) using the orthorhombic unit cell suitable for the AF ordered phase of iron pnictides, where Å and Å. Figure 1(b) shows temperature dependence of the resistivity for sample, confirming the high quality of our single crystals Kasahara10 .
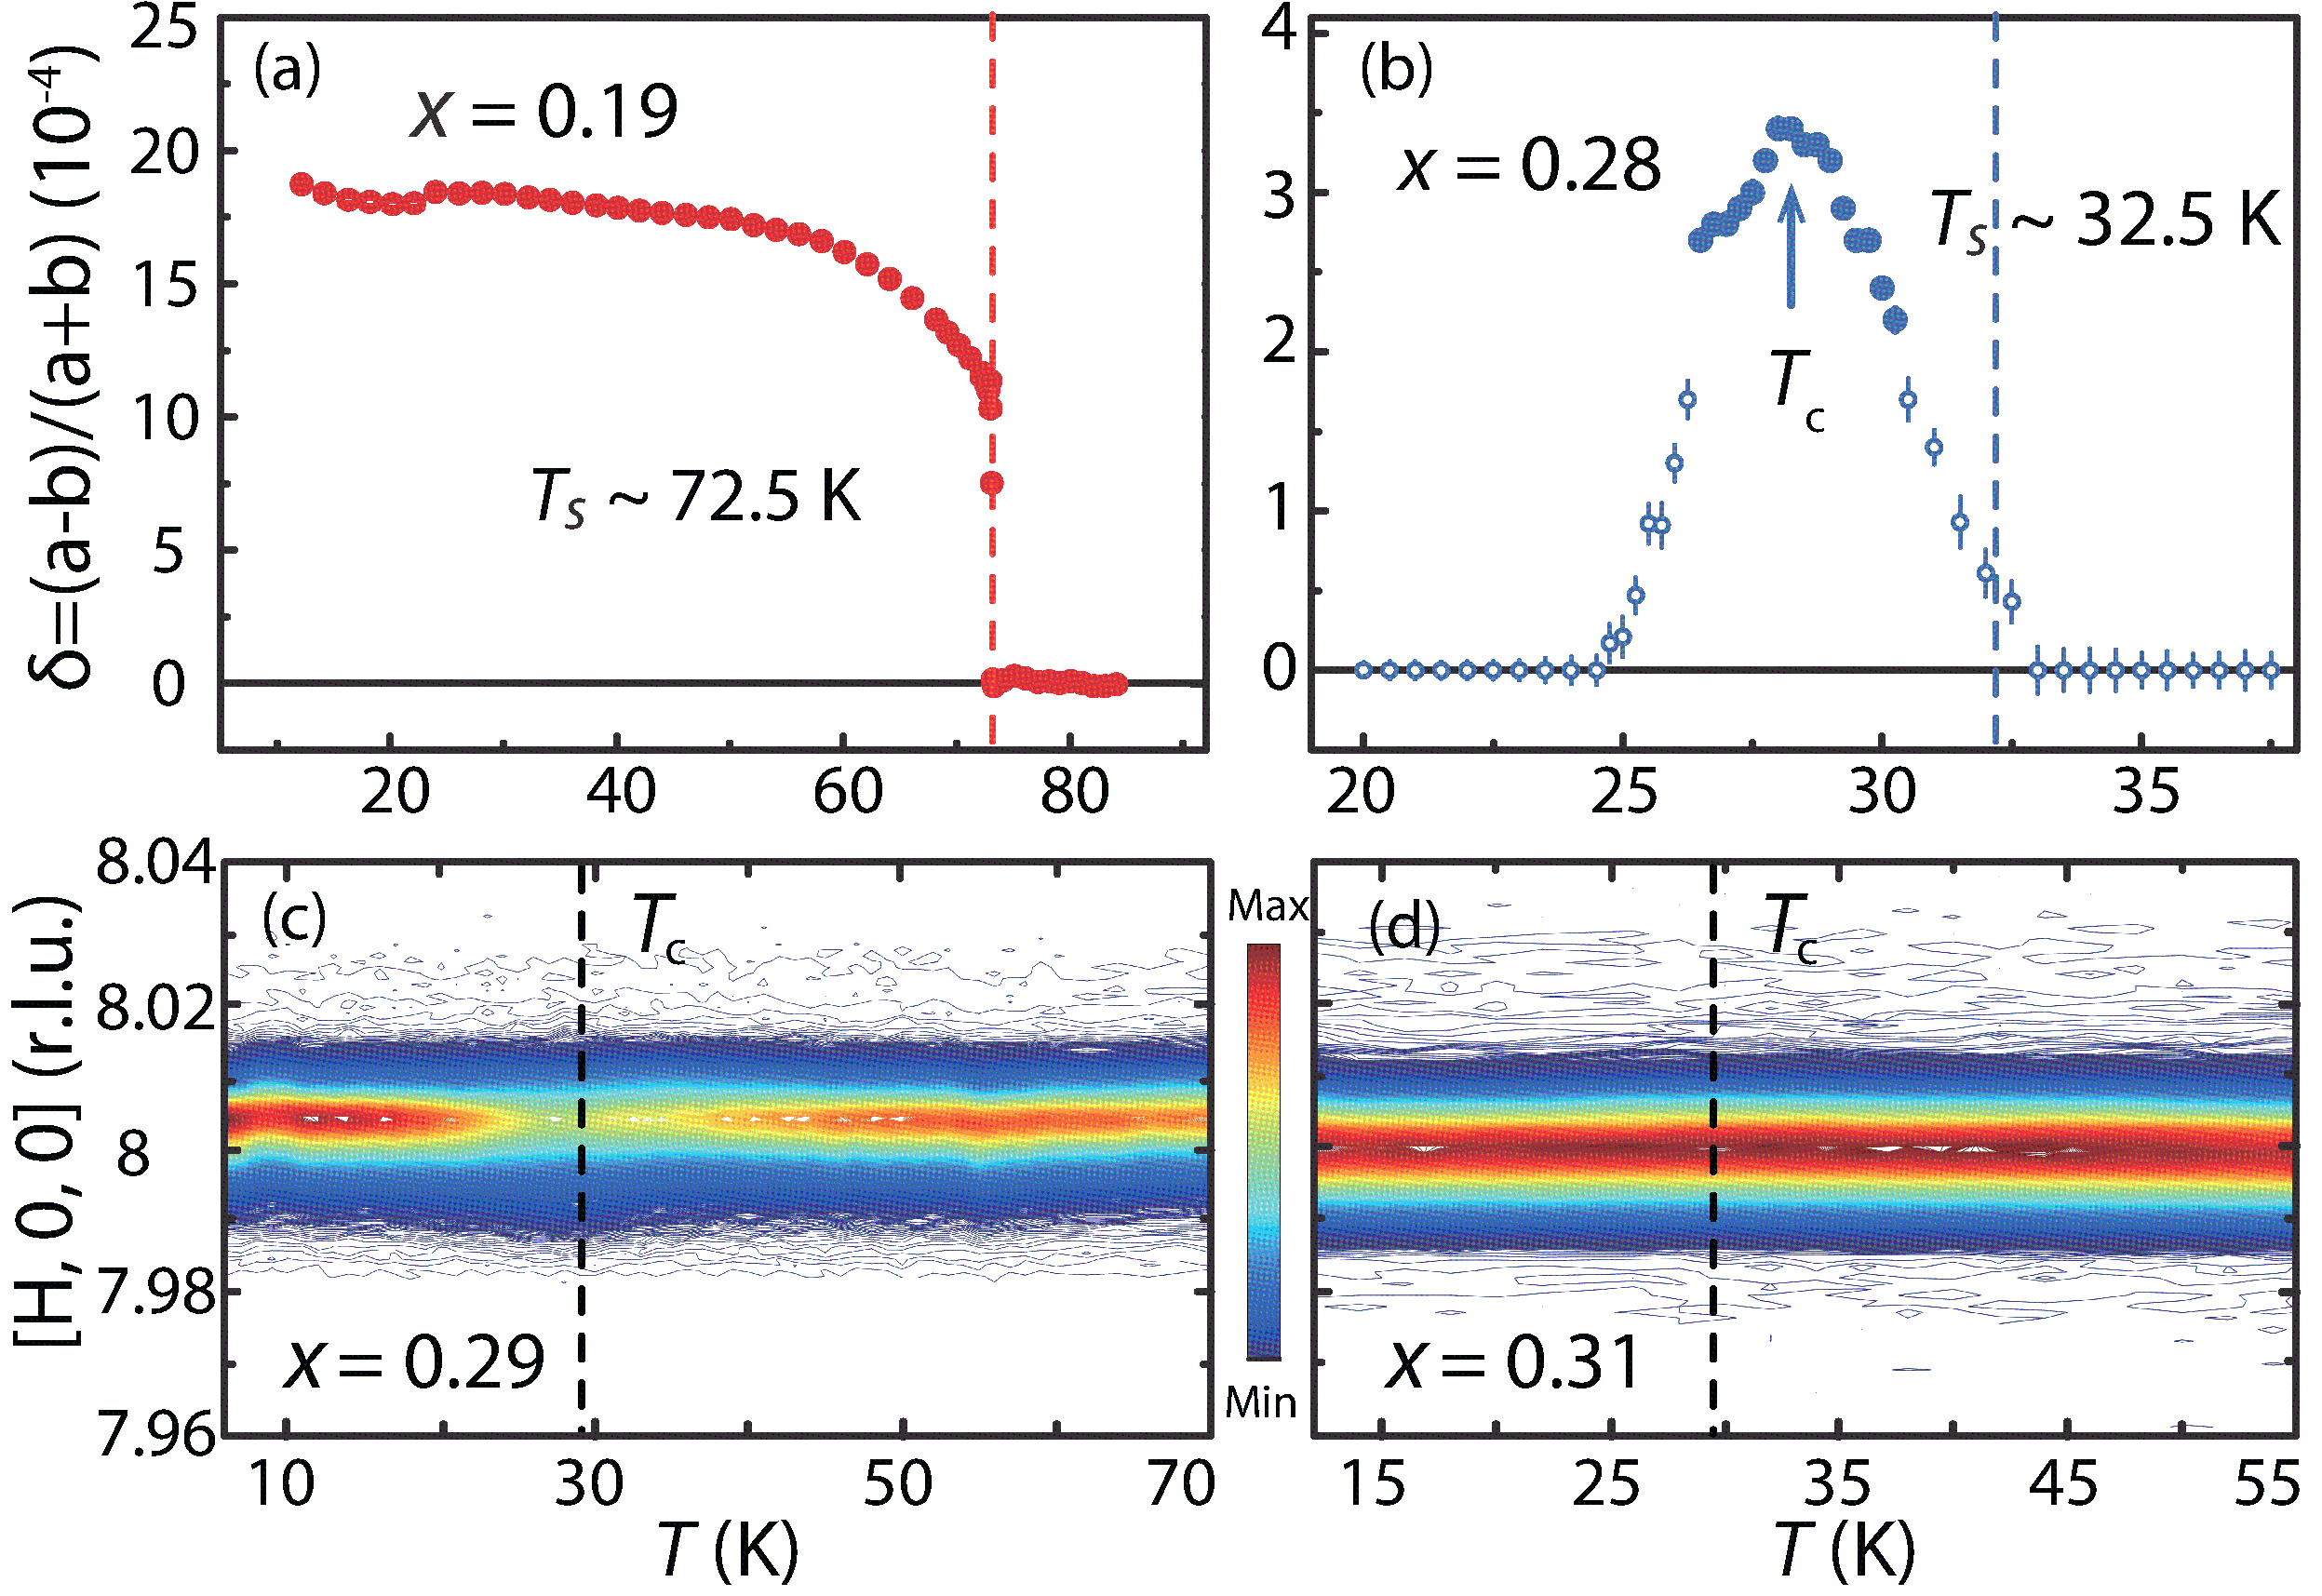
Figure 1(c) summarizes the phase diagram of BaFe2(As1-xPx)2 as determined from our experiments. Similar to previous work on powder samples with allred , we find that the structural and AF phase transitions for single crystals of , and 0.29 occur simultaneously within the sensitivity of our measurements (1 K). On approaching optimal superconductivity as , the structural and magnetic phase transition temperatures are suppressed to K for and then vanish suddenly for as shown in the inset of Fig. 1(c). Although superconductivity dramatically suppresses the lattice orthorhombicity and static AF order in , there are still remnant static AF order at temperatures well below . However, we find no evidence of static AF order and lattice orthorhombicity for and 0.31 at all temperatures. Since our NMR measurements on the sample suggest that the magnetic order takes place in about 50% of the volume fraction, the coupled and AF phase in BaFe2(As1-xPx)2 becomes a homogeneous superconducting phase in the weakly first order fashion, separated by a phase with coexisting AF clusters and superconductivity [dashed region in Fig. 1(c)].
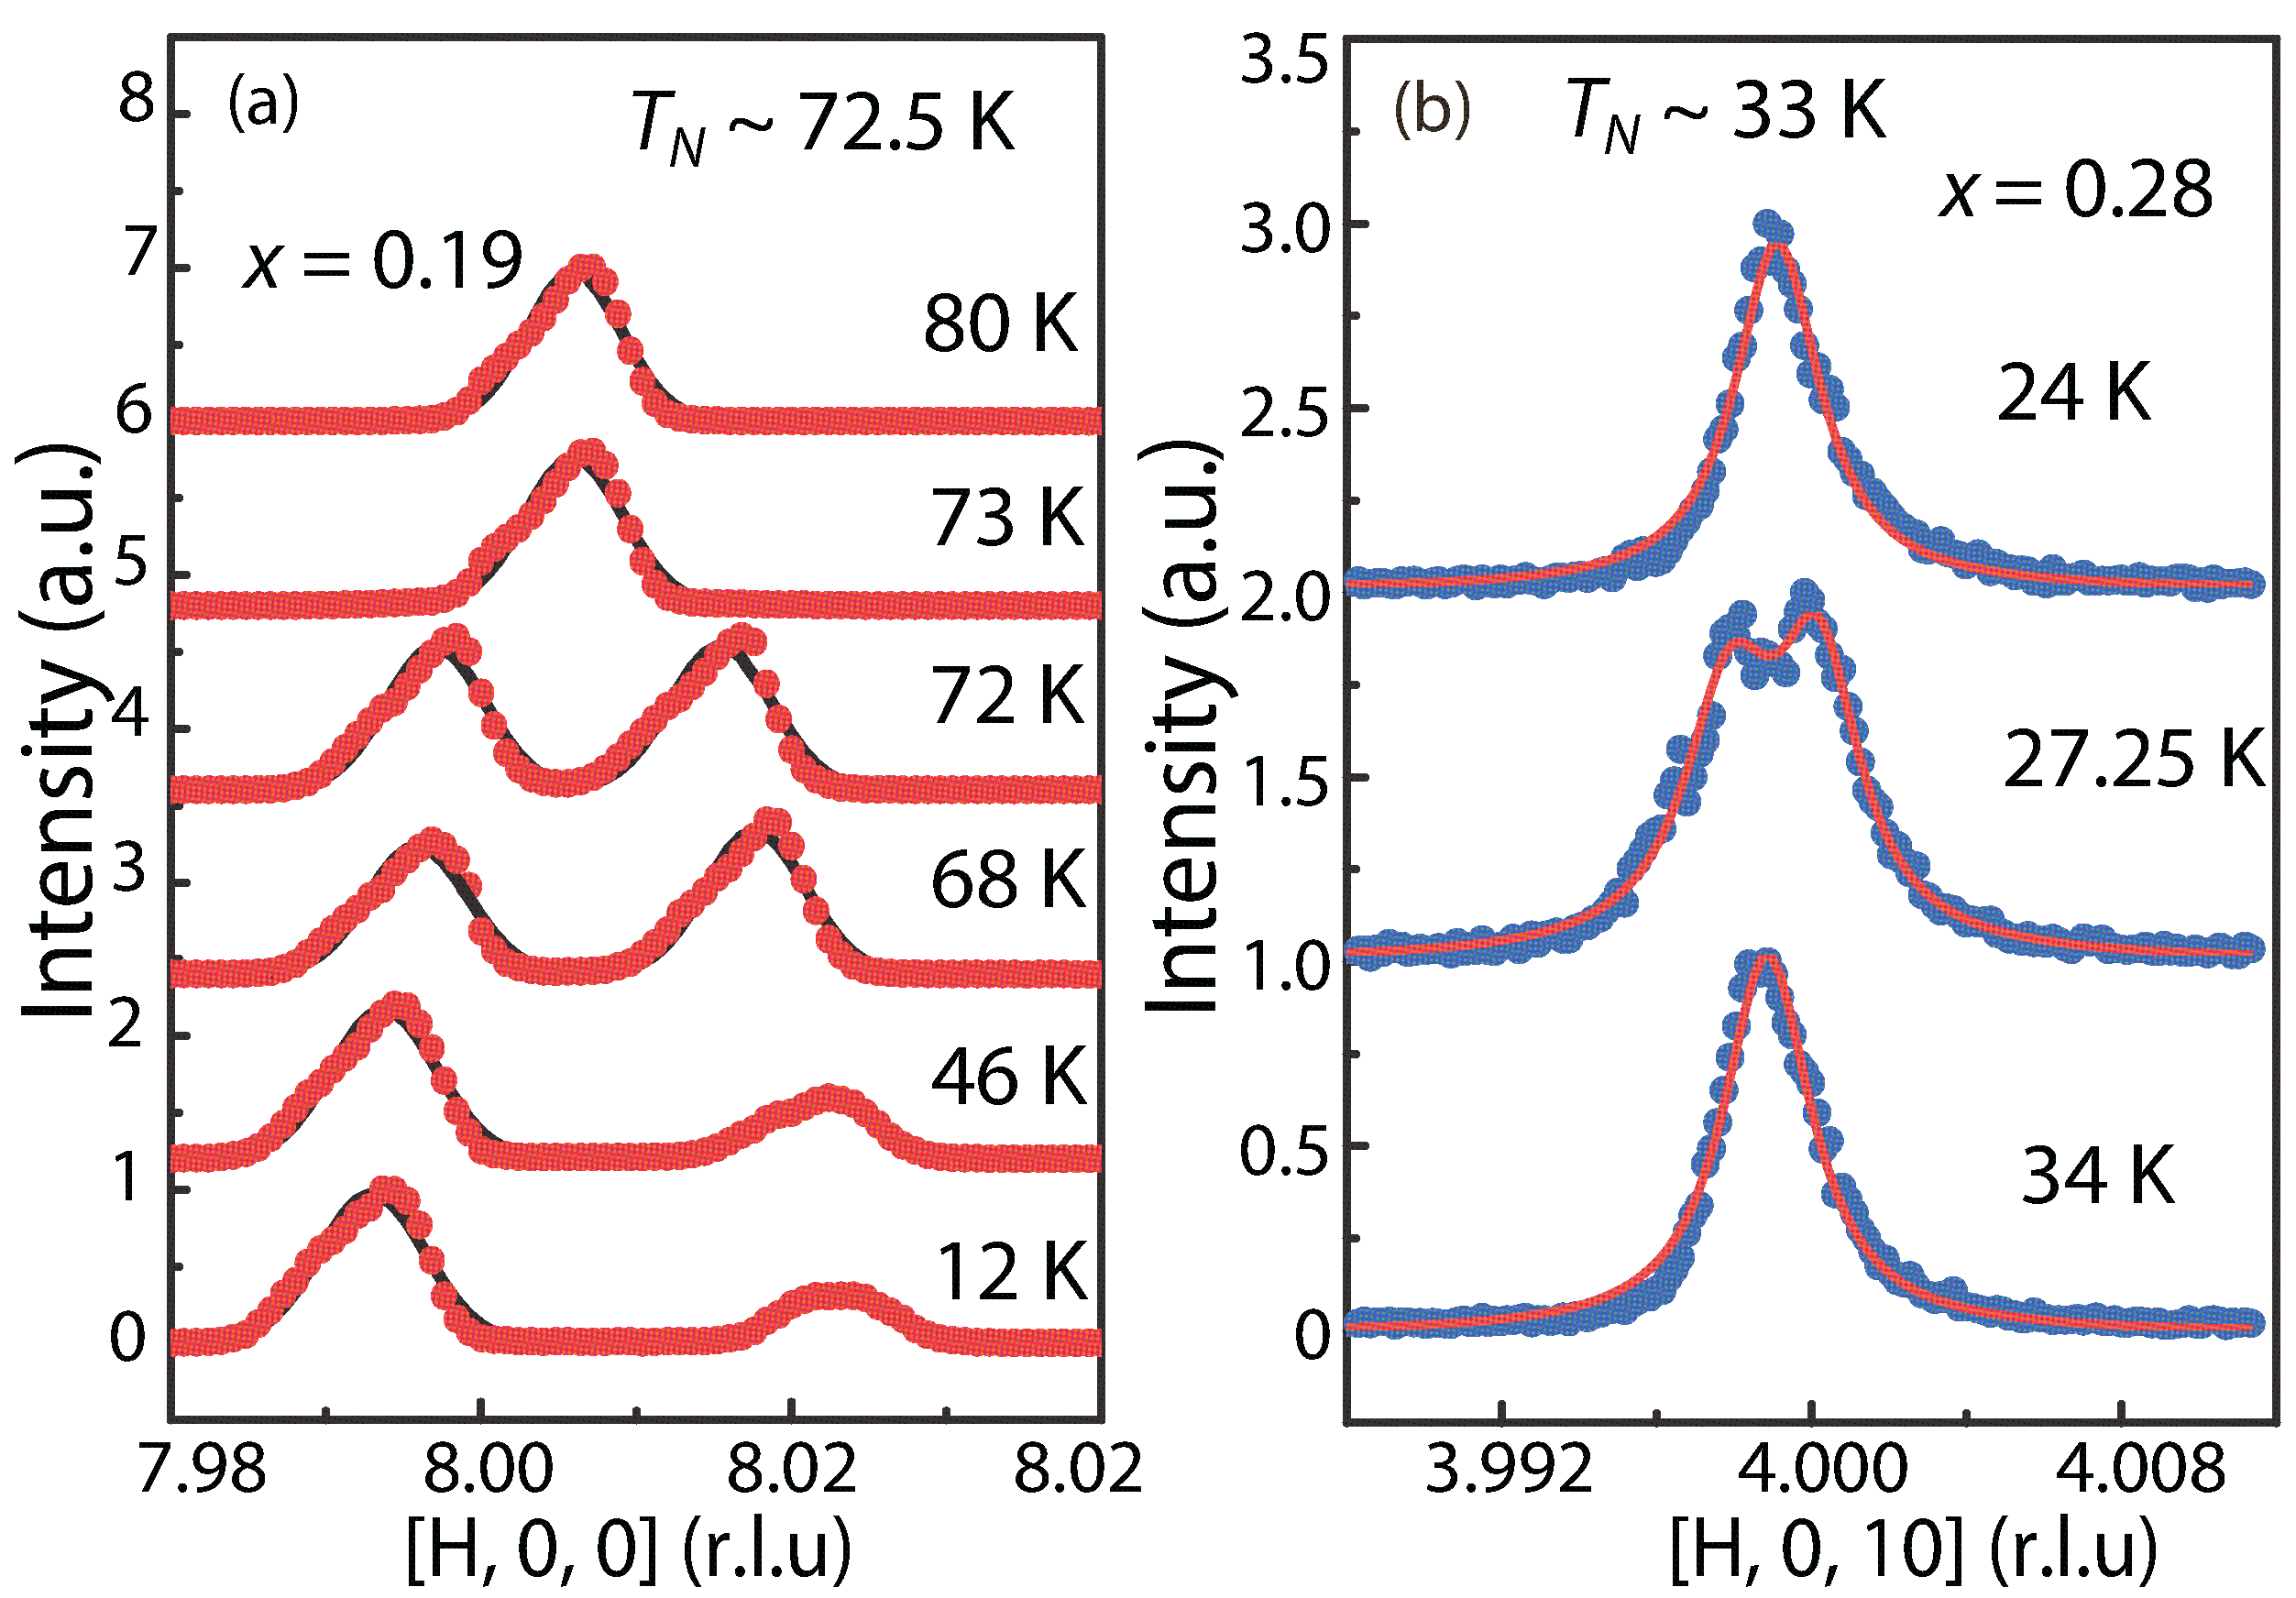
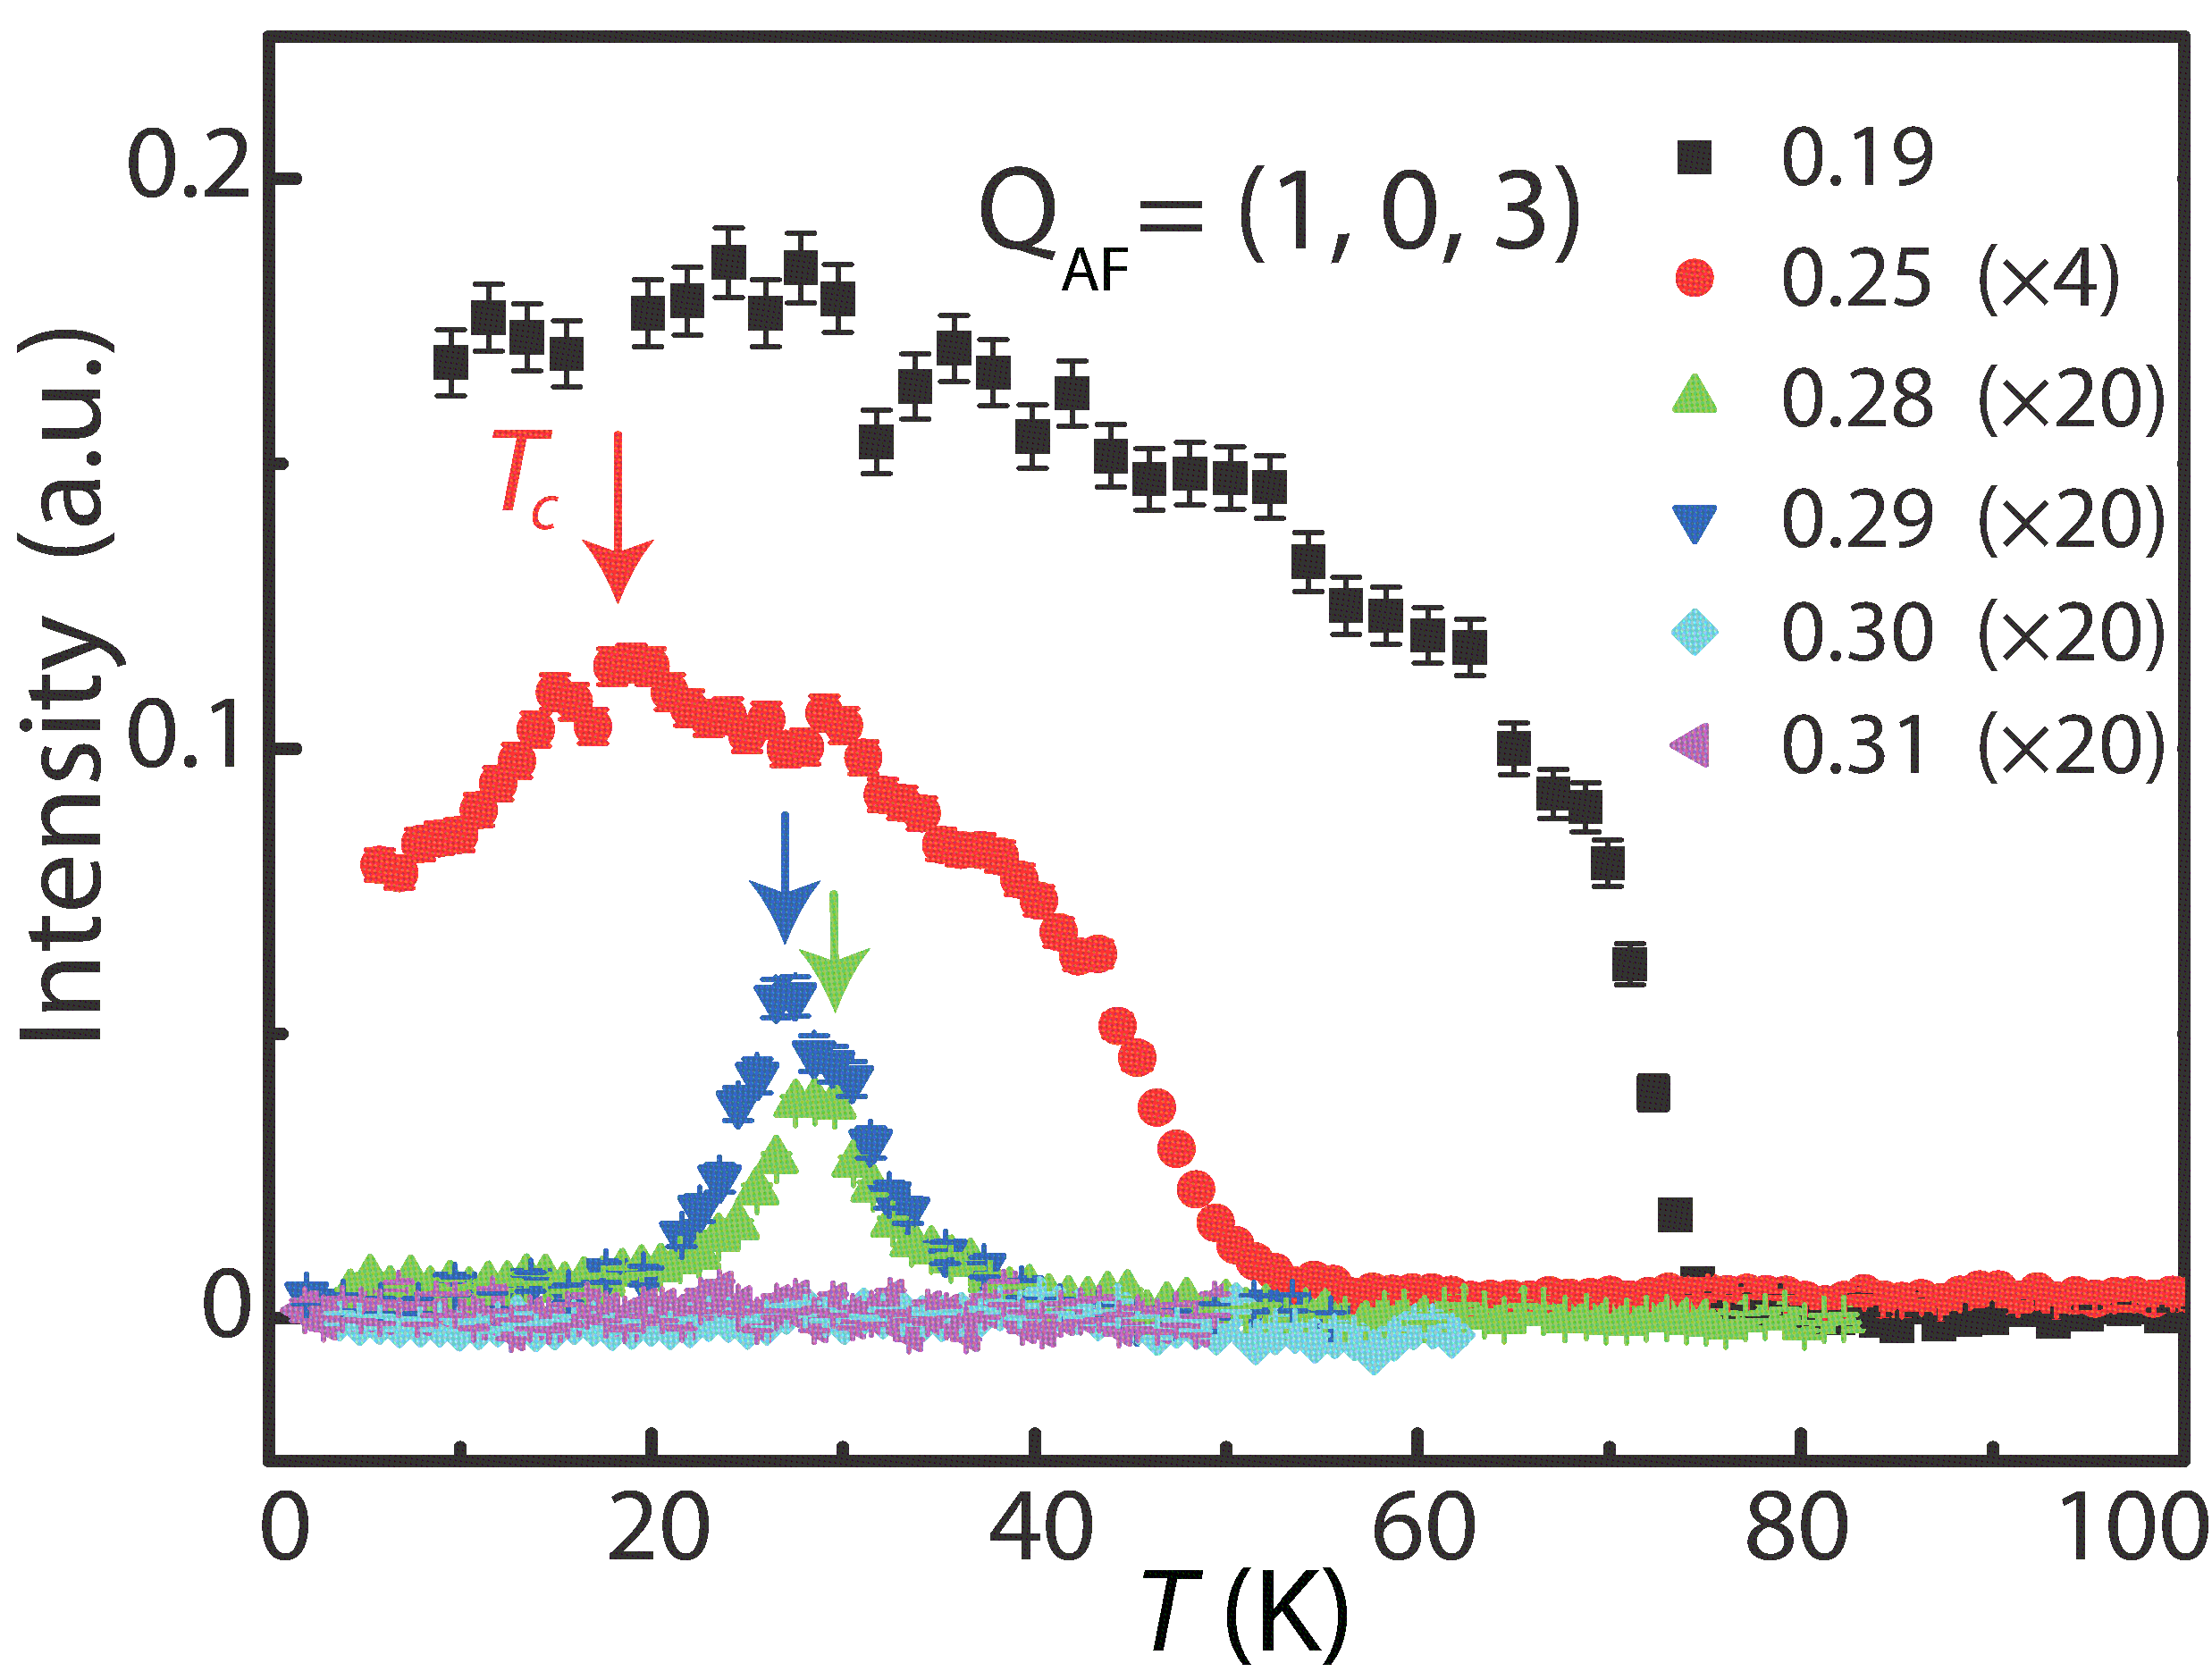
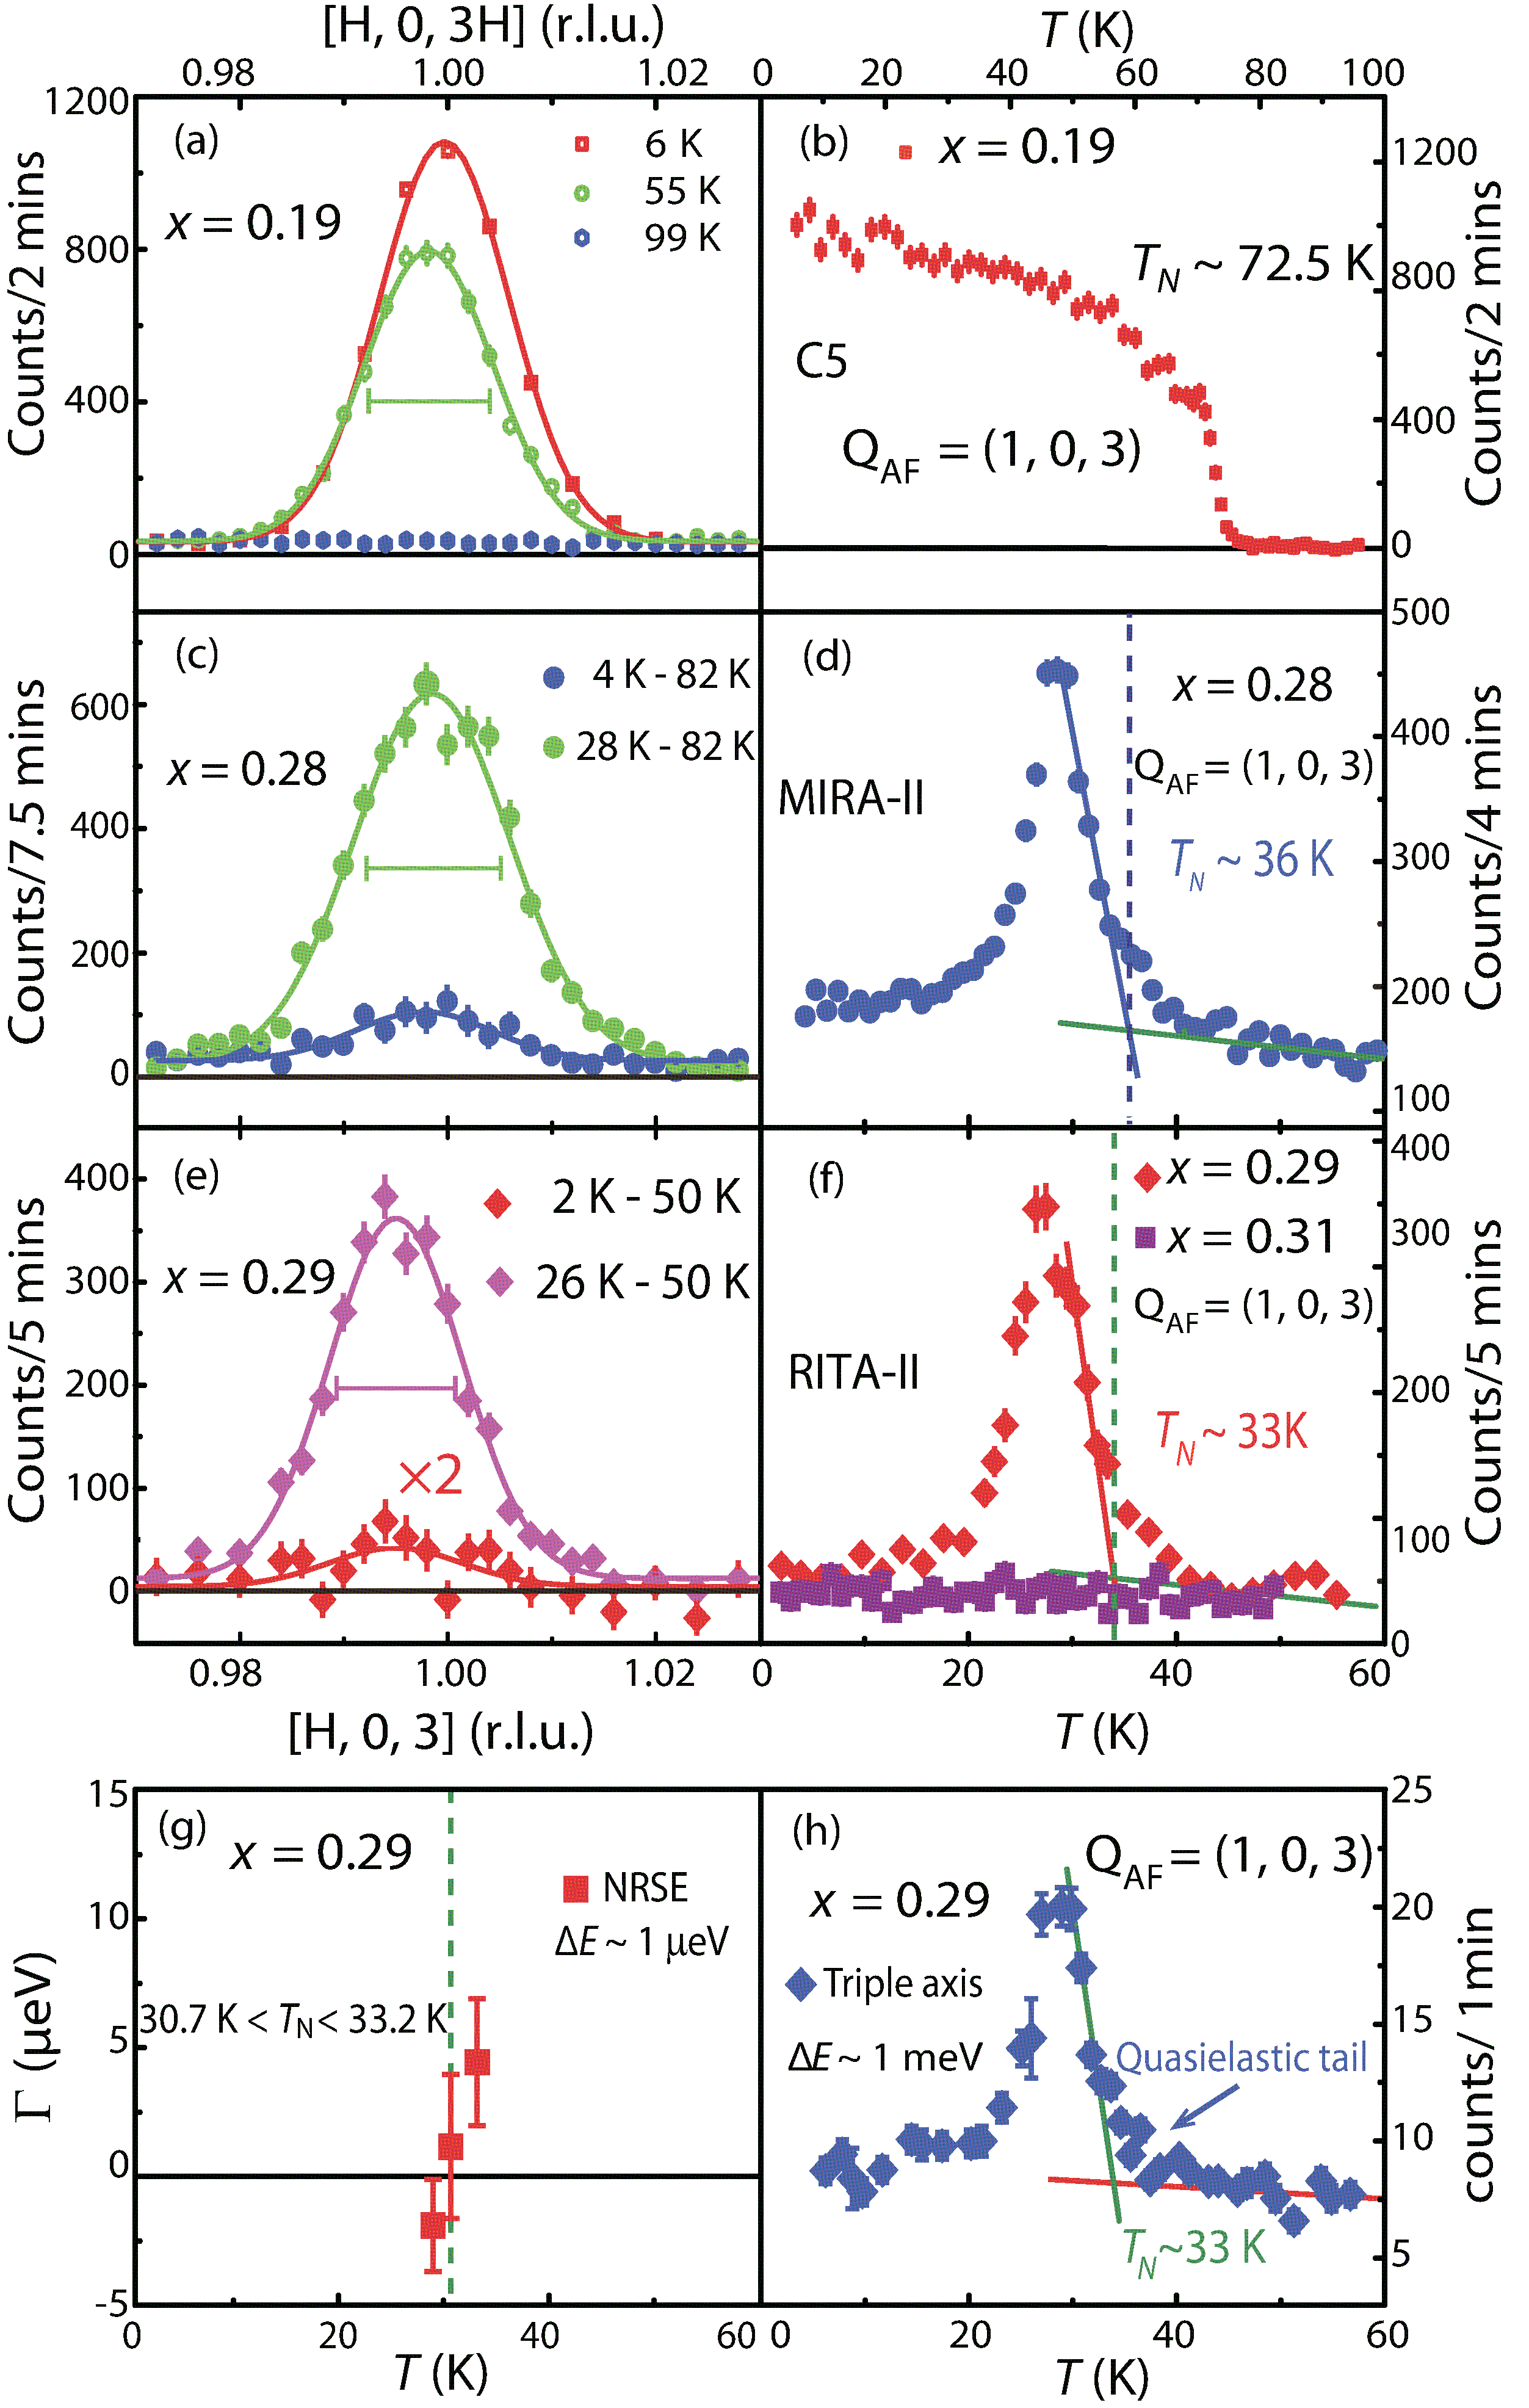
To establish the phase diagram in Fig. 1(c), we first present neutron scattering data aimed at determining the Nel temperatures of BaFe2(As1-xPx)2. Figure 2(a) shows scans along the direction at different temperatures for the sample. The instrumental resolution limited peak centered at disappears at 99 K above [Fig. 2(a)]. Figure 2(b) shows the temperature dependence of the scattering at , which reveals a rather sudden change at K consistent with the first order nature of the magnetic transition allred . Figure 2(c) plots scans through the Bragg peak showing the temperature differences between 28 K (4 K) and 82 K for the sample. There is a clear resolution-limited peak centered at at 28 K indicative of the static AF order, and the scattering is suppressed but not eliminated at 4 K. Figure 2(d) shows the temperature dependence of the scattering at , revealing a continuously increasing magnetic order parameter near and a dramatic suppression of the magnetic intensity below . Figures 2(e) and 2(f) indicate that the magnetic order in the sample behaves similar to that of the crystal without much reduction in . On increasing the doping levels to supplementary and 0.31 [Fig. 2(f)], we find no evidence of magnetic order above 2 K. Given that the magnetic order parameters near for the samples look remarkably like those of the spin cluster phase in electron-doped Ba(Fe)2As2 near optimal superconductivity xylu ; xylu14 , we have carried out additional neutron scattering measurements on the sample using TRISP, which can operate as a normal thermal triple-axis spectrometer with instrumental energy resolution of meV and a NRSE triple-axis spectrometer with eV keller . Fig. 2(h) shows the triple-axis mode data which reproduces the results in Fig. 2(f). However, identical measurements using NRSE mode reveals that the magnetic scattering above 30.7 K is quasielastic and the spins of the system freeze below 30.7 K on a time scale of s xylu14 . This spin freezing temperature is almost identical to those of nearly optimally electron-doped Ba(Fe)2As2 hqluo ; xylu ; xylu14 .
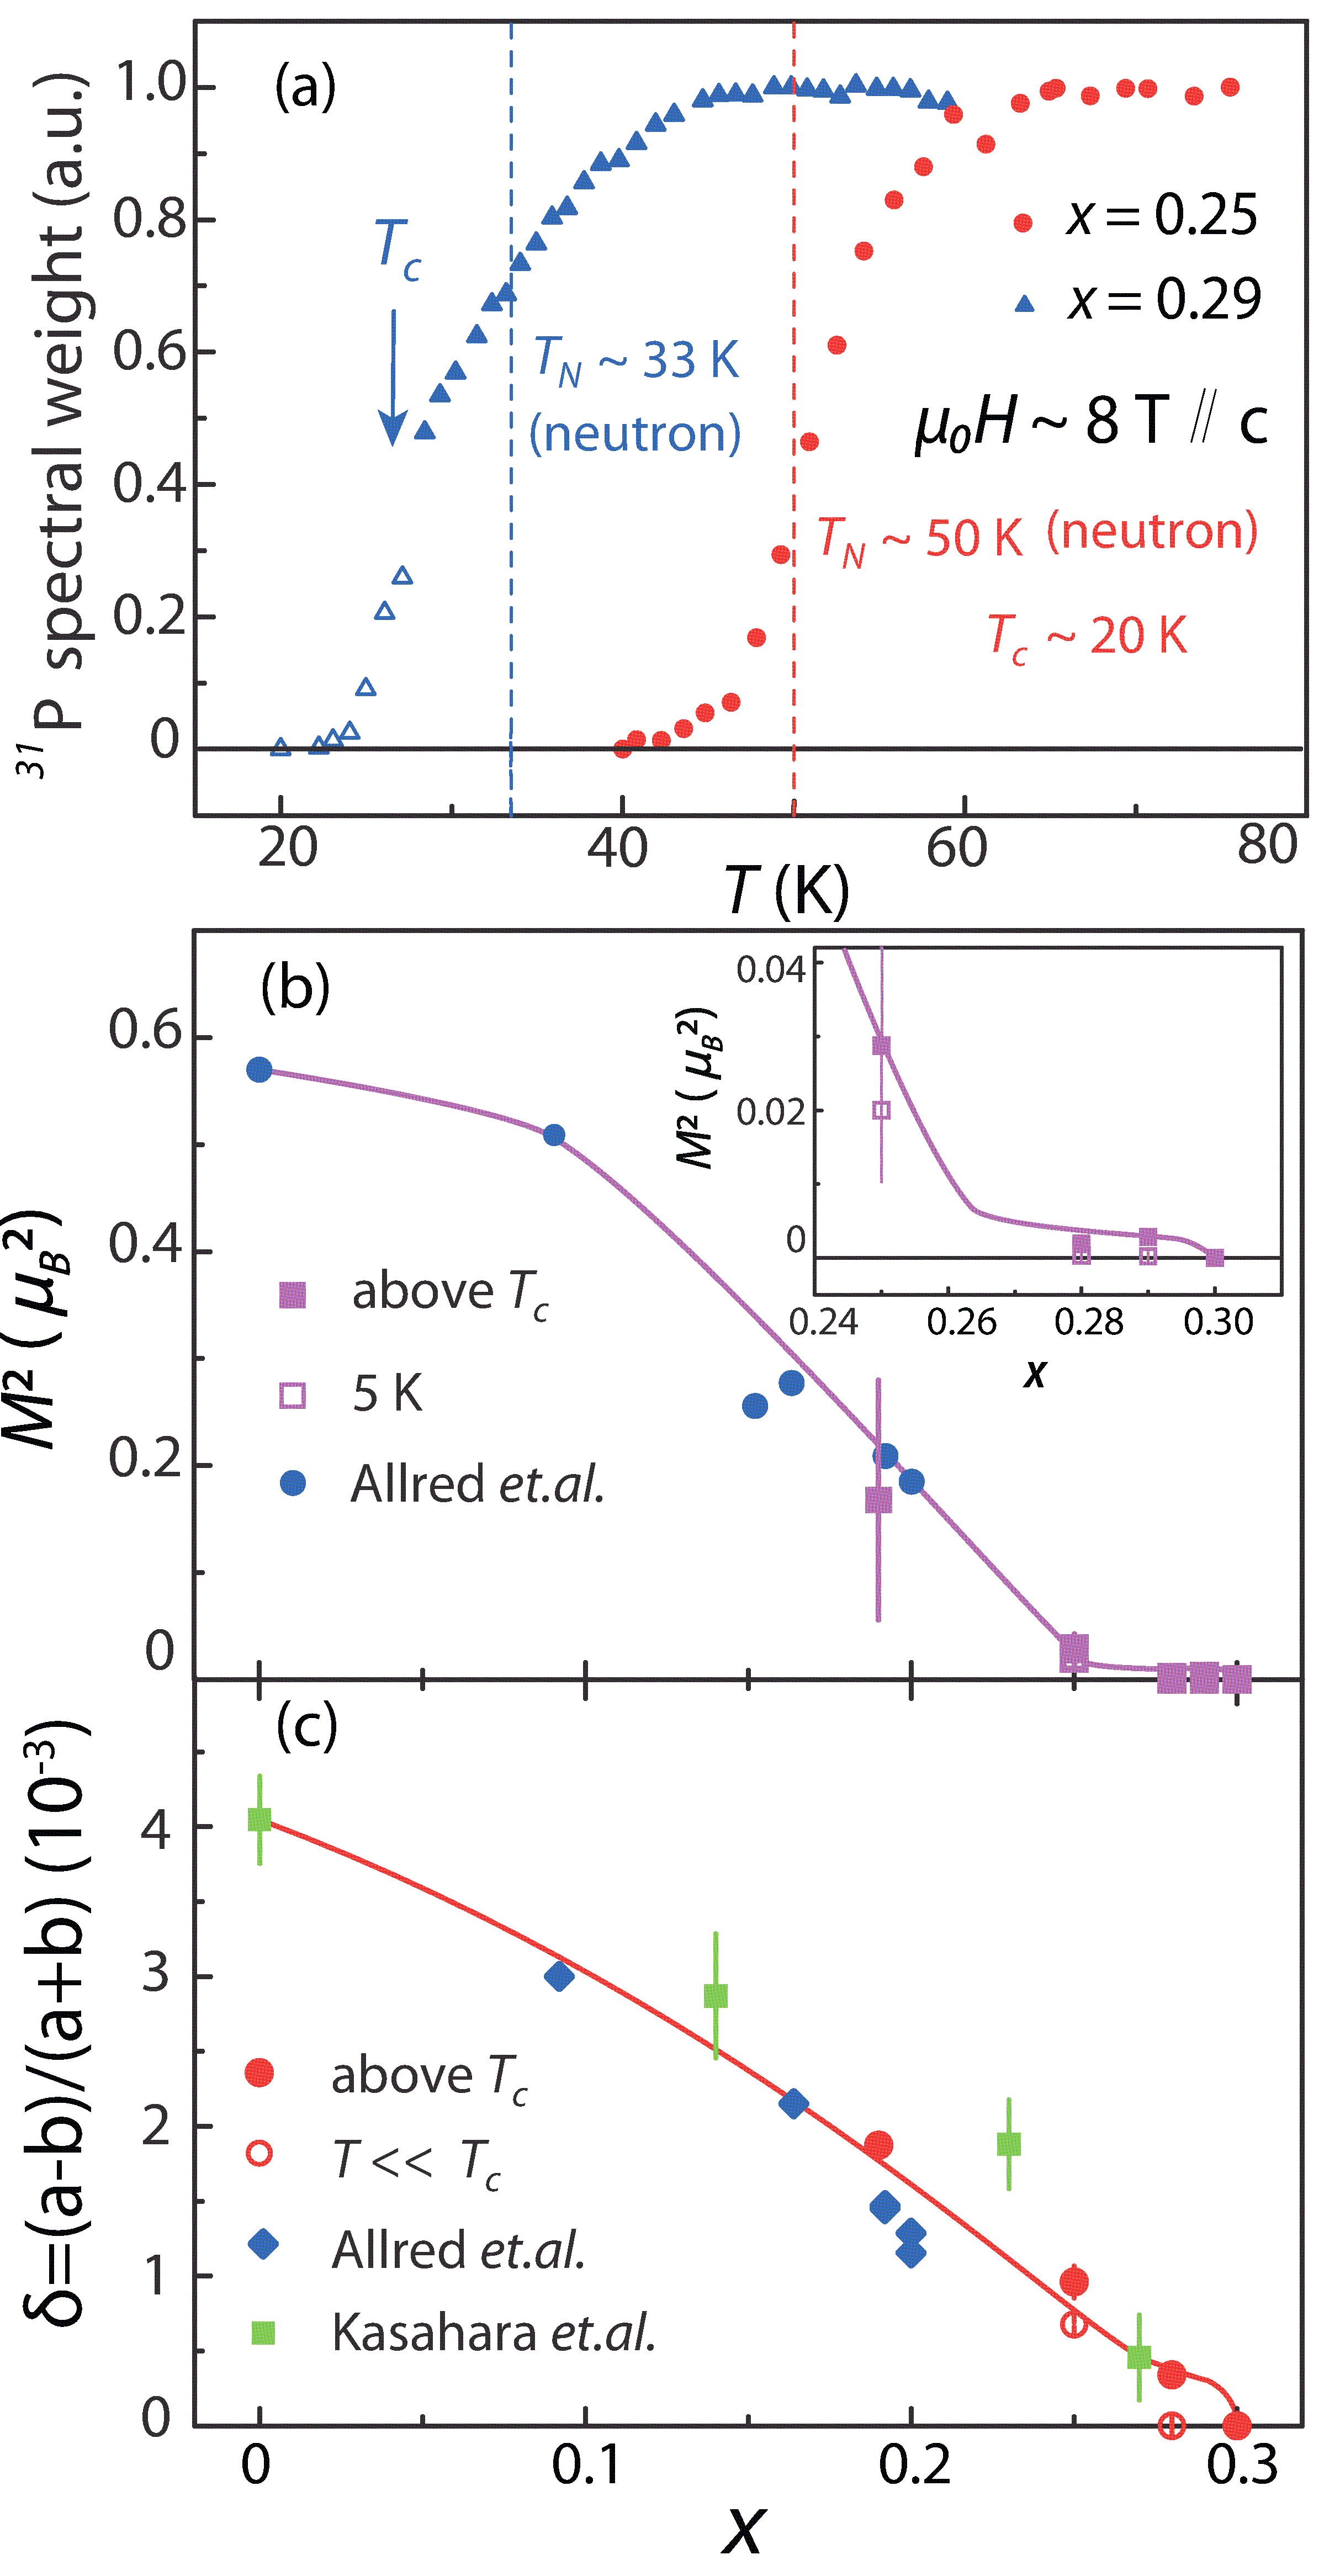
Figure 3 summarizes the key results of our x-ray scattering measurements carried out on identical samples as those used for neutron scattering experiments. To facilitate quantitative comparison with the results on Ba(Fe)2As2, we define the lattice orthorhombicity nandi ; xylu . Figure 3(a) shows the temperature dependence of for BaFe2(As1-xPx)2 with , obtained by fitting the two Gaussian peaks in longitudinal scans along the nuclear Bragg peak supplementary . We find that the lattice orthorhombicity exhibits a first order like jump below K consistent with previous neutron scattering results allred ; supplementary . We also note that the lattice distortion value of is similar to those of Ba(Fe)2As2 with K nandi ; xylu .
Figure 3(b) shows the temperature dependence of estimated for the sample. In contrast to the sample, we only find clear evidence of lattice orthorhombicity in the temperature region of K [filled circles in Fig. 3(b)] supplementary . The open symbols represent estimated from the enlarged half width of single peak fits supplementary . Although the data suggests a re-entrant tetragonal phase and vanishing lattice orthorhombicity at low temperature, the presence of weak collinear AF order seen by neutron scattering [Figs. 2(c) and 2(d)] indicates that the AF ordered parts of the sample should still have orthorhombic lattice distortion nandi ; xylu . Figure 3(c) and 3(d) shows temperature dependence of the longitudinal scans along the direction for the and 0.31 samples, respectively. While the lattice distortion in the sample behaves similarly as that of the crystal, there are no observable lattice distortions in the probed temperature range for the sample.
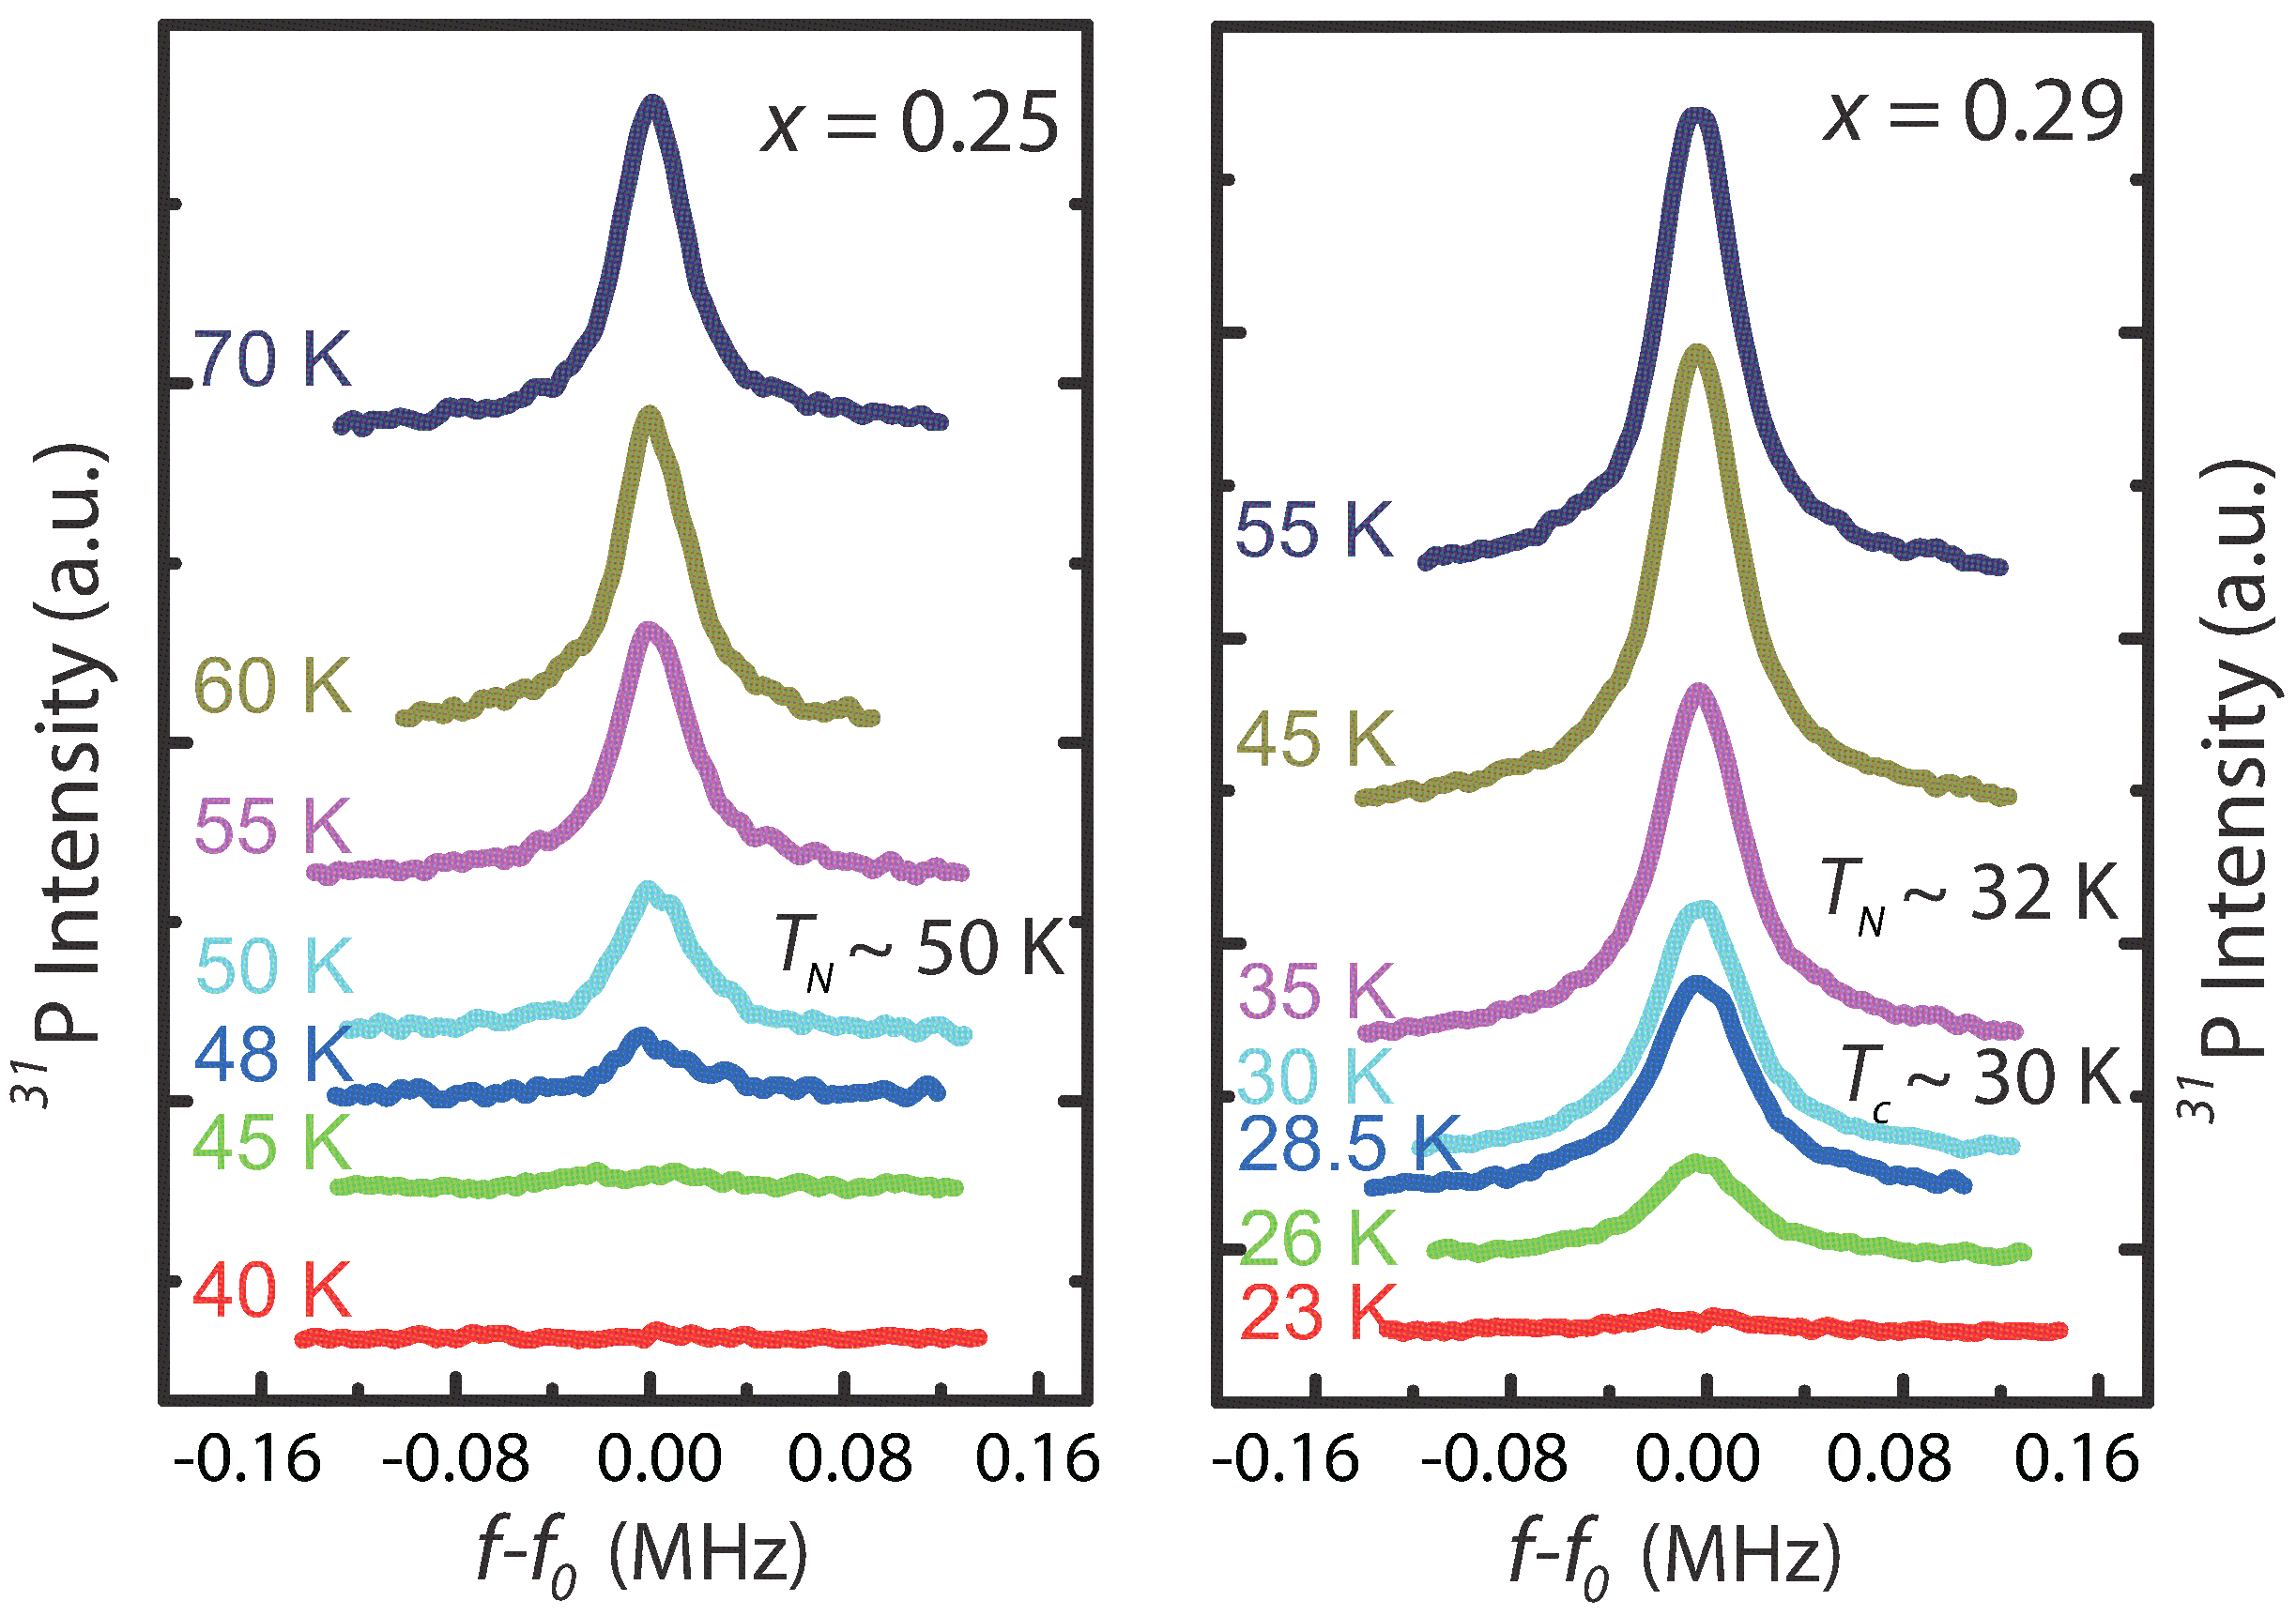
To further test the nature of the magnetic ordered state in BaFe2(As1-xPx)2, we have carried out 31P NMR measurements under a 8-T -axis aligned magnetic field supplementary . Figure 4(a) shows the temperature dependence of the integrated spectral weight of the paramagnetic signal, normalized by the Boltzmann factor, for single crystals with and 0.29. For , the paramagnetic spectral weight starts to drop below 60 K and reaches zero at 40 K, suggesting a fully ordered magnetic state below 40 K. For , the paramagnetic to AF transition becomes much broader, and the magnetic ordered phase is estimated to be about 50% at K. Upon further cooling, the paramagnetic spectral weight drops dramatically below because of radio frequency screening. We find that the lost NMR spectral weight above is not recovered at other frequencies, suggesting that the magnetic ordered phase does not take full volume of the sample similar to the spin-glass state of Ba(Fe)2As2 hqluo ; xylu ; xylu14 .
Figure 4(b) shows the P-doping dependence of the ordered moment squared in BaFe2(As1-xPx)2 including data from Ref. allred . While gradually decreases with increasing for , it saturates to at temperatures just above for and 0.29 before vanishing abruptly for . The inset in Fig. 4(b) shows the P-doping dependence of the above and below near optimal superconductivity. While superconductivity dramatically suppresses , it does not eliminate the ordered moment. Figure 4(c) shows the P-doping dependence of in BaFe2(As1-xPx)2 below and above . Consistent with the P-doping dependence of [Fig. 4(b)] and [Fig. 1(c)], we find that above approaches to near optimal superconductivity before vanishing at .
Summarizing the results in Figs. 2-4, we present the refined phase diagram of BaFe2(As1-xPx)2 in Fig. 1(c). While the present phase diagram is mostly consistent with the earlier transport and neutron scattering work on the system at low P-doping levels Shibauchi14 ; allred , we have discovered that the magnetic and structural transitions still occur simultaneously above for approaching optimal superconductivity, and both order parameters vanish at optimal superconductivity with . Since our NMR and TRISP measurements for samples near optimal superconductivity suggests spin-glass-like behavior, we conclude that the static AF order in BaFe2(As1-xPx)2 disappears in the weakly first order fashion near optimal superconductivity. Therefore, AF order in phosphorus-doped iron pnictides coexists and competes superconductivity near optimal superconductivity, much like the electron-doped iron pnictides with an avoided QCP. From the phase diagrams of hole-doped BaFe2As2 Avci2012 ; Avci2014 ; Waber ; bohmer , it appears that a QCP may be avoided there as well.
We thank Q. Si for helpful discussions. The work at IOP, CAS, is supported by MOST (973 project: 2012CB821400, 2011CBA00110, and 2015CB921302) , NSFC (11374011 and 91221303) and CAS (SPRP-B: XDB07020300). The work at Rice is supported by U.S. NSF, DMR-1362219 and by the Robert A. Welch Foundation Grants No. C-1839. This research used resources of the APS, a User Facility operated for the DOE Office of Science by ANL under Contract No. DE-AC02-06CH11357. Ames Laboratory is operated for the U.S. DOE by Iowa State University through Contract No. DE-AC02-07CH11358.
References
- (1) Y. Kamihara, T. Watanabe, M. Hirano, and H. Hosono, J. Am. Chem. Soc. 130, 3296-3297 (2008).
- (2) C. de la Cruz et al., Nature (London) 453,899 (2008).
- (3) Q. Huang, Y. Qiu, Wei Bao, M. A. Green, J. W. Lynn, Y. C. Gasparovic, T. Wu, G. Wu, and X. H. Chen, Phys. Rev. Lett. 101, 257003 (2008).
- (4) M. G. Kim, R. M. Fernandes, A. Kreyssig, J. W. Kim, A. Thaler, S. L. Bud’ko, P. C. Canfield, R. J. McQueeney, J. Schmalian, and A. I. Goldman, Phys. Rev. B 83, 134522 (2011).
- (5) P. Dai, J. Hu, and E. Dagotto, Nature Phys. 8, 709 (2012).
- (6) M. Rotter, M. Tegel, and D. Johrendt, Phys. Rev. Lett. 101, 107006 (2008).
- (7) R. Cortes-Gil, D. R. Parker, M. J. Pitcher, J. Hadermann, and S. J. Clarke, Chem. Mater. 22, 4304 (2010).
- (8) S. Avci et al., Phys. Rev. B 85, 184507 (2012).
- (9) S. Avci et al., Nat. Commun. 5, 3845 (2014).
- (10) F. Waer et al., Phys. Rev. B 91, 060505(R) (2015).
- (11) A. E. Bhmer, F. Hardy, L. Wang, T. Wolf, P. Schweiss, and C. Meingast, arXiv: 1412.7038v2.
- (12) P. C. Canfield and S. L. Bud’ko, Annu. Rev. Condens. Matter Phys. 1, 27 (2010).
- (13) I. R. Fisher, L. Degiorgi, and Z.-X. Shen, Rep. Prog. Phys. 74, 124506 (2011).
- (14) C. Bernhard, C. N. Wang, L. Nuccio, L. Schulz, O. Zaharko, J. Larsen, C. Aristizabal, M. Willis, A. J. Drew, G. D. Varma, T. Wolf, and C. Niedermayer, Phys. Rev. B 86, 184509 (2012).
- (15) F. L. Ning, K. Ahilan, T. Imai, A. S. Sefat, M. A. McGuire, B. C. Sales, D. Mandrus, P. Cheng, B. Shen, and H.-H. Wen, Phys. Rev. Lett. 104, 037001 (2010).
- (16) R. Zhou, Z. Li, J. Yang, D. L. Sun, C. T. Lin, and G.-Q. Zheng, Nat. Commun. 4, 2265 (2013).
- (17) A. P. Dioguardi et al., Phys. Rev. Lett. 111, 207201 (2013).
- (18) C. Lester, J.-H. Chu, J. G. Analytis, S. C. Capelli, A. S. Erickson, C. L. Condron, M. F. Toney, I. R. Fisher, and S. M. Hayden, Phys. Rev. B 79, 144523 (2009).
- (19) S. Nandi et al., Phys. Rev. Lett. 104, 057006 (2010).
- (20) D. K. Pratt et al., Phys. Rev. Lett. 106, 257001 (2011).
- (21) H. Luo et al., Phys. Rev. Lett. 108, 247002 (2012).
- (22) X. Y. Lu et al., Phys. Rev. Lett. 110, 257001 (2013).
- (23) X. Y. Lu et al., Phys. Rev. B 90, 024509 (2014).
- (24) E. Abrahams and Q. Si, J. Phys. Condens. Matter 23, 223201 (2011).
- (25) S. Jiang, C. Wang, Z. Ren, Y. Luo, G. Cao, and Z.-A. Xu, J. Phys. Condens. Matter 21, 382203 (2009).
- (26) H. Shishido et al., Phys. Rev. Lett. 104, 057008 (2010).
- (27) C. J. van der Beek, M. Konczykowski, S. Kasahara, T. Terashima, R. Okazaki, T. Shibauchi, and Y. Matsuda, Phys. Rev. Lett. 105, 267002 (2010).
- (28) S. Kasahara, T. Shibauchi, K. Hashimoto, K. Ikada, S. Tonegawa, R. Okazaki, H. Shishido, H. Ikeda, H. Takeya, K. Hirata, T. Terashima, and Y. Matsuda, Phys. Rev. B 81, 184519 (2010).
- (29) K. Hashimoto et al., Science 336, 1554 (2012).
- (30) T. Shibauchi, A. Carrington, and Y. Matsuda, Annu. Rev. Condens. Matter Phys. 5, 113 (2014).
- (31) P. Walmsley et al., Phys. Rev. Lett. 110, 257002 (2013).
- (32) J. G. Analytis, H.-H. Kuo, R. D. McDonald, M. Wartenbe, P. M. C. Rourke, N. E. Hussey, and I. R. Fisher, Nat. Phys. 10, 194 (2014).
- (33) Y. Nakai, T. Iye, S. Kitagawa, K. Ishida, H. Ikeda, S. Kasahara, H. Shishido, T. Shibauchi, Y. Matsuda, and T. Terashima, Phys. Rev. Lett. 105, 107003 (2010).
- (34) J. M. Allred et al., Phys. Rev. B 90, 104513 (2014).
- (35) T. Keller, K. Habicht, H. Klann, M. Ohl, H. Schneier, and B. Keimer, Appl. Phys. A 74, s332 (2002).
- (36) See supplemental Material for a detailed discussion on the experimental setup and additional data.
- (37) M. Nakajima, S. Uchida, K. Kihou, C. H. Lee, A. Iyo, and H. Eisaki, J. Phys. Soc. Jpn. 81, 104710 (2012).
Appendix A Supplementary information
Section A: Details of the neutron and X-ray scattering, and NMR experiments
Neutron scattering experiments:
We have aligned the 0.19 samples in the [] scattering plane and the 0.25, 0.28, 0.29, 0.30, 0.31 samples in the [] zone.For neutron scattering measurements of the 0.19 compound at C5 spectrometer, we used a vertically focused PG(002) monochrometor and a flat PG(002) analyzer with a fixed final energy =14.56 meV. We useda PG filter after the sample to eliminate the higher order neutrons.At RITA-II, we use a PG filter before the sample and a cold Be-filter after the sample with the final neutron energy fixed at 4.6 meV. For MIRA measurements, the final energy was set to 4.06 meV and a Be-filter was additionally used as a filter.
In addition to usual neutron diffraction experiments, we have also carried out measurements on TRISP at MLZ, Germany. The experimental set these measurements are described in detail in Ref. [17] of the main text.
X-ray scattering experiments:
The high resolution X-ray diffraction of the 0.28 sample was performed using a four circle diffractometer and Cu X-ray radiation from a rotating anode X-ray source at Ames Lab. We have used beamline 6-ID-D at the Advanced Photon Source at Argonne National Laboratory with 100.2 keV incident photon beam for measurements of the 0.19, 0.25, 0.29, 0.30, 0.31 compounds.The NMR measurements were performed by the Spin-echo technique, and the paramagnetic spectral weights were obtained by integrating the spectral intensity at the resonance frequency of the paramagnetic phase.
Section B:additional transport, X-ray and neutron scattering data:
We have carried careful transport measurement using 4 probe method in a physical property measurement system. Our systematic measurements of the resistivity for different doping concentrations are shown in Fig. S1. Typical raw data for X-ray scattering experiments is shown in Fig. S2 for the 0.19 and 0.28. The presence of two peaks along the [] direction is a direct indication of lattice orthorhombicity. Figure S3 shows the temperature dependence of the magnetic order parameter for 0.19, 0.25, 0.28, 0.29, 0.30, 0.31 samples. Figure S4 shows the raw 31P NMR spectra for the 0.25 and 0.29 samples at different temperatures.