Radio-AGN Feedback: When the Little Ones were Monsters
Abstract
We present a study of the evolution of the fraction of radio-loud active galactic nuclei (AGN) as a function of their host stellar mass. We make use of two samples of radio galaxies: one in the local universe, , using a combined SDSS-NVSS sample and one at higher redshifts, , constructed from the VLA-COSMOS_DEEP Radio Survey at GHz and a Ks-selected catalogue of the COSMOS/UltraVISTA field. We observe an increase of more than an order of magnitude in the fraction of lower mass galaxies ( M☉) which host Radio-Loud AGN with radio powers W Hz-1at while the radio-loud fraction for higher mass galaxies ( M☉) remains the same. We argue that this increase is driven largely by the increase in cold or radiative mode accretion with increasing cold gas supply at earlier epochs. The increasing population of low mass Radio-Loud AGN can thus explain the upturn in the Radio Luminosity Function (RLF) at high redshift which is important for understanding the impact of AGN feedback in galaxy evolution.
keywords:
galaxies: active – radio continuum: galaxies – galaxies: evolution – galaxies: jets – galaxies: luminosity function, mass function – accretion, accretion discs1 Introduction
During recent years it has become increasingly apparent that the radio jets of radio-loud Active Galactic Nuclei (RL AGN or radio-AGN) play a crucial role in the process of galaxy formation and evolution via ‘AGN feedback’ (see e.g. Best et al., 2006, 2007; Bower et al., 2006; Croton et al., 2006; Fabian et al., 2006). This feedback can occur because the enormous energy output of the AGN can be injected into the surrounding medium, possibly also the fuel source of the AGN, via ionizing radiation and/or relativistic jets, thereby providing enough energy to affect star formation in the host galaxy. Radio galaxies have been shown to comprise two different populations: high and low excitation (Best et al., 2005; Tasse et al., 2008; Hickox et al., 2009), each of which may have a separate and different effect of feedback, the exact nature and evolution of which is still debated. The first population of RL AGN is associated with the classic optical ‘quasars’. These sources radiate across the electromagentic spectrum and are consistent with the unified models of quasars where emission is obscured at some wavelengths when the source is viewed edge-on (e.g. Barthel, 1989; Antonucci, 1993; Urry & Padovani, 1995). In this ‘high-excitation’, ‘cold mode’ or ‘radiative mode’, accretion is postulated to occur via an accretion disc in a radiatively efficient manner (e.g. Shakura & Sunyaev, 1973). These high excitation radio galaxies (HERGs) are typically hosted by lower mass, bluer galaxies in less dense environments (e.g. Tasse et al., 2008; Janssen et al., 2012). The second mode of radio activity was first noted by their lack of strong high-excitation narrow-line optical excitation expected from the ‘quasar’ mode (Hine & Longair, 1979; Laing et al., 1994; Jackson & Rawlings, 1997). Moreover they show no evidence of mid-infrared emission from dusty tori (Whysong & Antonucci, 2004; Ogle et al., 2006) and no evidence of accretion-related X-ray emission (Hardcastle et al., 2006; Evans et al., 2006). Hardcastle et al. (2007) first suggested that this mode, known as the ‘low-excitation’, ‘radio mode’, ‘hot mode’ or ‘jet mode’ occurs when hot gas is accreted directly onto the supermassive black hole in a radiatively inefficient manner via advection dominated accretion flows (ADAFs, e.g. Narayan & Yi, 1995). Best et al. (2005) showed that these low excitation radio galaxies (LERGs) are hosted by fundamentally different galaxies: higher mass, redder and occurring in more dense environments. This mode in particular provides a direct feedback connection between the AGN and its hot gas fuel supply in the manner of work done by the expanding radio lobes on the hot intra-cluster gas. For a more detailed review of the HERG versus LERG dichotomy see Heckman & Best (2014) and references therein.
In order to understand the relative significance of the different types of radio-AGN feedback we need to understand the cosmic evolution of radio sources in detail. It has been known for several decades that the comoving number density of powerful radio sources is two to three orders of magnitude greater at a redshift of two to three compared to the local Universe (e.g. Schmidt, 1968; Sandage, 1972; Osmer, 1982; Peacock, 1985; Schmidt et al., 1988; Dunlop & Peacock, 1990; Rigby et al., 2011). Similarly, the space density of optically selected quasars (QSOs) peaks at redshift (e.g. Boyle et al., 1988; Hewett et al., 1993; Warren et al., 1994). It is also well known that, within the local universe (), the fraction of galaxies which host a radio source, i.e. the radio-loud fraction, is a very steep function of host galaxy stellar mass (, Best et al., 2005), increasing to per cent at stellar masses above M☉ for radio luminosities W Hz-1. This pervasiveness of radio-loudness among high mass galaxies in the local Universe, combined with the dramatic increase in density of radio-loud sources at earlier times suggests that there must be an increase in the prevalence of radio activity among galaxies of lower mass. To test this, we investigate the fraction of radio-loud sources out to redshift as a function of their host stellar mass.
This paper is structured as follows. In Section 2 we describe the construction of the Radio-Loud AGN samples and the catalogues from which they are selected. In Section 3 the luminosity functions for these samples are constructed and binned by host galaxy stellar mass. The radio-loud fraction as a function of host stellar mass is also determined. We discuss the results and their implications in Section 5 and conclude in Section 6. Throughout this paper, we use the following cosmological parameters: km s-1 Mpc-1, and . The spectral index, , is defined as and unless otherwise specified, we adopt a default value of .

2 Radio-Loud AGN Samples
To investigate the evolution of the Radio Luminosity Function (RLF) for different stellar-masses over a similar luminosity range several samples with good ancillary and derived data are needed, to provide both the required statistics at low redshift and the sensitivity at high redshift. In this work we combine one already existing matched radio-optical dataset in the local universe using the SDSS-NVSS sample, described in Section 2.1, and one at redshifts , which we have constructed using the VLA-COSMOS DEEP Radio Survey at GHz and a Ks-selected catalogue of the COSMOS/UltraVISTA field, which is described in Section 2.2.
2.1 Local SDSS Sample
For the local radio source sample we use the catalogue compiled by Best & Heckman (2012), which was constructed by cross-matching optical galaxies from the seventh data release (DR7; Abazajian et al., 2009) of the Sloan Digital Sky Survey (SDSS) spectroscopic sample with radio sources in the NRAO Very Large Array (VLA) Sky Survey (NVSS; Condon et al., 1998) and the Faint Images of the Radio Sky at Twenty centimetres (FIRST; Becker et al., 1995). The parent optical sample consists of all galaxies in the value-added spectroscopic catalogues (VASC) created by the Max Plank Institute for Astrophysics and Johns Hopkins University (MPA-JHU) group (see Brinchmann et al., 2004, available at http://www.mpa-garching.mpg.de/SDSS/). The cross-matching was done for all radio sources with flux densities mJy, which corresponds to radio luminosities of W Hz-1at redshift and W Hz-1at redshift . The combined radio-optical area covered is str (Best & Heckman, 2012). Of the galaxies in the VASC, Best & Heckman (2012) selected a magnitude-limited sample of radio sources, which they showed to be per cent complete and per cent reliable (Best et al., 2005). The sample was restricted to the ‘main galaxy sample’ (Strauss et al., 2002), comprising galaxies within the magnitude range mag and the redshift range . This local radio-optical sample consists of radio sources. We note that, being based on the SDSS main galaxy sample, this local matched radio-optical sample excludes both radio-loud quasars and broad-line radio galaxies. However, Best et al. (2014) show that this is only problematic at radio powers above W Hz-1. Since our LFs do not probe those high powers we make no correction for this bias. Moreover, we know that the dominant population of radio sources in this sample are not quasars.
Properties of the host galaxies are taken from the VASCs which, for each source, provide several basic measured parameters from the imaging data such as magnitudes, colours and sizes (York et al., 2000), as well as derived properties including, most importantly for this work, the stellar mass (Kauffmann et al., 2003). For their matched radio sample, Best & Heckman (2012) also separated the sources into star-forming galaxies and RL AGN ( sources), which are further sub-divided into high-excitation (HERG) and low-excitation (LERG) sources, based on their optical photometric and spectroscopic parameters.
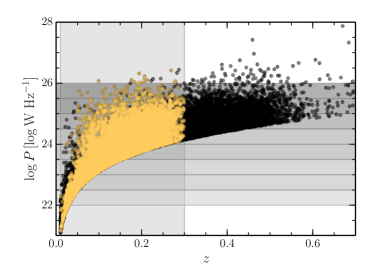
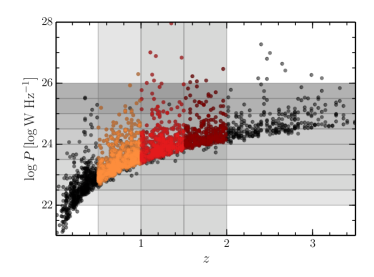
The left panels in Fig. 1 show the radio power and host stellar mass as a function of redshift for the radio sources in the SDSS-NVSS sample. All the radio sources are plotted in black, and sources in the restricted sub-sample within the redshift bin which defines our local sample are plotted in yellow.
2.2 Distant VLA-COSMOS Sample
The VLA-COSMOS Large Project covered the deg2 of the COSMOS Field at GHz with observations by the VLA in the A configuration. This survey, extensively described in Schinnerer et al. (2004); Schinnerer et al. (2007), provides continuum radio observations with a resolution (half-power beam width) of arcsec and a mean sensitivity of about Jy in the innermost deg2 region and of about Jy in the outer parts. From the VLA-COSMOS catalogue we selected sources above Jy, which corresponds to sources over per cent of the survey area.
The optical data for this sample comes from the Ks-selected catalogue of the COSMOS/UltraVISTA field (Muzzin et al., 2013) which contains PSF-matched photometry in photometric bands covering the wavelength range . The entire region overlaps with the radio survey so the combined area is that of the COSMOS/UltraVISTA data, deg2. Following the recommended criteria of Muzzin et al. (2013), we selected a ‘clean’ sample from the catalogue of sources with flags: ‘star’ , ‘K_flag’ , ‘contamination’ , and ‘nan_contam’ (these flags relate to stars and saturated sources and the quality of the photometry for nearby sources). Finally we selected sources brighter than the per cent completeness limit of mag. The redshifts provided are determined from SED fitting to the broadband photometry using the EAZY code (Brammer et al., 2008) and for source they quote an rms error of and a catastrophic outlier fraction of per cent. While the quoted outlier fraction is very low, we do expect that many of the outliers will be quasars (i.e. HERGs). It is well known that photometric redshifts determined for quasars are less reliable than those obtained for galaxies (e.g. Richards et al., 2001; Babbedge et al., 2004; Mobasher et al., 2004; Polletta et al., 2007).
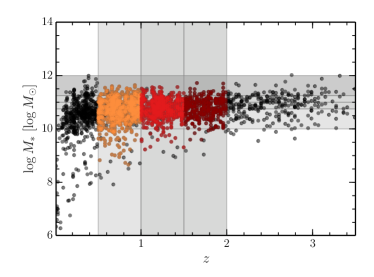
Within this sample we defined three ‘high-redshift’ sub-samples in the redshift ranges , and , chosen such that each contains galaxies. The right panels of Fig. 1 show the radio power and host stellar mass as a function of redshift for the radio sources in the VLA-COSMOS sample. Sources in the restricted ranges which define our high redshift samples are plotted in orange and red, and all the remaining sources are shown in black.
Note that at radio powers W Hz-1, the samples should consist almost entirely of RL AGN – we expect very little contamination from star-forming galaxies. We confirmed this using the spectroscopy-based AGN/SF separation in the local sample (Best et al., 2005). Moreover, the star formation rate for this radio power is in excess of M☉ yr-1 (Condon, 1992) so we expect AGN to continue to dominate even at higher redshifts.
3 The Stellar-Mass dependent Luminosity Function
3.1 The Luminosity Function
A standard technique for quantifying the rate of evolution of a population of galaxies is to compare their luminosity functions (LFs) at two different epochs. In this section, we therefore determine the evolution of the Radio-Loud AGN population among host galaxies of different masses by comparing the luminosity functions of the SDSS-NVSS and VLA-COSMOS samples. Determining the radio LFs for the full samples first serves to confirm our sample selection and methods.
These radio luminosity functions were calculated in the standard way, using method (Schmidt, 1968; Condon, 1989), where is the volume in which a given source could be detected. This volume is determined by both the minimum and maximum distance at which a given source would be included in the sample as a result of the selection criteria: , where and are the volumes enclosed within the observed sky area out to the maximum and minimum distances respectively. The minimum accessible volume is a result of the optical cut-off on the bright end ( mag for SDSS-NVSS, while the VLA-COSMOS sample has no bright flux limit). The maximum accessible volume is determined by the flux limits of both the optical ( mag for SDSS-NVSS and mag for VLA-COSMOS) and radio data ( mJy for SDSS-NVSS and Jy for the VLA-COSMOS sample). In practice, the maximum redshift is dominated by the radio flux limits. The normalization of the luminosity function requires knowledge of the precise intersection area of all input surveys. The sky area for the SDSS-NVSS sample is taken to be sr (Best et al., 2005). For the VLA-COSMOS sample, the sky area is taken to be deg2 for all sources above Jy. For the faintest sources in the VLA-COSMOS sample, the area in which the sources could be detected is smaller due to the non-uniform rms noise level in the VLA-COSMOS mosaic. We therefore weight each source by the inverse of the area in which it can be detected, which also accounts for the varying detection area within a given luminosity bin. Uncertainties are calculated as the statistical Poissonian errors with a contribution of cosmic variance where appropriate; in some luminosity/mass bins, these errors are so small that the error will be dominated by systematic effects. The area covered by VLA-COSMOS sample of deg2 is small enough that the effects of cosmic variance are not negligible for very massive galaxies. The total area covered by COSMOS/UltraVISTA is approximately 1.5 square degrees in one single field, making the effects of cosmic variance not negligible for very massive galaxies. The contribution of cosmic variance to the total error budget was estimated through the recipe of (Moster et al., 2011). The average uncertainties due to this effect for the least massive galaxies vary from to per cent and for the most massive galaxies vary from to per cent across the three highest redshift bins. These values were added in quadrature to the Poissonian error of the LFs.
| Mass bin | Redshift bin | |||
|---|---|---|---|---|
| 1021 | 296 | 231 | 147 | |
| 843 | 153 | 126 | 90 | |
| 1639 | 127 | 111 | 74 | |
| 5306 | 51 | 35 | 26 | |
| Total | 9006 | 672 | 518 | 343 |
We have compared our derived RLFs for radio-loud sources of all stellar masses with those in the literature. For the full samples, our local RLF agrees with that of Best et al. (2005) and our RLF for the high redshift VLA-COSMOS sample agrees with that of Smolčić et al. (2009). The agreement is not unexpected as we are using the same data, but it serves to validate out sample selections and method.
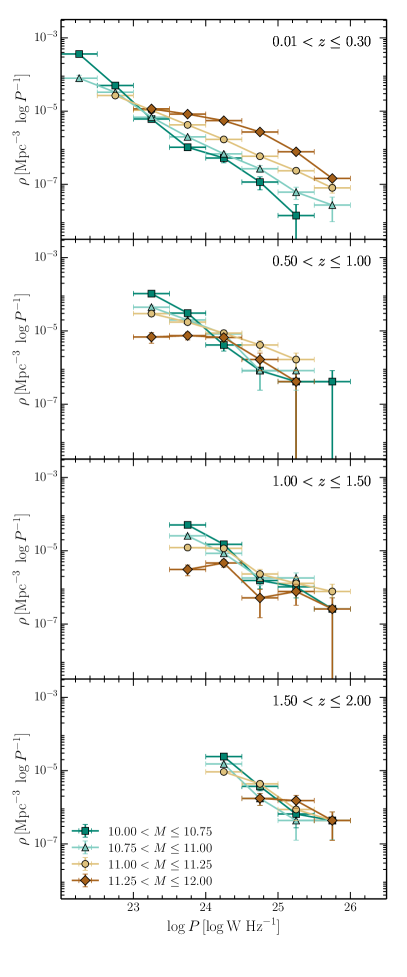
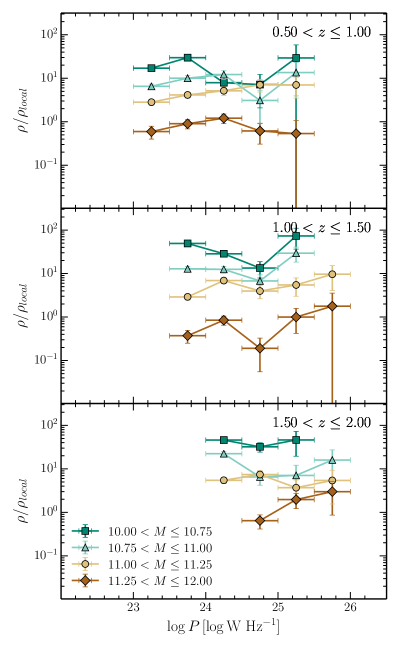
We next split the samples into four bins of different host galaxy stellar masses: , , , and . These bins are chosen to sample the stellar masses well with similar numbers of sources in each bin (see Fig. 1). The RLFs derived in each of these stellar mass bins in the four redshift bins are plotted in Fig. 2. Note that in the low redshift sample we exclude the points below W Hz-1for the highest stellar mass bin as these sources are only detectable out to and this sample is incomplete for high mass sources at these redshifts. Table 1 shows the number of sources in each stellar mass-redshift bin. From these LFs we see that in the local universe and for W Hz-1, the number density of the highest host stellar mass bin is the greatest, while in the higher redshift bins the number density within all the stellar mass bins is becoming increasingly similar.
3.2 Space Density Evolution
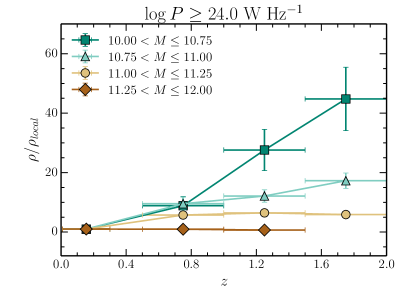
Now, to quantify the disproportional increase in radio activity among galaxies of different mass at higher redshifts, we investigate the relative comoving space density of radio-loud sources with respect to the local comoving space density. We do this by dividing the stellar mass dependent RLFs in redshift bins , and by the local RLF (). These relative RLFs are plotted in Fig. 3, from which it is clear that there is a difference between the relative comoving space density of low mass galaxies hosting radio sources and that of high mass hosts. We derive the relative comoving space density of radio-loud sources with respect to the local comoving space density for all sources with radio powers greater than a cut-off luminosity of W Hz-1. This is plotted as a function of redshift in Fig. 4 and the values listed in Table 2.
At the space density of the least massive galaxies hosting Radio-Loud AGN above W Hz-1is times greater than the local space density. Even the sources with stellar masses in the range are times more prevalent. We note that there is a slight decrement in the space density of the most massive galaxies hosting Radio-Loud AGN at both radio power cuts going out to . If we consider the slightly less powerful sources, W Hz-1, and only go out to redshift (not plotted here), the effect is only really seen in the lowest mass bin where the increase in space density increases more rapidly with redshift: the space density of the least massive galaxies hosting Radio-Loud AGN is times greater than locally compared to the -fold increase for W Hz-1sources in the bin.
| Mass bin | Redshift bin | ||
|---|---|---|---|
4 The Radio-Loud Fraction
Another way of looking at the increase in prevalence of AGN in lower mass hosts is to consider the fraction of sources which are radio-loud as a function of the host stellar mass in our four redshift bins. The mass-dependence of the radio-loud fraction can be an indicator of the accretion mode of the radio-AGN largely because of the different dependence of the fuelling source (hot vs. cold gas) on stellar mass (Best et al., 2006). The radio-loud fraction can be easily calculated by dividing the stellar mass function (SMF) for radio-loud sources, (for sources above a given radio power limit), by the SMF for all galaxies, :
4.1 The Stellar Mass Function
In order to calculate the radio-loud fraction we first derived the SMFs for all galaxies and for the radio source hosts by using the estimator (Schmidt, 1968) as previously described for the LFs, which corrects for the fact that the samples are magnitude limited. In order to construct the SMFs, the redshift-dependent limiting above which the magnitude-limited sample is complete needs to be known. For the COSMOS/UltraVISTA sample we use the empirical 95 per cent completeness limit calculated by Muzzin et al. (2013).
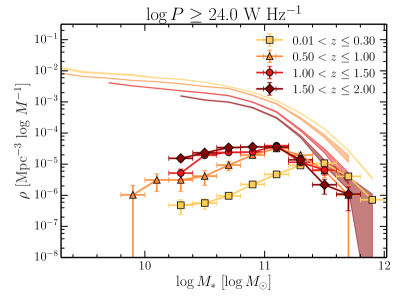
The SMFs for radio-loud galaxies and all galaxies are plotted in Fig. 5 for a radio-power cut-off of W Hz-1. We choose this limit because the highest redshift bin is only able to probe radio powers greater than this (see also Fig. 1). The SMFs we derive for our optical galaxy samples (for both the SDSS and COSMOS samples) are consistent with those of Muzzin et al. (2013) who use a more sophisticated maximum-likelihood analysis to derive the SMFs in several redshift bins. As expected (Best et al., 2005), differs significantly from – the hosts of radio sources are biased towards more massive systems. Interestingly, while the comoving number density of all galaxies decreases with redshift, that of the radio source hosts with increases. This is consistent with the results of Tasse et al. (2008) and shows that the radio-loud galaxy population evolves differently from the population of galaxies as a whole.
4.2 The Radio-Loud Fraction
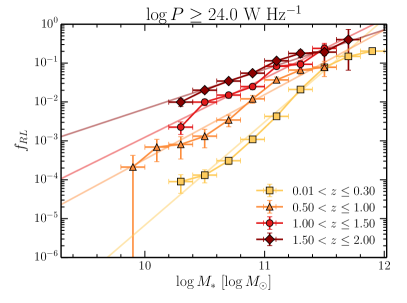
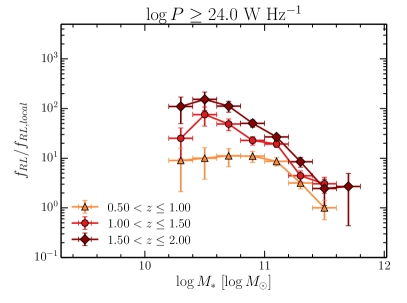
Having computed the relevant SMFs we can calculate the radio-loud fraction as described above. Figure 6 shows the radio-loud fraction for a radio-power cut-off of W Hz-1. The radio-loud fraction clearly increases with redshift. Moreover, the slope of the mass dependence becomes shallower, showing that the fraction of lower mass galaxies hosting radio sources increases more with redshift than the fraction for high mass galaxies. The slopes are shallower at higher redshifts, for W Hz-1going from in the local sample, flattening to , and in the higher redshift bins. This is highlighted in the plot of the radio-loud fraction relative to the local redshift bin (fig. 7), where the relative radio-loud fraction is up to two orders of magnitude greater at the low mass end. We note that the flattening is quicker with redshift when the lower power W Hz-1sources are considered (in the first three redshift bins only, not plotted here): , and .
5 Interpretation
In this section we aim to interpret and explain our results within the context of the HERG-LERG population dichotomy and their differential cosmic evolution and mass dependence.
In the local Universe, the density of high mass Radio-Loud AGN is an order of magnitude higher than that of low mass Radio-Loud AGN at all radio powers (cf. top panel Fig. 2). In the more distant Universe, up to we see a sharp increase in the number density of Radio-Loud AGN hosted by lower mass galaxies, while the number density of high mass Radio-Loud AGN remains constant.
This large increase in the prevalence of radio activity among galaxies of lower mass at higher redshifts (cf. Fig. 4) shows that it is the lower mass galaxies which are the cause of the upturn in the observed RLFs (e.g. Dunlop & Peacock, 1990; Rigby et al., 2011). Moreover we suggest that this upturn is likely due to an increasing population of cold mode accretors at earlier epochs. From Best et al. (2005) we know that locally, despite the wide distributions in host stellar mass of both HERGs and LERGs, LERGs have a strong preference to be hosted by galaxies with higher masses, while HERGs are hosted by galaxies with a lower median stellar mass but with a broader distribution. Assuming this still holds at higher redshifts, it implies that this strongly evolving population of lower mass Radio-Loud AGN are HERGs. We also expect the highest mass, most powerful sources to peak in space density at higher redshifts ( Rigby et al., 2011) in line with the cosmic downsizing picture where the most massive black holes have formed by . Indeed, results from many of the earlier radio surveys show that the most powerful ( W Hz-1) radio galaxies at (e.g. Eales et al., 1997; Jarvis et al., 2001; Seymour et al., 2007; Fernandes et al., 2015) are predominantly HERGs hosted by the most massive galaxies.
Indications from studies out to show that the HERGs are indeed evolving more strongly with redshift than the LERG population (Best et al., 2014) such that within the redshift ranges of this study the radio-AGN population should be dominated by HERGs, opposite to that within the local universe. The mass dependence that we observe in this study supports this idea. Moreover, the evolution in the optical quasar luminosity function (i.e. that corresponding to radio-quiet cold mode accretion; Hasinger et al., 2005; Hopkins et al., 2007; Croom et al., 2009) is comparable to the kind of increase we observe for the low mass galaxies.
Furthermore, the slope of the radio-loud fraction (cf. Fig. 6) we observe at the higher redshifts, , is more consistent with the slope of the radio-loud fraction found in the local universe for HERGs only (Janssen et al., 2012). On the other hand, in the local sample, our derived slope of matches that which Janssen et al. (2012) found for only LERGs and matches the theoretical value for the accretion of hot gas from a halo (Best et al., 2006). In this case we know that the dominant population of all local radio sources is that of the LERGs. This lends support to the idea that there is an increase in the prevalence of HERG activity or cold mode accretion and that this mode is becoming the dominant population out to redshifts of .
Lastly, as Heckman & Best (2014) state, the crucial requirement for cold mode accretion is the abundant central supply of cold dense gas. And as reflected in the increase in cosmic star formation rate density which has increased tenfold out to and threefold out to (e.g. Sobral et al., 2013; Madau & Dickinson, 2014, and references therein), there is significantly more cold gas fuelling star formation at these epochs.
A closer inspection of Fig. 3 reveals some interesting features, most particularly in highest mass bin, , in the highest redshift interval, . We suggest that while the radio-AGN sample as a whole at these redshifts is becoming dominated by cold mode accretors, the highest mass, intermediate power ( W Hz-1) sources could still be hot mode/LERG sources because of their high mass. We observe a slight decrease in the number density of these specific sources consistent with the modelling results of Rigby et al. where the W Hz-1population peaks at and is likely dominated by LERGs. This could be significant in the context of the models of LERG evolution presented by Best et al. (2014). If these are indeed LERGs the decrease in number density does not match the order of magnitude decrease predicted by the preferred model of Best et al. (2014) extrapolated out to from fits to data out to . This model includes a time delay of Gyr between the formation of massive quiescent galaxies and when they are able to produce hot mode AGN, and at redshifts above the available population of host galaxies is declining so rapidly that such a delay in the onset of hot mode AGN activity would imply a drastic fall in the number densities of these sources above .
6 Summary and Conclusions
In this paper we have used the SDSS value-added spectroscopic sample of radio-loud galaxies (Best & Heckman, 2012) and the VLA-COSMOS radio sample (Schinnerer et al., 2004; Schinnerer et al., 2007) matched to a -selected catalogue of the COSMOS/UltraVISTA field (Muzzin et al., 2013) to compile two samples of Radio-Loud AGN going out to . The samples are of sufficiently high radio power that they are dominated by RL AGN. Using these samples we have constructed radio luminosity functions for four host stellar mass bins between and , in four redshift bins between and . We have also investigated the radio-loud fraction as a function of stellar mass in these redshift bins. Together, we found the following:
-
1.
Radio activity among galaxies of different mass increases differently towards higher redshifts. By considering the relative comoving space density of radio-loud sources with respect to the local comoving space density, we showed that at the space density of galaxies with stellar masses in the range and hosting Radio-Loud AGN with W Hz-1is respectively and times greater relative to the local space density while that of higher mass galaxies hosting Radio-Loud AGN remains the same.
-
2.
The fraction of galaxies which host Radio-Loud AGN with W Hz-1as a function of stellar mass shows a clear increase with redshift and a flattening with mass with the mass dependence evolving from in the local sample to at .
We have argued that this increase in the prevalence of radio activity among galaxies of lower mass at higher redshifts is largely due to a rising contribution of AGN accreting in the radiative mode (HERGs). With this data we cannot yet conclusively show the evolution of the different accretion modes as a function of their host stellar mass because we lack the information on the excitation state of these sources at higher redshifts. However, future work combining this and other radio-optical samples will allow more detailed studies of optical hosts of the high-redshift () population of radio-AGN.
Acknowledgements
The authors thank Philip Best, George Miley and Emma Rigby for useful discussions which contributed to the interpretation in this paper. The authors thank the anonymous referee for useful comments which have improved this manuscript.
This study uses a Ks-selected catalogue of the COSMOS/UltraVISTA field from Muzzin et al. (2013). The catalogue contains PSF-matched photometry in photometric bands covering the wavelength range and includes the available (Martin et al., 2005), CFHT/Subaru (Capak et al., 2007), UltraVISTA (McCracken et al., 2012), S-COSMOS (Sanders et al., 2007), and zCOSMOS (Lilly et al., 2009) datasets. This work uses the catalogue compiled by Best & Heckman (2012), which combines data from the VASC (Brinchmann et al., 2004) of the SDSS DR7 (Abazajian et al., 2009) with NVSS (Condon et al., 1998) and FIRST (Becker et al., 1995).
References
- Abazajian et al. (2009) Abazajian K. N., Adelman-McCarthy J. K., Agüeros M. A., Allam S. S., Allende Prieto C., An D., Anderson K. S. J., Anderson S. F., Annis J., Bahcall N. A., et al. 2009, ApJS, 182, 543
- Antonucci (1993) Antonucci R., 1993, ARA&A, 31, 473
- Babbedge et al. (2004) Babbedge T. S. R., Rowan-Robinson M., Gonzalez-Solares E., Polletta M., Berta S., Pérez-Fournon I., Oliver S., Salaman D. M., et al., 2004, MNRAS, 353, 654
- Barthel (1989) Barthel P. D., 1989, ApJ, 336, 606
- Becker et al. (1995) Becker R. H., White R. L., Helfand D. J., 1995, ApJ, 450, 559
- Best & Heckman (2012) Best P. N., Heckman T. M., 2012, MNRAS, 421, 1569
- Best et al. (2006) Best P. N., Kaiser C. R., Heckman T. M., Kauffmann G., 2006, MNRAS, 368, L67
- Best et al. (2005) Best P. N., Kauffmann G., Heckman T. M., Brinchmann J., Charlot S., Ivezić Ž., White S. D. M., 2005, MNRAS, 362, 25
- Best et al. (2005) Best P. N., Kauffmann G., Heckman T. M., Ivezić Ž., 2005, MNRAS, 362, 9
- Best et al. (2014) Best P. N., Ker L. M., Simpson C., Rigby E. E., Sabater J., 2014, MNRAS, 445, 955
- Best et al. (2007) Best P. N., von der Linden A., Kauffmann G., Heckman T. M., Kaiser C. R., 2007, MNRAS, 379, 894
- Bower et al. (2006) Bower R. G., Benson A. J., Malbon R., Helly J. C., Frenk C. S., Baugh C. M., Cole S., Lacey C. G., 2006, MNRAS, 370, 645
- Boyle et al. (1988) Boyle B. J., Shanks T., Peterson B. A., 1988, MNRAS, 235, 935
- Brammer et al. (2008) Brammer G. B., van Dokkum P. G., Coppi P., 2008, ApJ, 686, 1503
- Brinchmann et al. (2004) Brinchmann J., Charlot S., White S. D. M., Tremonti C., Kauffmann G., Heckman T., Brinkmann J., 2004, MNRAS, 351, 1151
- Capak et al. (2007) Capak P., Aussel H., Ajiki M., McCracken H. J., Mobasher B., Scoville N., Shopbell P., Taniguchi Y., et al., 2007, ApJS, 172, 99
- Condon (1989) Condon J. J., 1989, ApJ, 338, 13
- Condon (1992) Condon J. J., 1992, ARA&A, 30, 575
- Condon et al. (1998) Condon J. J., Cotton W. D., Greisen E. W., Yin Q. F., Perley R. A., Taylor G. B., Broderick J. J., 1998, AJ, 115, 1693
- Croom et al. (2009) Croom S. M., Richards G. T., Shanks T., Boyle B. J., Strauss M. A., Myers A. D., Nichol R. C., Pimbblet K. A., Ross N. P., Schneider D. P., Sharp R. G., Wake D. A., 2009, MNRAS, 399, 1755
- Croton et al. (2006) Croton D. J., Springel V., White S. D. M., De Lucia G., Frenk C. S., Gao L., Jenkins A., Kauffmann G., Navarro J. F., Yoshida N., 2006, MNRAS, 365, 11
- Dunlop & Peacock (1990) Dunlop J. S., Peacock J. A., 1990, MNRAS, 247, 19
- Eales et al. (1997) Eales S., Rawlings S., Law-Green D., Cotter G., Lacy M., 1997, MNRAS, 291, 593
- Evans et al. (2006) Evans D. A., Worrall D. M., Hardcastle M. J., Kraft R. P., Birkinshaw M., 2006, ApJ, 642, 96
- Fabian et al. (2006) Fabian A. C., Celotti A., Erlund M. C., 2006, MNRAS, 373, L16
- Fernandes et al. (2015) Fernandes C. A. C., Jarvis M. J., Martínez-Sansigre A., Rawlings S., Afonso J., Hardcastle M. J., Lacy M., Stevens J. A., Vardoulaki E., 2015, MNRAS, 447, 1184
- Hardcastle et al. (2006) Hardcastle M. J., Evans D. A., Croston J. H., 2006, MNRAS, 370, 1893
- Hardcastle et al. (2007) Hardcastle M. J., Evans D. A., Croston J. H., 2007, MNRAS, 376, 1849
- Hasinger et al. (2005) Hasinger G., Miyaji T., Schmidt M., 2005, A&A, 441, 417
- Heckman & Best (2014) Heckman T. M., Best P. N., 2014, ARA&A, 52, 589
- Hewett et al. (1993) Hewett P. C., Foltz C. B., Chaffee F. H., 1993, ApJ, 406, L43
- Hickox et al. (2009) Hickox R. C., Jones C., Forman W. R., Murray S. S., Kochanek C. S., Eisenstein D., Jannuzi B. T., Dey A., et al., 2009, ApJ, 696, 891
- Hine & Longair (1979) Hine R. G., Longair M. S., 1979, MNRAS, 188, 111
- Hopkins et al. (2007) Hopkins P. F., Richards G. T., Hernquist L., 2007, ApJ, 654, 731
- Jackson & Rawlings (1997) Jackson N., Rawlings S., 1997, MNRAS, 286, 241
- Janssen et al. (2012) Janssen R. M. J., Röttgering H. J. A., Best P. N., Brinchmann J., 2012, A&A, 541, A62
- Jarvis et al. (2001) Jarvis M. J., Rawlings S., Eales S., Blundell K. M., Bunker A. J., Croft S., McLure R. J., Willott C. J., 2001, MNRAS, 326, 1585
- Kauffmann et al. (2003) Kauffmann G., Heckman T. M., White S. D. M., Charlot S., Tremonti C., Brinchmann J., Bruzual G., Peng E. W., et al., 2003, MNRAS, 341, 33
- Laing et al. (1994) Laing R. A., Jenkins C. R., Wall J. V., Unger S. W., 1994, in Bicknell G. V., Dopita M. A., Quinn P. J., eds, The Physics of Active Galaxies Vol. 54 of ASPCS, Spectrophotometry of a Complete Sample of 3CR Radio Sources: Implications for Unified Models. p. 201
- Lilly et al. (2009) Lilly S. J., Le Brun V., Maier C., Mainieri V., Mignoli M., Scodeggio M., Zamorani G., Carollo M., et al., 2009, ApJS, 184, 218
- Madau & Dickinson (2014) Madau P., Dickinson M., 2014, ARA&A, 52, 415
- Martin et al. (2005) Martin D. C., Fanson J., Schiminovich D., Morrissey P., Friedman P. G., Barlow T. A., Conrow T., Grange R., et al., 2005, ApJ, 619, L1
- McCracken et al. (2012) McCracken H. J., Milvang-Jensen B., Dunlop J., Franx M., Fynbo J. P. U., Le Fèvre O., Holt J., Caputi K. I., et al., 2012, A&A, 544, A156
- Mobasher et al. (2004) Mobasher B., Idzi R., Benítez N., Cimatti A., Cristiani S., Daddi E., Dahlen T., Dickinson M., et al., 2004, ApJ, 600, L167
- Moster et al. (2011) Moster B. P., Somerville R. S., Newman J. A., Rix H.-W., 2011, ApJ, 731, 113
- Muzzin et al. (2013) Muzzin A., Marchesini D., Stefanon M., Franx M., McCracken H. J., Milvang-Jensen B., Dunlop J. S., Fynbo J. P. U., Brammer G., Labbé I., van Dokkum P. G., 2013, ApJ, 777, 18
- Muzzin et al. (2013) Muzzin A., Marchesini D., Stefanon M., Franx M., Milvang-Jensen B., Dunlop J. S., Fynbo J. P. U., Brammer G., Labbé I., van Dokkum P., 2013, ApJS, 206, 8
- Narayan & Yi (1995) Narayan R., Yi I., 1995, ApJ, 452, 710
- Ogle et al. (2006) Ogle P., Whysong D., Antonucci R., 2006, ApJ, 647, 161
- Osmer (1982) Osmer P. S., 1982, ApJ, 253, 28
- Peacock (1985) Peacock J. A., 1985, MNRAS, 217, 601
- Polletta et al. (2007) Polletta M., Tajer M., Maraschi L., Trinchieri G., Lonsdale C. J., Chiappetti L., Andreon S., Pierre M., et al., 2007, ApJ, 663, 81
- Richards et al. (2001) Richards G. T., Weinstein M. A., Schneider D. P., Fan X., Strauss M. A., Vanden Berk D. E., Annis J., Burles S., et al., 2001, AJ, 122, 1151
- Rigby et al. (prep) Rigby E. E., Argyle J., Best P. N., Rosario D., Röttgering H. J. A., in prep., MNRAS
- Rigby et al. (2011) Rigby E. E., Best P. N., Brookes M. H., Peacock J. A., Dunlop J. S., Röttgering H. J. A., Wall J. V., Ker L., 2011, MNRAS, 416, 1900
- Sandage (1972) Sandage A., 1972, ApJ, 178, 25
- Sanders et al. (2007) Sanders D. B., Salvato M., Aussel H., Ilbert O., Scoville N., Surace J. A., Frayer D. T., Sheth K., et al., 2007, ApJS, 172, 86
- Schinnerer et al. (2004) Schinnerer E., Carilli C. L., Scoville N. Z., Bondi M., Ciliegi P., Vettolani P., Le Fèvre O., Koekemoer A. M., Bertoldi F., Impey C. D., 2004, AJ, 128, 1974
- Schinnerer et al. (2007) Schinnerer E., Smolčić V., Carilli C. L., Bondi M., Ciliegi P., Jahnke K., Scoville N. Z., Aussel H., Bertoldi F., Blain A. W., Impey C. D., Koekemoer A. M., Le Fevre O., Urry C. M., 2007, ApJS, 172, 46
- Schmidt (1968) Schmidt M., 1968, ApJ, 151, 393
- Schmidt et al. (1988) Schmidt M., Schneider D. P., Gunn J. E., 1988, in Osmer P., Phillips M. M., Green R., Foltz C., eds, Optical Surveys for Quasars Vol. 2 of ASPCS, Spectroscopic CCD surveys for quasars at large redshift.. pp 87–95
- Seymour et al. (2007) Seymour N., Stern D., De Breuck C., Vernet J., Rettura A., Dickinson M., Dey A., Eisenhardt P., et al., 2007, ApJS, 171, 353
- Shakura & Sunyaev (1973) Shakura N. I., Sunyaev R. A., 1973, A&A, 24, 337
- Smolčić et al. (2009) Smolčić V., Zamorani G., Schinnerer E., Bardelli S., Bondi M., Bîrzan L., Carilli C. L., Ciliegi P., et al., 2009, ApJ, 696, 24
- Sobral et al. (2013) Sobral D., Smail I., Best P. N., Geach J. E., Matsuda Y., Stott J. P., Cirasuolo M., Kurk J., 2013, MNRAS, 428, 1128
- Strauss et al. (2002) Strauss M. A., Weinberg D. H., Lupton R. H., Narayanan V. K., Annis J., Bernardi M., Blanton M., Burles S., et al., 2002, AJ, 124, 1810
- Tasse et al. (2008) Tasse C., Best P. N., Röttgering H., Le Borgne D., 2008, A&A, 490, 893
- Urry & Padovani (1995) Urry C. M., Padovani P., 1995, PASP, 107, 803
- Warren et al. (1994) Warren S. J., Hewett P. C., Osmer P. S., 1994, ApJ, 421, 412
- Whysong & Antonucci (2004) Whysong D., Antonucci R., 2004, ApJ, 602, 116
- York et al. (2000) York D. G., Adelman J., Anderson Jr. J. E., Anderson S. F., Annis J., Bahcall N. A., Bakken J. A., Barkhouser R., SDSS Collaboration 2000, AJ, 120, 1579