A Near-Infrared Spectroscopic Survey at the SDSS 2.5-meter Telescope?
1 Introduction
Although the world is flush with source/field visible wavelength spectrographs, no near-infrared equivalent exists. SDSS possesses a powerful infrastructure for multi-object spectroscopy which could be adapted for near-infrared observation. This configuration could, for example, enable dedicated surveys of the kinematics and chemical evolution of the Milky Way using a spectrograph with and modes.
2 Why not a deeper near-infrared imaging survey?
Wide-field infrared imaging is an alternative attractive future application for the SDSS telescope. This alternative should be considered in context with past and planned large-scale near-infrared imaging surveys. 2MASS, for example, obtained 100% sky coverage to . It detected effectively every late-type giant in the Milky Way, detected thousands of L-dwarfs and T-dwarfs, and delineated large-scale structure in 4 steradians to .
A significantly deeper near-infrared survey than 2MASS is scientifically attractive. For example in 2MASS stars outnumber galaxies while in a survey three magnitudes deeper than 2MASS the ratio reverses. A JHK survey to would complement the SDSS depth for galaxy detection and allow mass-weighted field and cluster luminosity functions, study of large scale structure to , and galaxy cluster counts at . If this survey were to encompass thousands of square degrees it would increase the volume for L/T dwarf detection by 1000 fold and allow detection of brown dwarfs within one parsec. Also in the rare object venue, a survey would enable quasar counts using SDSS band dropouts.
Dedicating more time to smaller areas enable surveys of square degree regions to . Such a moderately deep pencil-beam survey would enable observation of galaxy evolution in the rest-frame visible at .
Two deep near-infrared imaging surveys are underway, however: UKIRT Infrared Deep Sky Survey (UKIDSS; http://www.ukidss.org/) and Visible and Infrared Survey Telescope for Astronomy (VISTA; http://www.vista.ac.uk/). UKIDSS is in progress on the UKIRT telescope equipped with a 0.21 sq. degree imager. This survey expects to observe 7200 sq. degrees to in bands, 35 sq. degrees to , and 1 sq. degree to . VISTA expects to start this year on a 12 year survey using a dedicated telescope in Chile with a 1 sq. degree imager. This survey expects to observe 5000 sq. degrees in to and 25 sq. degrees to .
These other surveys, despite completion dates well into the future, are nevertheless well-established and ripe to deliver results. An SDSS near-infrared imaging survey would arrive late and be a small player looking for niche science.
3 A near-infrared spectroscopic alternative?
The SDSS could become a near-infrared spectroscopic survey telescope delivering spectra for sources per night. Anticipated sensitivities are at and at for in 30 minutes. Every potential target for such a spectrographic survey has thus been detected at high SNR by 2MASS in which enables good source selection via color discrimination. Cool giant stars in the Milky Way are natural targets, both because they are intrinsically luminous at near-infrared wavelengths and because galactic extinction is significantly smaller at these wavelengths. Spectra in this wavelength regime can provide classification, kinematics and abundance estimates.
4 Practical Issues
The most straightforward implementation of near-infrared spectroscopy would use the SDSS fiber and plug plate infrastructure as is. The near-infrared opacity of both the fibers and common corrector could be limiting factors depending on the scientifically driven bandpass selection.
 |
4.1 Fiber Transmission
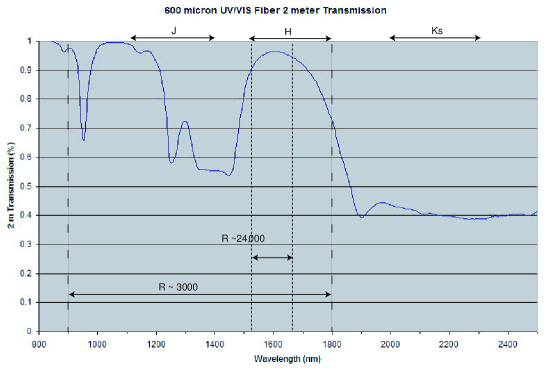
The current SDSS fibers have high-OH content (so-called ‘wet fibers’) to improve UV performance. OH absorption is significant in some portions of the near-infrared. The SDSS fiber is single strand UV-enhanced (high-OH) step-index fiber.111The fiber, known as ‘FV’ fiber, was purchased from Polymicro. Polymicro no longer manufactures this product; its current UV-enhanced fiber is known as ‘FHP’. Figure 1 shows transmission of modern Polymicro high-OH fiber in the near-infrared over a path-length. Over half of the long wavelength side of band is adversely affected by the fiber transmission, with in-band transmission as low as due to OH absorption. The existing fibers have reasonably good transmission over much of the H-band, peaking at about at in the center of the H-band. Science which exploits the H-band can proceed without fiber replacement. Beyond H-band transmission falls to a nearly constant transmission beyond and through all of band.
 |
4.2 Corrector Plate Transmission
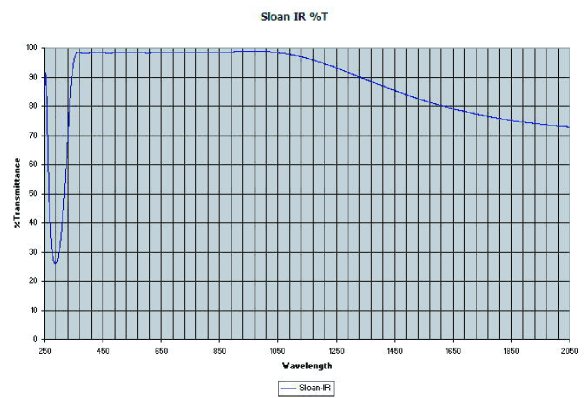
The Common Corrector inserted within the hole of the primary mirror is made from Corning 7940 222Corning no longer manufactures this material. Its current equivalent is 7980. Fused Silica. The raw material transmission is high shortward of , but starts to degrade longward of this wavelength. The corrector coating333QSP Optics did the coating; this company is now called Infinite Optics. is optimized for . The design visual and near-infrared transmission curves from the coating vendor through both coated surfaces and the lens material is shown in Figure 2. The corrector could be replaced with modest cost and effort if necessary or recoated to minimize reflectivity over a broader bandpass. Such a coating would likely come at the cost of a slight compromise of current performance at visible wavelengths.
4.3 Thermal background
A spectrograph could be a room temperature instrument, or one which is modestly refrigerated in a dessicated atmosphere. Beyond , ambient thermal background begins to compromise spectrographic sensitivity considerably, particularly for a fiber configuration where the spectrograph has to view the warm fiber ends and their holders. Although K-band is rich in scientific opportunity, sensitivity lost to thermal background, transmission issues, and the overall increase in complexity of the resulting instrument may lessen interest in this wavelength regime.
4.4 Dynamic Range Considerations
Near-infrared array multiplexers, unlike CCDs, are capable of reading out non-destructively many times per exposure (because the collected charge stays local to pixels and each pixel is addressed in turn by the multiplexer). A single long exposure can be broken into many full-frame sub-exposures of different lengths enabling the extraction of bright source spectra, or bright spectral regions or lines, prior to reaching saturation while preserving a deep integration on the array as a whole. A huge range of source flux can be addressed in a single plug plate.
5 Specific science suggestion: A Galactic Kinematic and Chemical Evolution Survey
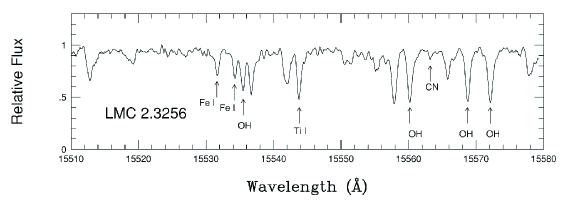
Carbon, Nitrogen and Oxygen are tracers of Galactic star formation history and are sensitive (relative to Fe) to the ratio of Type II to Type Ia SN (see e.g. Smith et al. (2002)). CNO have weak atomic lines and are often observed under non-LTE conditions in the visible, making abundance measurements there difficult. Molecular CNO lines, e.g. CN, CO and OH, are more reliable abundance diagnostics and are effective when observed with . A critical spectral region lies between 1.5 and in the band (Figure 3) - just the range of wavelengths where the existing fiber transmission is good. This wavelength range is rich in diagnostic atomic and molecular absorption lines. High resolution near-infrared spectroscopy has been exploited by atleast two groups to date, including Origlia et al. (2002, 2005) abundance studies of globular clusters and Smith et al. (2002) abundance studies of LMC red-giants. SDSS-NIR has the potential to extend this work to the broader galactic population combining metalicity information with the precise kinematic measurements which naturally derive from observations at high spectral resolution. Such a survey would be dominated by targets in or near the Galactic plane (leveraging the extinction advantage of working in the near-infrared). A color selection from 2MASS yields 11 million potential giant star targets with visible from Apache Point. This plane survey could operate in tandem with a complementary high galactic latitude program which focuses on both infrared and visible wavelength targets to fill out a fiber plate - assuming only one of the two existing spectrographs are replaced.
 |
6 An attractive array technology
If the primary science can be addressed at wavelengths shortward of , InGaAs detector/array technology becomes an attractive and potentially cost effective alternative. The long wavelength cut-off of standard InGaAs material is . Arrays of these detectors can be manufactured less expensively than HgCdTe and InSb and are becoming competitive in dark current and noise performance.
UVA collaborates with Sensors Unlimited, Inc. in the development of astronomical InGaAs technology. Recently InGaAs arrays were successfully bonded to low-noise astronomical 1K x 1K multiplexers (for SNAP). 2K x 2K arrays are on the horizon. One can anticipate substantial progress in the development of InGaAs arrays with low dark current and good read noise characteristics in time for implementation in an infrared spectrograph for the 2.5-meter.
7 Strawman instrument considerations
One could construct a spectrograph akin to the SDSS optical spectrograph which initially uses the existing fiber and plug plates. Should the spectral coverage demanded by science considerations make it necessary, the existing fibers could be replaced with low-OH counterparts in a mechanical configuration identical to the current fiber configuration (although replacement of fibers also allows consideration of constructing a more stable floor-standing spectrograph). The spectrograph would contain two interchangeable gratings to provide two modes: an “faint-object” mode for classification and kinematics () to in 30 minutes covering and an mode for classification, kinematics () and abundances to in 30 minutes covering . The high resolution grating could be rotatable to allow selection of the wavelength coverage within band.
This spectrograph would require 4096 pixels in the dispersion direction and thus a detector format similar to the existing SDSS optical spectrographs. Thus two 2K x 2K InGaAs arrays would be adequate. This array dimension would permit spectra per exposure.
8 Some initial technical questions
-
•
The transmission estimates reported here should be verified by empirical tests with the actual fiber material (ultimately with a total throughput test at the telescope).
-
•
The current fibers are sized at 3” as a compromise between point source and extended source sensitivity for SDSS. Fiber replacement would provide an opportunity to revisit the fiber spatial scale.
-
•
Is it feasible to replace a portion of th existing fibers with smaller core low-OH fibers to devote to fainter sources or or to assemble into IFU ‘dense pak’ configurations.
-
•
What are the size and flexure requirements of an spectrograph? Is it feasible to mount it on the back of the SDSS telescope, and thus re-use the existing fiber infrastructure ( fibers). Details to consider: grating type/size, camera focal length, sampling requirements, wavelength coverage per object, number and type of detectors.
-
•
Should the instrument be designed to allow use at the telescope as well?
References
- Smith et al. (2002) Smith, V. V. et al., 2002, , 124, 3241
- Melendez and Barbuy (2002) Melendez, J. and Barbuy, B., 2002, Ap. J., 575, 474.
- Origlia et al. (2005) Origlia, L., Valenti, E. and Rich, R. M., M.N.R.A.S., 356, 1276.
- Origlia et al. (2002) Origlia, L., Rich, R.M., and Castro, S., 2002, Astron. J., 123, 1559.