Departamento de Astrofísica, E-38206, La Laguna, Tenerife, Spain
Bayesian peak bagging analysis of 19 low-mass low-luminosity red giants observed with Kepler
Abstract
Context. Non-radial oscillations, observed in thousands of red giants by the space missions CoRoT and Kepler, allow to greatly deepen our understanding about stellar structure and evolution in cool low-mass stars. The currently available Kepler light curves contain an outstanding amount of information but a detailed analysis of the individual oscillation modes in the observed power spectra, also known as peak bagging, is computationally demanding and challenging to perform on a large number of targets.
Aims. Our intent is to perform for the first time a peak bagging analysis on a sample of 19 low-mass low-luminosity red giants observed by Kepler for more than four years. This allows us to provide high-quality asteroseismic measurements that can be exploited for an intensive testing of the physics used in stellar structure models, stellar evolution and pulsation codes, as well as for refining existing asteroseismic scaling relations in the red giant branch regime.
Methods. For this purpose, powerful and sophisticated analysis tools are needed. We exploit the Bayesian code Diamonds, using an efficient nested sampling Monte Carlo algorithm, to perform both a fast fitting of the individual oscillation modes and a peak detection test based on the Bayesian evidence.
Results. We find good agreement for the parameters estimated in the background fitting phase with those given in the literature. We extract and characterize a total of 1618 oscillation modes, providing the largest set of detailed asteroseismic mode measurements ever published. We report on the evidence of a change in regime observed in the relation between linewidths and effective temperatures of the stars occurring at the bottom of the RGB. We show the presence of a linewidth depression or plateau around for all the red giants of the sample. Lastly, we show a good agreement between our measurements of maximum mode amplitudes and existing maximum amplitudes from global analyses provided in the literature, useful as empirical tools to improve and simplify the future peak bagging analysis on a larger sample of evolved stars.
Key Words.:
stars: oscillations – stars: evolution – stars: late-type – methods: statistical – methods: numerical – methods: data analysis1 Introduction
Since the first detection of non-radial oscillations in cool giant stars, the asteroseismology of field red giants (RGs) has encountered a substantial increase in output, especially thanks to the advent of the space-based photometric missions CoRoT (e.g. De Ridder et al. 2009; Kallinger et al. 2010b; Mosser et al. 2011b, a) and Kepler (e.g. Borucki et al. 2010; Koch et al. 2010; Bedding et al. 2010; Huber et al. 2010; Kallinger et al. 2010a, 2012), where the latter allowed also for the study of RGs in open clusters (e.g. Stello et al. 2011; Miglio et al. 2012; Corsaro et al. 2012), and in eccentric binary systems (Beck et al. 2014).
The discovery of so-called mixed modes (Beck et al. 2011; Mosser et al. 2011a), i.e. modes with p-mode as well as g-mode characteristics, only observed in stars that have passed the main sequence phase, has led to a significant improvement of our understanding of the internal structure and evolution of RGs. The characteristic period spacing of mixed modes frequencies provides a direct way to disentangle H-shell and He-core burning RGs (Bedding et al. 2011; Mosser et al. 2012b) and has already been used to classify about 13,000 targets observed in the Kepler field of view (Stello et al. 2013). Additional studies of the effect of rotation as seen from the splitting of mixed modes show us that the RG cores rotate faster than their convective envelope (Beck et al. 2012; Deheuvels et al. 2012; Mosser et al. 2012a), thus opening the possibility to probe their internal rotation rates with direct observations of the oscillations at their surface. RGs are also being used as distance and age indicators to study stellar populations and trace the formation and evolution of the Galaxy (e.g. see Miglio et al. 2009, 2013, 2015).
Nonetheless, several problems and challenges arise in the analysis and physical interpretation of the asteroseismic properties of the RGs. Among the most important topics currently under investigation, we mention: the forward modeling and inversion of the mode frequencies aimed at probing the stellar structure, constrain the evolution, examine the physical mechanisms responsible for the transport of angular momentum inside the star (e.g. Tayar & Pinsonneault 2013; Benomar et al. 2014; Deheuvels et al. 2014, and references therein); the excitation and damping mechanism of the mixed modes (e.g. Grosjean et al. 2014), and the asymptotic behavior of their oscillation frequencies (Jiang & Christensen-Dalsgaard 2014); the underlying physics responsible for the damping rates of the modes in a temperature range cooler than that of G-F type main-sequence and subgiant stars (e.g. Chaplin et al. 2009; Baudin et al. 2011; Belkacem et al. 2012; Corsaro et al. 2012); the analysis of regions of sharp-structure variation inside the convective zone aimed at refining existing stellar models and at retrieving reliable helium abundances (e.g. Miglio et al. 2010; Broomhall et al. 2014; Vrard et al. 2014; Corsaro et al. 2015). Therefore, RGs are among the most interesting and useful types of stars to test thoroughly the physics implemented in both stellar structure models and in evolution and pulsation codes, but high-precision asteroseismic measurements of individual oscillation modes are highly needed to accomplish each one of the issues listed before.
With the present four-years long datasets available from Kepler for many RGs, we have the possibility to obtain detailed asteroseismic properties such as frequency, amplitude, and lifetime of each individual oscillation mode observed, with an unprecedented level of accuracy and precision. The required analysis, usually known as peak bagging (e.g. Appourchaux 2003), represents a key-step to exploit the full potential of the high-quality power spectra of the stars. However, due to the large number of modes populating the power spectrum of a red giant (on the order of 100), the peak bagging usually turns into a computationally demanding analysis (e.g. see Benomar et al. 2009a; Gruberbauer et al. 2009; Kallinger et al. 2010b; Handberg & Campante 2011; Corsaro & De Ridder 2014). For this purpose, we exploit Diamonds (Corsaro & De Ridder 2014, hereafter CD14), a new code well suited for model comparison and inference of high-dimensional problems in a Bayesian perspective.
In this paper we show how to adequately extend to the case of RGs the method used by CD14 for main-sequence stars, hence we perform the peak bagging analysis on a sample of low-mass low-luminosity red giant branch (RGB) stars observed by Kepler for more than four years. We thus provide and discuss our results for the background signal, the asteroseismic parameters, the mode damping and amplitude of all the stars in our sample, stressing their relevance in the light of the open questions related to the physics of the red giant stars.
2 Observations and data
To select the sample of stars investigated in this work we started from the original sample of RGs observed in long cadence (LC) by Kepler (Jenkins et al. 2010) and studied by Huber et al. (2011) and by Corsaro et al. (2013), consisting in a total of 1111 stars. In this work we focus on low-mass low-luminosity RGB stars (hereafter LRGs, for the sake of brevity), a particular type of RGs that represents a small population of stars (about 5 % of the entire population of RGs observed by Kepler).
Our choice of analyzing LRGs, amongst the variety of RGs observed, is motivated by the following reasons:
-
•
The clean oscillation pattern caused by the high values of the characteristic frequency separations, providing a more reliable fitting and identification of most of the observed modes.
-
•
The large number of modes (both modes and mixed modes) and radial orders observed thanks to the high frequency of maximum oscillation power (hence broader power excess compared to more evolved RGs), which allow for more stringent frequency inversions and studies of the seismic signatures of Helium inside the star.
-
•
The clear presence of rotation in the oscillations with different mixture level between pressure and gravity modes, essential to investigate the physics of angular momentum transport and its evolution in different layers inside the star.
-
•
The location in a short-lived phase at the bottom of the RGB, making these stars rare to observe and important to refine stellar evolution theory.
-
•
The covered range in stellar effective temperatures, laying just below that of the most evolved low-mass subgiant stars, filling the existing observational gaps that are crucial for our comprehension of the damping mechanism in the transition between the subgiant and the RGB phase of the stellar evolution.
Therefore, from the original sample we only considered those stars with power spectra having an oscillation envelope with Hz, according to the stellar population study done by Miglio et al. (2009) (see also Bedding et al. 2010), with values provided by Huber et al. (2011). This selection reduced the number of targets to 56, which we further skimmed by visually choosing the best stars in terms of number of oscillations and SNR ( as measured from the PSD around ). We then checked for available measurements of their g-mode period spacing , as measured by Mosser et al. (2012b), to have confirmation that the RGs considered are indeed settled in the RGB phase of stellar evolution, and as an auxiliary input for the mode identification process (see Sect. 3.4). This cross-match led to 21 stars, two of which were removed due to a bad module sequence in three Kepler observing quarters (Q). The final sample obtained thus consists of 19 LRGs observed by Kepler from Q0 till Q17.1, namely a total of 1470 days, resulting in a frequency resolution of Hz and 36,000 data bins for each power spectral density (PSD). The original PDC-SAP Kepler light curves (Thompson et al. 2013) were corrected following the methods described in García et al. (2011) and the final data were high-pass filtered ensuring a 100 % transmission for frequencies above 0.2 Hz for all stars. To minimize the effect of the Kepler regular window function due to the spacecraft angular momentum dump and the Earth downlink pointing (García et al. 2014), we have interpolated all the gaps of sizes smaller than 2 days using an inpainting algorithm (Mathur et al. 2010; Pires et al. 2014).
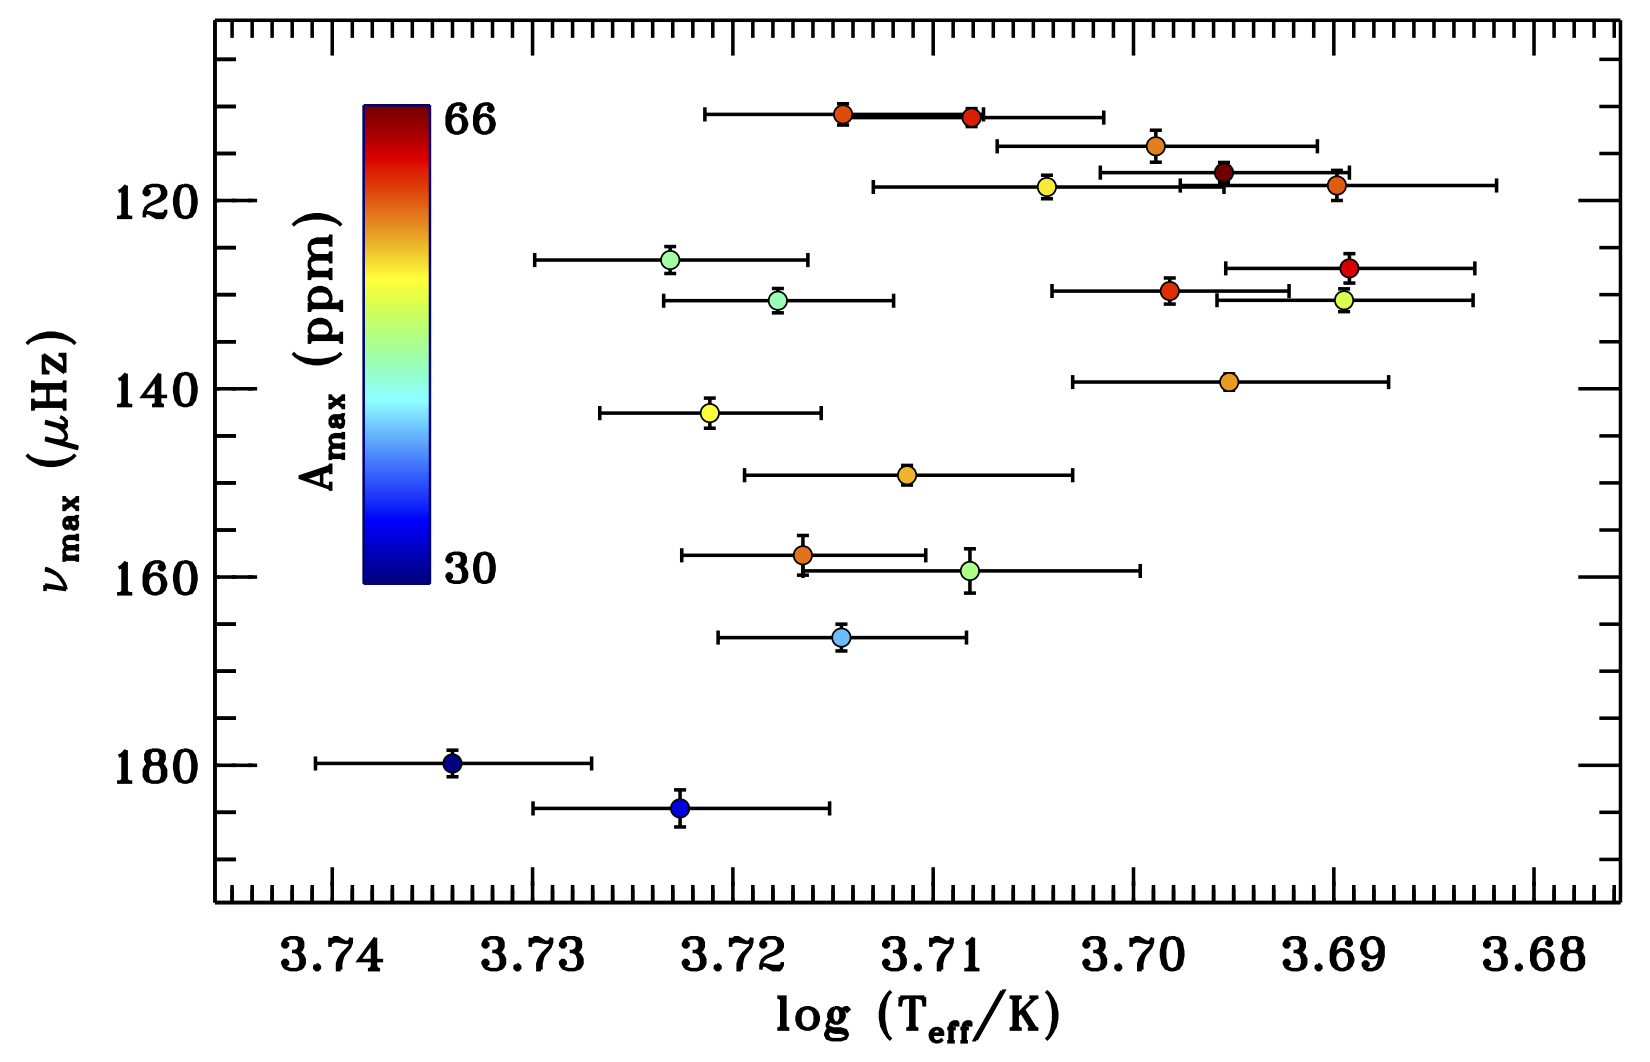
Fig. 1 illustrates the asteroseismic Hertzsprung-Russel diagram (HRD), -, for the sample of the 19 LRGs. The stars span a temperature range of about - K, and a range in of 75 Hz starting from Hz upwards, with amplitudes at maximum power from 30 to 70 ppm.
3 Peak bagging analysis
3.1 Background fitting
The first step for the peak bagging analysis of the stars is to estimate the background signal in their PSD. We follow the statistical analysis done on a large sample of stars by Kallinger et al. (2014), who found that two separate granulation components with a characteristic frequency close to the region containing the oscillations, together with a third component related to long-term variations, represent best the background signal of the RGs analyzed in this work. In particular, the super-Lorentzian (or Harvey-like) profiles associated to each background component have an exponent set to four, again according to the findings by Kallinger et al. (2014). Thus, the background model that we adopt can be expressed as
| (1) |
where we assume to be a flat noise level since we only study RGs with high , and with the response function that considers the sampling rate of the observations for LC Kepler data,
| (2) |
with Hz the Nyquist frequency. The super-Lorentzian components are given by
| (3) |
with the amplitude in ppm, the characteristic frequency in Hz, and the normalization constant for a super-Lorentzian profile with exponent set to four (e.g. see Karoff et al. 2013; Kallinger et al. 2014). The power excess containing the oscillations is as usual described as
| (4) |
and is only considered when fitting the background model to the overall PSD of the star.
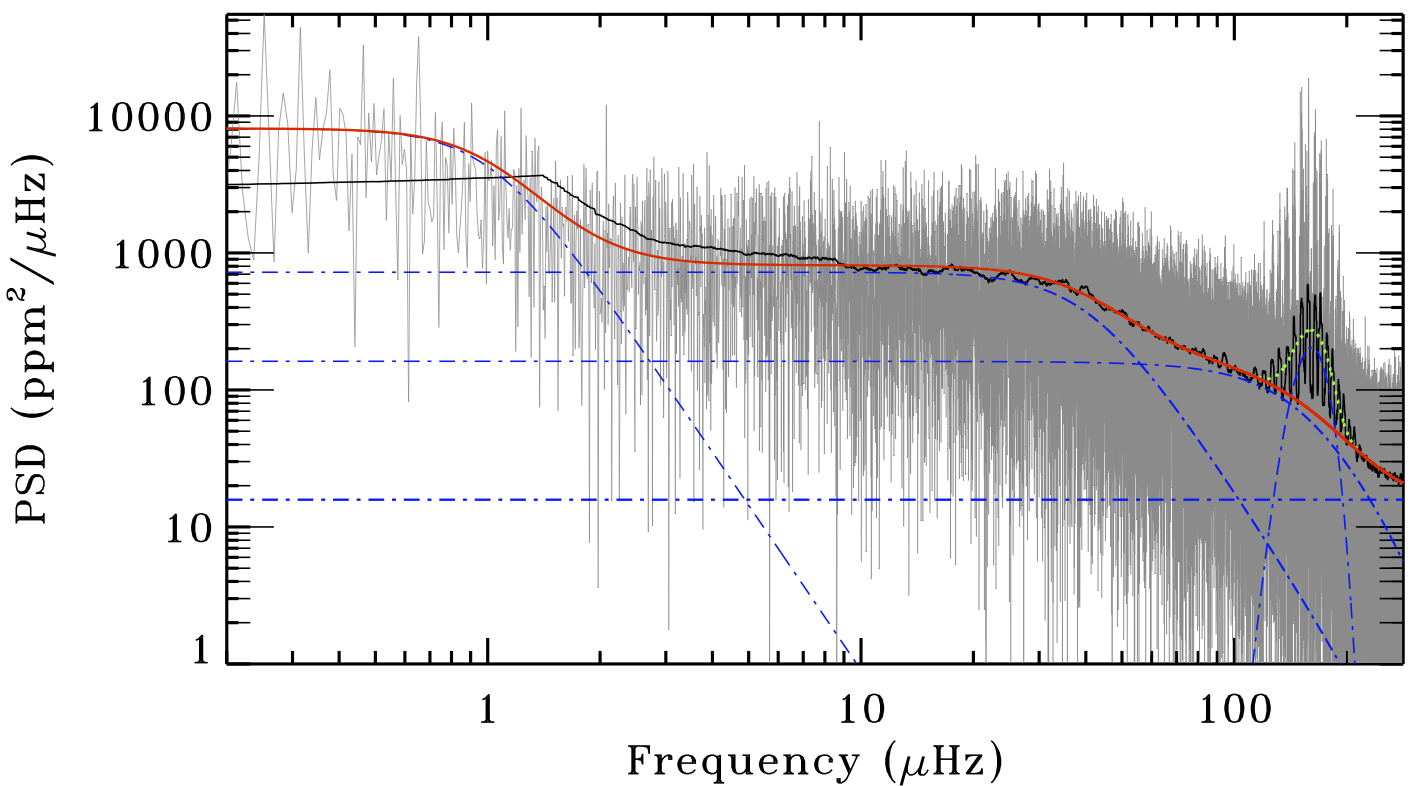
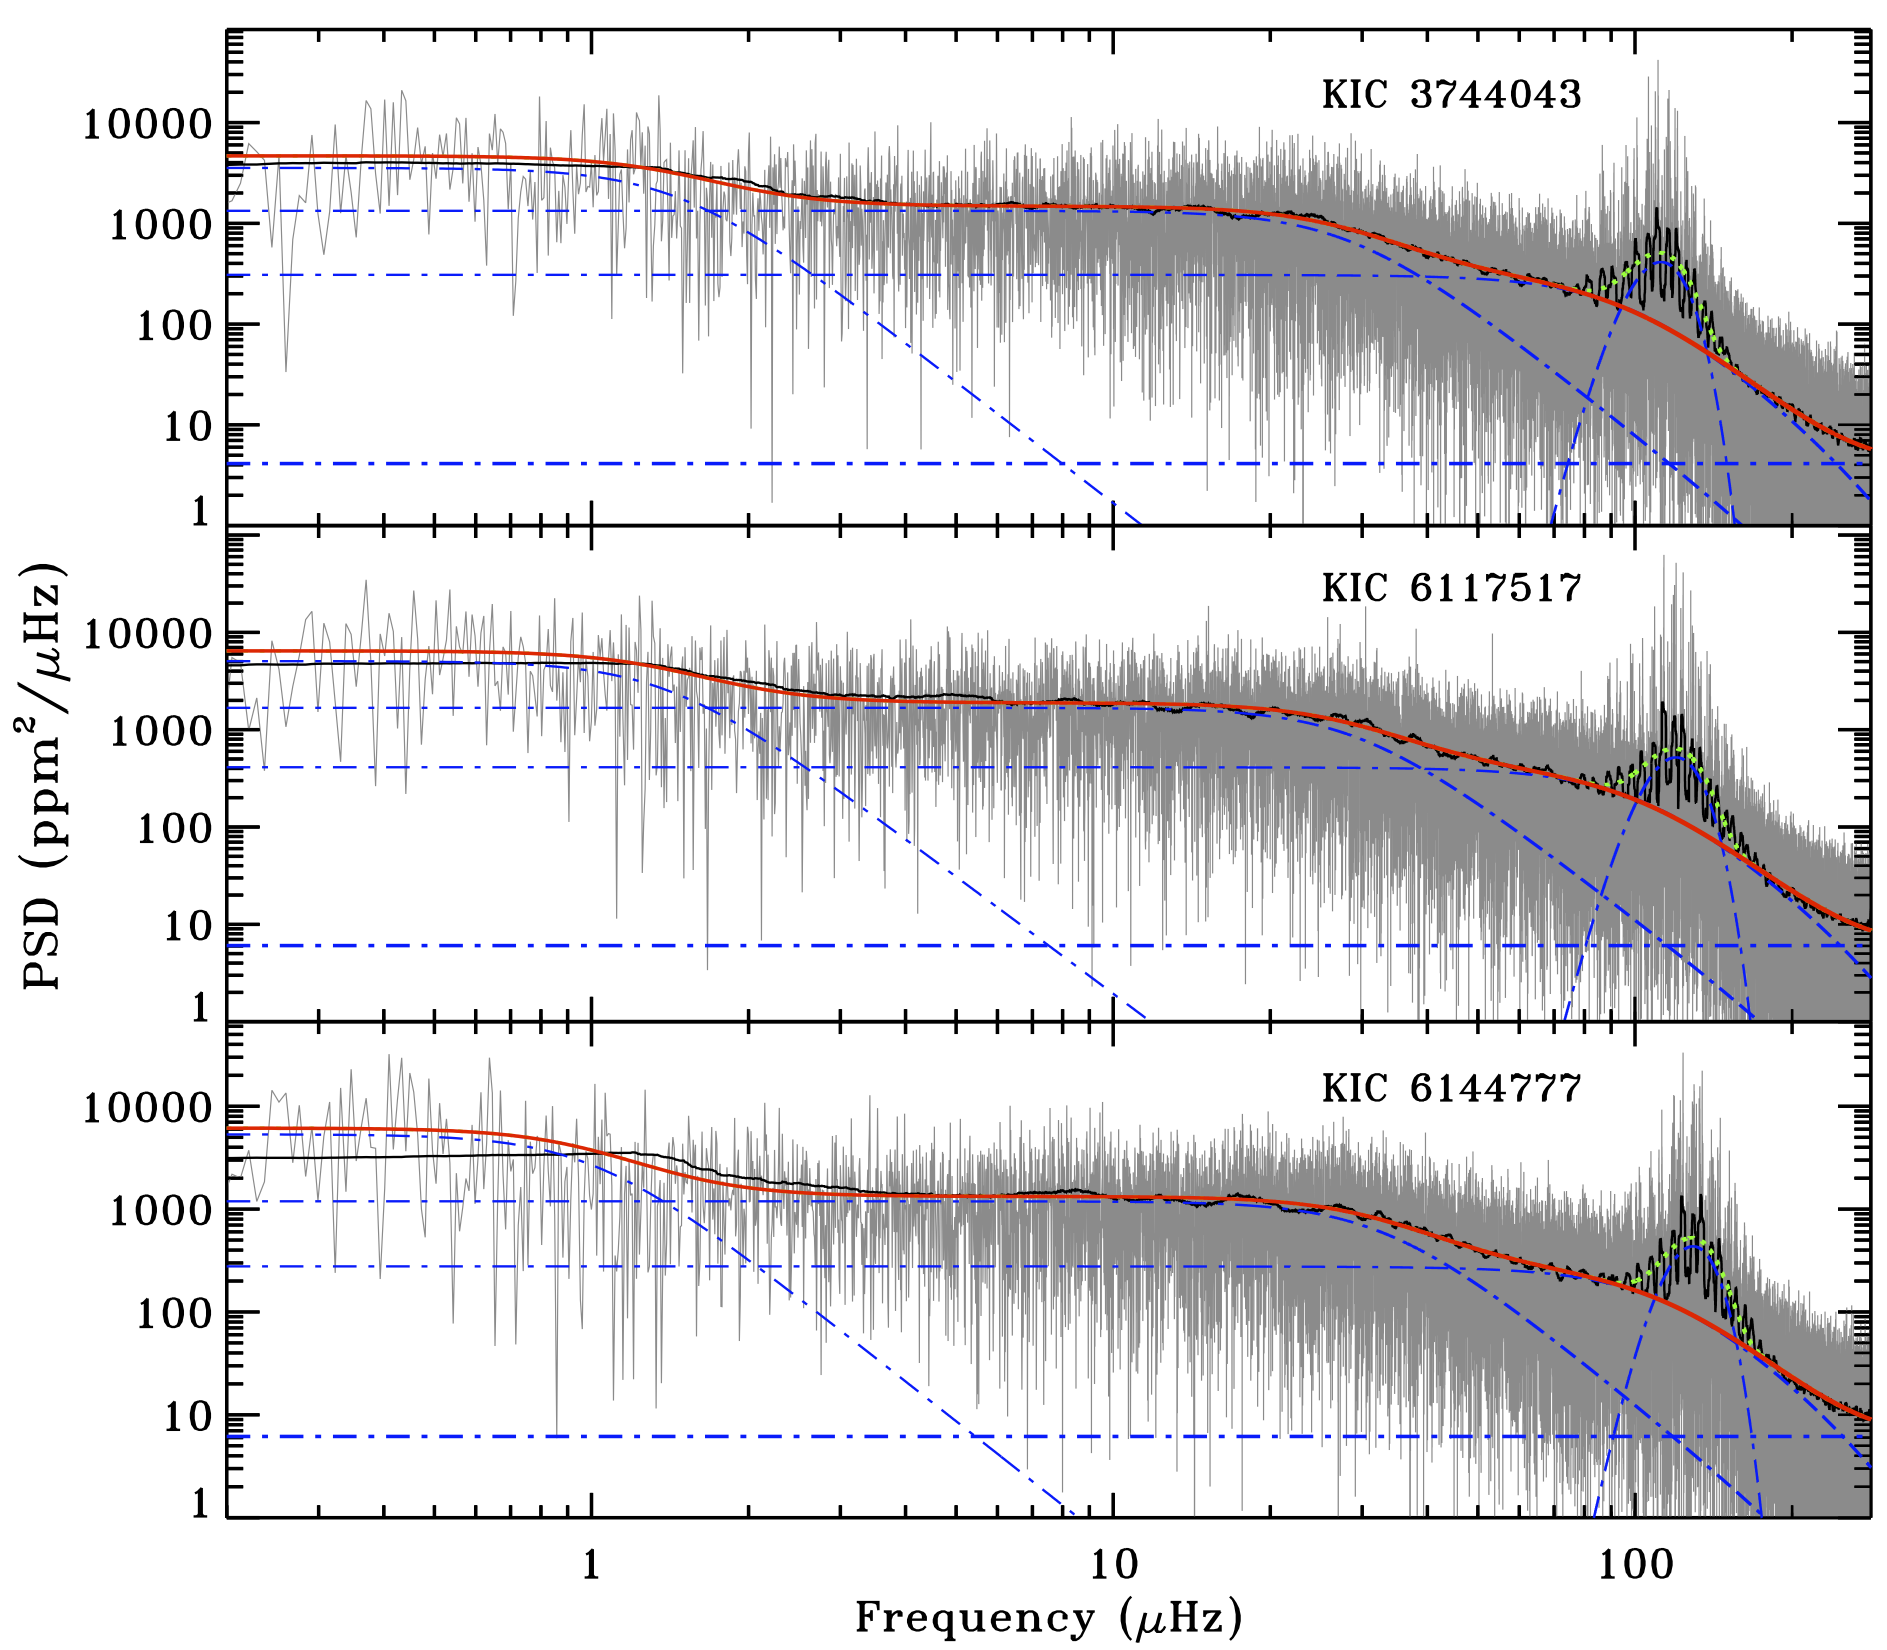
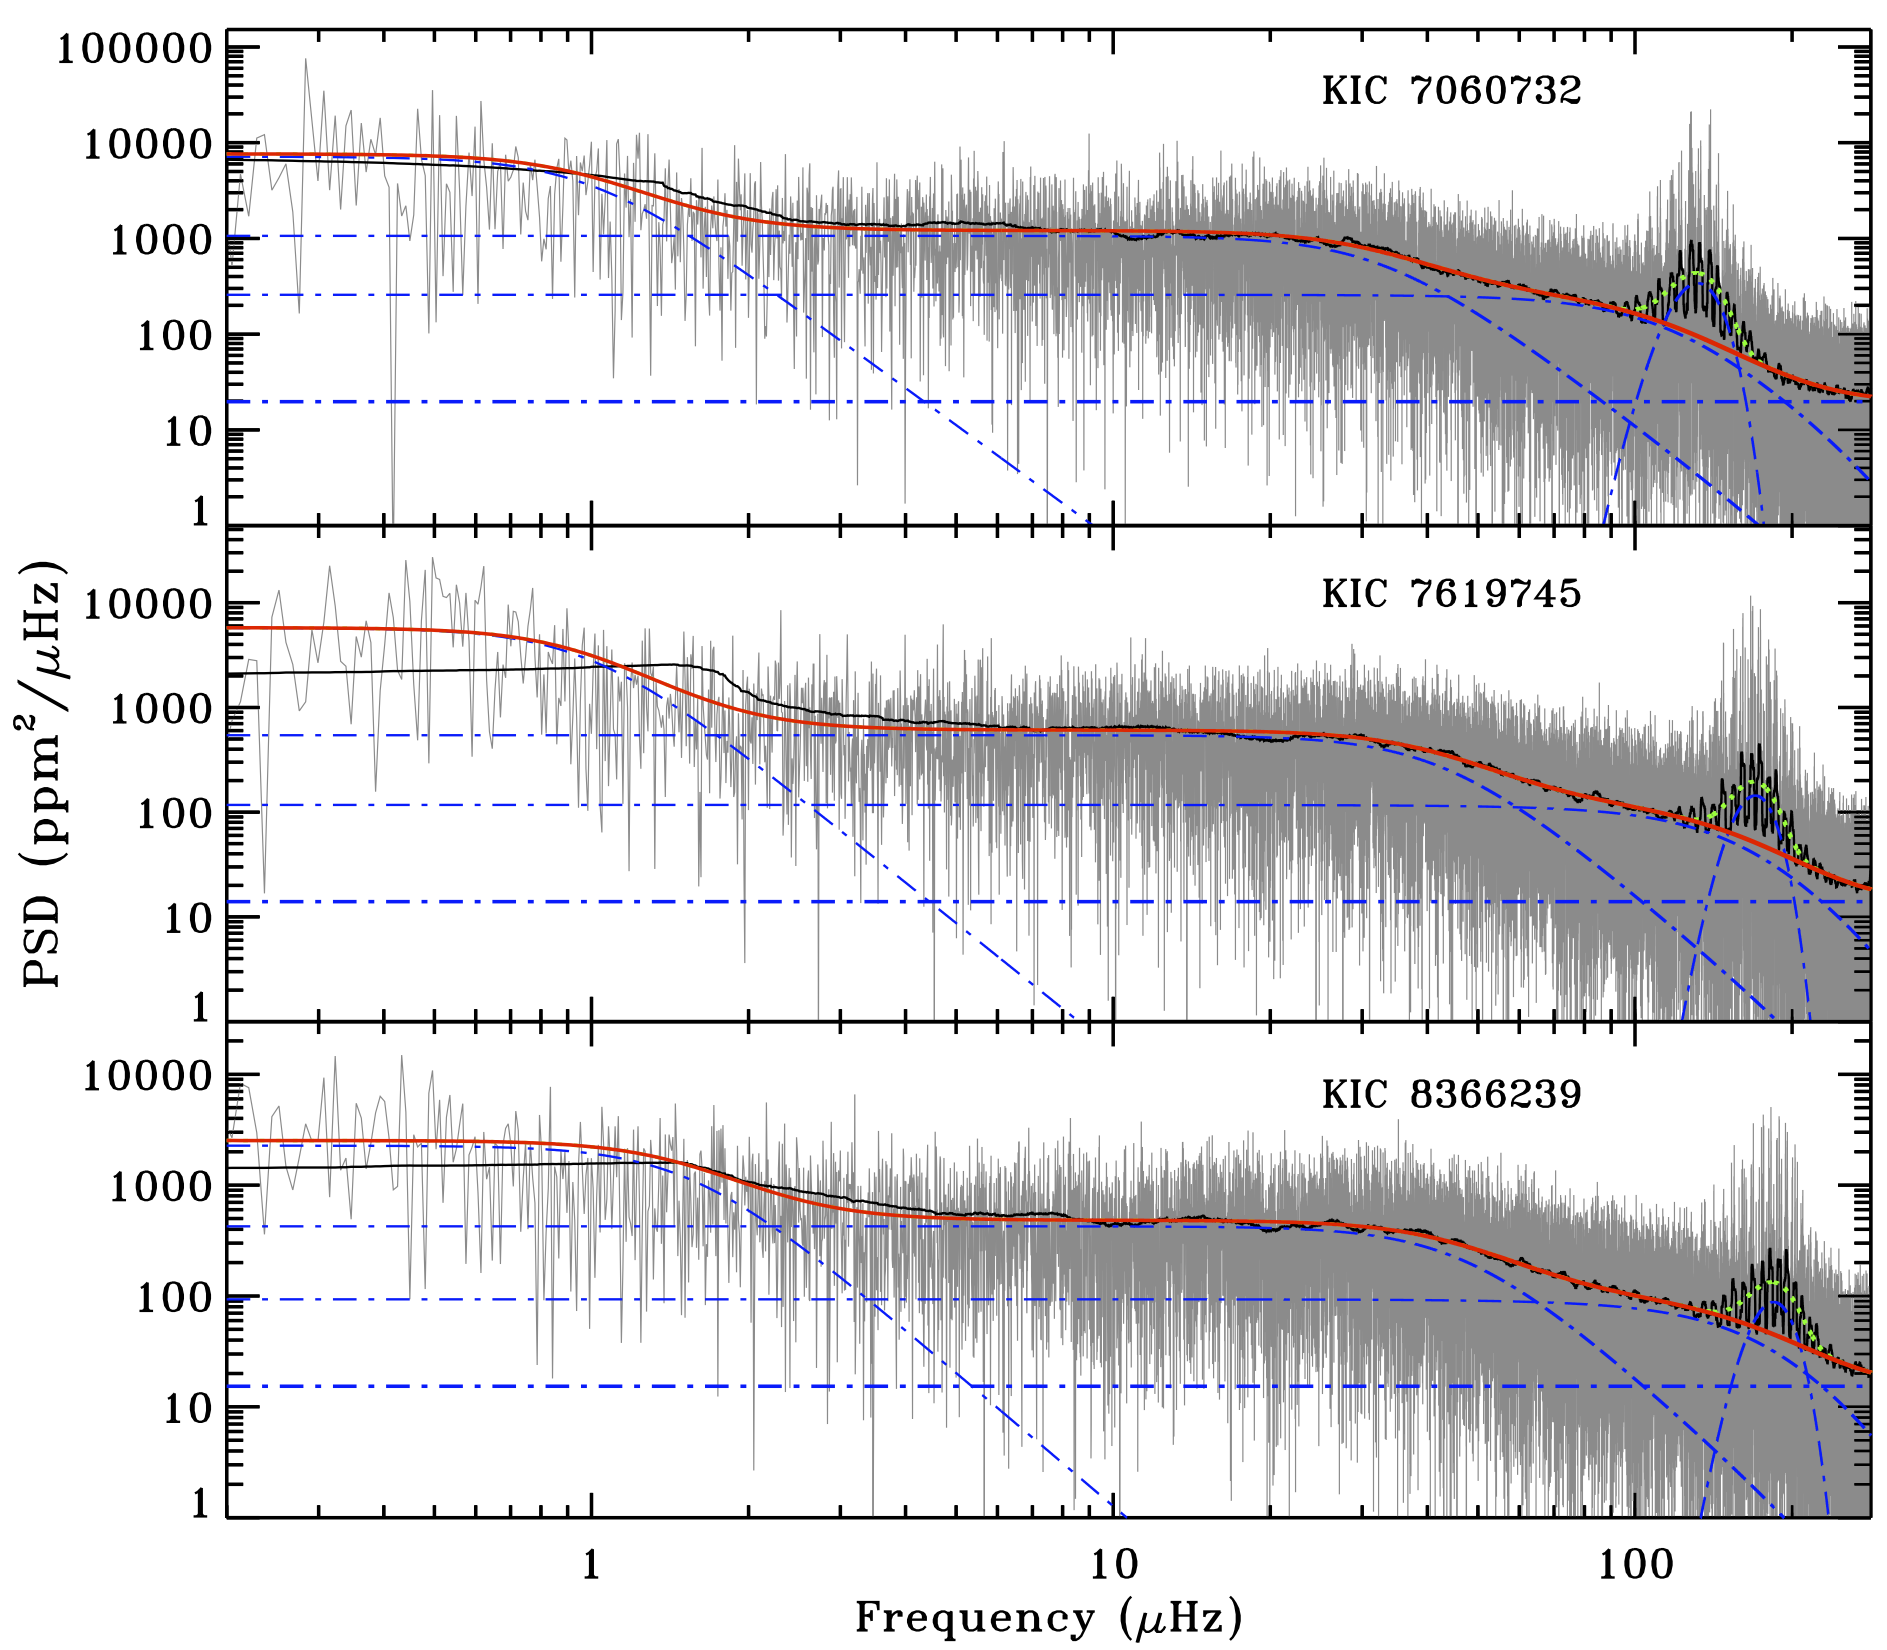
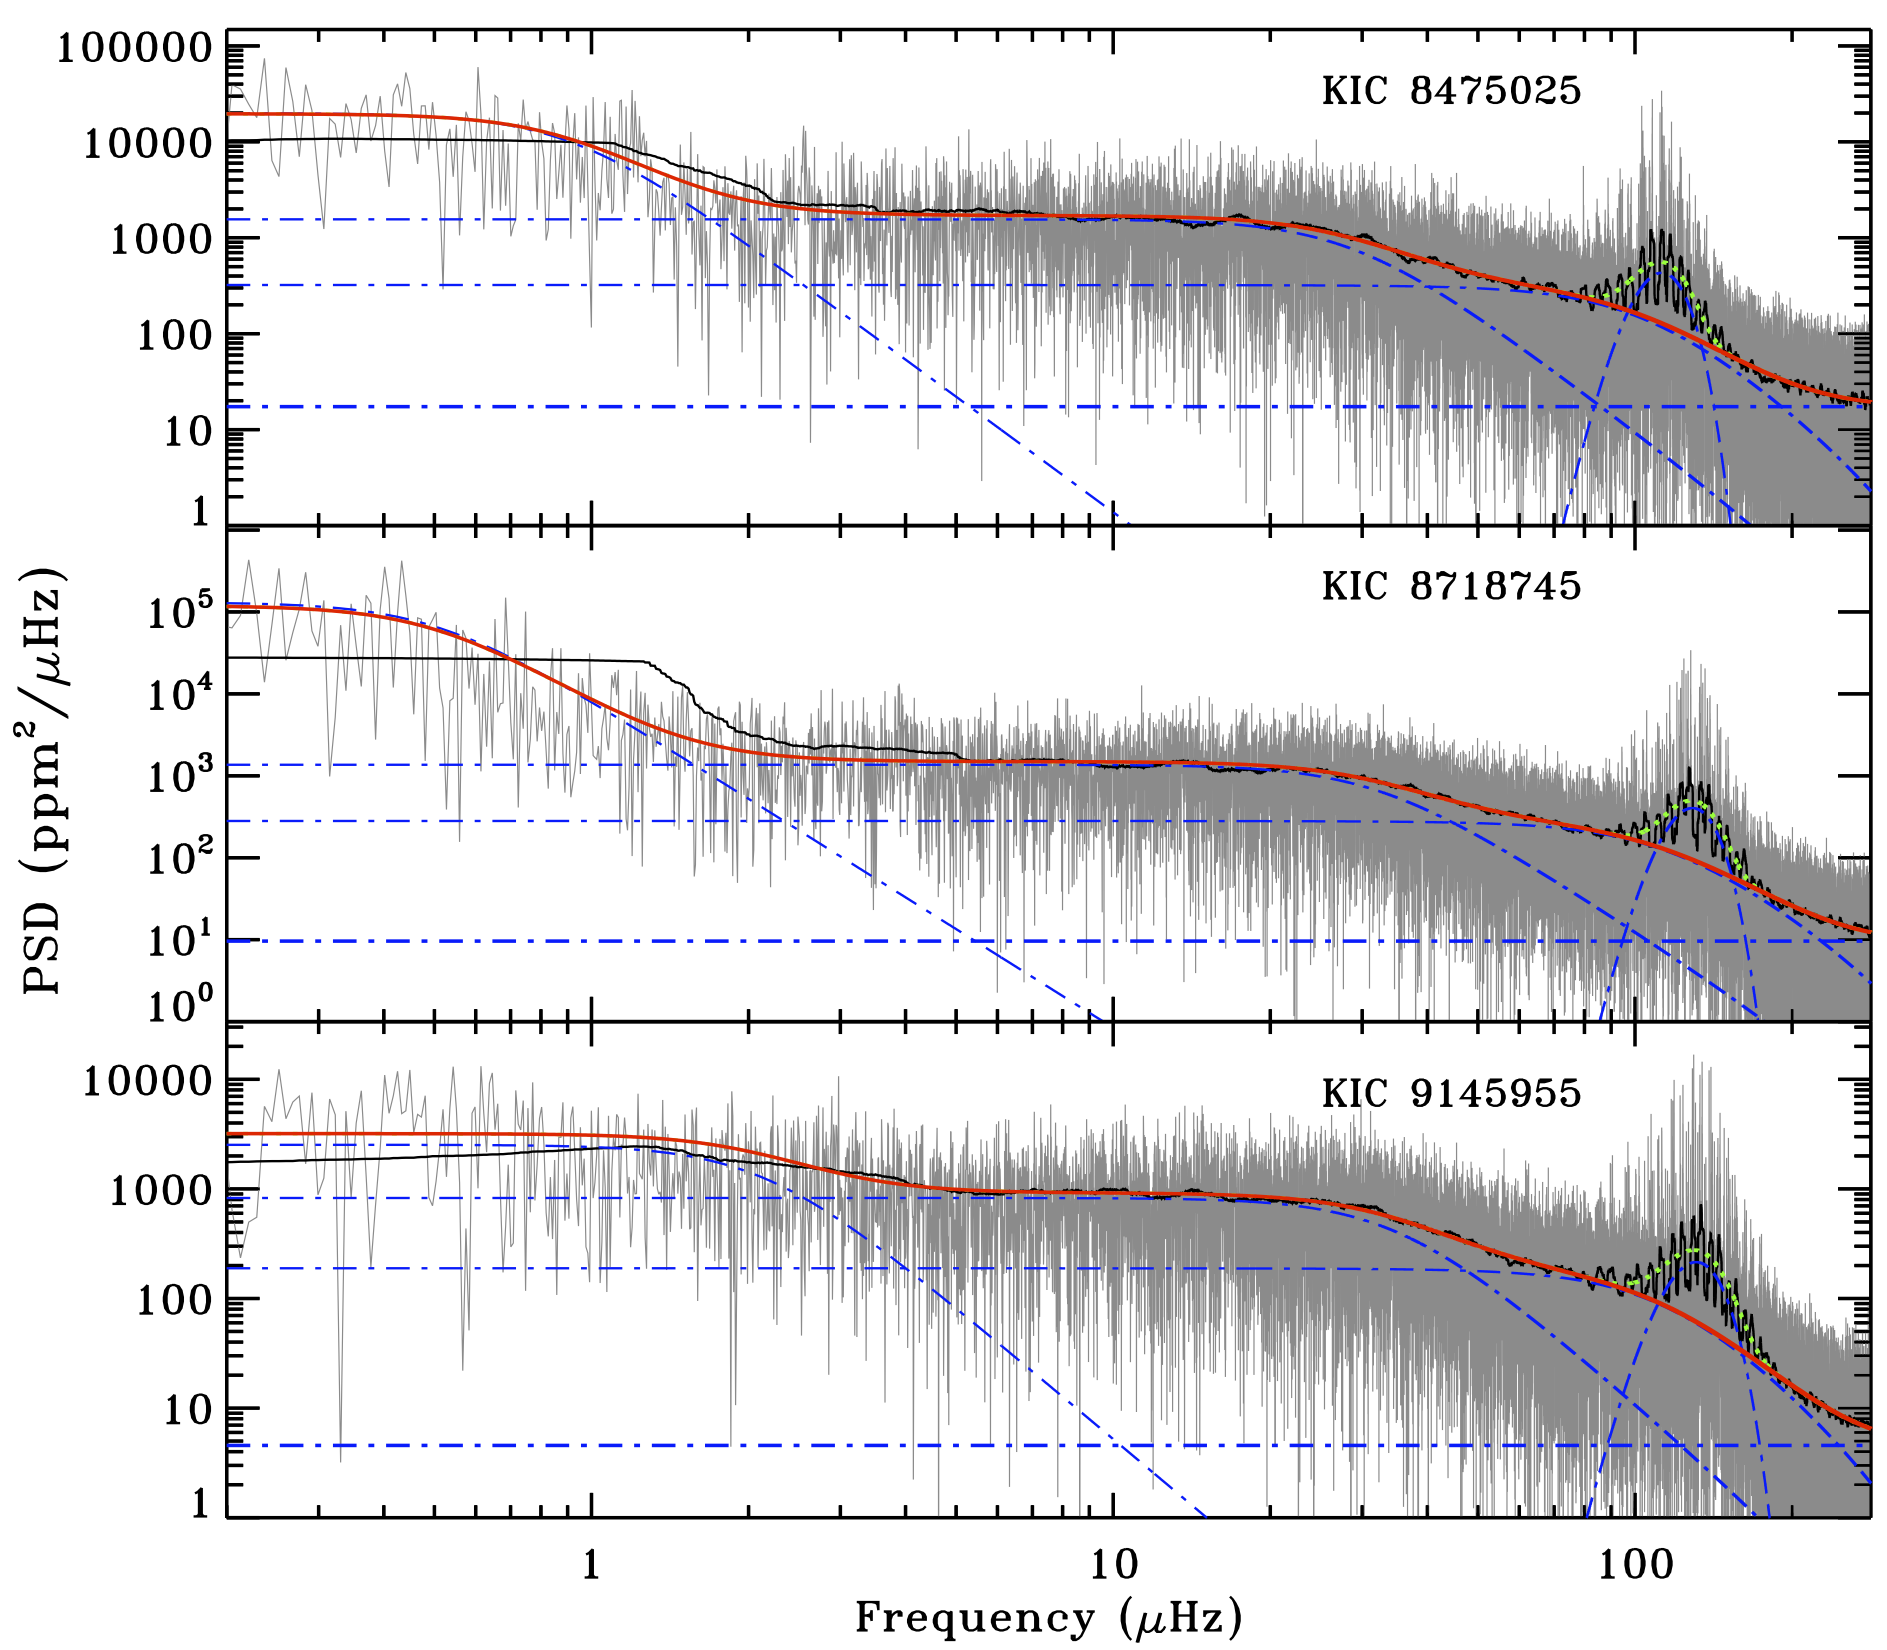
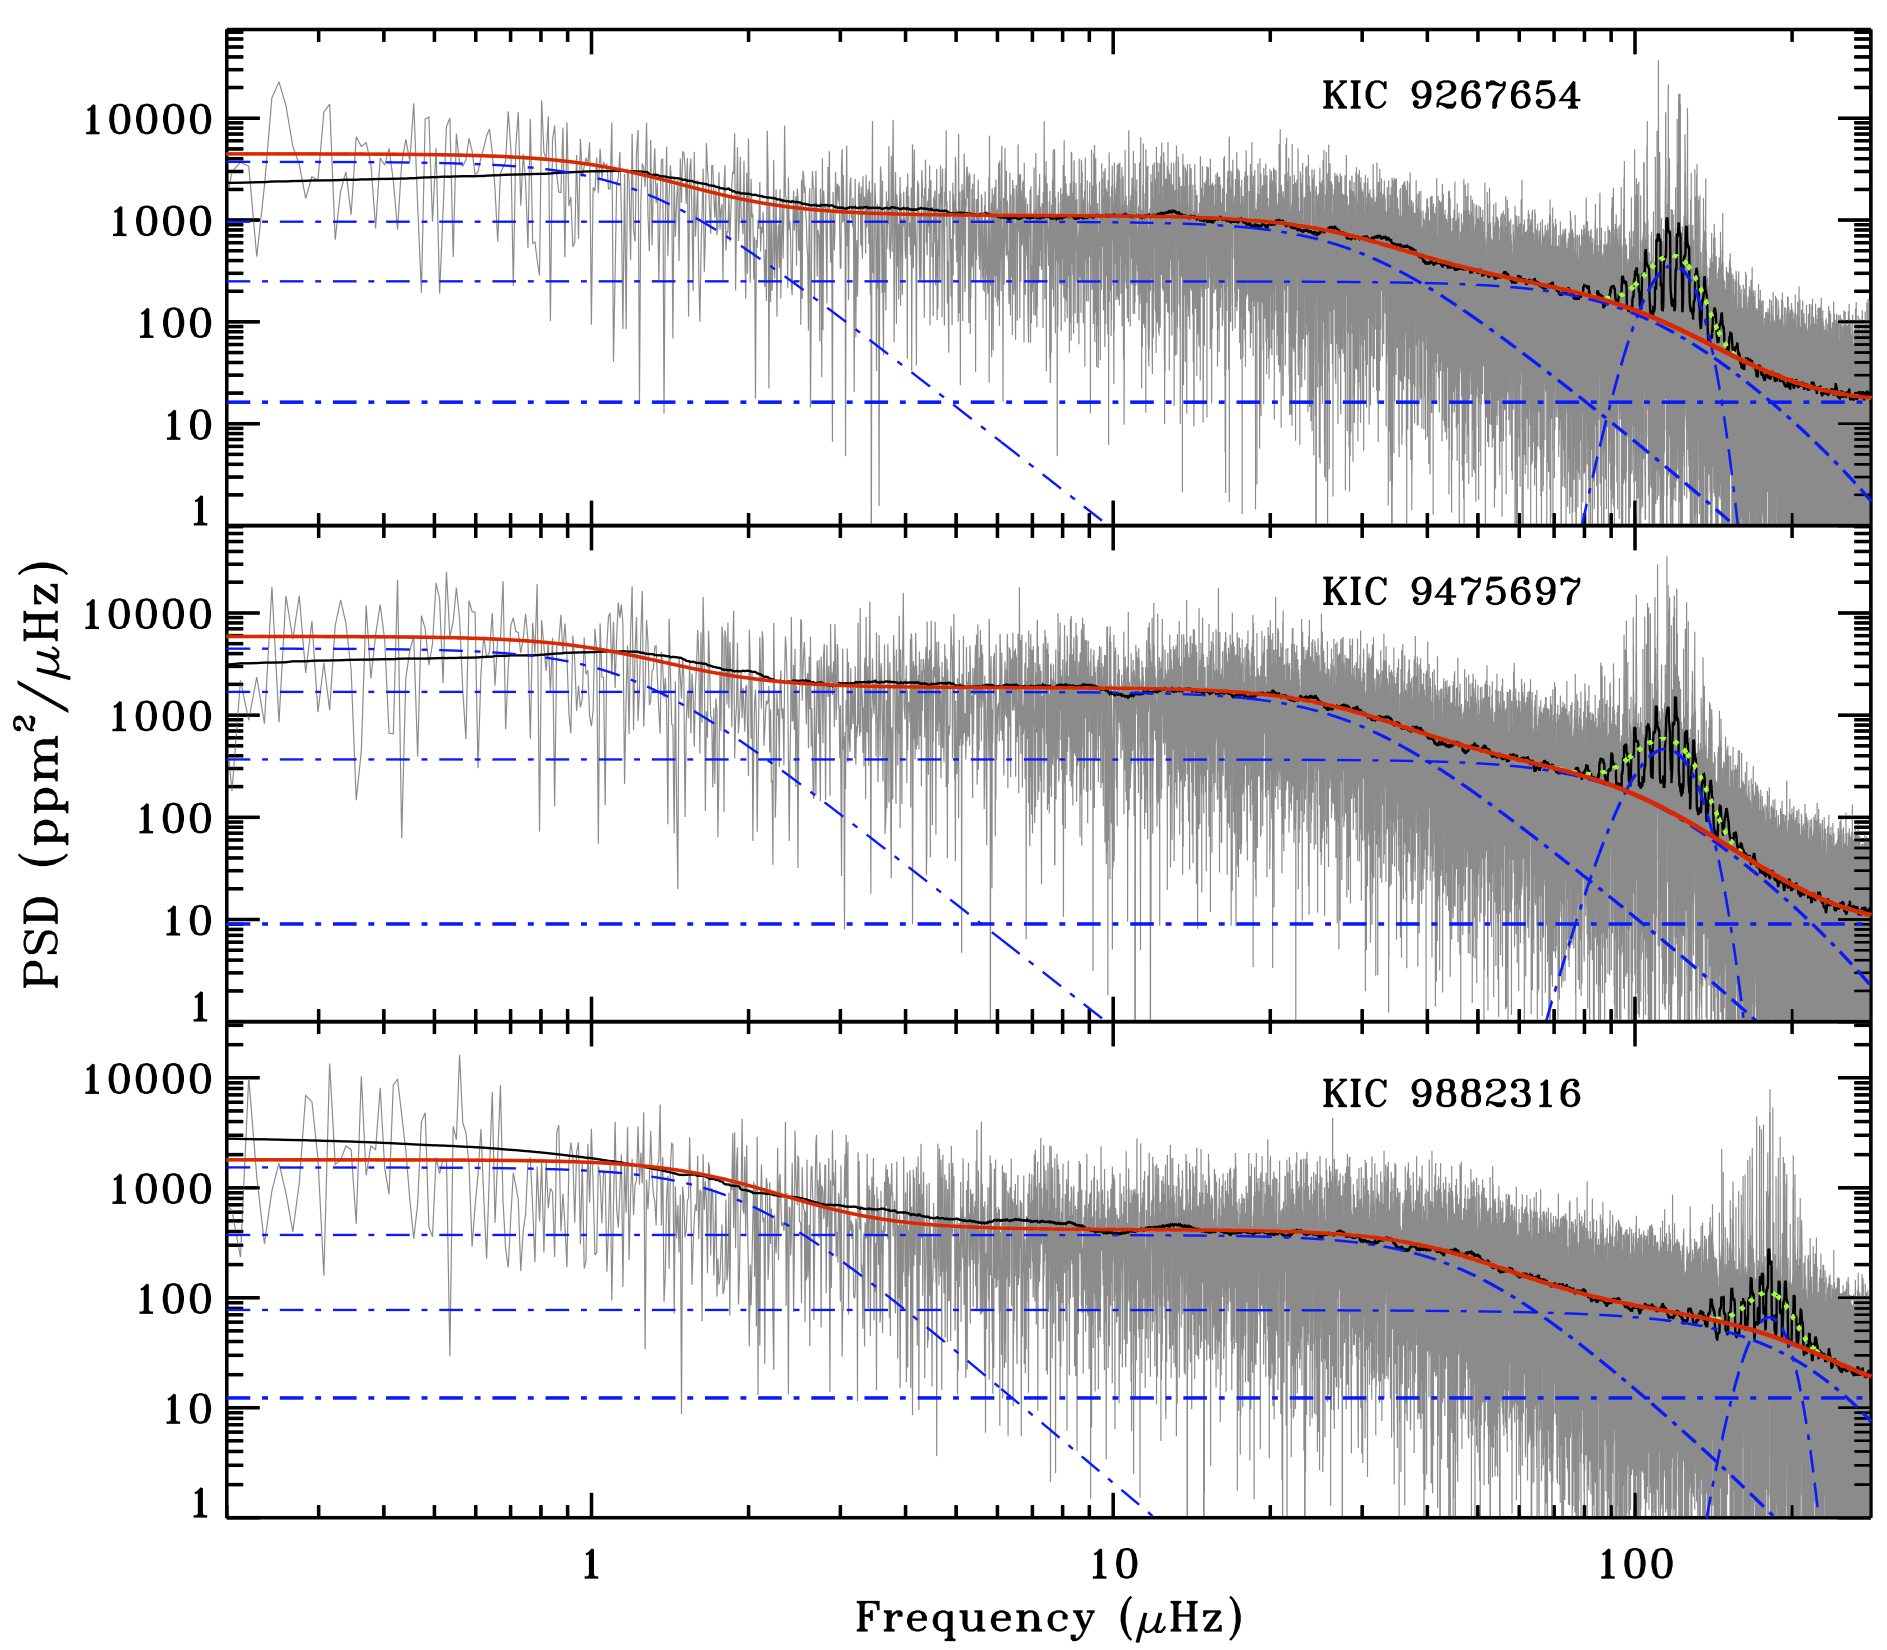
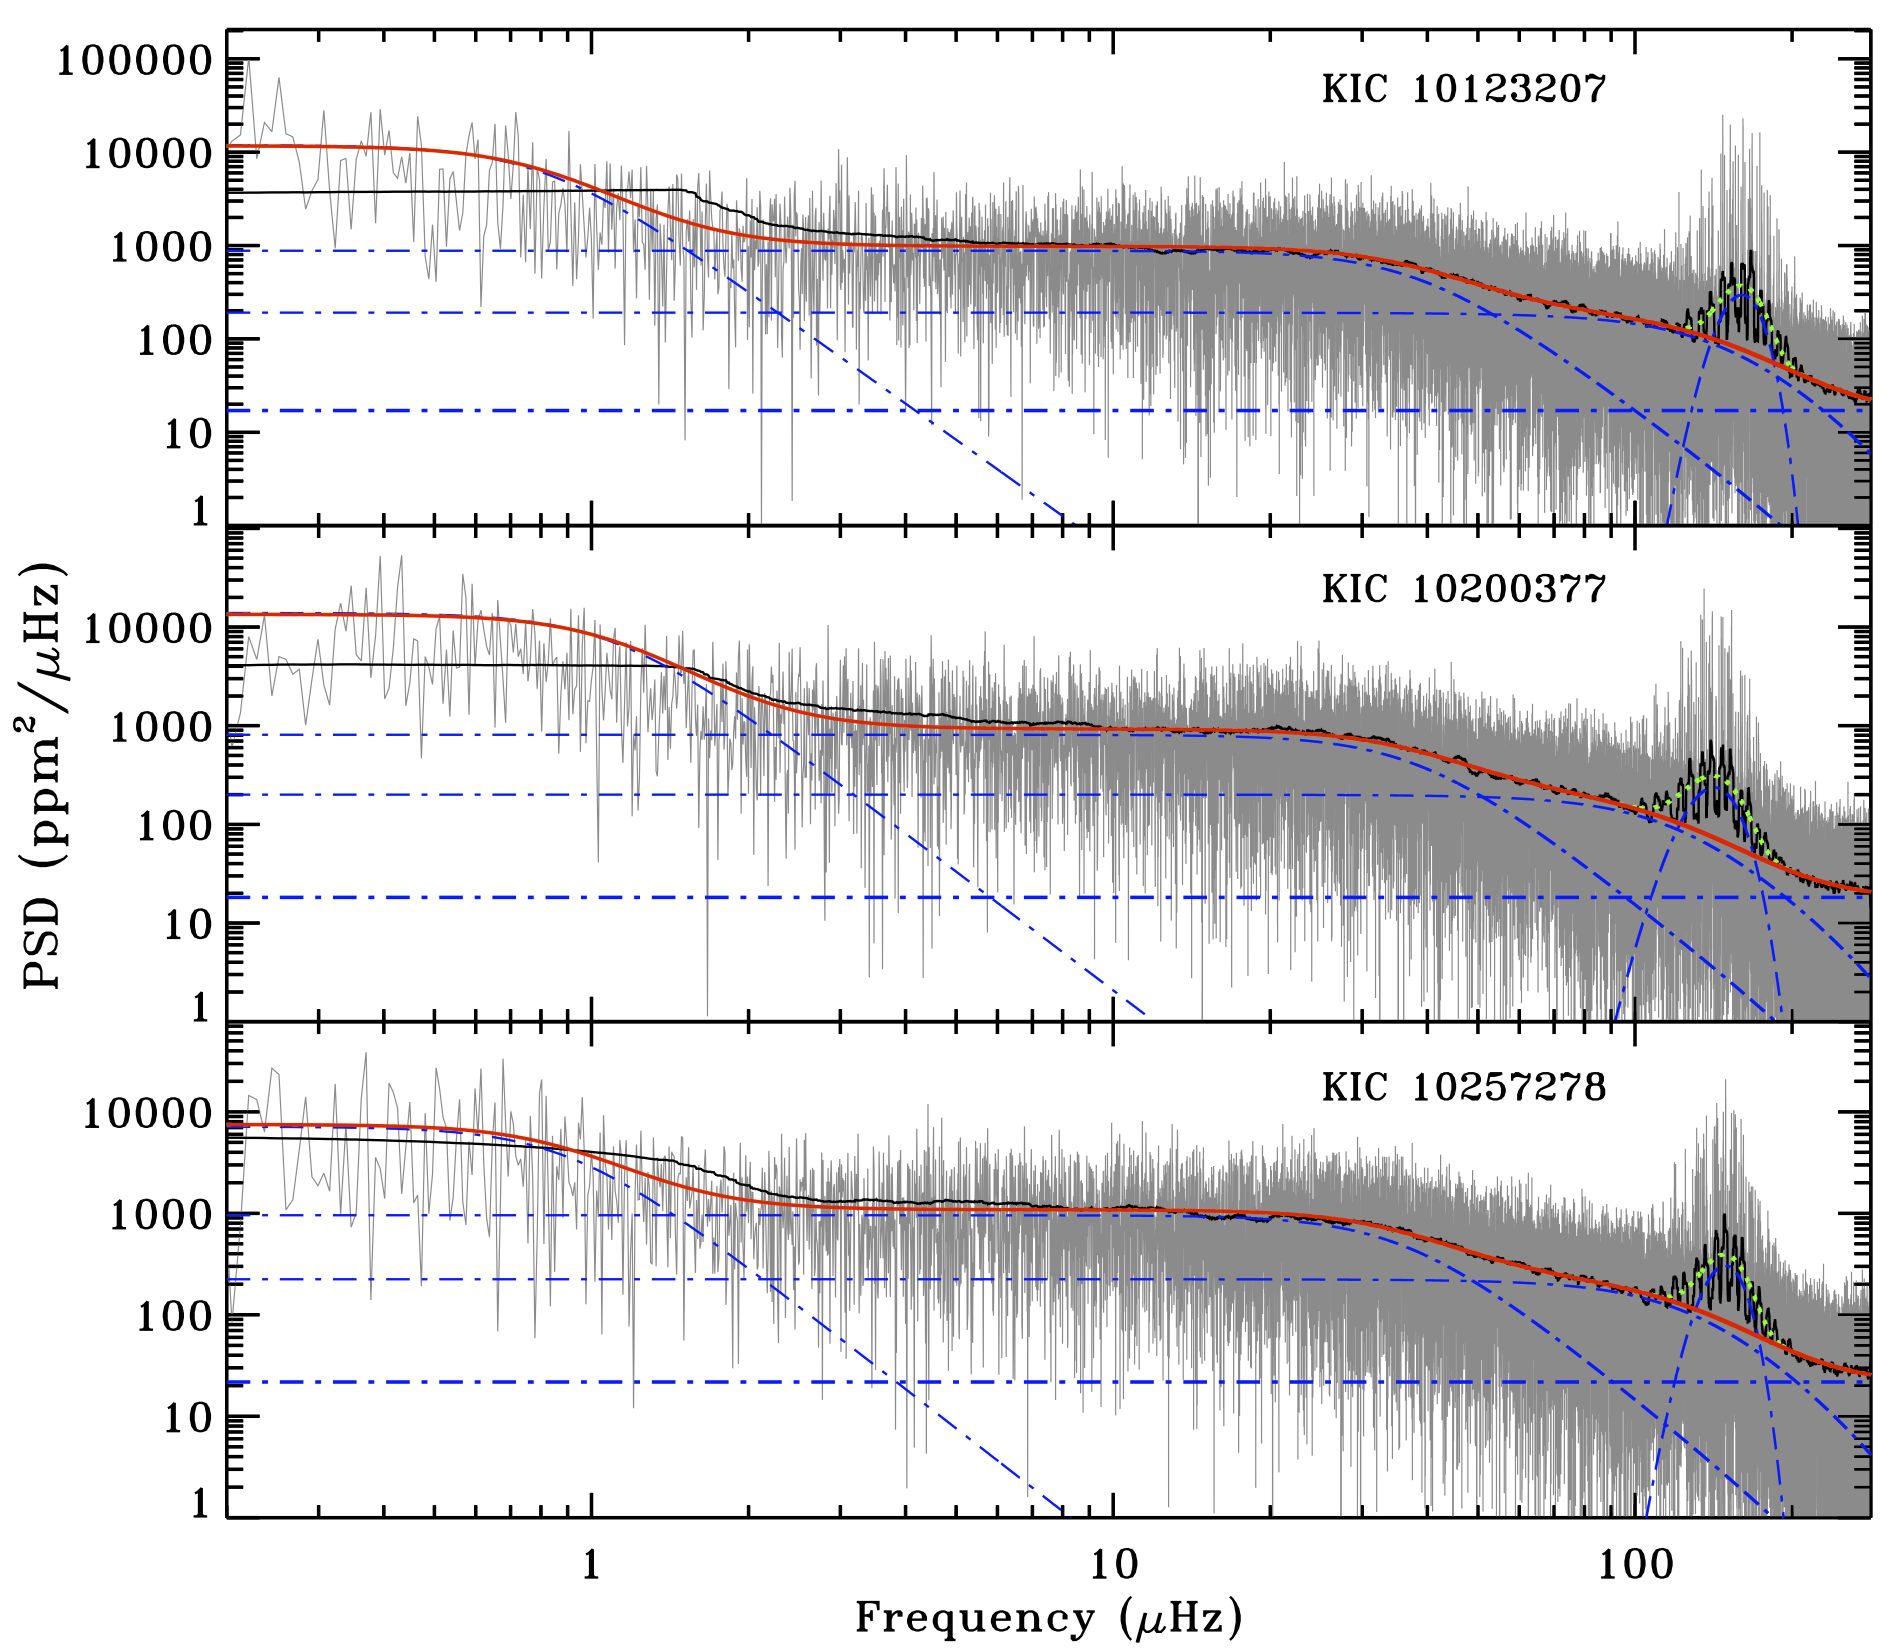
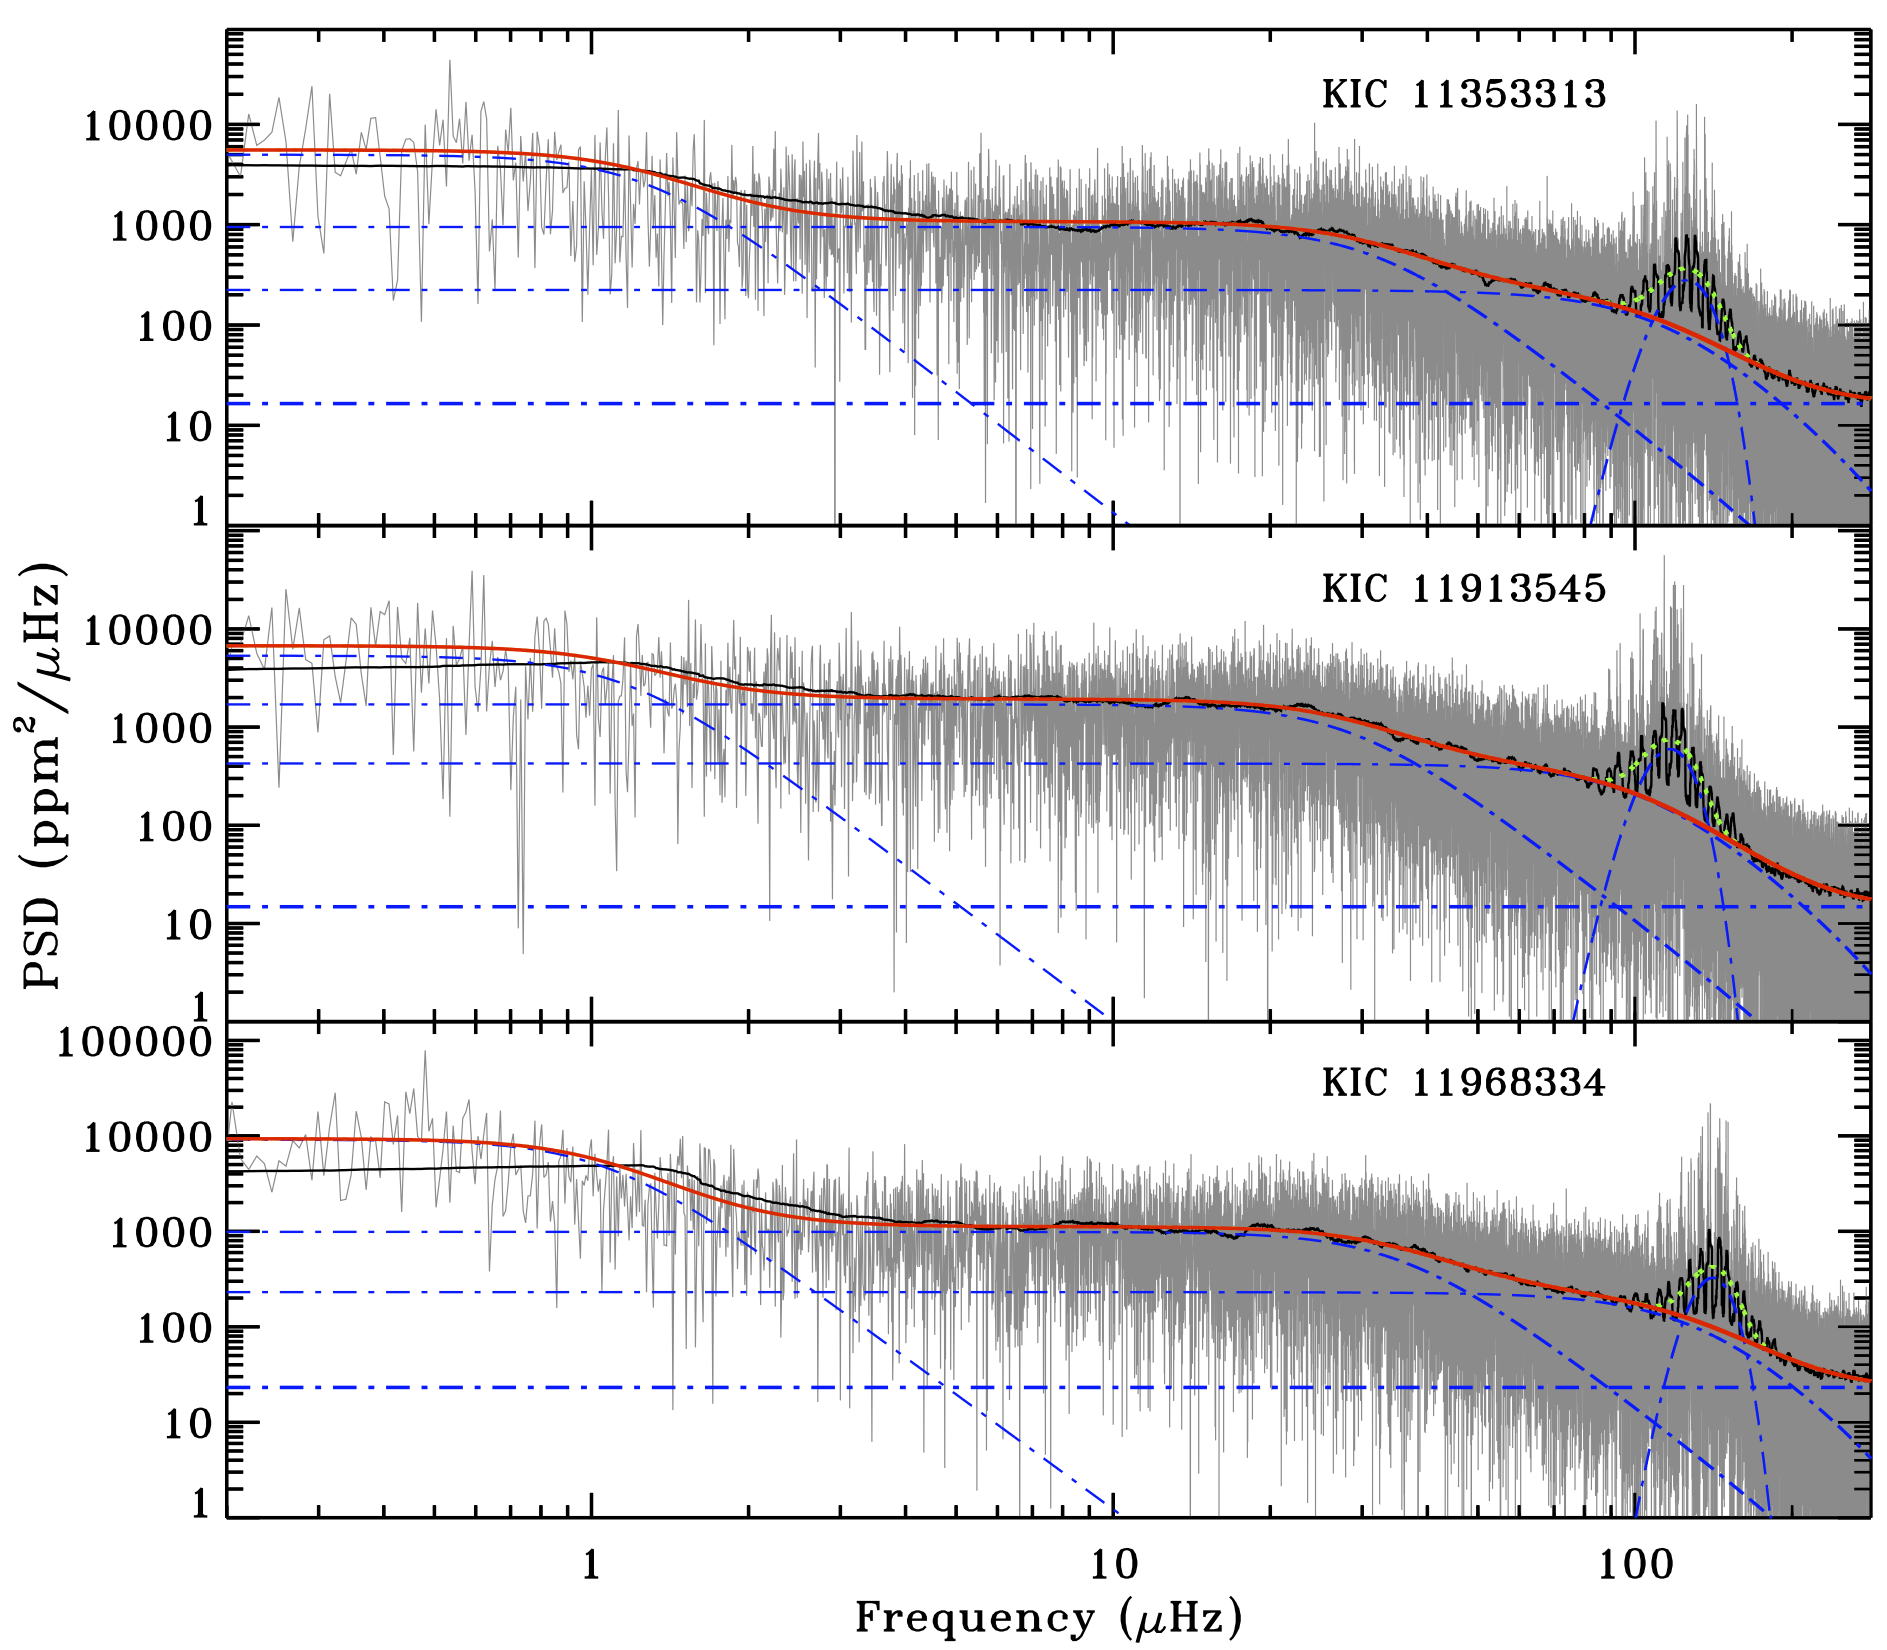
The results from the fit done by means of Diamonds for all the stars of our sample are presented in Appendix A, in which both the parameter values (Tables 2 and 3) and the plots with the background fit are given (Fig. 10). To illustrate the results obtained with the method presented in this paper, we shall from now on refer to the star KIC 12008916, randomly chosen from our sample. The resulting background fit for KIC 12008916 is shown in Fig. 2.
We adopted uniform priors for all the free parameters of the background model by starting from the results obtained by Kallinger et al. (2014). Uniform priors ensure us the fastest computation and are easy to set up (see CD14). The configuring parameters of Diamonds used for the computations of the background fits are given in Appendix A. Our estimated parameters describing the granulation signal of the stars in this sample agree on average within 4.6 % for the amplitudes (, ) and within 5.1 % for the characteristic frequencies (, ) with those measured by Kallinger et al. (2014), who used Kepler light curves about 360 days shorter than ours (up to Q13).
3.2 Extraction of the oscillation mode parameters
The subsequent step in analyzing the stellar PSDs is to adopt an adequate fitting model for the oscillation pattern contained in the region of the power excess. In this work we adopt a method similar to that used by CD14 (see Sect. 6.3), who applied it to the case of an F-type main sequence star. We restrict our frequency range of analysis to the region containing the oscillations, which we identify as , with and listed in Table 3, empirically chosen to ensure all observable modes to be included. We thus take into account some important features characterizing the oscillation pattern in RGs, as explained in the following.
In the oscillation pattern of all the RGs, one can observe forests of modes between consecutive quadrupole and radial modes (also referred to as and , respectively, being the angular degree), which are known as dipole () mixed modes (Beck et al. 2011; Bedding et al. 2011; Mosser et al. 2011a). Since modes have the highest mode inertia because they propagate in high-density regions, their lifetime is significantly longer than that of pure pressure modes (e.g. see Christensen-Dalsgaard 2004). As a consequence, even with an observing time years now made available from Kepler, mixed modes with a g-dominated character may still appear unresolved, whilst others having a more mode-like character can be partially or sometimes even fully resolved.
In this work we distinguish between resolved or partially resolved peaks, for which , and those that are unresolved, for which (e.g. see also Baudin et al. 2011, who used a similar approach). In the former case, the oscillation peak profile that we adopt is that of a Lorentzian (e.g. see Kumar et al. 1988; Anderson et al. 1990) and it is given by
| (5) |
where , , are the amplitude in ppm, the linewidth in Hz and the frequency in Hz, respectively, and represent the three free parameters to be estimated during the fitting process (see Baudin et al. 2005, for more details about the relation between amplitude and linewidth of the peak). According to the Fourier analysis, an oscillation peak that is not resolved has a profile represented as (Christensen-Dalsgaard 2004):
| (6) |
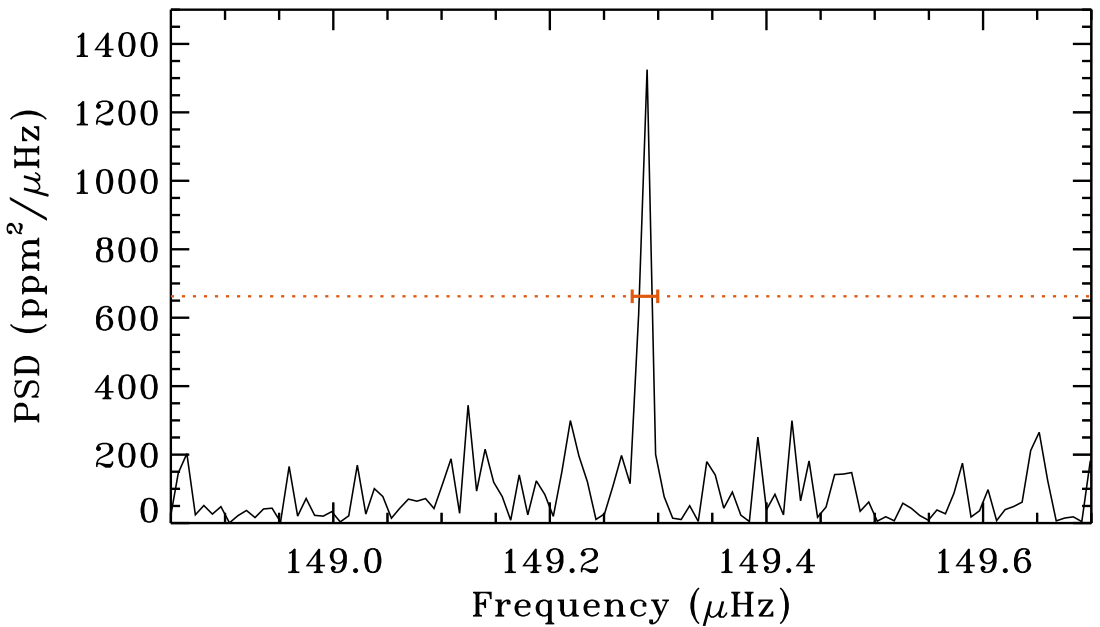
where and are the height in PSD units and the central frequency in Hz of the oscillation peak, respectively, and must be estimated during the fitting process, while is fixed as the frequency resolution introduced in Sect. 2. Fitting the height of an unresolved mode is preferred since it is an observable and the linewidth of the peak is not a fitting parameter in this case. However, one can easily derive the corresponding amplitude for the unresolved peak as . An example of this type of oscillation peak is shown in Fig. 3 for the star KIC 12008916, where the peak width spans only a few data bins in frequency. In this case, a Lorentzian profile would represent an inadequate model because fitting the linewidth is neither meaningful nor needed for an unresolved mode. Moreover, using a Lorentzian profile to fit unresolved modes destabilizes considerably the fitting process because the linewidth tends to assume values smaller than the frequency resolution itself. Whereas this problem could be partially solved by setting a lower limit to the linewidth free parameter by means of an adequate prior, using a Lorentzian profile for the unresolved modes slows down the computation in any case since each Lorentzian profile requires one more free parameter to be fit with respect to the case of a profile.
According to the description given in this section and still following CD14, we now fix the background parameters corresponding to the white noise, , and the super-Lorentzian profiles, , to the values listed in Table 2. Then, the final peak bagging model can be represented as
| (7) |
where the model representing the oscillation peaks is now given by a mixture of Lorentzian and sinc2 functions
| (8) |
with and the number of resolved and unresolved peaks to be fit, respectively. In an empirical Bayesian approach as that used by CD14, the prior distributions on each free parameter can easily be set by visual inspection of the PSD of the stars. Likewise done for the case of the background fitting, we adopt uniform prior distributions for all the free parameters of the peak bagging model (see CD14). An example of the resulting fit by using the peak bagging model given by Eq. (7) is depicted in Fig. 5 for a chunk of PSD of KIC 12008916, where all the oscillation modes for which a Lorentzian profile was used are marked by a shaded colored band (see the figure caption for more description).
3.3 Peak significance test
Testing the significance of an oscillation peak in the PSD of a star is a crucial aspect that has to be considered for providing a reliable set of modes that can be used for the modeling of the oscillations, hence to investigate the stellar structure and the evolution of the star. For this purpose, following CD14 (Sect. 6.5) we consider a detection probability for a single peak, , defined as
| (9) |
where and are the Bayesian evidences for the models excluding and including, respectively, the oscillation peak to be tested. The probability is the complementary probability stating the non-detection of the oscillation peak. For clarity, we shall refer only to for the remainder of the paper as it represents a direct measure of the reliability of the oscillation peak.
In the Bayesian mindset, one has to provide all the peaks tested with their corresponding value, no matter if their detection probability is low (e.g. below 50 %, see also CD14, Sect. 6.5). However, we have performed a test using simulations to calibrate the method and gain a more reliable understanding about which threshold in is the most suitable to follow for properly selecting the oscillation modes. In particular, we have simulated 1000 chunks of PSD of a possible RG in the range - Hz by means of the simulator provided by De Ridder et al. (2006), with either flat noise only or flat noise and a single oscillation peak. This was done by including a randomly generated flat noise component in each of the 1000 simulations and by adding an oscillation peak corresponding to a resolved mode (having the typical Lorentzian shape) in 100 randomly chosen simulations out of the initial 1000. This gives us a probability of 10 % to select one simulation containing a peak.
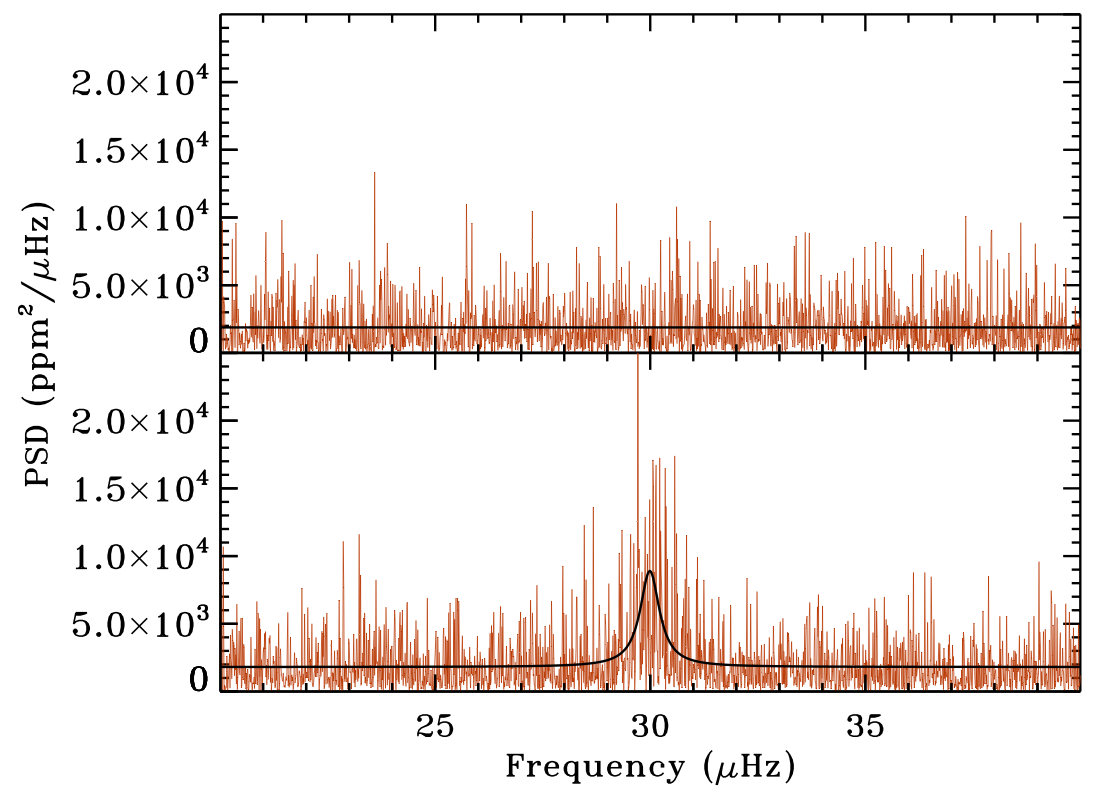
In each simulation containing a peak, both the amplitude, the linewidth and the central frequency of the peak were varied across the different simulations. We then performed a blind exercise by fitting the entire set of 1000 simulations without knowing which of them was containing a peak and in what order. To do the test we used two models: (i) a model, , including only a flat noise component, represented by a single free parameter; (ii) a model, , including both the flat noise component and the Lorentzian profile, given by Eq (5), for a total of four free parameters. The two models considered are therefore fit to all the individual chunks, no matter if they contain or not the oscillation peak. An example of the two fitting models is shown in Fig. 4 for two different simulations, with and without the oscillation peak.
We computed 2000 Bayesian evidences, and with ranging from 1 to 1000, namely one for each of the two models in each simulation. By computing the detection probabilities for each simulation according to Eq. (9), all the simulations containing the oscillation peak could be identified when adopting the threshold (meaning that the model containing the oscillation peak is significantly more likely than the one containing only the flat noise component). This probability threshold corresponds to the limit of a strong evidence condition in the Jeffreys’ scale of strength (Jeffreys 1961). This shows that, despite is disfavored because it contains 3 more free parameters than — according to the Bayesian perspective of Occam’s razor — it provides a much better fit than that of a single noise component when the oscillation peak is present, thus resulting in a considerably larger Bayesian evidence (see also CD14, Sect. 2.1 for more discussion). We therefore now have a method to detect peaks based on the Bayesian model comparison that works well and it is straightforward to conduct.
We can easily extend this analysis to the case of an unresolved peak by changing the function that describes the peak profile in the model with that given by Eq. (6). Thus, following Approach 1 described in CD14, for each star in our sample we fit chunks of PSD with a frequency range containing one radial order per time, and apply the peak significance test as described before to all the ambiguous detections occurring in the selected chunk.
We note that while performing the peak significance test for the 19 LRGs, we found that a 8 level, with representing the background level fit given in Sect. 3.1 and used in the peak bagging model, Eq. (7), is a raw indication of the 99 % threshold in for all the targets, and can thus be used as a guideline to select peaks to be tested with our method based on the Bayesian model comparison. Fig. 5 illustrates an example of peak significance test performed for KIC 12008916, where (the peak marked by the vertical dotted red line), with a background level overlaid (dashed blue line) to show that the peak height of the tested peak is well comparable.
3.4 Mode identification
The last step of the peak bagging analysis involves the mode identification. In the case of pure acoustic modes this is accomplished by computing their position relative to that of the closest radial mode, which in turn can usually be easily identified in all the stars due to its high amplitude and linewidth. We therefore adopt the asymptotic relation for modes (Vandakurov 1968; Tassoul 1980), obtaining for each radial order :
| (10) |
| (11) |
| (12) |
where is the mean large frequency separation. The mean small frequency spacings and are derived through the relations provided by Corsaro et al. (2012):
| (13) |
| (14) |
with mass-dependent slopes
| (15) |
and
| (16) |
valid for RGB stars like in our sample. The mean small frequency spacing is given by the relation (Huber et al. 2010):
| (17) |
For the mixed modes we instead adopt the asymptotic relation provided by Mosser et al. (2012b) (their Eq. (9)). The mode identification for the rotationally split modes (,, being the azimuthal order) is instead derived from the position of the central components since the modes are in general well separated in LRGs. All the values for , mass, the period spacing of modes and the coupling factor , are taken from Mosser et al. (2012c) and are listed in Table 1 for a summary.
Whereas the asymptotic values for modes proved to be quite accurate for all the stars, in the case of mixed modes a correction for and from the values listed in Mosser et al. (2012c) was required for some targets (indicated in Table 1), especially those showing variations in with the radial order (see Sect. 4 for more details). The correction was made by an auxiliary fit to the mixed mode frequencies in a bi-dimensional grid spanning and units, respectively, from the literature values. The auxiliary fit has the only purpose of providing a more reliable proxy for the frequency position of the dipole mixed modes, hence used for the mode identification process.
The stars KIC 8475025, KIC 9267654, and KIC 11353313, in particular, were found to show mixed modes with a peculiar frequency position because the frequency splitting due to the rotation of the star is very similar to the frequency spacing between adjacent mixed modes. This generates a misleading mode identification at first glance. A cautious inspection of all the rotational split components for these stars was therefore needed in order to solve the ambiguity (e.g. see Beck et al. 2014, for more discussion on mode identification in these difficult cases). For the remainder stars of the sample, the mode identification was straightforward even when rotational effects are present.
| KIC ID | Mass | |||
|---|---|---|---|---|
| (Hz) | () | (s) | ||
| 03744043 | 9.90 | 1.3 | 75.98 | 0.16 |
| 06117517 | 10.16 | 1.3 | 76.91 | 0.14 |
| 06144777a𝑎aa𝑎aStars for which an auxiliary fit for (, ) was required. | 11.01 | 1.1 | 69.91 | 0.22 |
| 07060732a𝑎aa𝑎aStars for which an auxiliary fit for (, ) was required. | 10.94 | 1.3 | 72.78 | 0.18 |
| 07619745 | 13.13 | 1.5 | 79.17 | 0.15 |
| 08366239a𝑎aa𝑎aStars for which an auxiliary fit for (, ) was required. | 13.70 | 1.9 | 86.77 | 0.17 |
| 08475025a,b𝑎𝑏a,ba,b𝑎𝑏a,bfootnotemark: | 9.66 | 1.4 | 74.80 | 0.13 |
| 08718745 | 11.40 | 1.1 | 79.45 | 0.11 |
| 09145955 | 11.00 | 1.4 | 77.01 | 0.16 |
| 09267654a,b𝑎𝑏a,ba,b𝑎𝑏a,bfootnotemark: | 10.34 | 1.3 | 78.41 | 0.13 |
| 09475697 | 9.88 | 1.5 | 75.70 | 0.12 |
| 09882316 | 13.68 | 1.6 | 80.59 | 0.15 |
| 10123207 | 13.67 | 1.0 | 83.88 | 0.17 |
| 10200377 | 12.47 | 1.1 | 81.58 | 0.16 |
| 10257278 | 12.20 | 1.4 | 79.81 | 0.18 |
| 11353313a,b𝑎𝑏a,ba,b𝑎𝑏a,bfootnotemark: | 10.76 | 1.5 | 76.00 | 0.14 |
| 11913545 | 10.18 | 1.3 | 77.84 | 0.12 |
| 11968334 | 11.41 | 1.4 | 78.10 | 0.13 |
| 12008916a𝑎aa𝑎aStars for which an auxiliary fit for (, ) was required. | 12.90 | 1.3 | 80.47 | 0.14 |
$b$$b$footnotetext: Stars with a large rotational splitting, of the same magnitude of the frequency spacing between adjacent mixed modes. A careful mode identification of the split components was required for this case.

4 Results
All the results for oscillation frequencies, amplitudes, linewidths for the resolved modes, and oscillation frequencies and heights for the unresolved ones are presented in Appendix B, with detection probabilities for the peaks that required a significance test as explained in Sect. 3.3, and with a mode identification as explained in Sect. 3.4. A total of 1618 oscillation modes was fit for the peak bagging analysis presented in this work, with an average of modes per star. We performed a peak significance test for a total of 612 peaks (38 % of the entire number of oscillation modes), of which 380 (62 % of tested peaks) gave a detection probability . This results in a 14 % of the total number of peaks that did not fulfill the suggested detection threshold. The configuring parameters of Diamonds used during the computations are specified in the corresponding appendix.
The 68 % Bayesian credible intervals are provided for each measurement as computed from the individual marginal probability distributions of the model parameters, according to the description given by CD14. We note that for some oscillation modes, the quoted error bars of the corresponding frequencies can be smaller than the formal frequency resolution of the PSD. Although not intuitive at first glance, this may happen because the reported error bars only refer to the capability of the adopted model to reproduce the observations, an aspect that is not uniquely depending on the resolution of the dataset, in our case represented by the formal frequency resolution obtained from the Fourier analysis (e.g. see Fröhlich et al. 2012, for more discussion on the presence of error bars smaller than the resolution given by the data, as obtained from another astrophysical application of the Bayesian inference). This effect is evident for those oscillation modes for which a sinc2 profile is used, whose characteristic small FWHM (few data bins) and the well appropriate profile shape at reproducing spike-like peaks (see Fig. 3), leads to a more precise estimate of the frequency centroid than in the case of the Lorentzian profile fitted to resolved or partially resolved modes, in this case instead averaging for the stochastic nature of the oscillation peak over many data bins (as a result from our analysis the error bar on the frequency of the unresolved mode is on average 10 times smaller than that of the resolved modes). Therefore for clarity to the reader, we stress that in general the precision level of the error bars reported in this work is not limited by the formal frequency resolution of the PSD, because it represents the adequacy of the model presented in Sect. 3.2 to fit the data.
As reported in Table 1, seven stars out of the 19 analyzed required a refitting of during the mode identification process, with deviations from the literature values found up to s for KIC 6144777, and s for KIC 7060732. The stars KIC 6144777 and KIC 12008916, in particular, show varying on the order of seconds with varying radial order. This caused the mode identification process to be more complex than for other stars of the sample, although still well feasible with an appropriate refitting of as explained in Sect. 3.4. For completeness, we notice that in the newer catalogue provided by Mosser et al. (2014), the measurement of for the stars KIC 6144777 and KIC 8366239 was corrected, thus corresponding to the refitted value used in this work.
We firmly detect the signature of rotation through the presence of rotationally split modes in all the LRGs except KIC 9145955, KIC 9882316, KIC 10123207, and KIC 10200377. However, KIC 6117517 shows only the presence of two significant rotationally split modes in the highest SNR region of the PSD, which makes a detailed study of rotation for this star difficult. The stars KIC 7619745, KIC 8366239, KIC 8475025, KIC 9267654, KIC 10257278, KIC 11913545, and KIC 12008916, instead, show very few or even no oscillation modes corresponding to the zonal component . The mode identification was possible in most of the cases, except for those low SNR oscillation peaks in the wings of the PSD for which no clear azimuthal order could be assigned, or for oscillation peaks with double mode identification. The latter case is observable in the stars KIC 8475025, KIC 9267654, and KIC 11353313, in which the confusion limit due to the large rotational splitting is present, as mentioned in Sect. 3.4. The double mode identification for some of the peaks in the stars mentioned before can be explained by the overlap of the split component with the adjacent when the rotational splitting is the same as the frequency spacing between two adjacent mixed modes of different mode.
The star KIC 7060732, despite the presence of the largest number of fit modes among the 19 LRGs (123 in total), shows the largest number of non-identified modes (40), all placed in the wings of the PSD, because of the confusion generated by the low SNR of the peaks coupled with the large rotational splitting observed. KIC 9882316 has instead the lowest number of fit modes (49) but with a clear and straightforward mode identification.
4.1 Mode linewidths
The first result related to the asteroseismic measurements of individual oscillation modes is represented by the behavior of mode linewidths with increasing frequency in the PSD. The so-called linewidth depression has been observed in several CoRoT stars (Benomar et al. 2009b; Barban et al. 2009; Deheuvels et al. 2010; Ballot et al. 2011b) and more recently in a larger sample of main-sequence and subgiant stars observed with Kepler (Benomar et al. 2013; Appourchaux et al. 2014). Theoretical studies of solar data by Belkacem et al. (2011) have confirmed that is intimately related to the frequency position of the linewidth depression, albeit a full interpretation of this result requires more investigation.
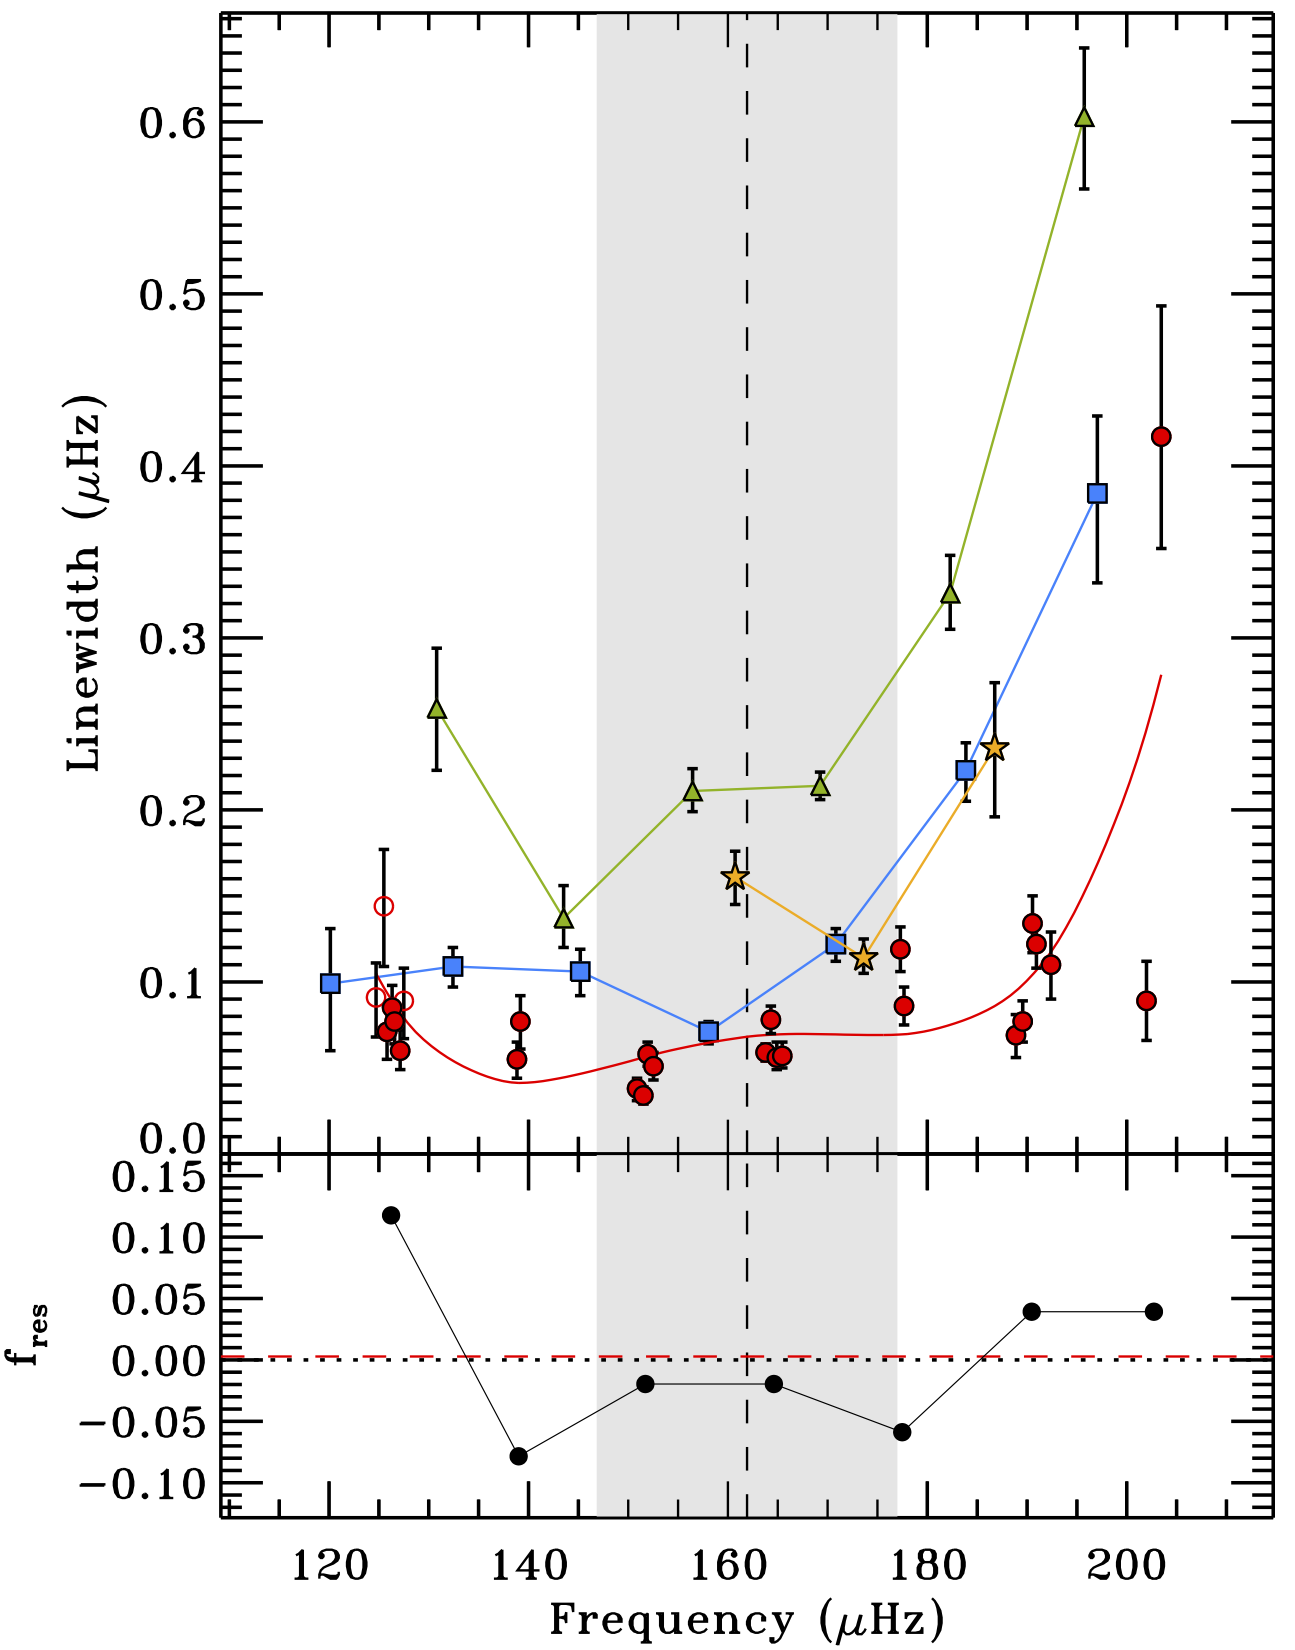
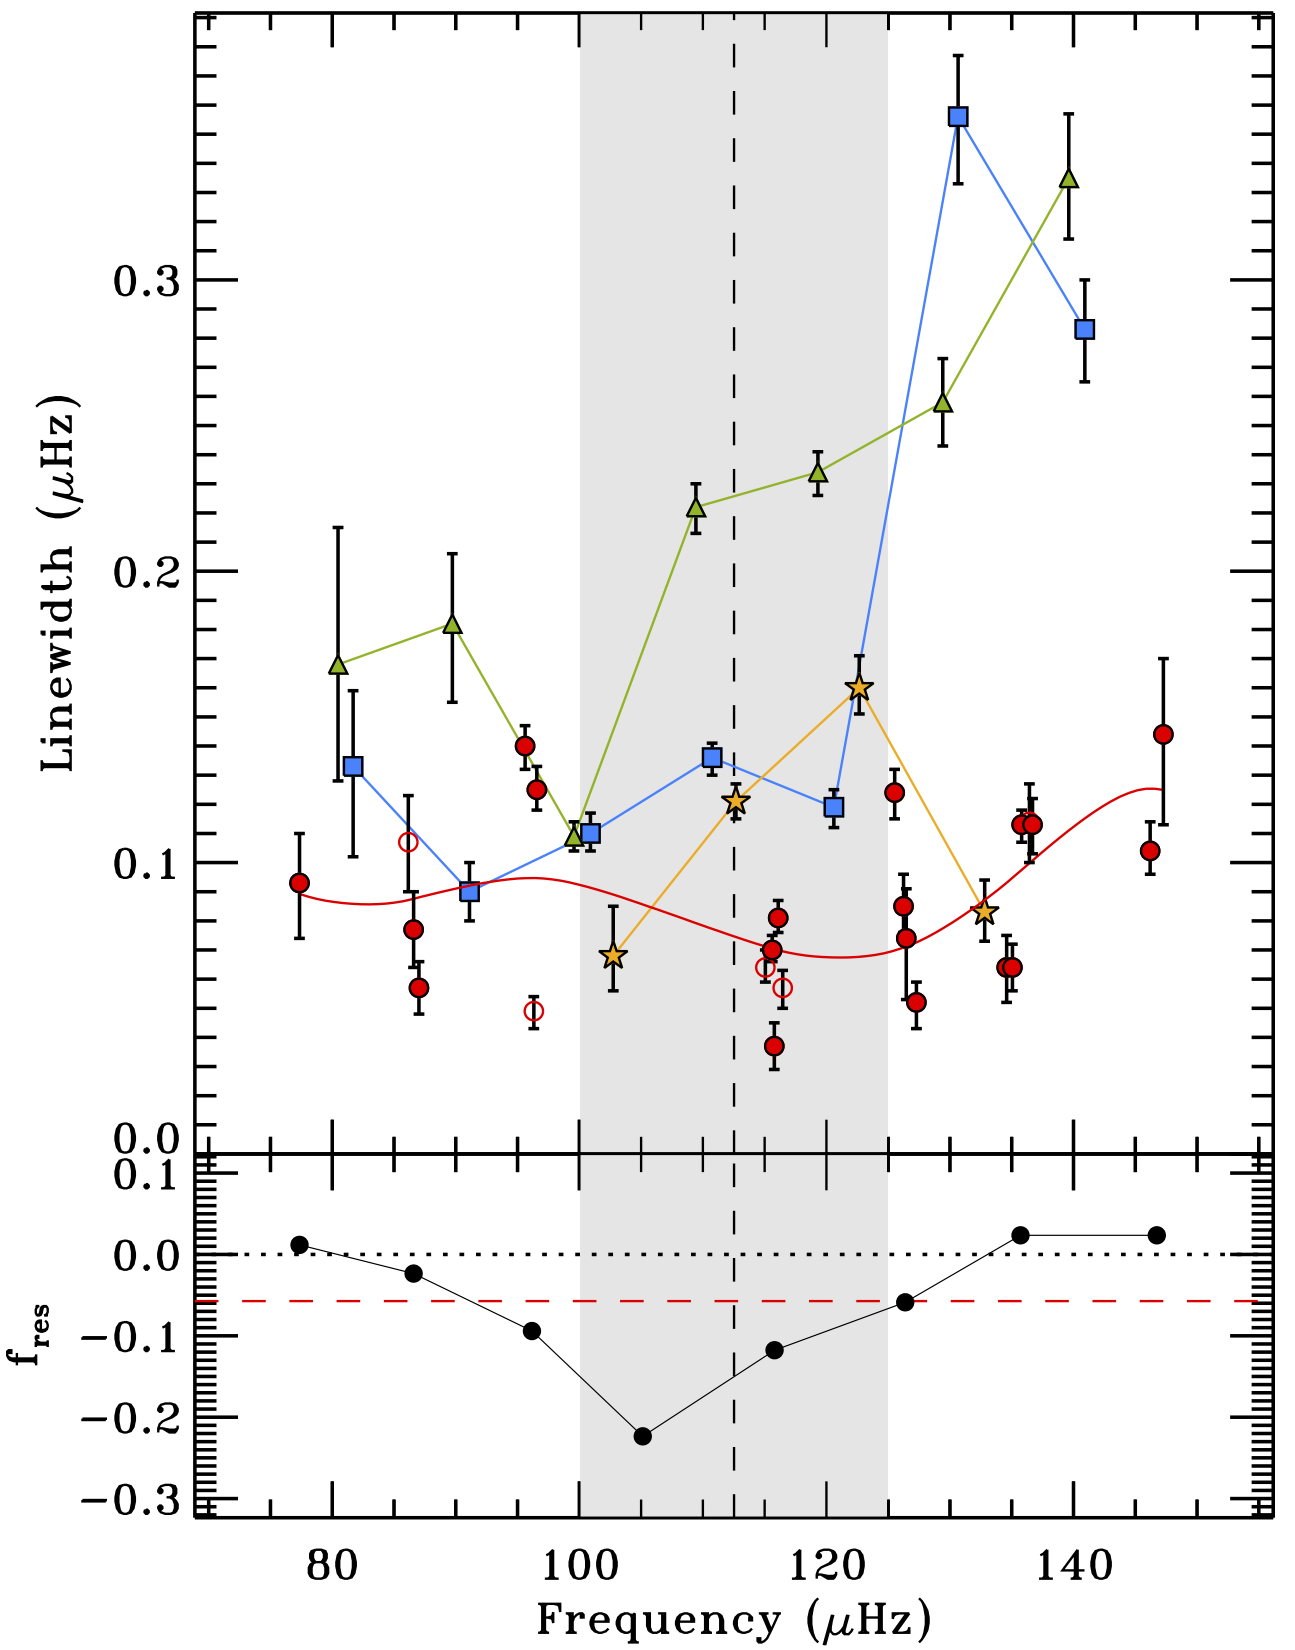
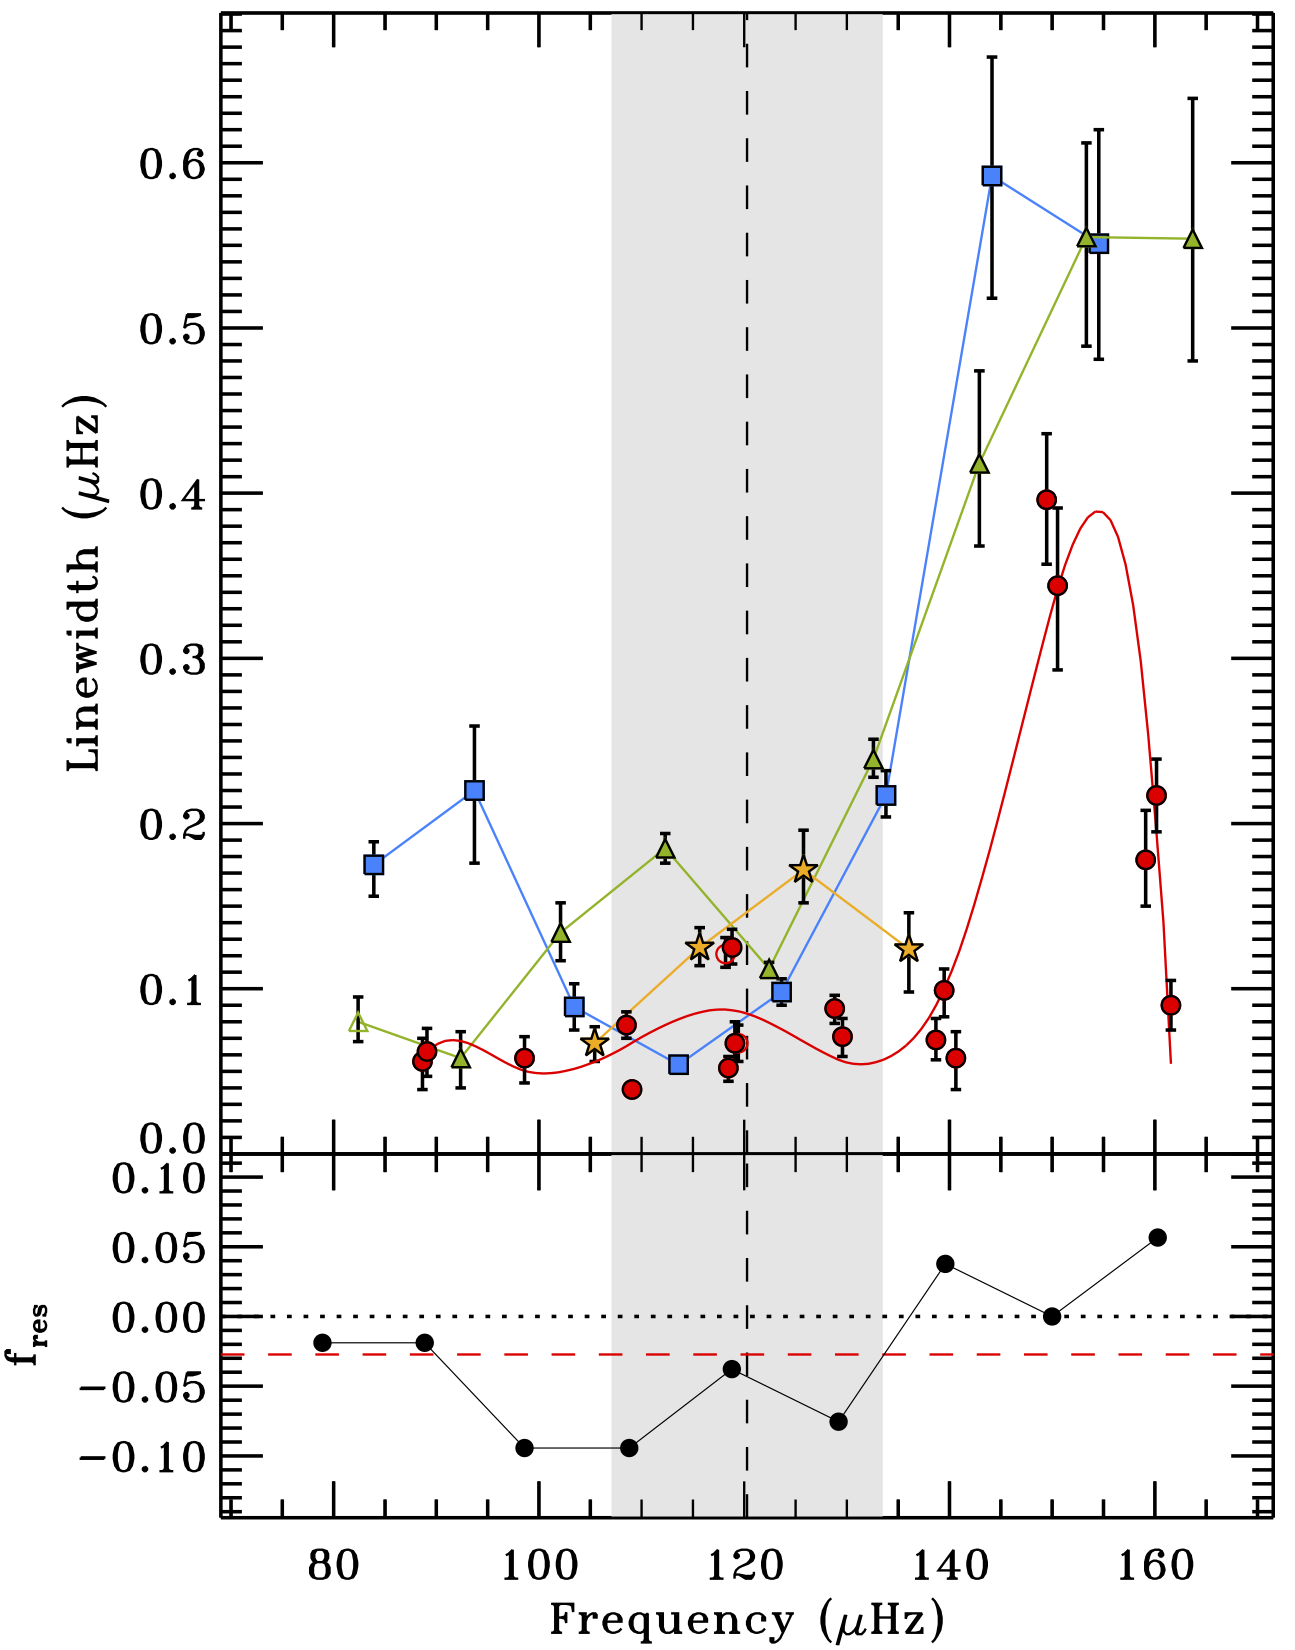
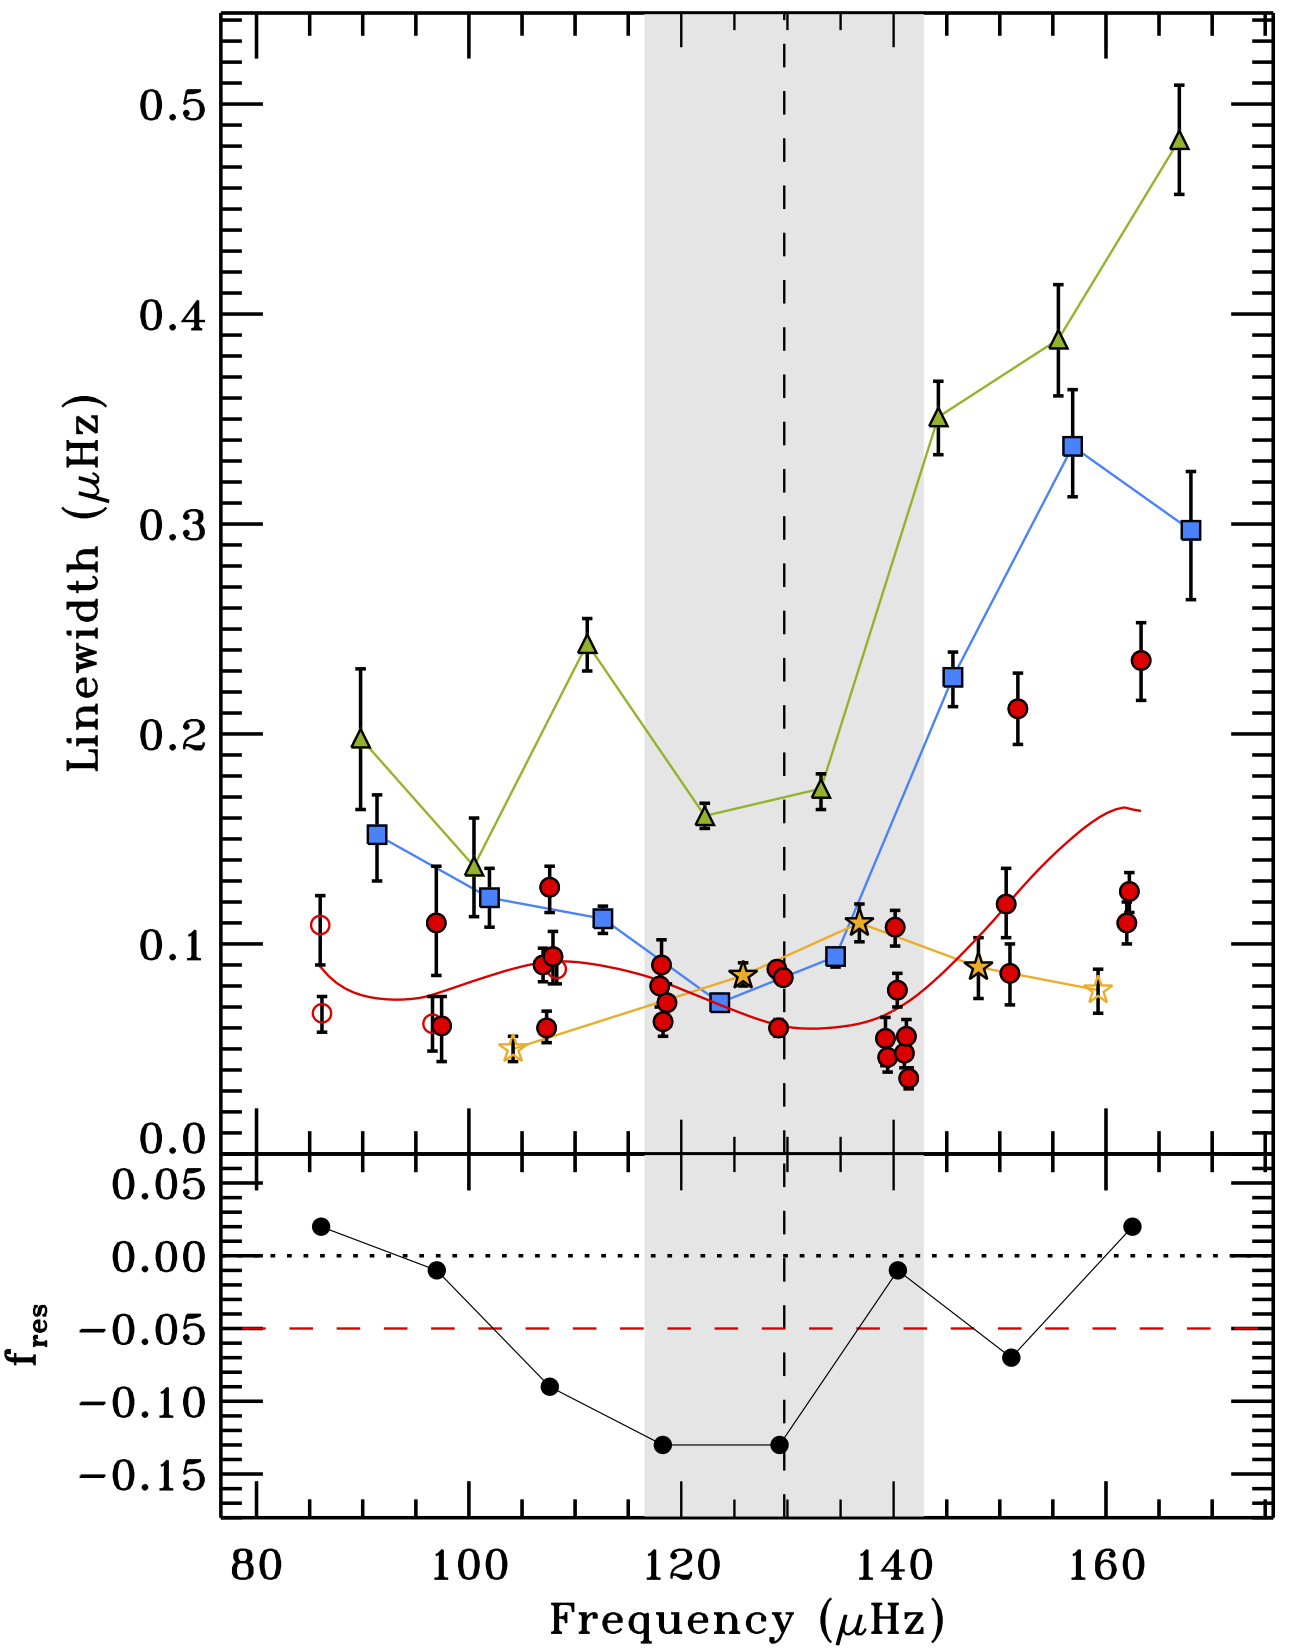
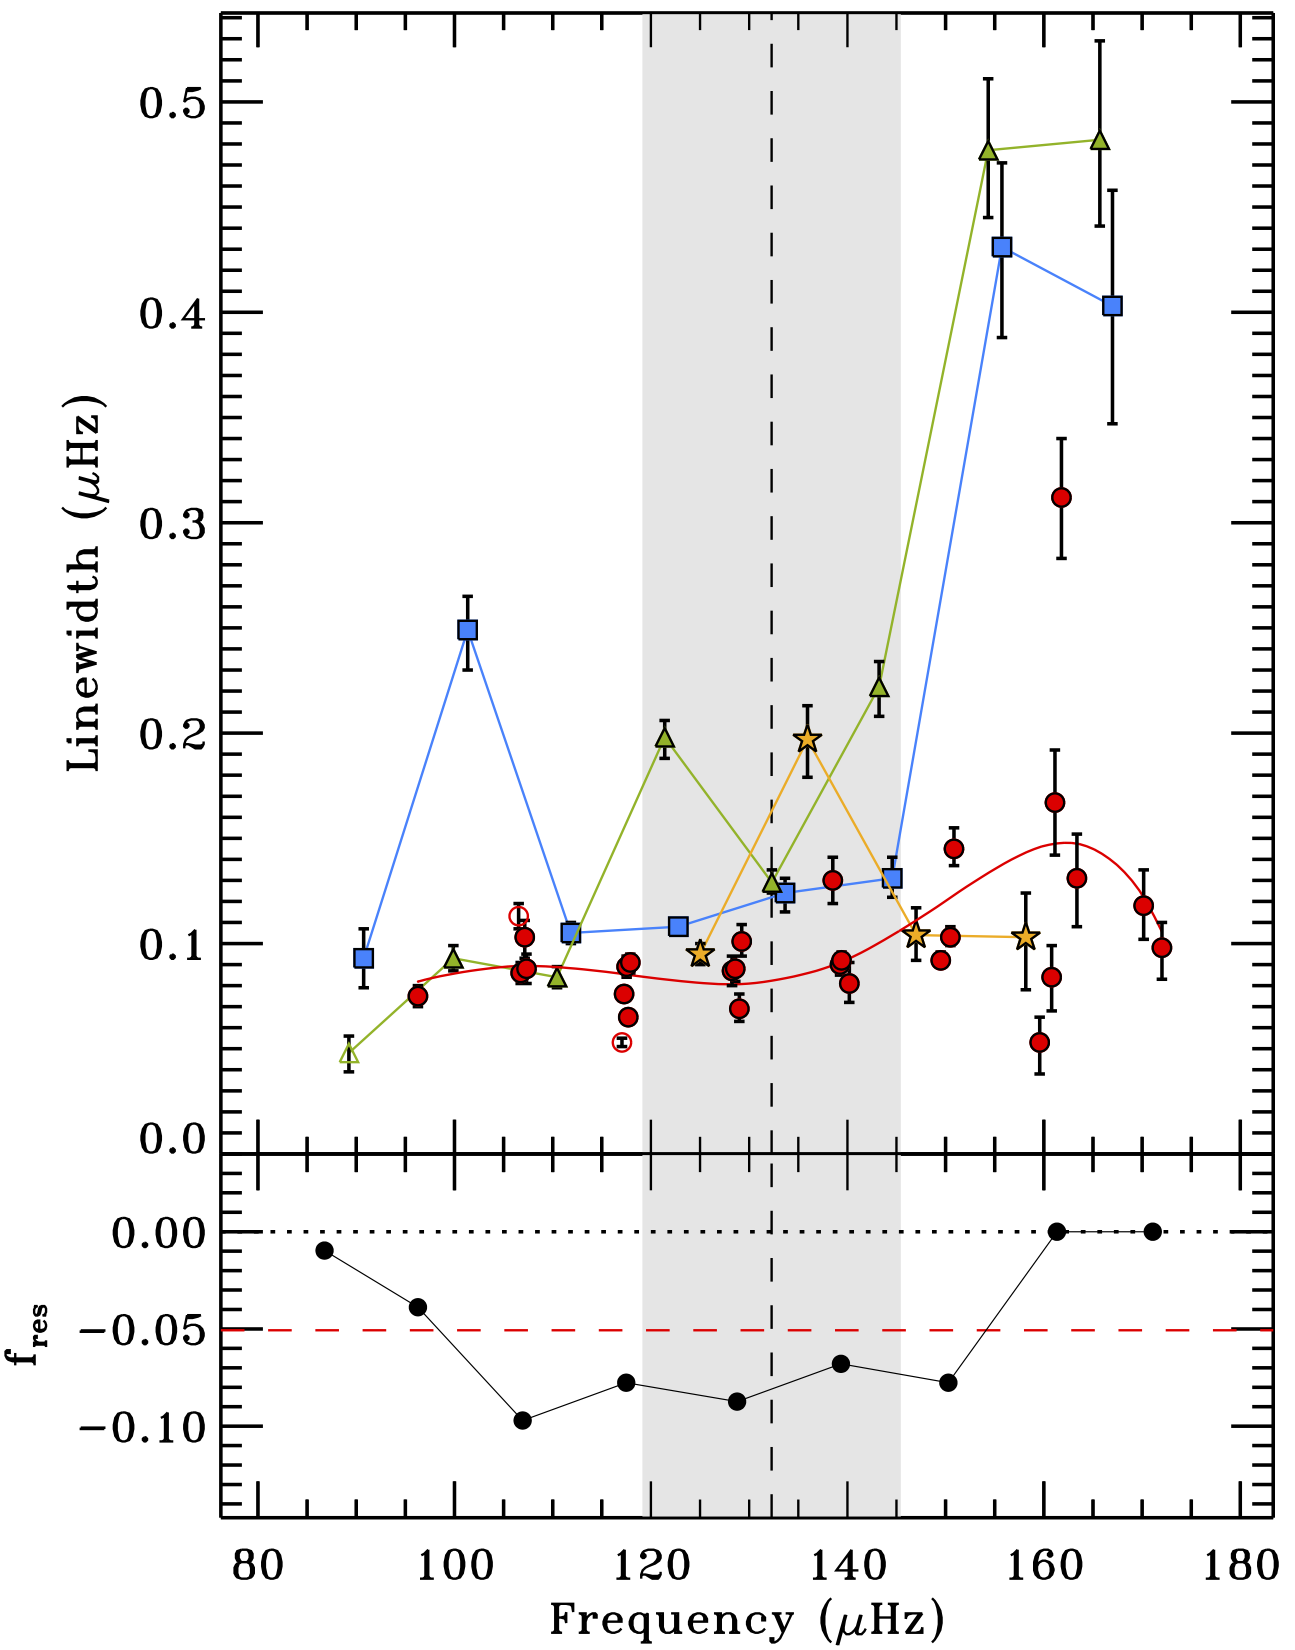
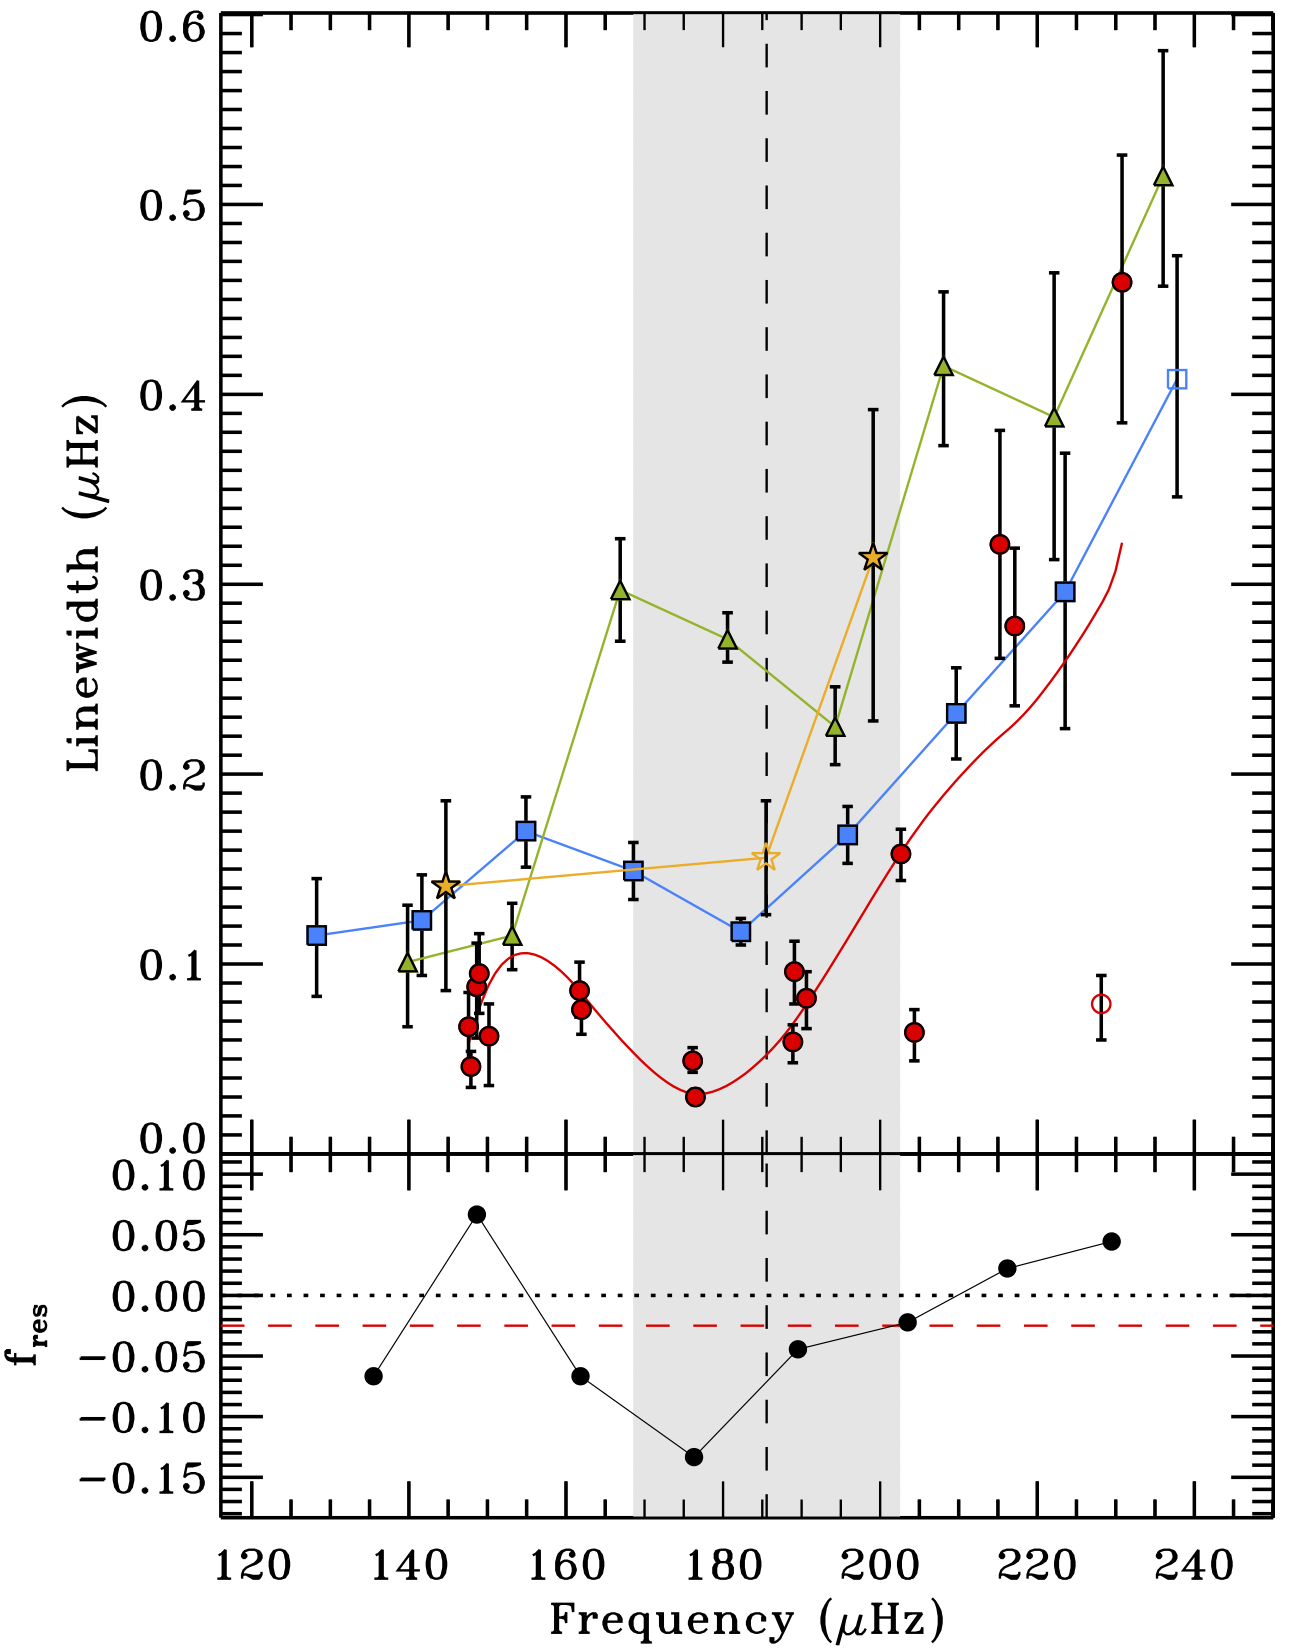
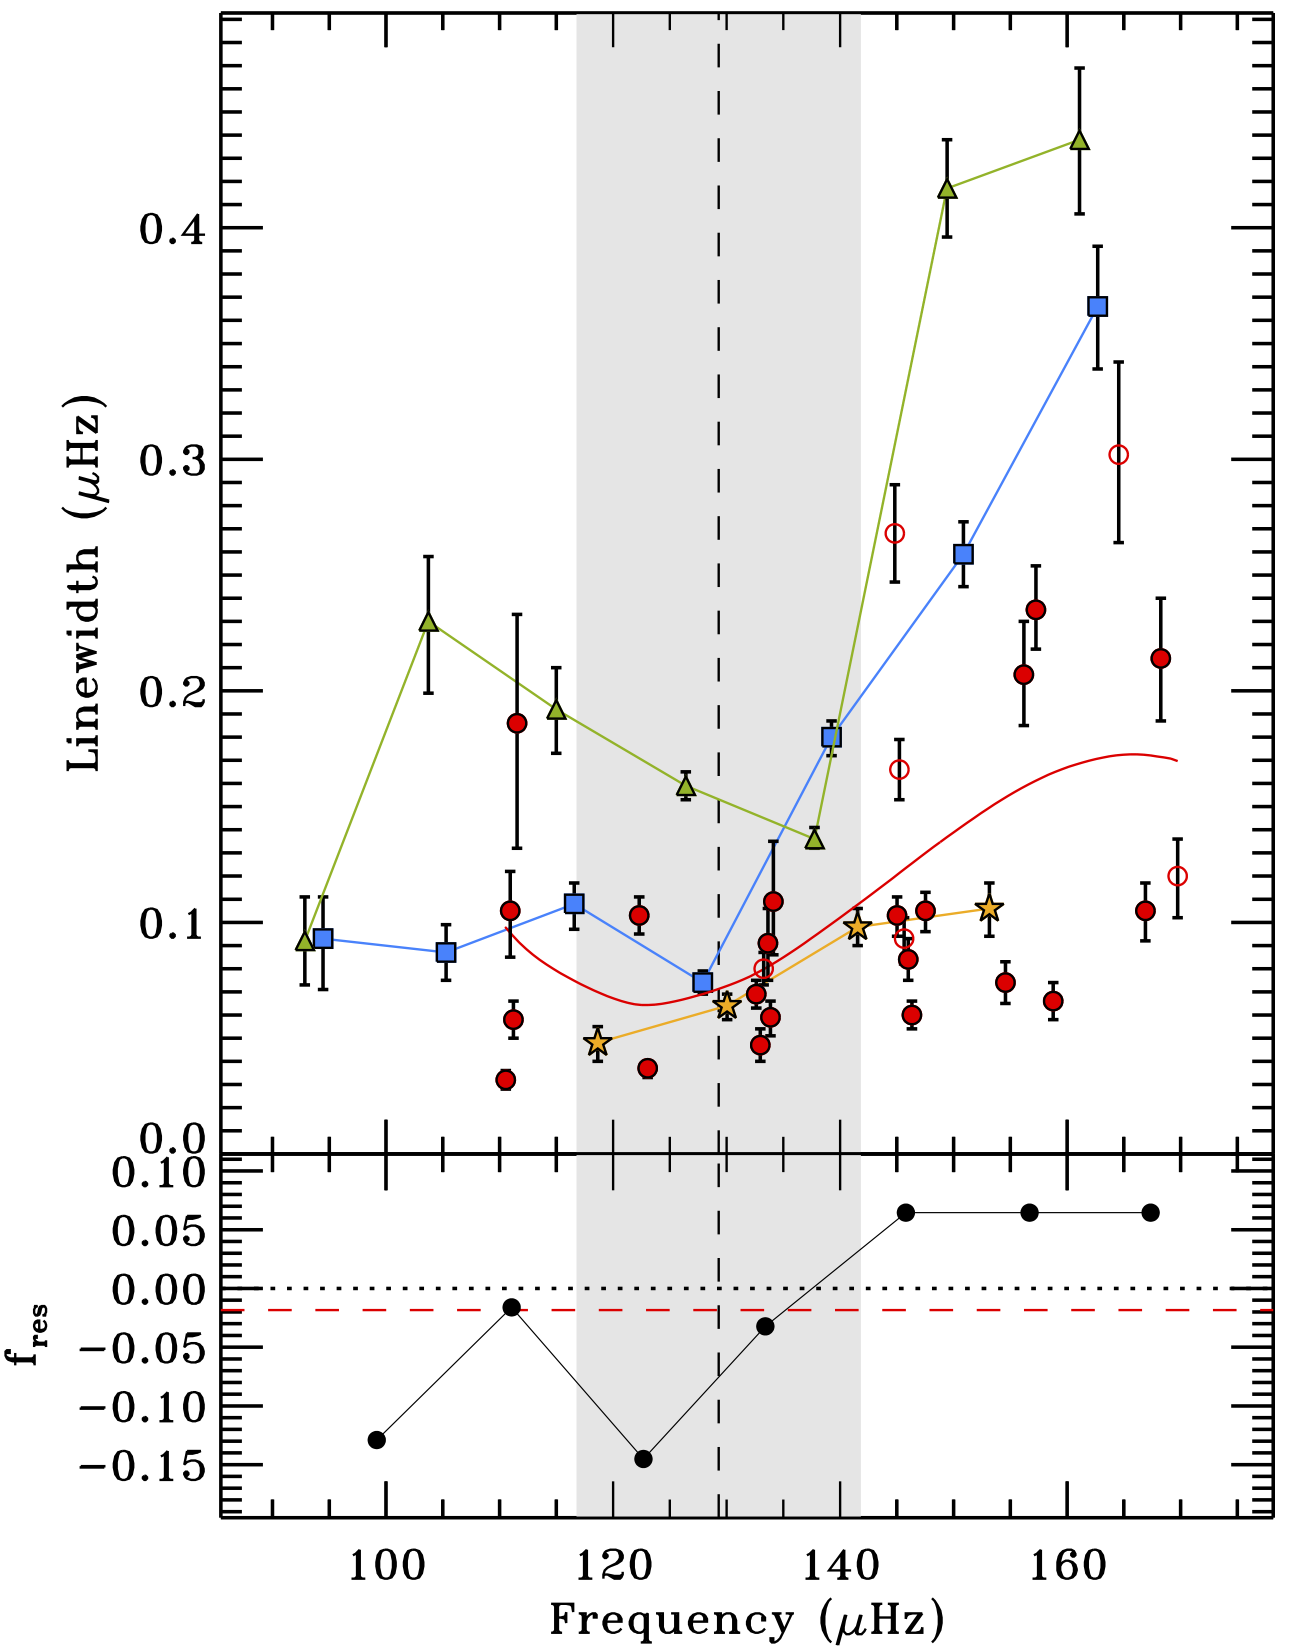
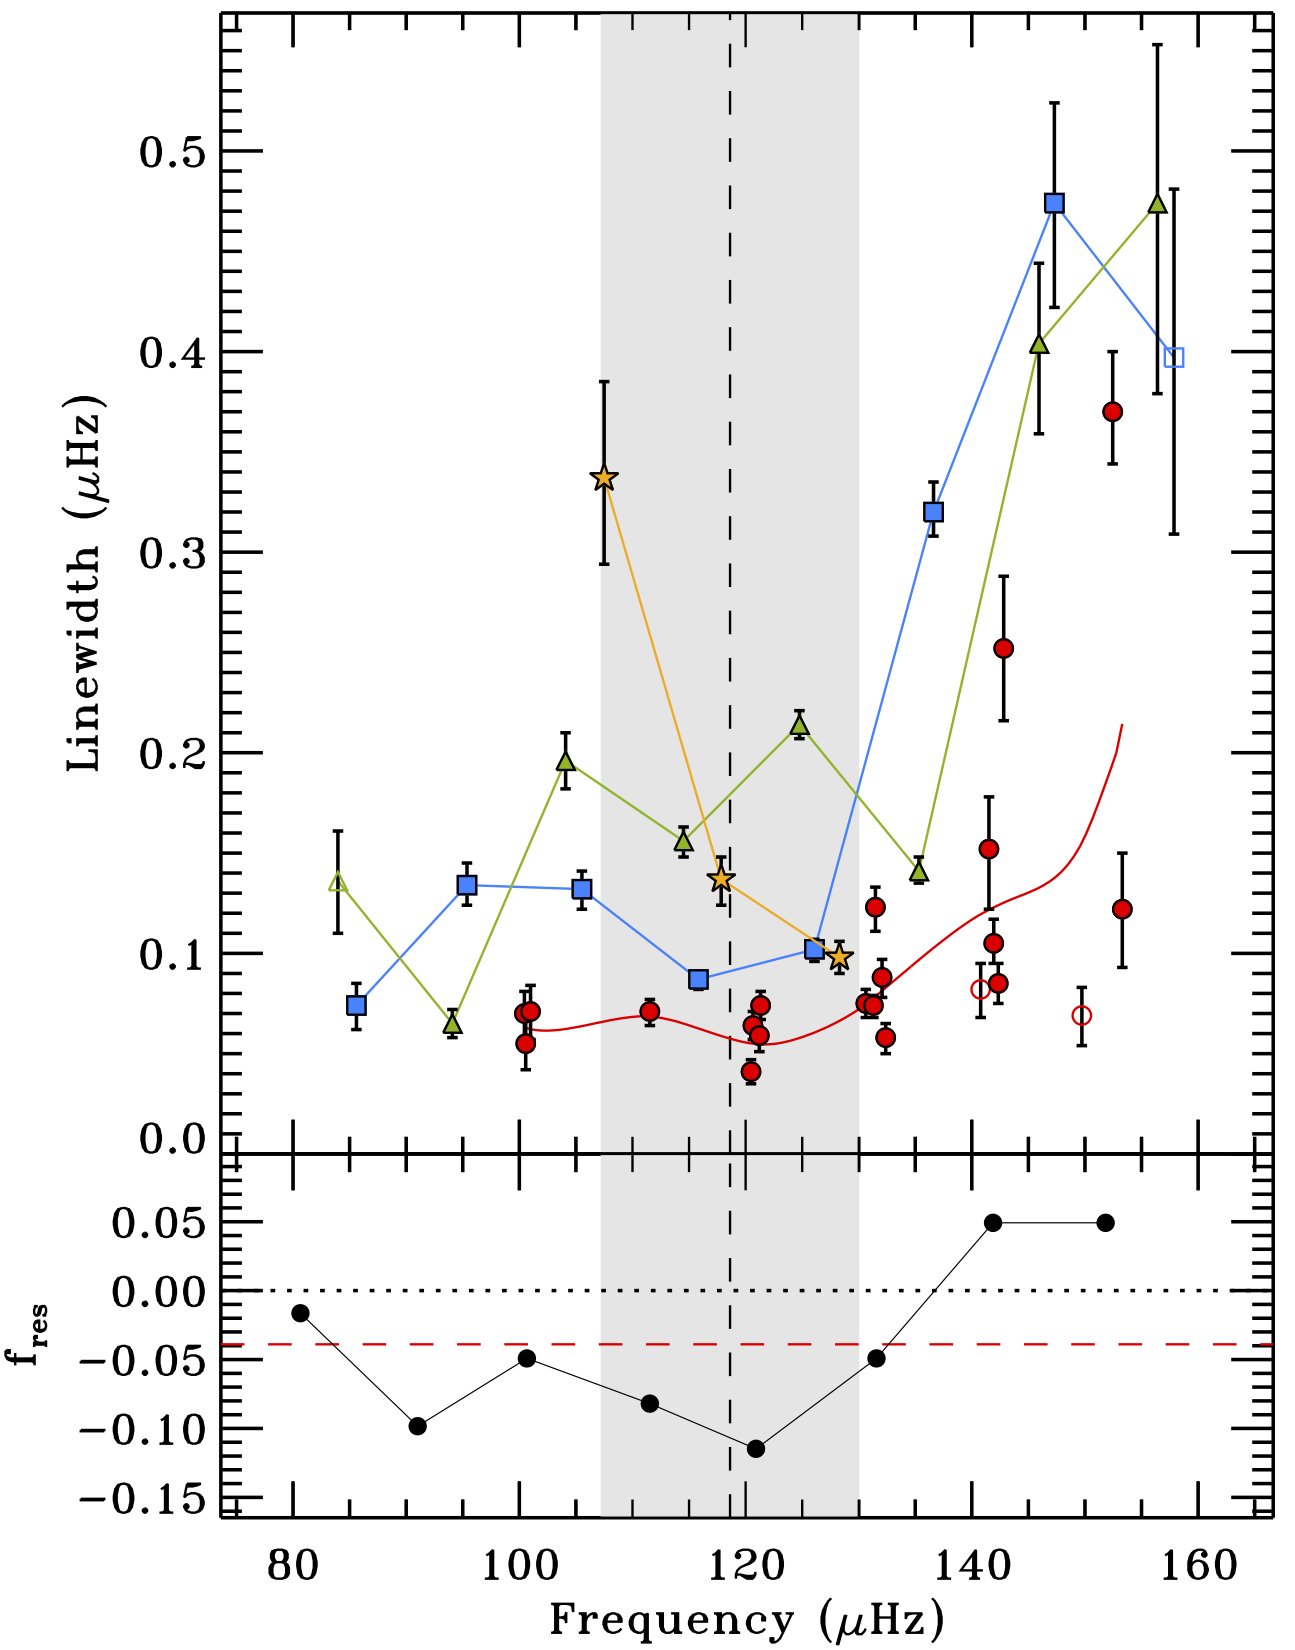
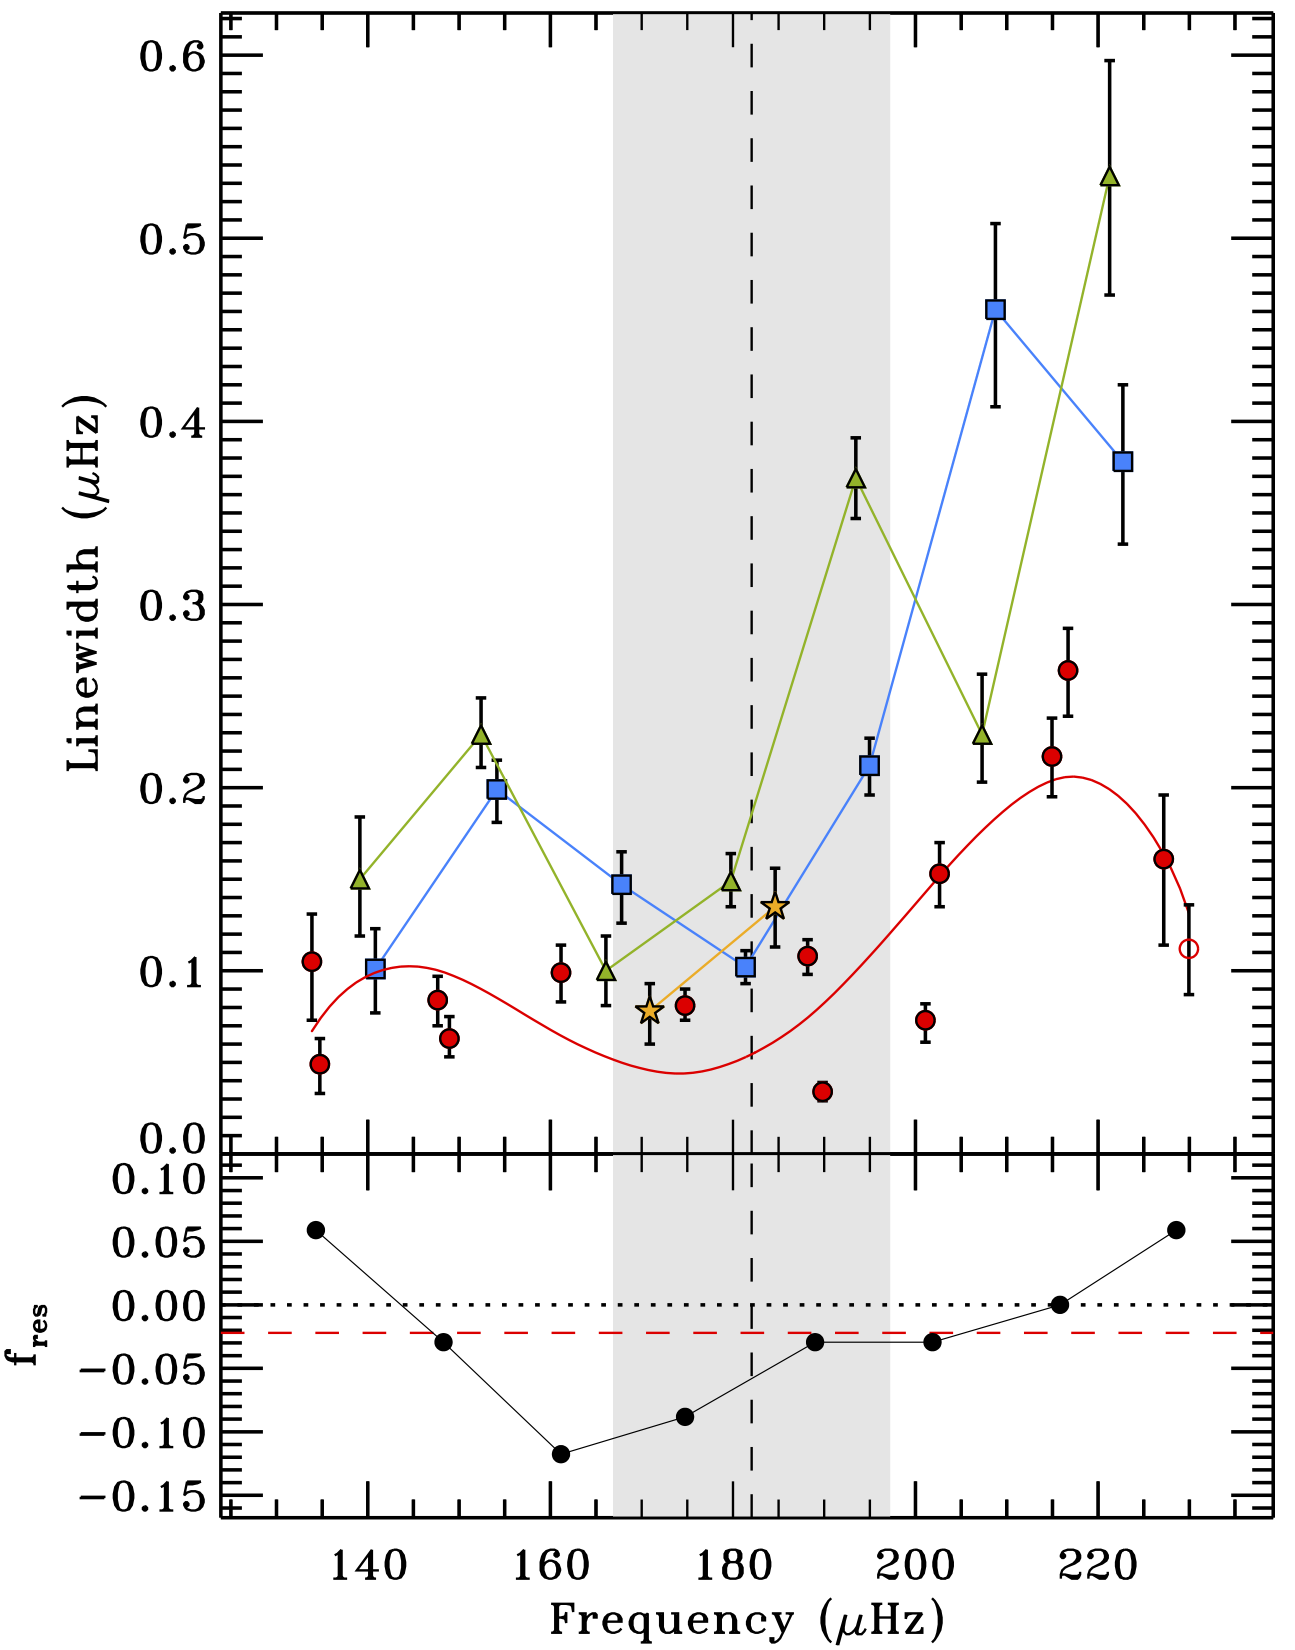
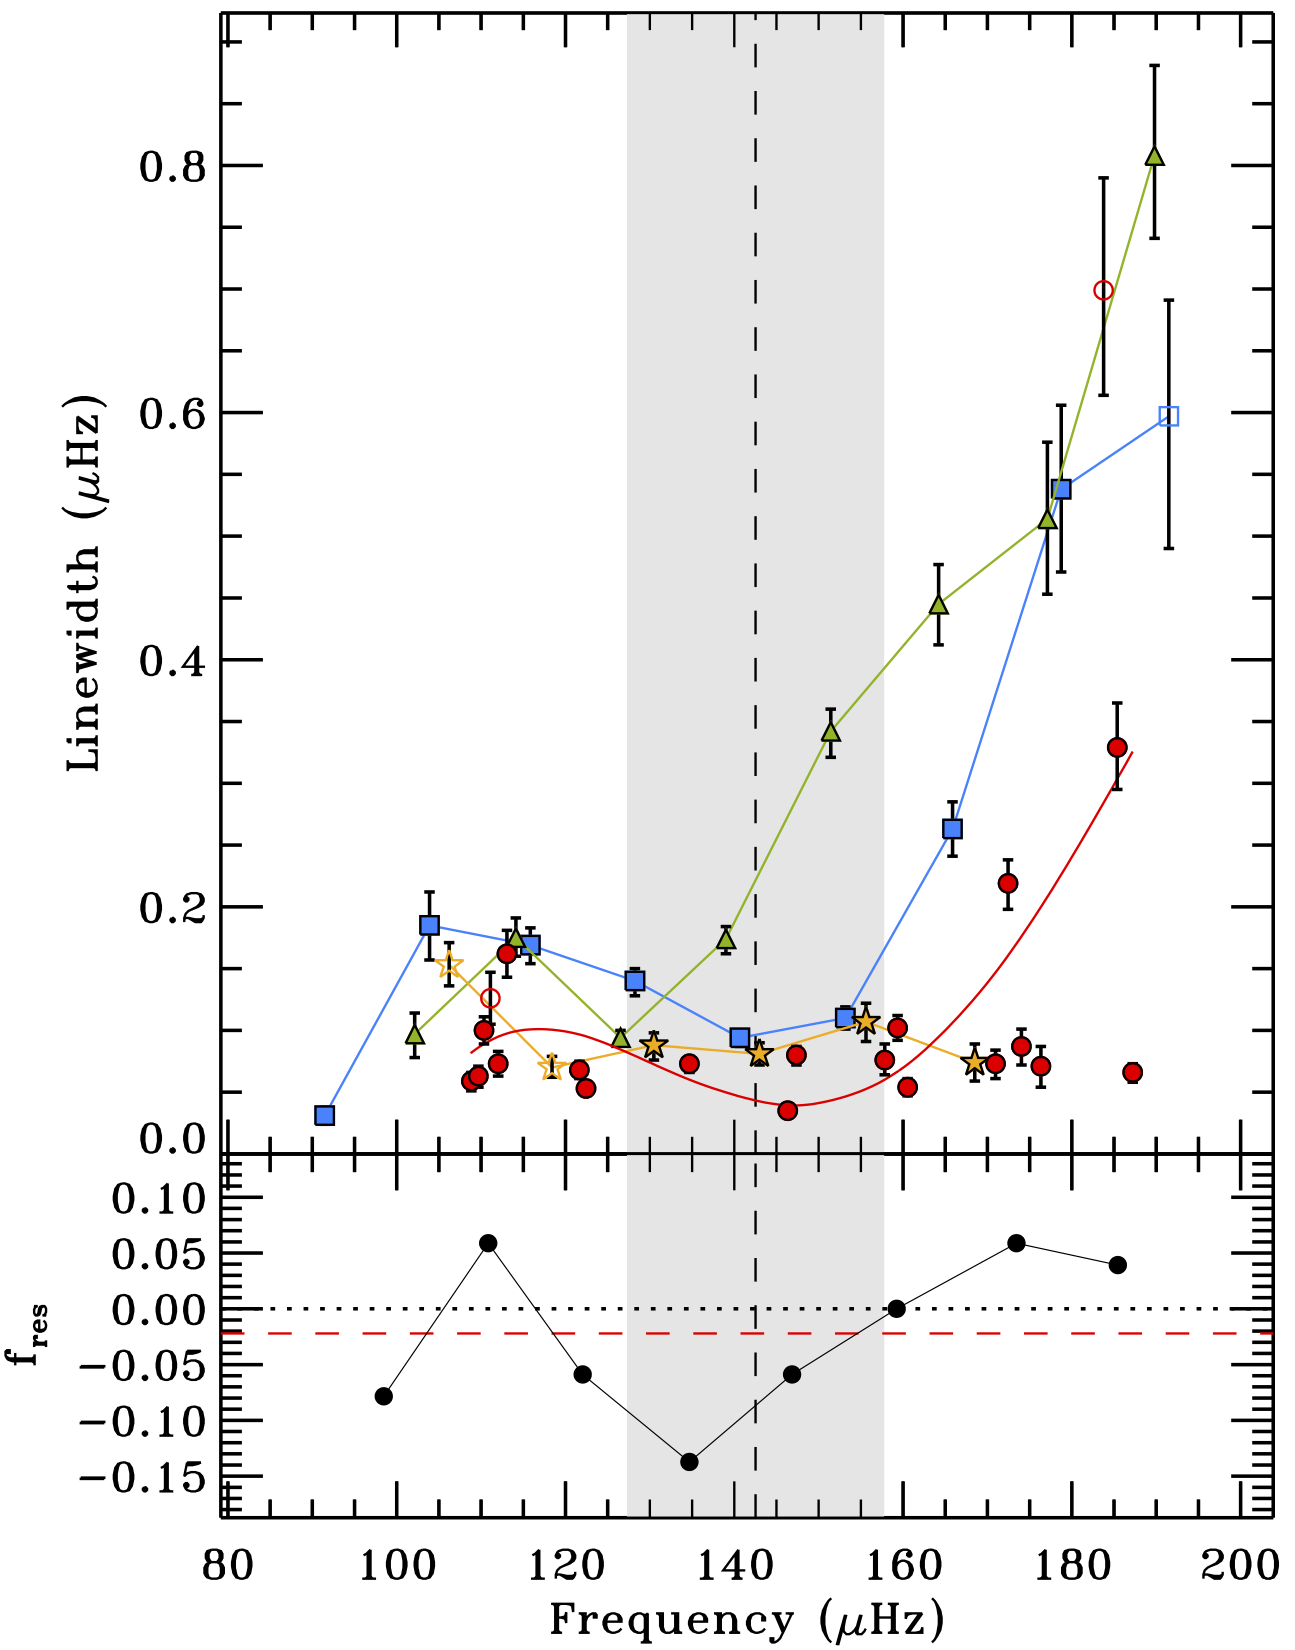
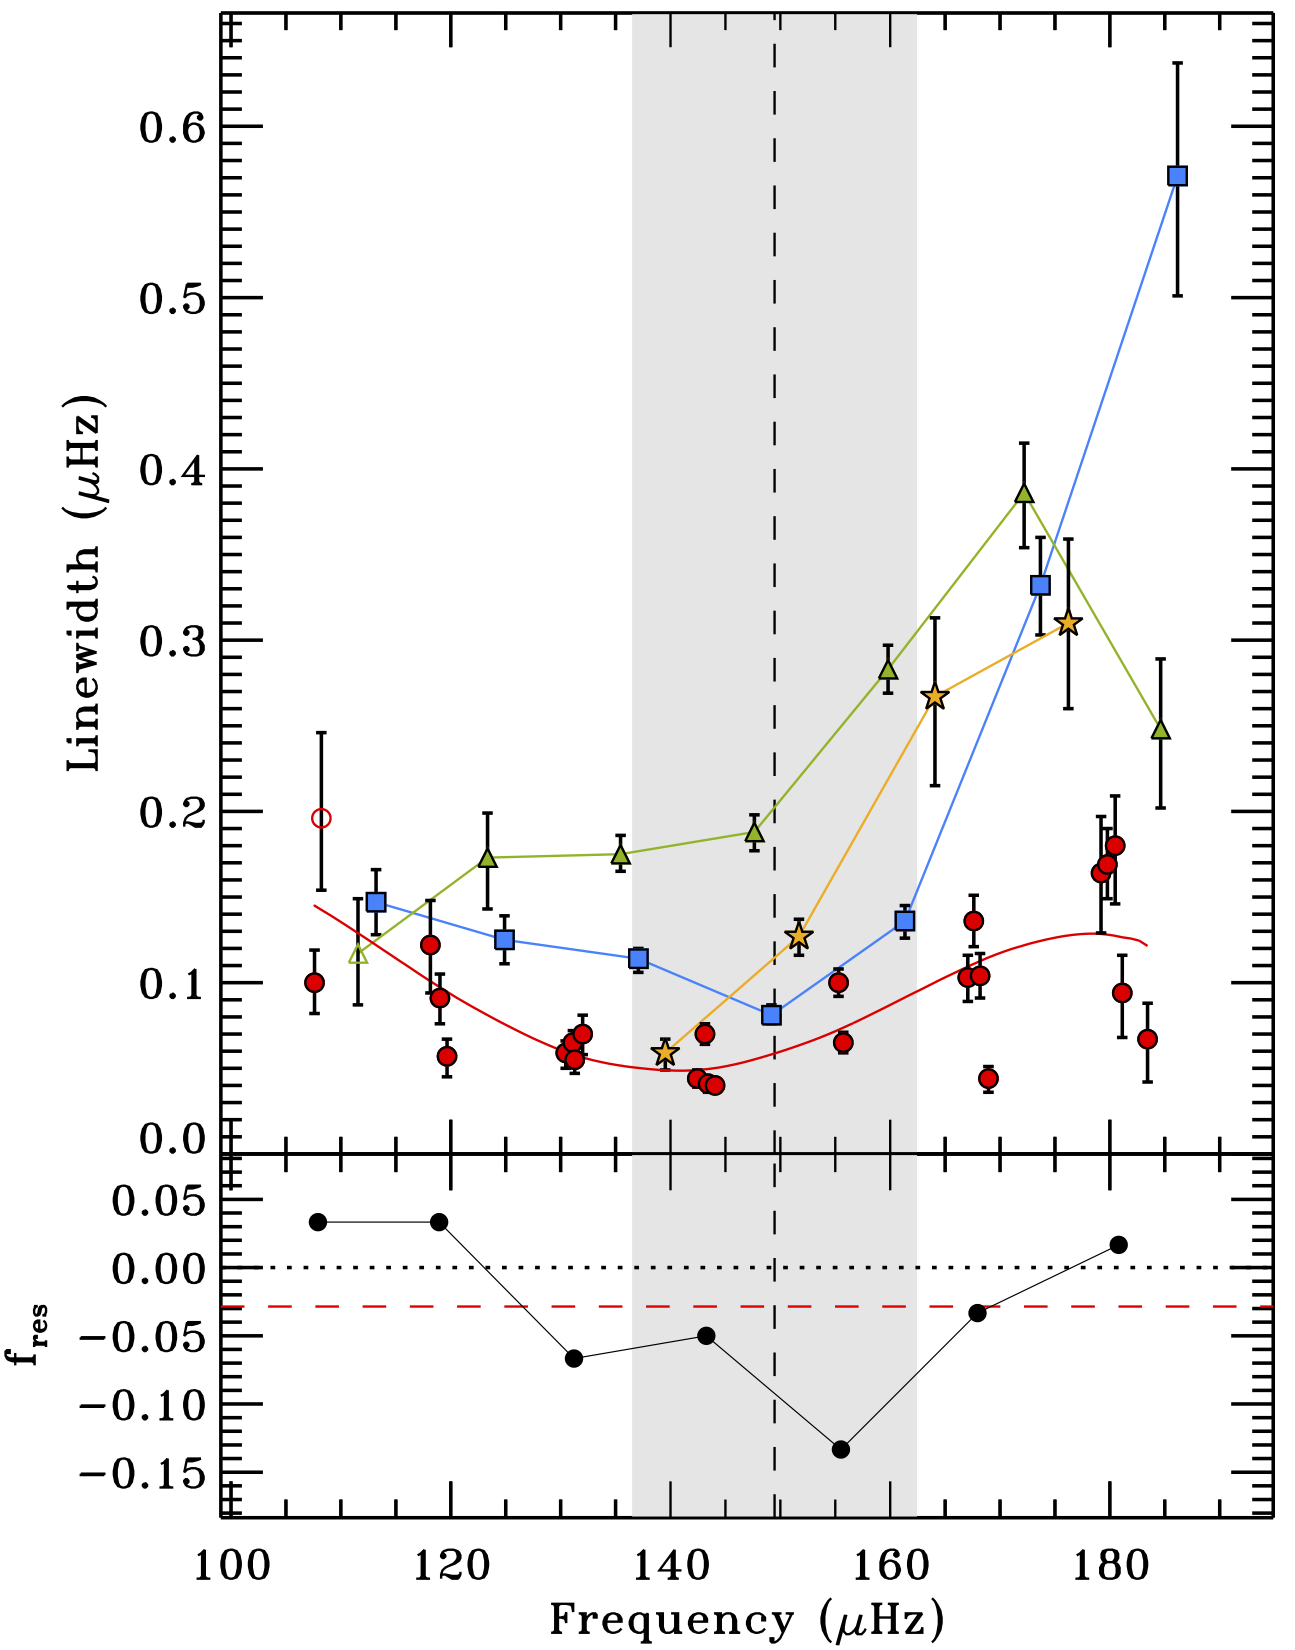
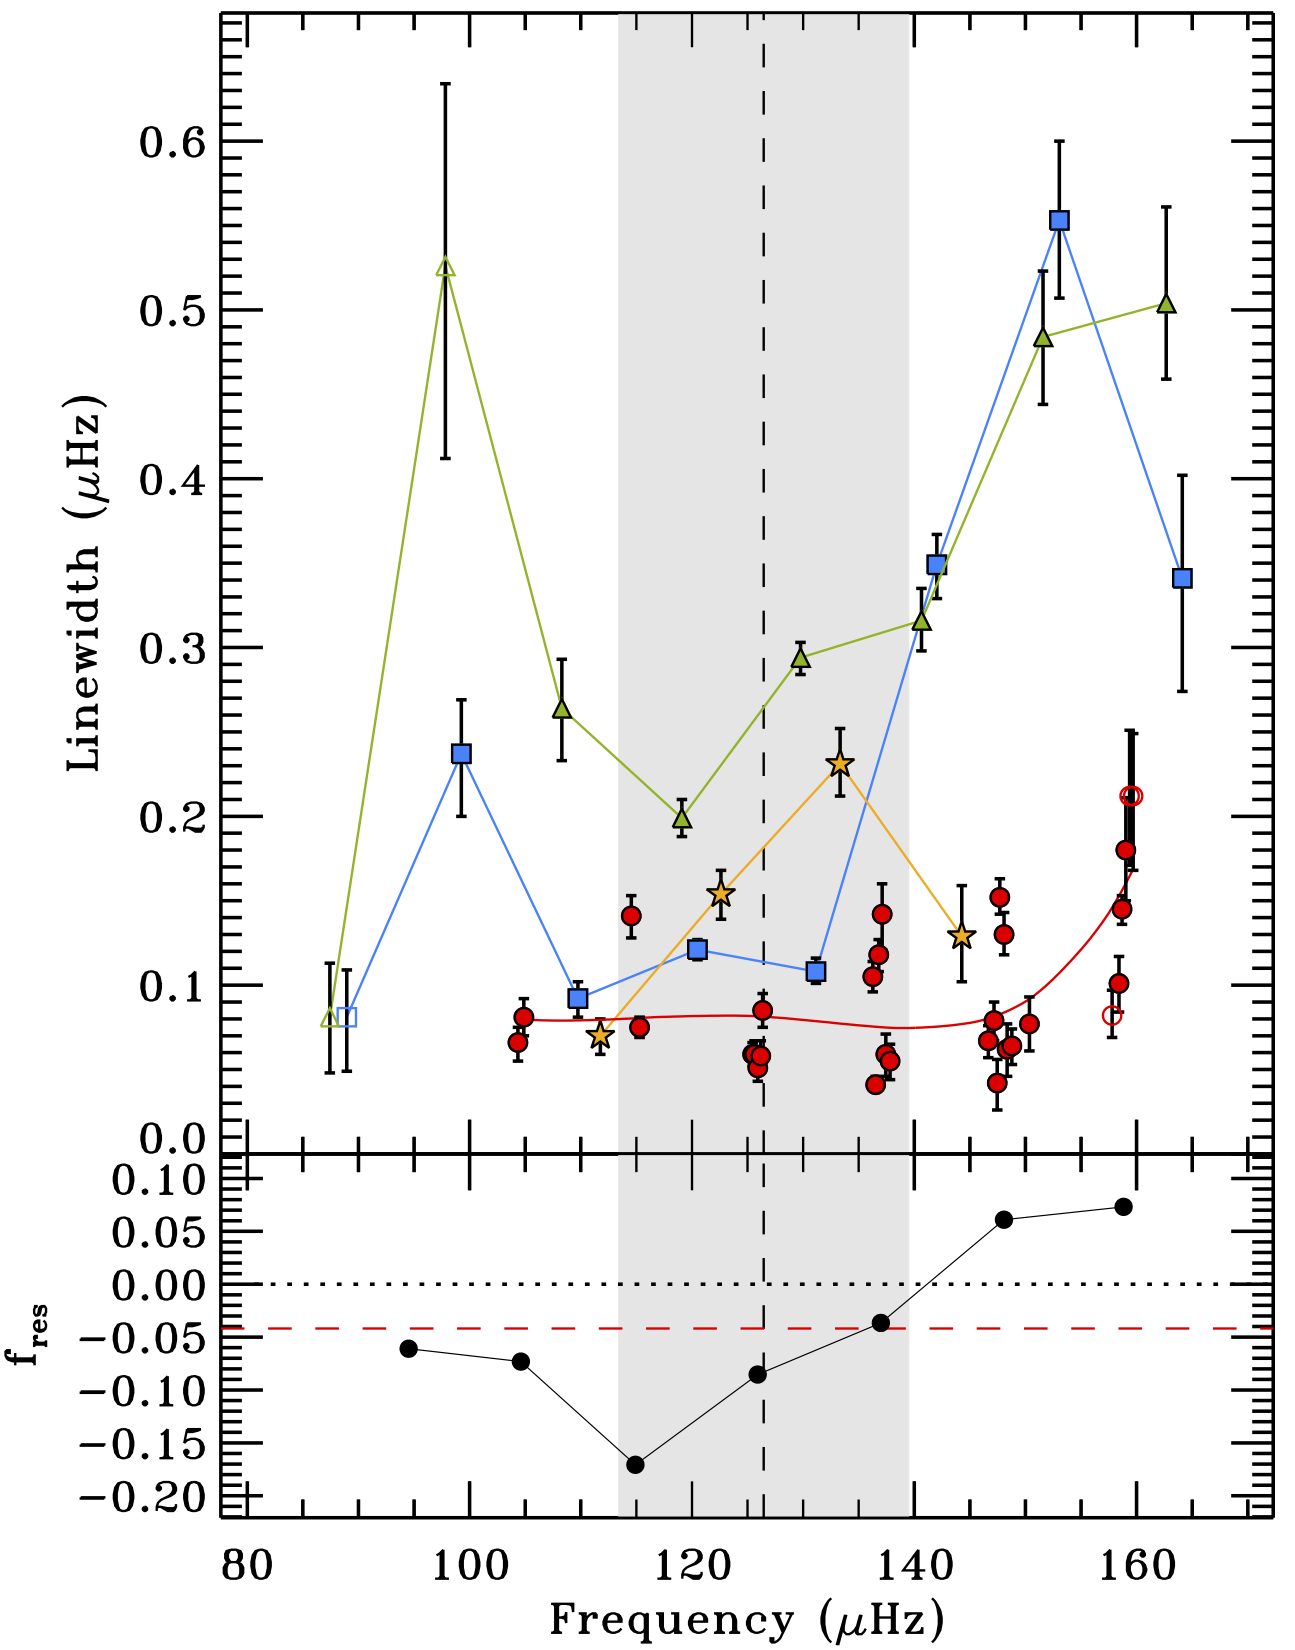
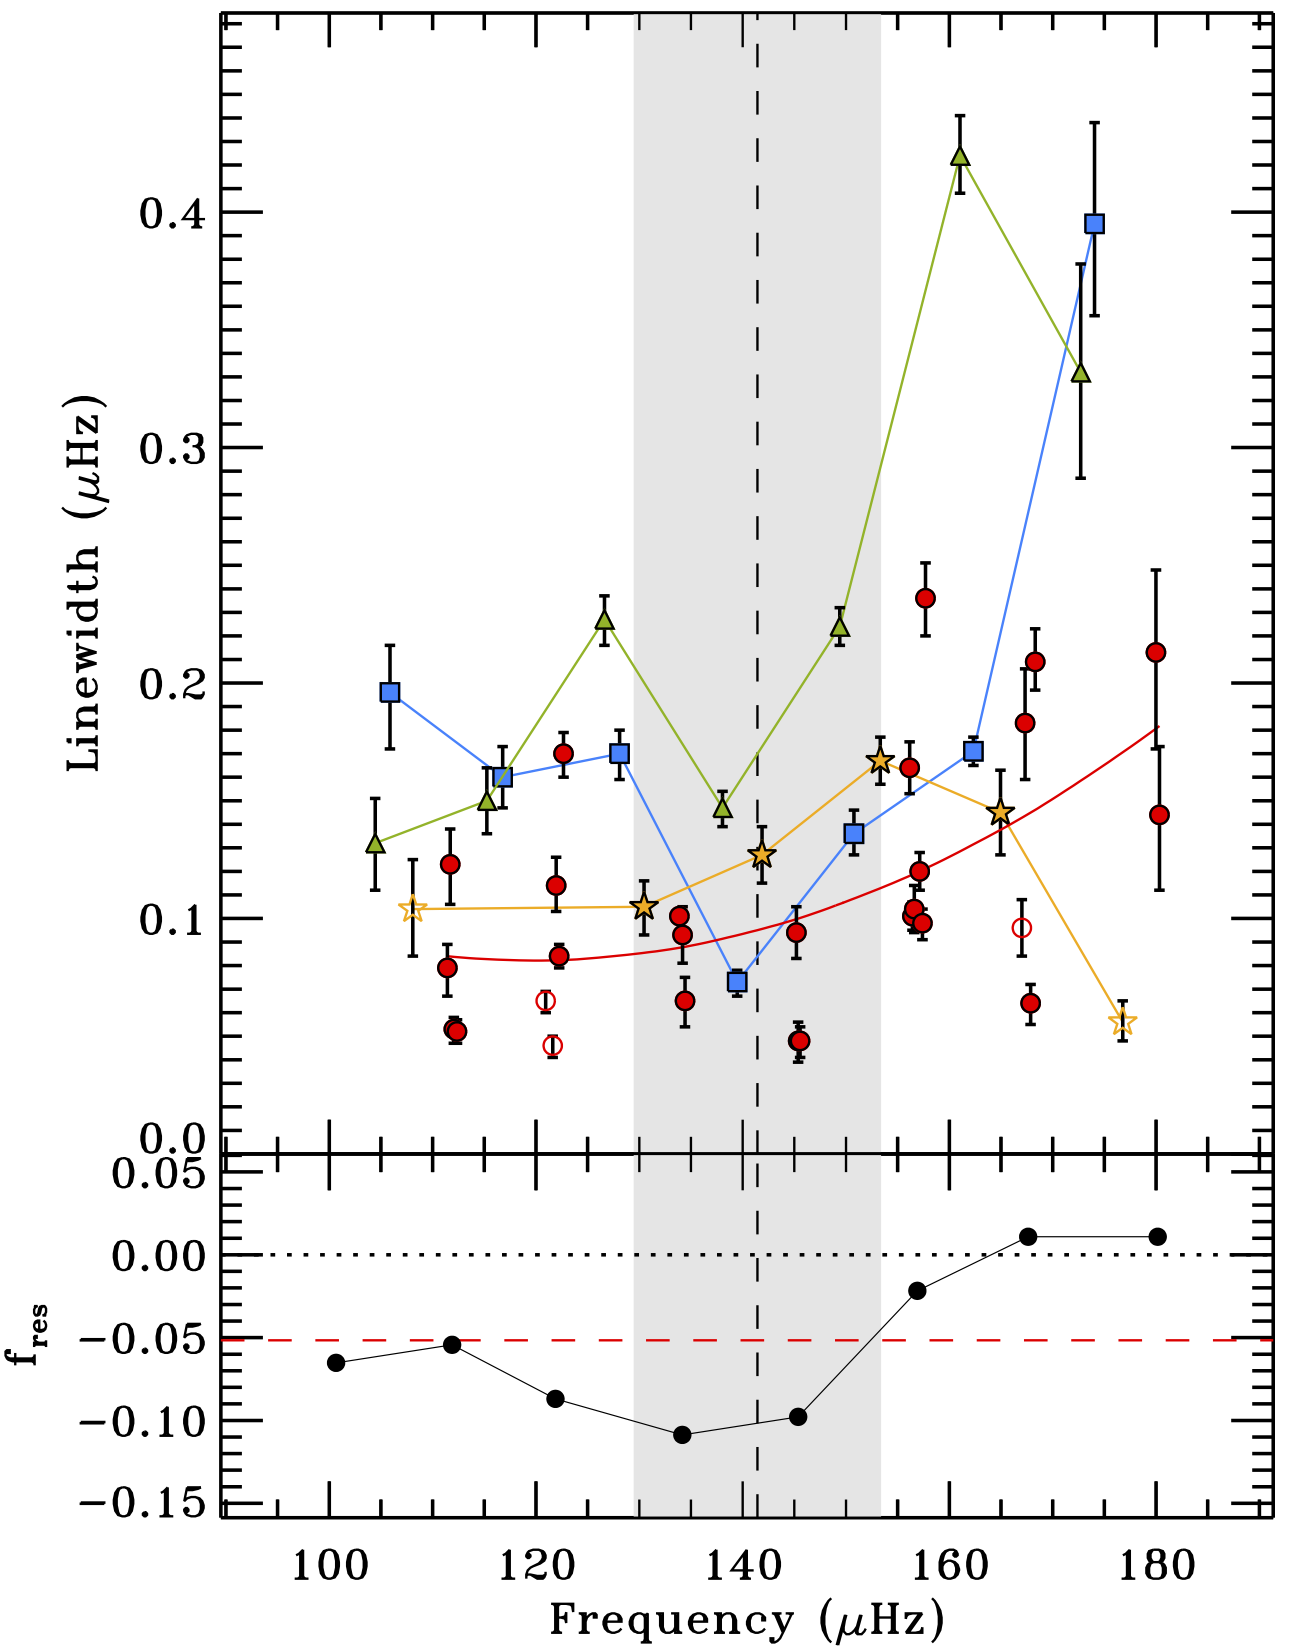
The top panel of Fig. 6 shows all the linewidth measurements of KIC 12008916 for the angular degrees , and the resolved (or partially resolved) mixed modes, as a function of the corresponding oscillation frequencies in the PSD. As visible in the region marked by the vertical gray band, the linewidths either flatten or even decrease when the frequency of the oscillation peak is close to . This is more clear for modes, whilst for the number of modes is not sufficiently large to let us conclude on a possible trend. For the case of mixed modes we have included a low-degree polynomial fit to visualize the global trend, which also shows a depression in linewidth close to . We note, however, that the measured linewidths of the modes are not the physical linewidths and are only used to show the presence of the linewidth depression in comparison to the other modes with different angular degree. This is because by fitting a single Lorentzian profile to the region of the modes we are not taking into account the possible effects arising from both the rotational splitting and from the presence of quadrupole mixed modes, thus resulting in measured linewidths that are broader than the real ones.
To investigate the behavior of the mode linewidths in a star more thoroughly we computed the normalized fraction of resolved mixed modes with respect to unresolved ones, which can be expressed for each radial order as
| (18) |
where and are the number of resolved and unresolved mixed modes, respectively, fit in each radial order . The denominator of Eq. (18) allows us to normalize by the total number of mixed modes fit in the star, hence to compare the value among different stars in the sample. The resulting normalized fraction, hereafter for simplicity, as a function of the average frequency position of the dipole mixed modes falling in each radial order, is shown in the bottom panel of Fig. 6 for KIC 12008916. The horizontal dotted line separates the regime of resolved mixed modes fitting (upper part, ) from that of unresolved mixed modes fitting (lower part, ). We do not compute for radial orders in which no mixed modes are fit.
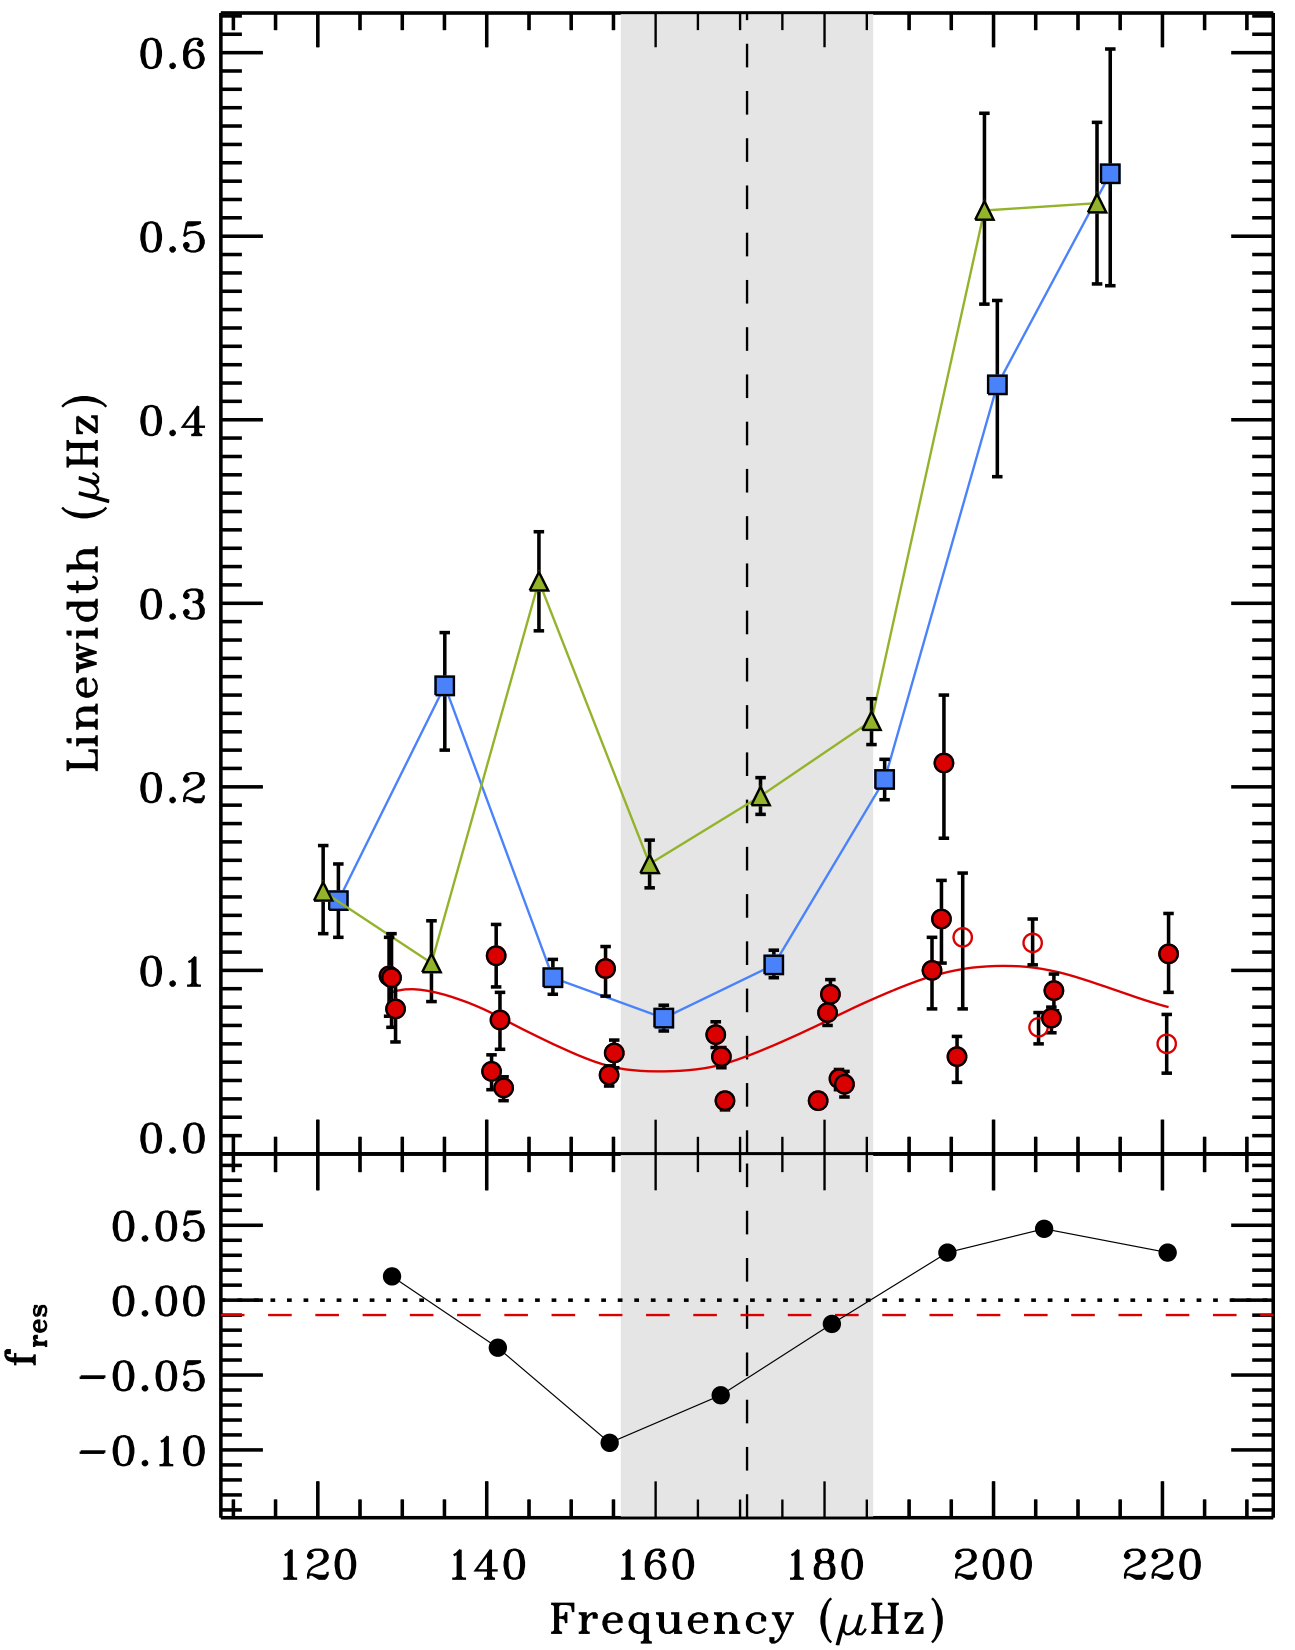
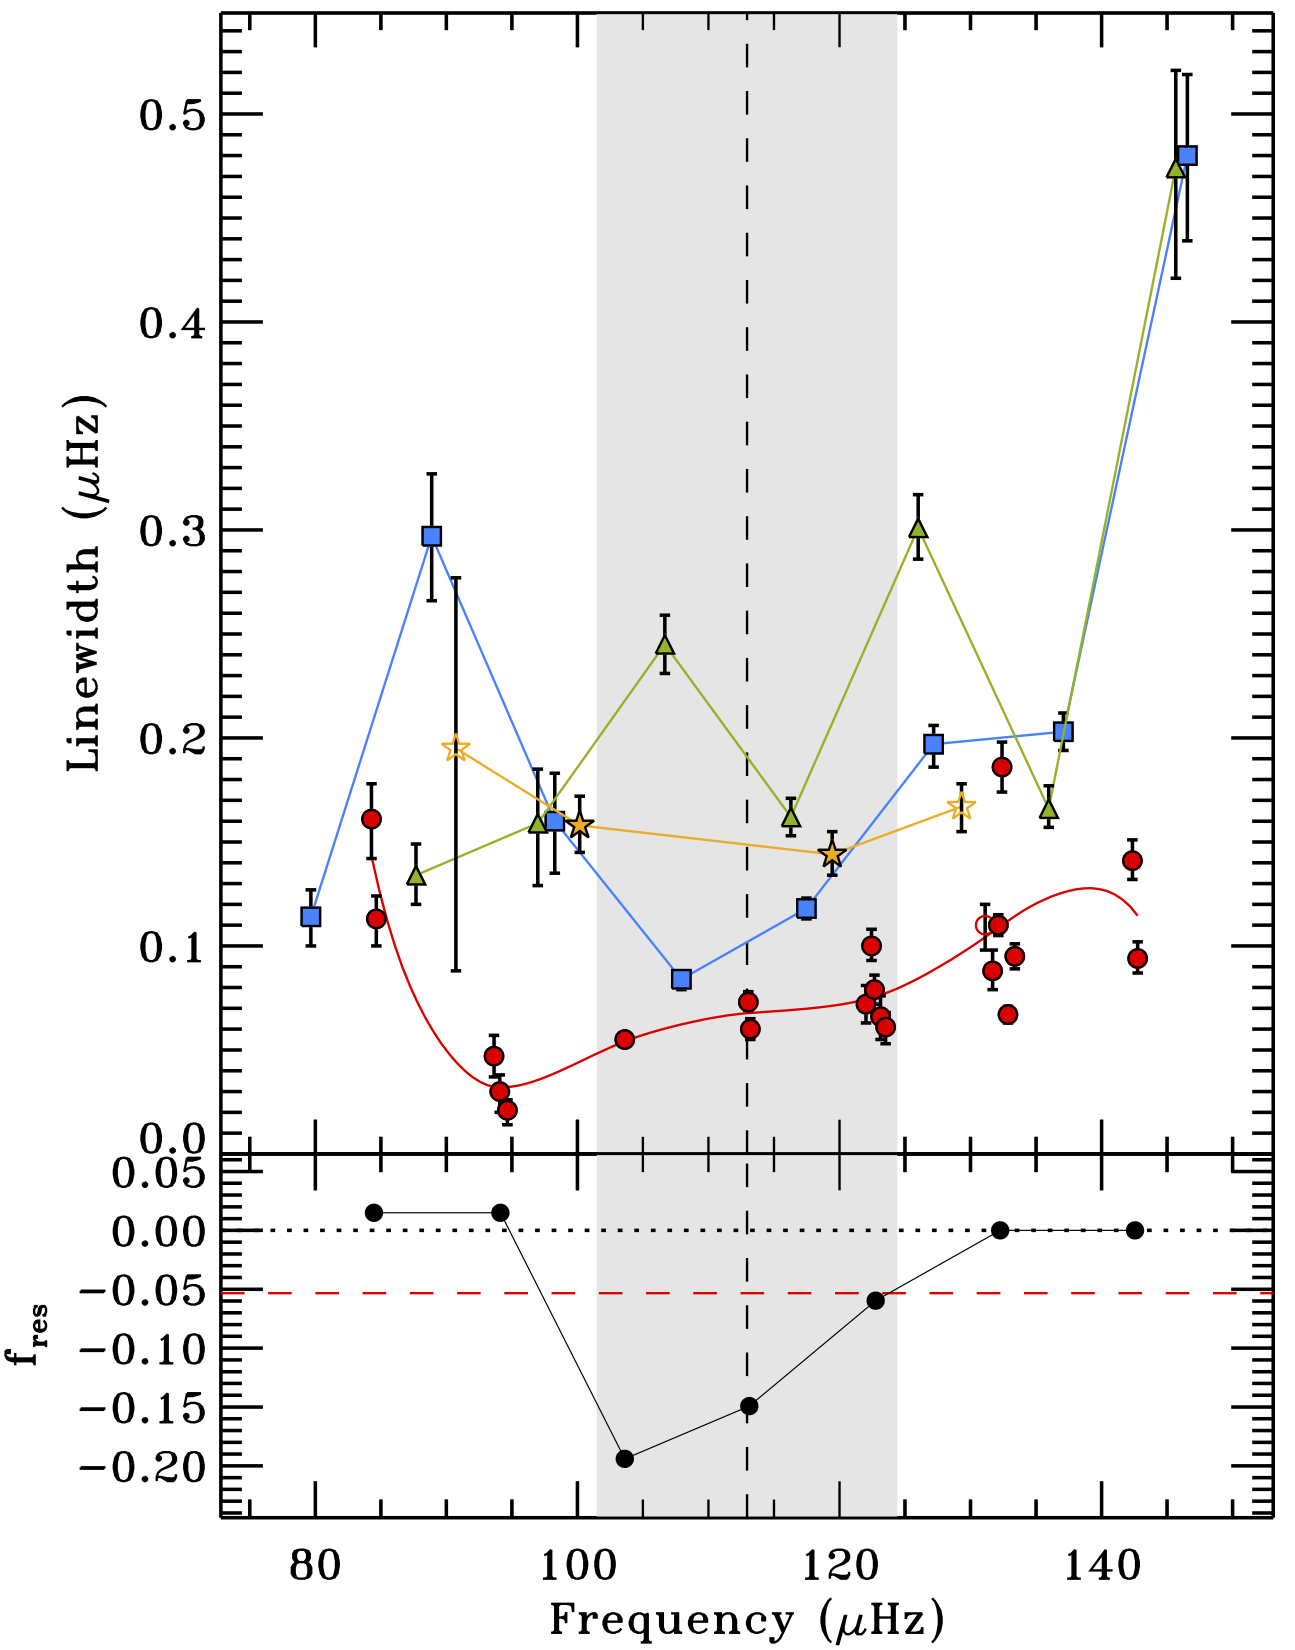
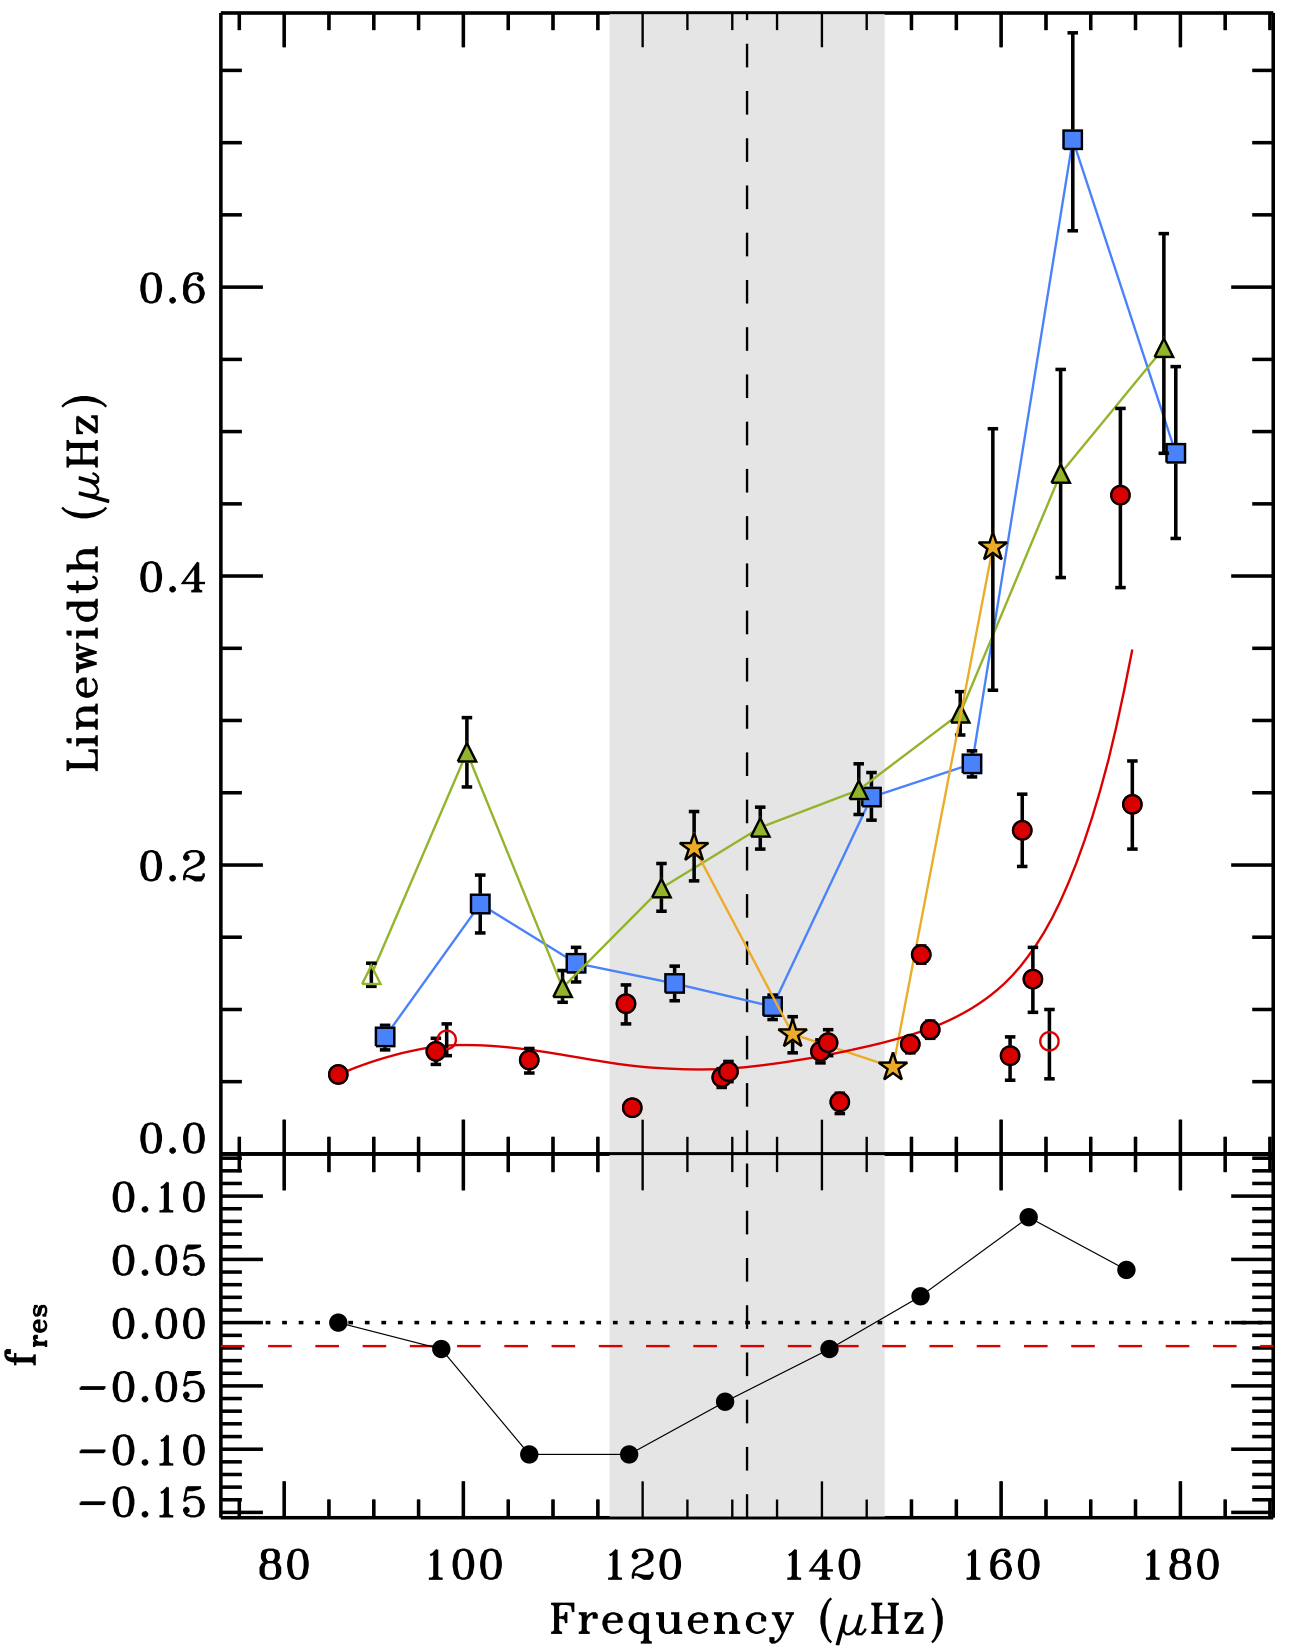
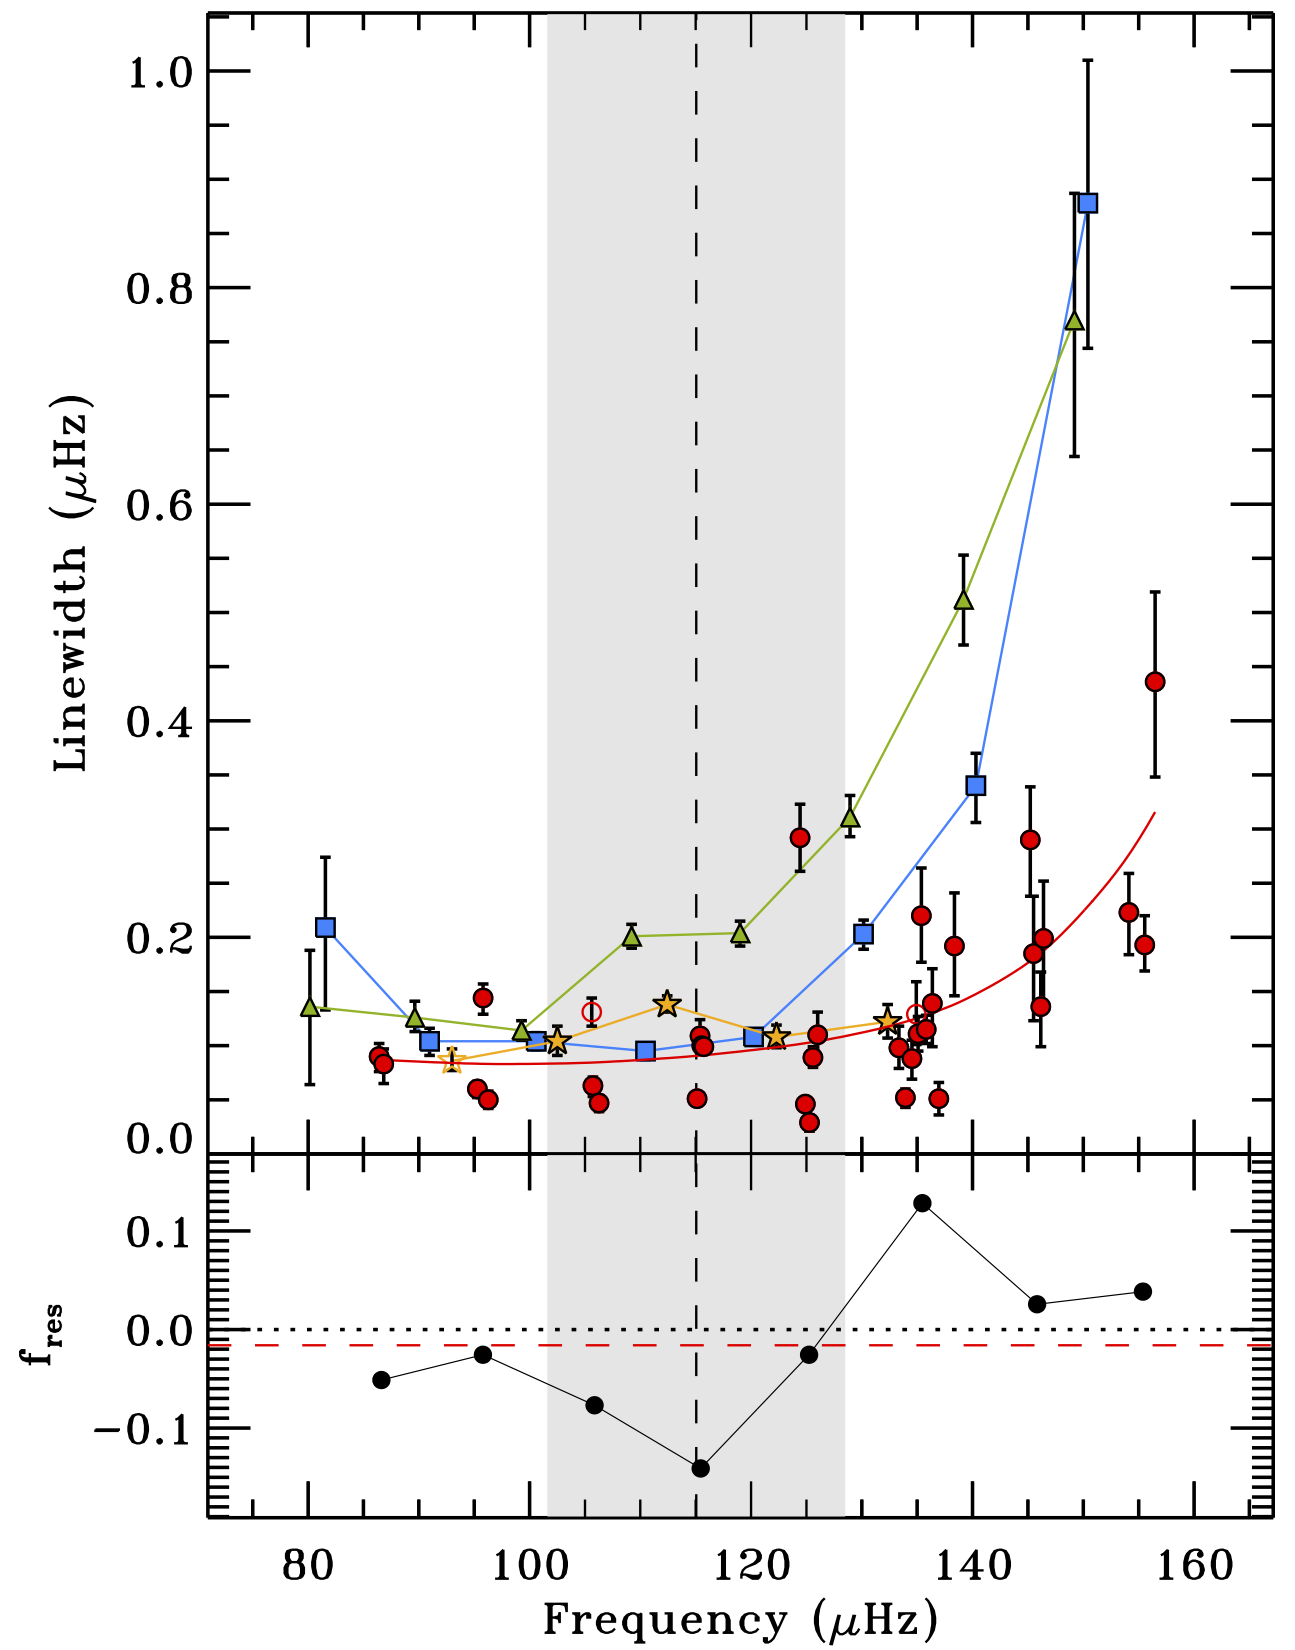
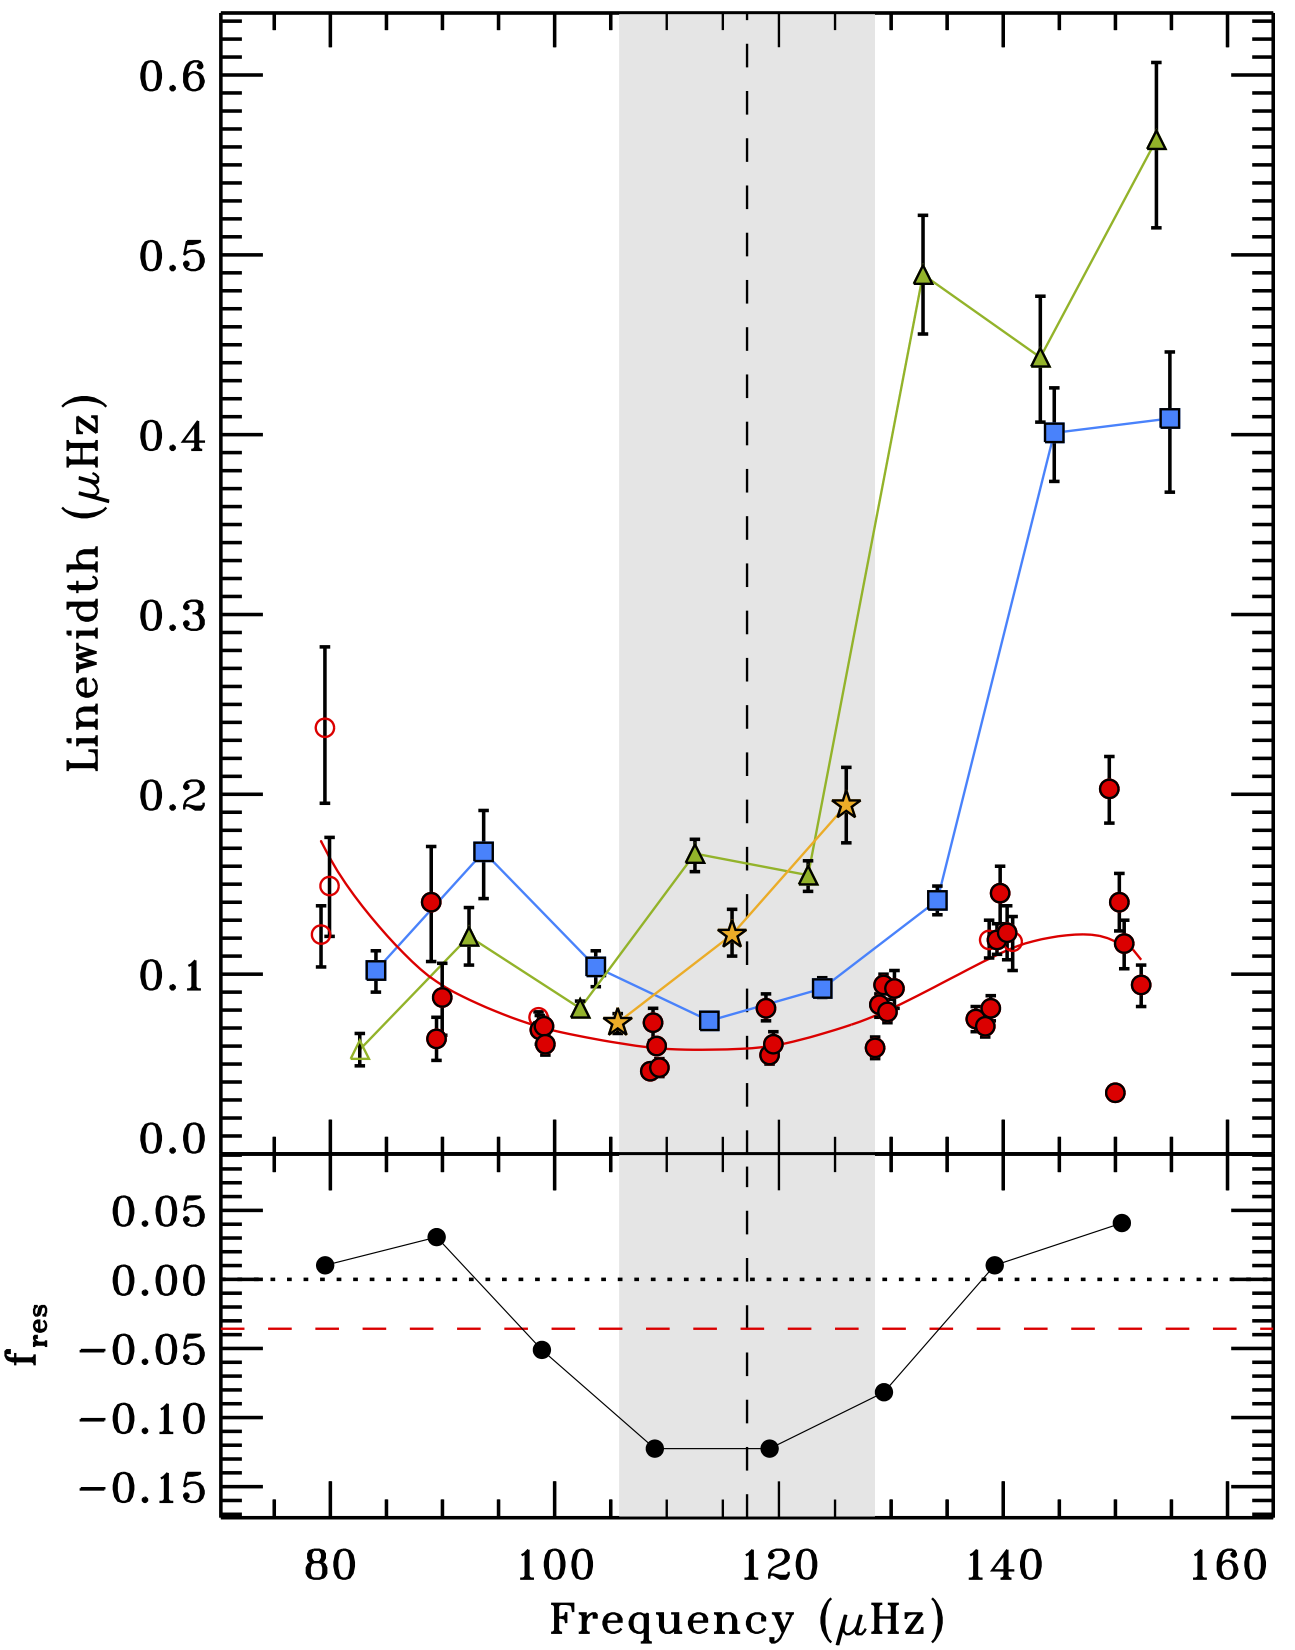
For radial orders where the mode linewidths encounter a depression, we therefore expect to decrease as well, since the number of fit resolved mixed modes is likely to be lower than in the case of radial orders in which the modes have a larger linewidth. This is shown again in the bottom panel of Fig. 6, where the decrease in is sited in the region close to . This behavior is evident for all the other stars of the sample as well (see the figures in Appendix B). To use as an indicator of the resolving level of the mixed modes fit in the star, we can compute an average value as
| (19) |
where is simply the total number of radial orders where the mixed modes are fit. The value for KIC 12008916 is indicated in the bottom panel of Fig. 6 by a horizontal dashed red line, and similarly for all the other stars in the corresponding figures provided in Appendix B. For KIC 12008916 we find that , namely the highest value in the entire sample and the only one falling in the resolved-dominated regime: the number of resolved (or partially resolved) mixed modes per radial order in this star is on average larger than that of the unresolved ones. For KIC 3744043, instead, we find the minimum value of the sample, , laying in the unresolved-dominated regime. The highest values of correspond to stars in which no rotation is detected, or in most cases to stars for which the central component of dipole mixed modes, , is missing.
An often investigated quantity related to the linewidth measurements, as already mentioned in Sect. 1 and 2, is their correlation with the stellar effective temperature (e.g. see Hekker et al. 2010; Baudin et al. 2011; Appourchaux et al. 2012; Belkacem et al. 2012; Corsaro et al. 2012, for more results and details). A theoretical modeling of the damping rates of radial modes based on the existing observations from CoRoT and Kepler (Belkacem et al. 2012) has proposed a common physical description of the linewidth-temperature correlation from main-sequence to low-temperature giant stars (down to K), although it did not exploit linewidth measurements in the critical temperature range used in this paper.
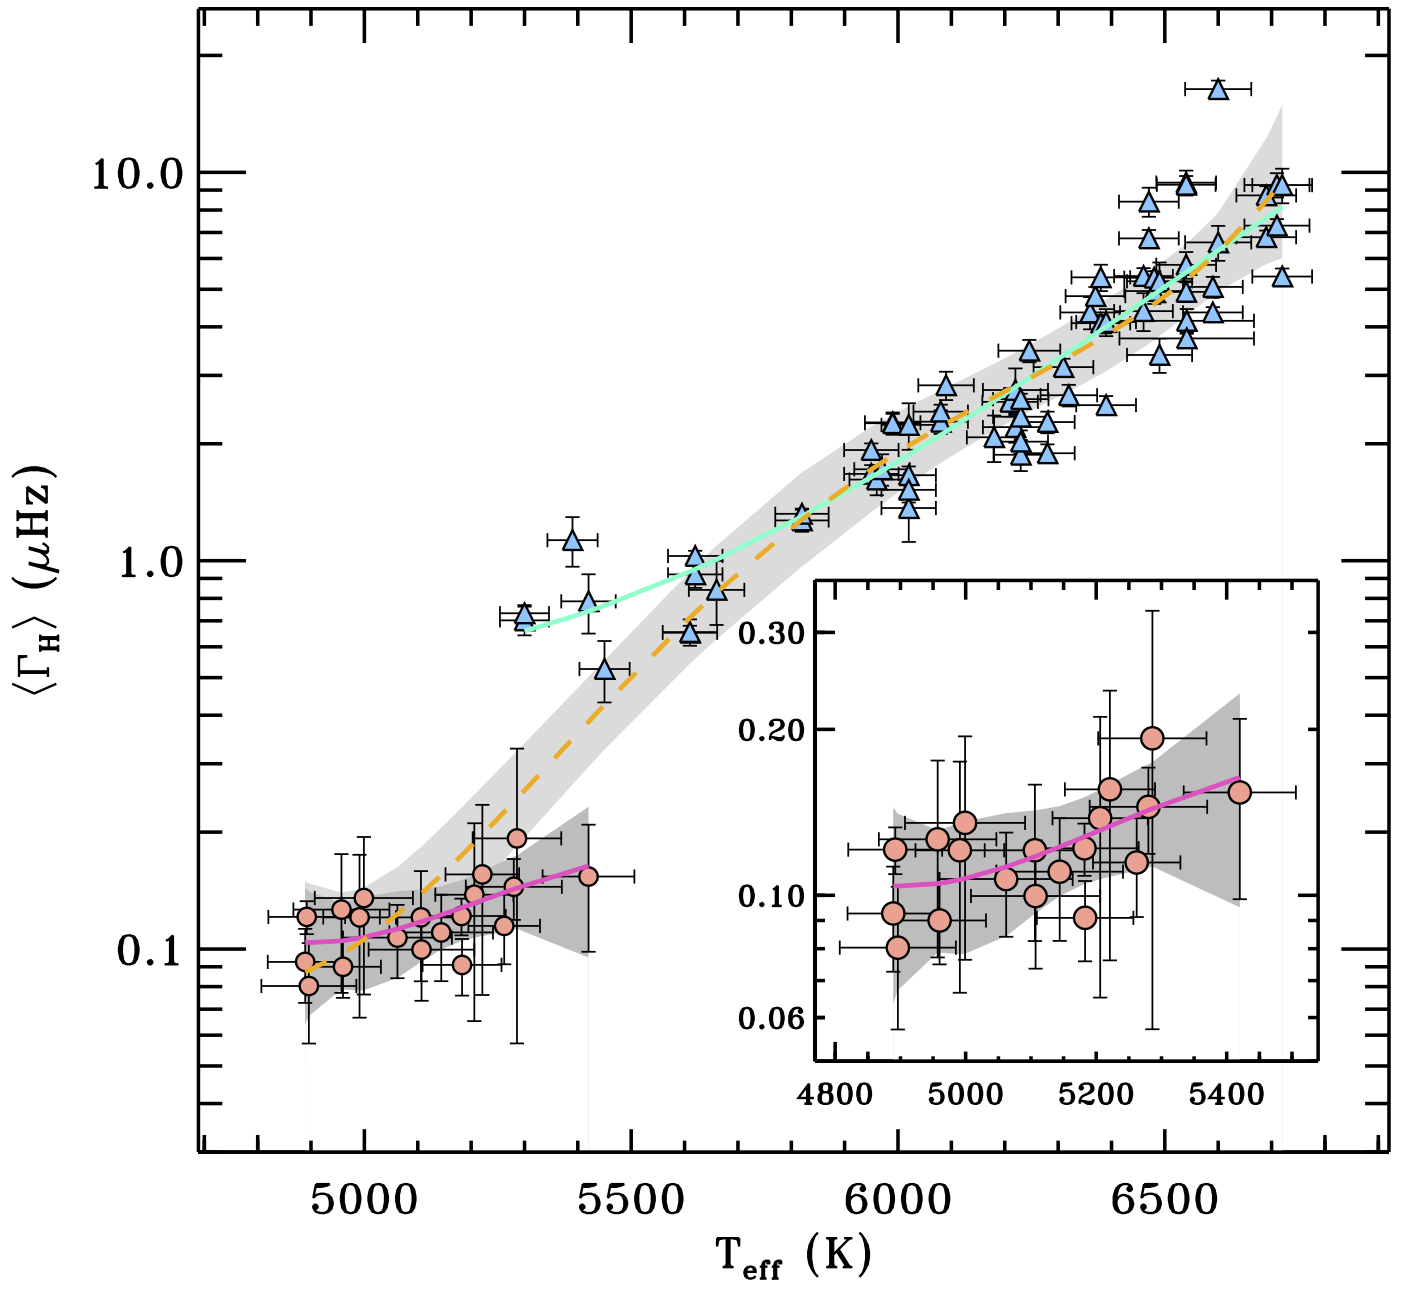
Following Baudin et al. (2011) and Appourchaux et al. (2012), we have computed for each star in our sample an average linewidth at maximum mode height, , by taking the average linewidth of radial modes in three radial orders around the radial mode with maximum height, which is more immune to systematic effects as discussed by e.g. Appourchaux et al. (2012). The resulting values are shown in Fig. 7 (red circles) as a function of from Pinsonneault et al. (2012), where the error bars on each are the standard deviations from the three linewidths used in the calculation. This allows us to compare the result with the existing set of measurements for a sample of main-sequence and subgiant stars investigated by Appourchaux et al. (2012) (blue triangles). We observe a steeper temperature gradient of for the hotter main-sequence stars with respect to the cooler RGs, in agreement with previous studies (Baudin et al. 2011; Belkacem et al. 2012). This change in the slope of the correlation between and linewidths appears more evident in the temperature range around K, and is emphasized by the polynomial fits overlaid to our measurements and by the confidence regions marked with gray-shaded bands, in comparison to the power law fit derived by Appourchaux et al. (2012).
4.2 Mode amplitudes
Mode amplitudes are the primary information to study the detectability of the oscillations and the physical process responsible for their excitation mechanism, especially in the less known case of the mixed modes (e.g. Grosjean et al. 2014). Retrieving empirical relations that allow us to predict amplitudes in other RGs stars (e.g. Corsaro et al. 2013, and references therein) is certainly useful to facilitate future detailed asteroseismic analyses on a larger sample of targets.
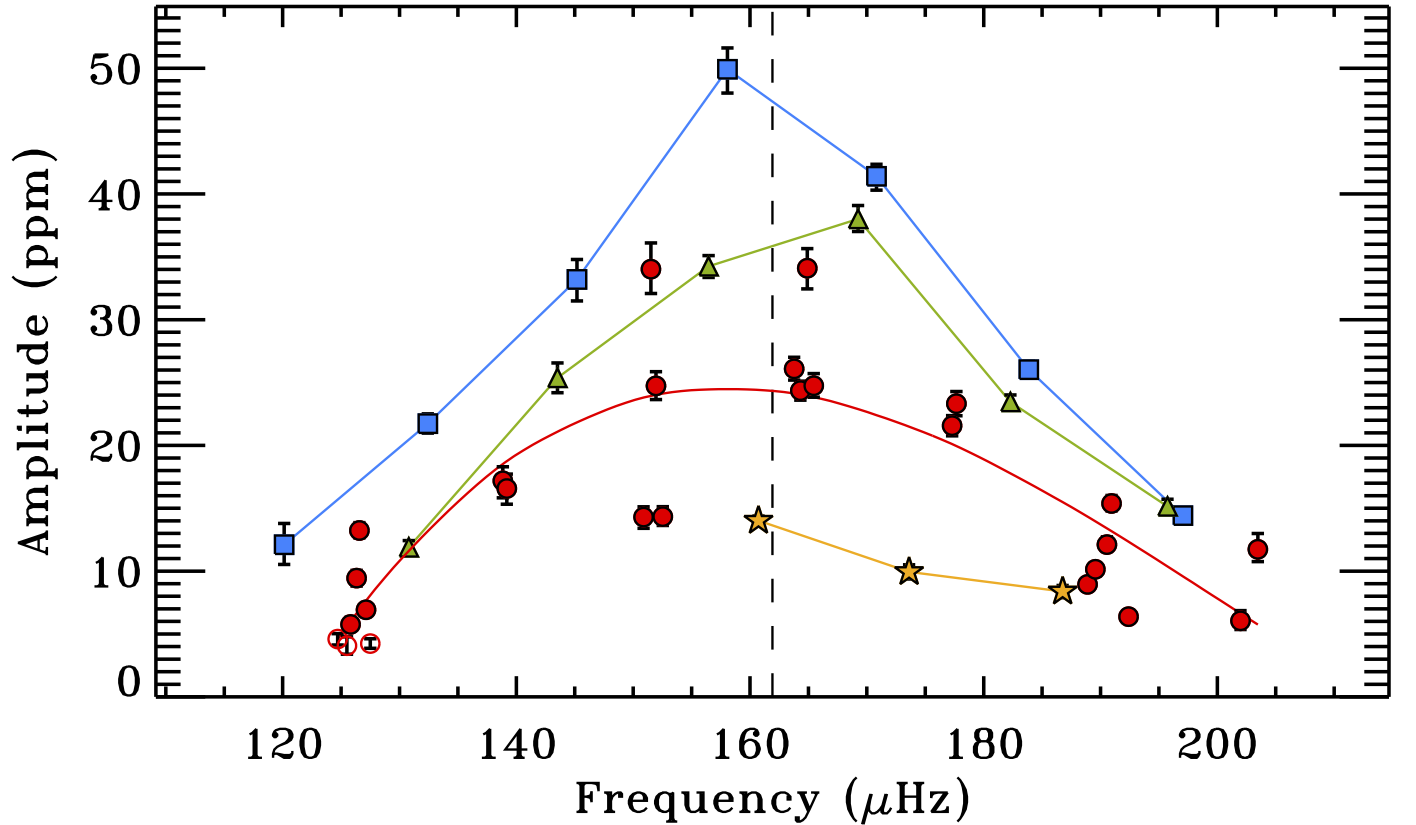
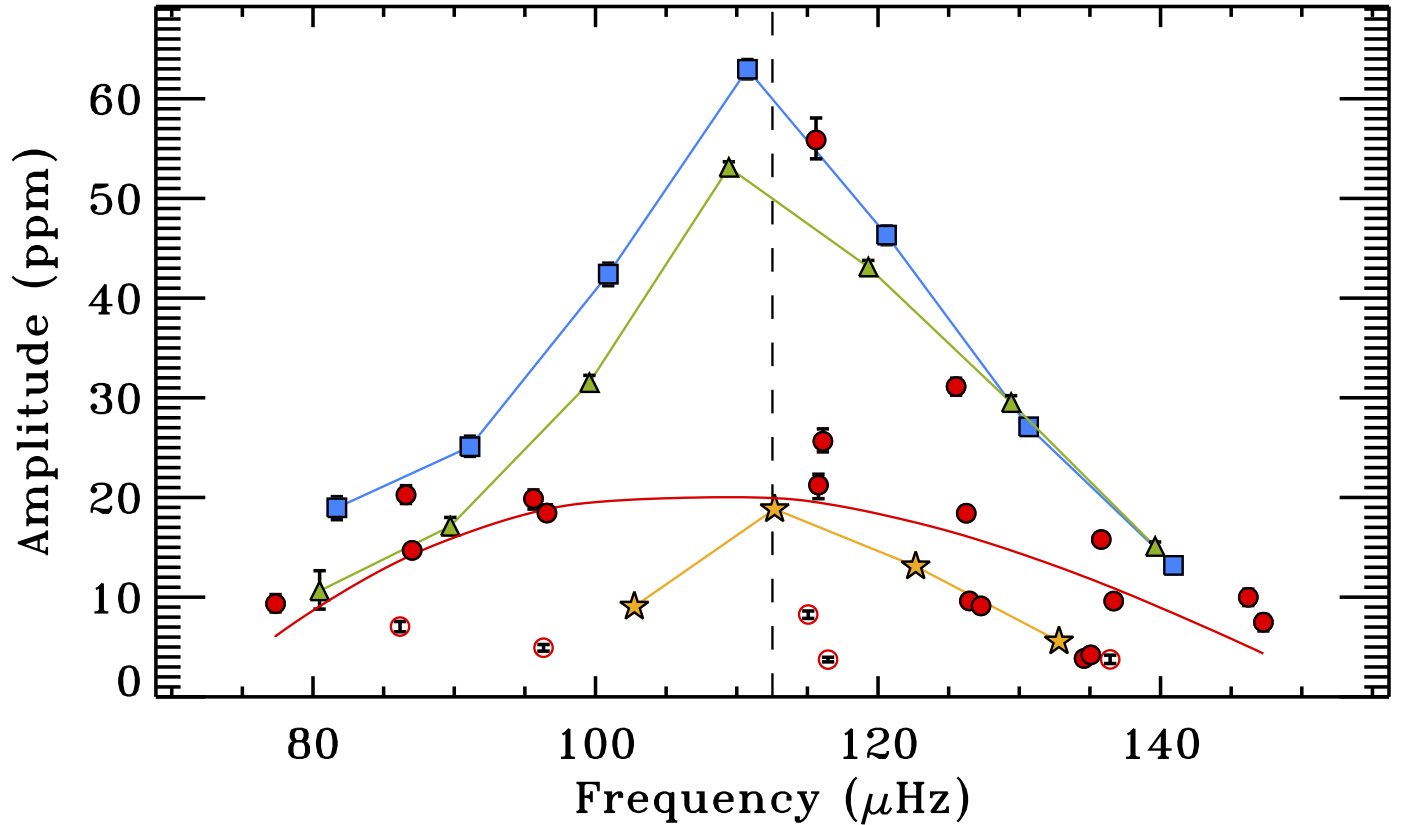
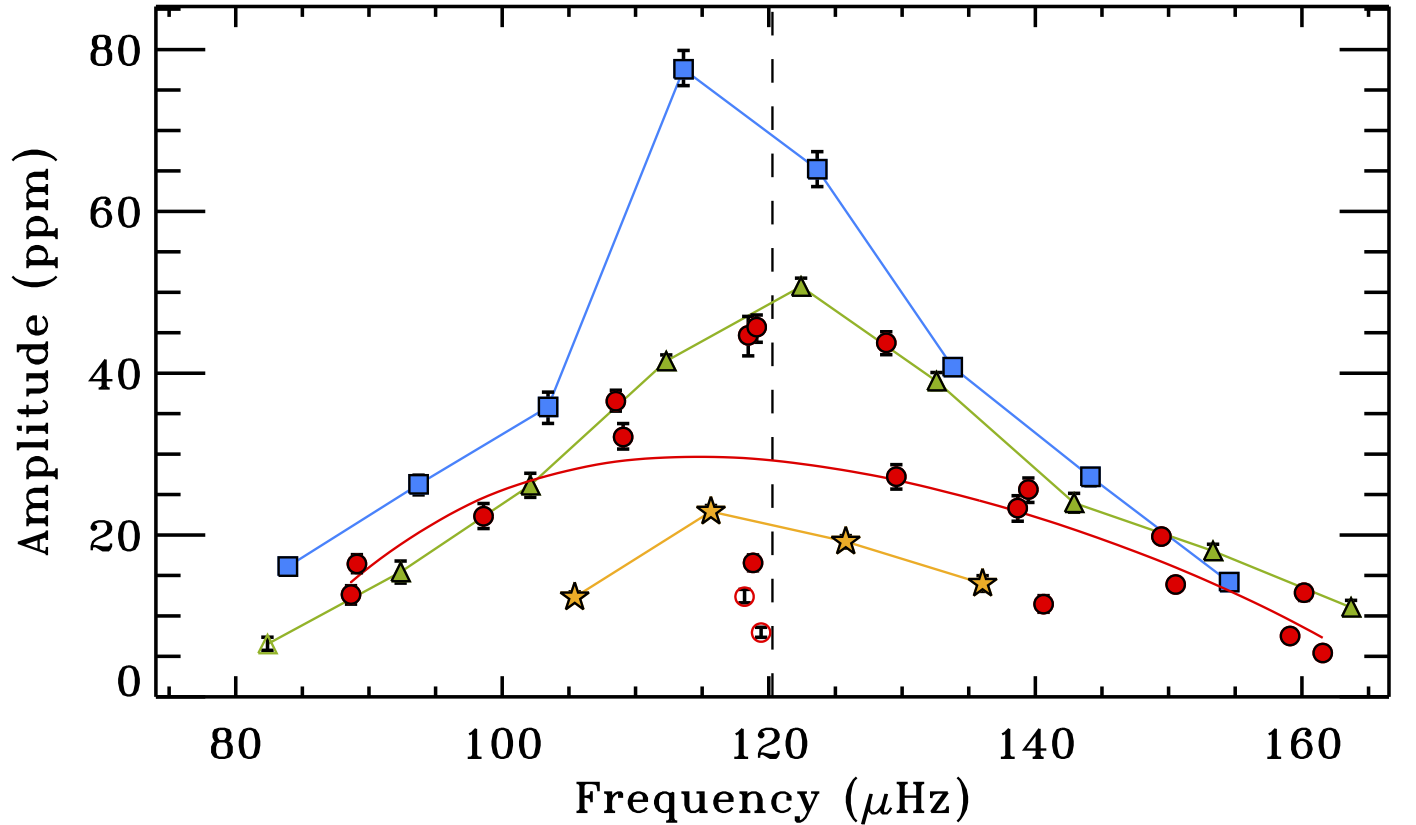
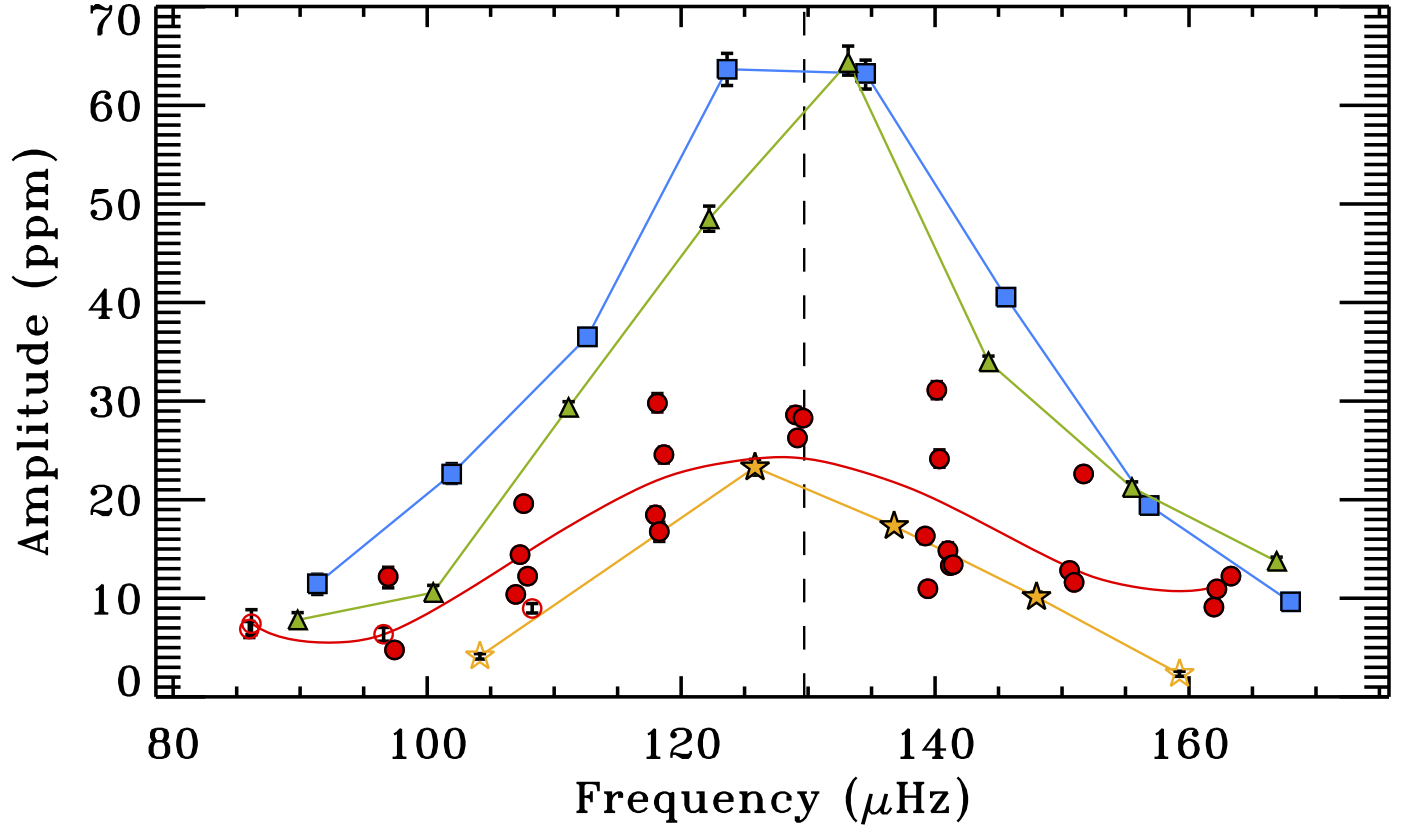
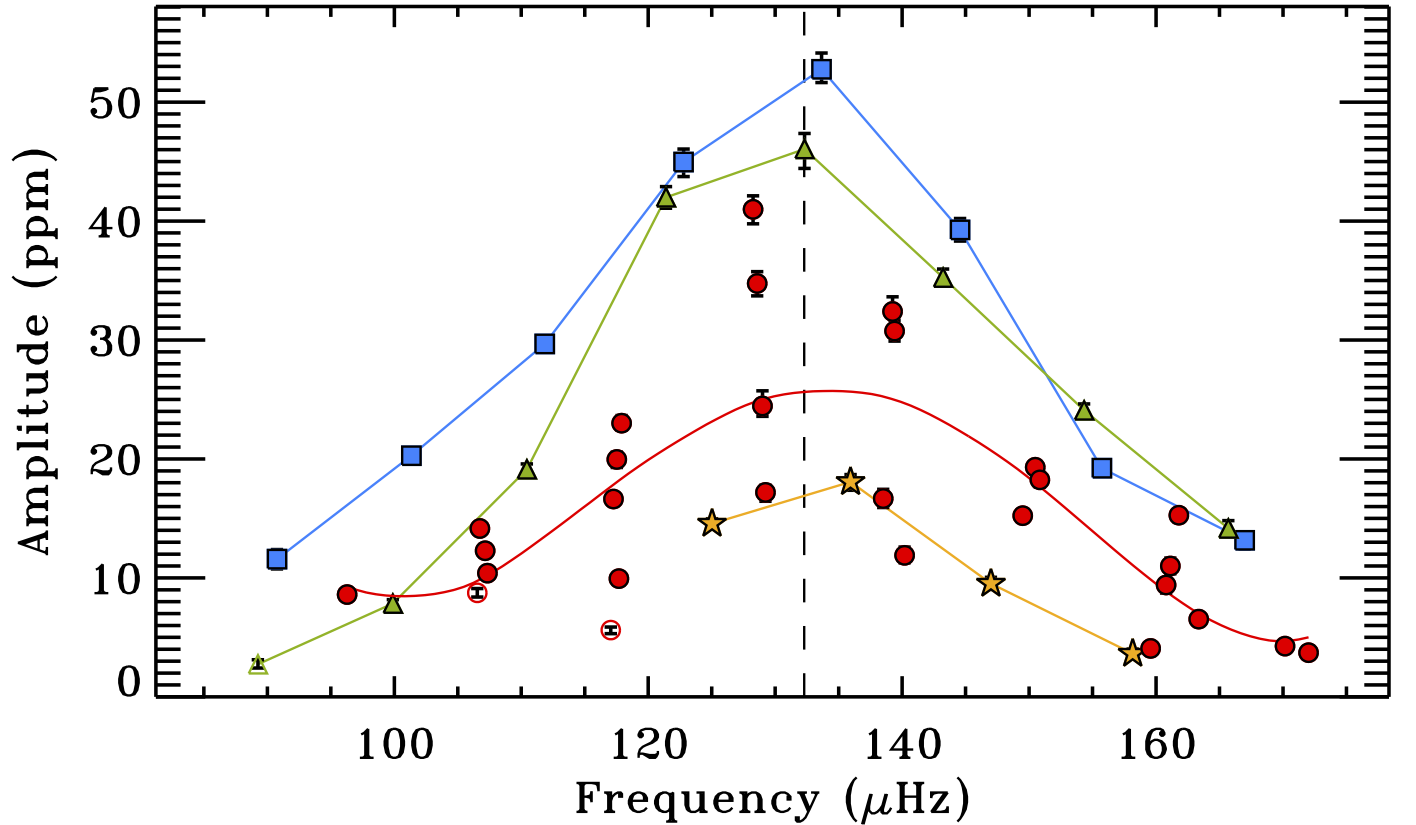
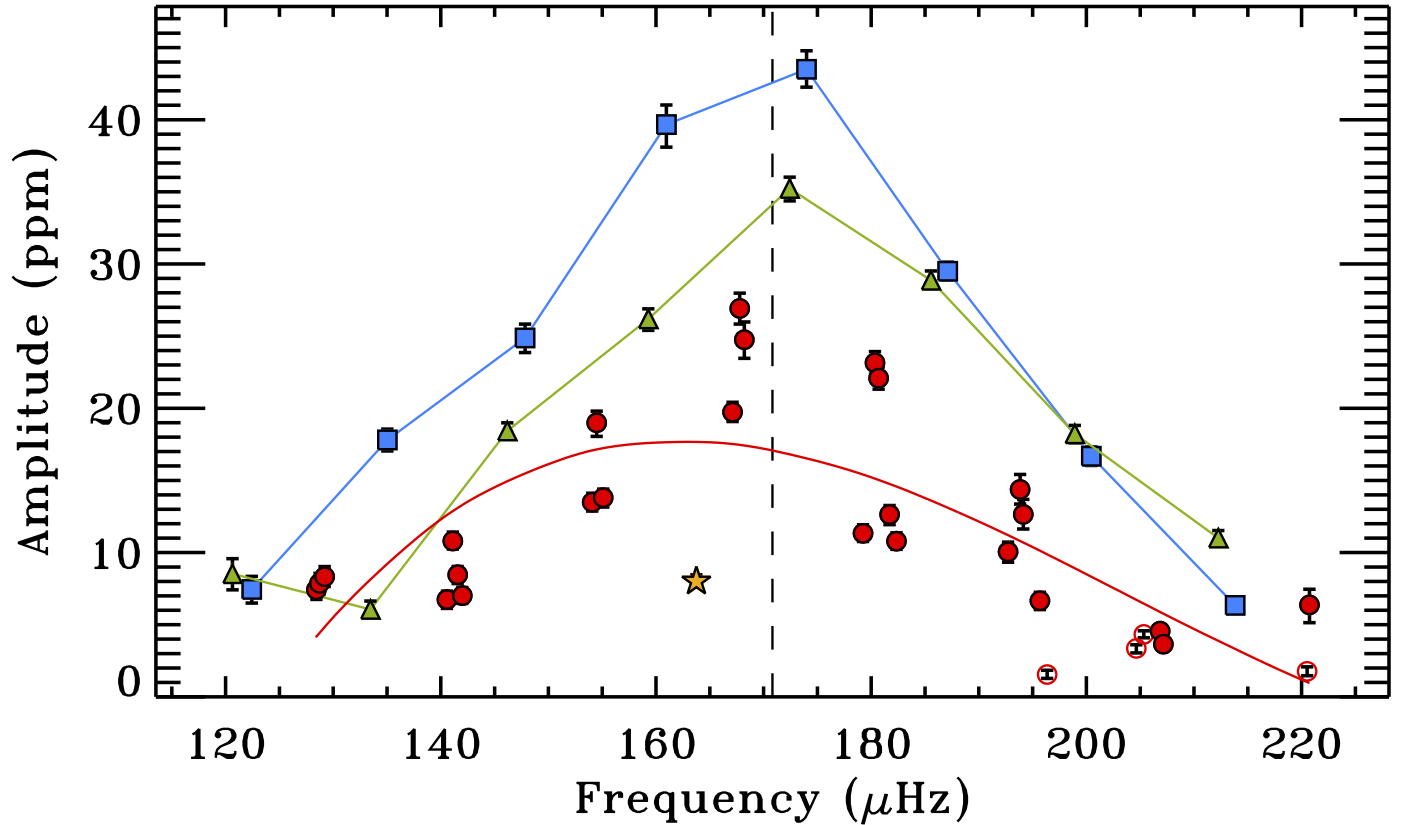
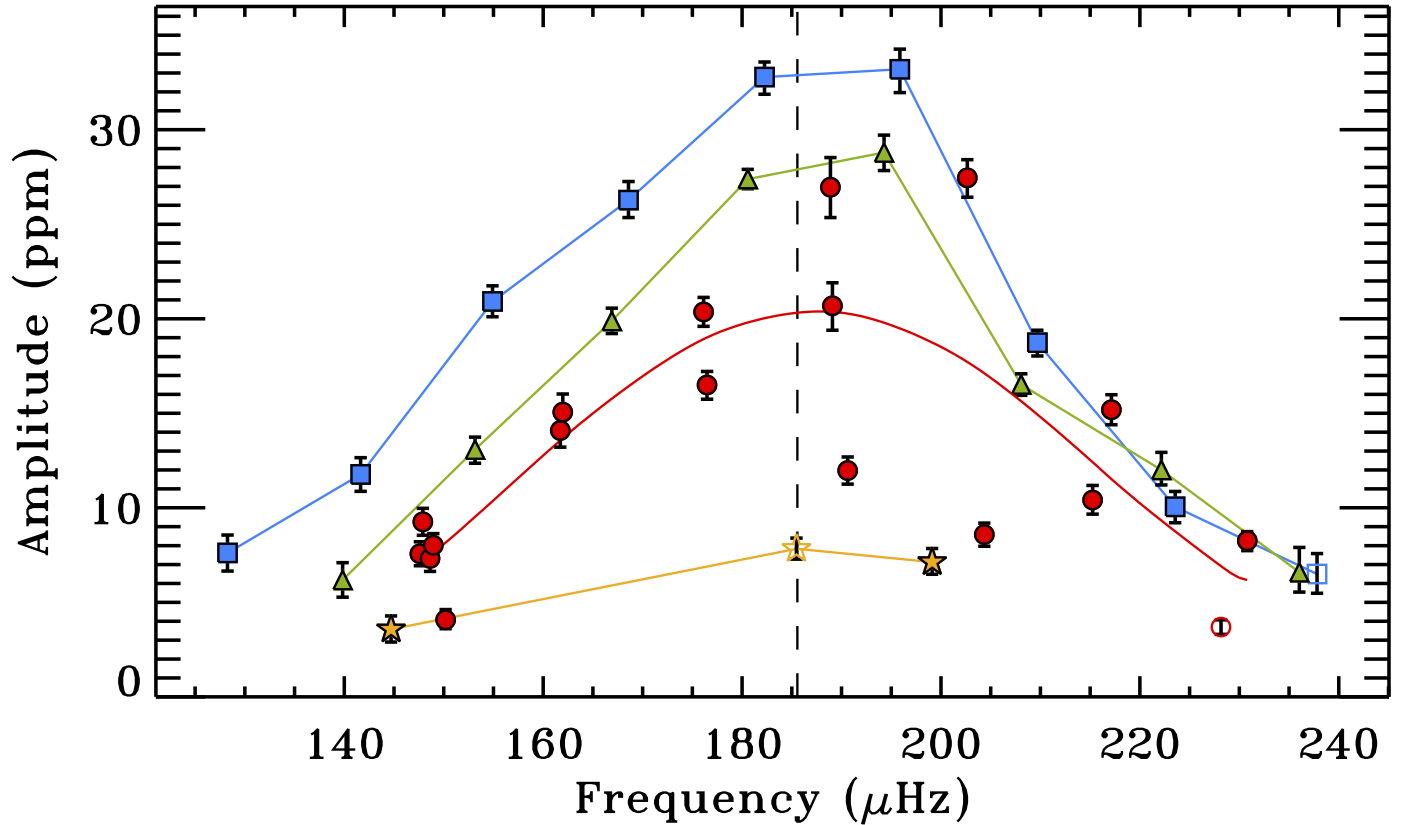
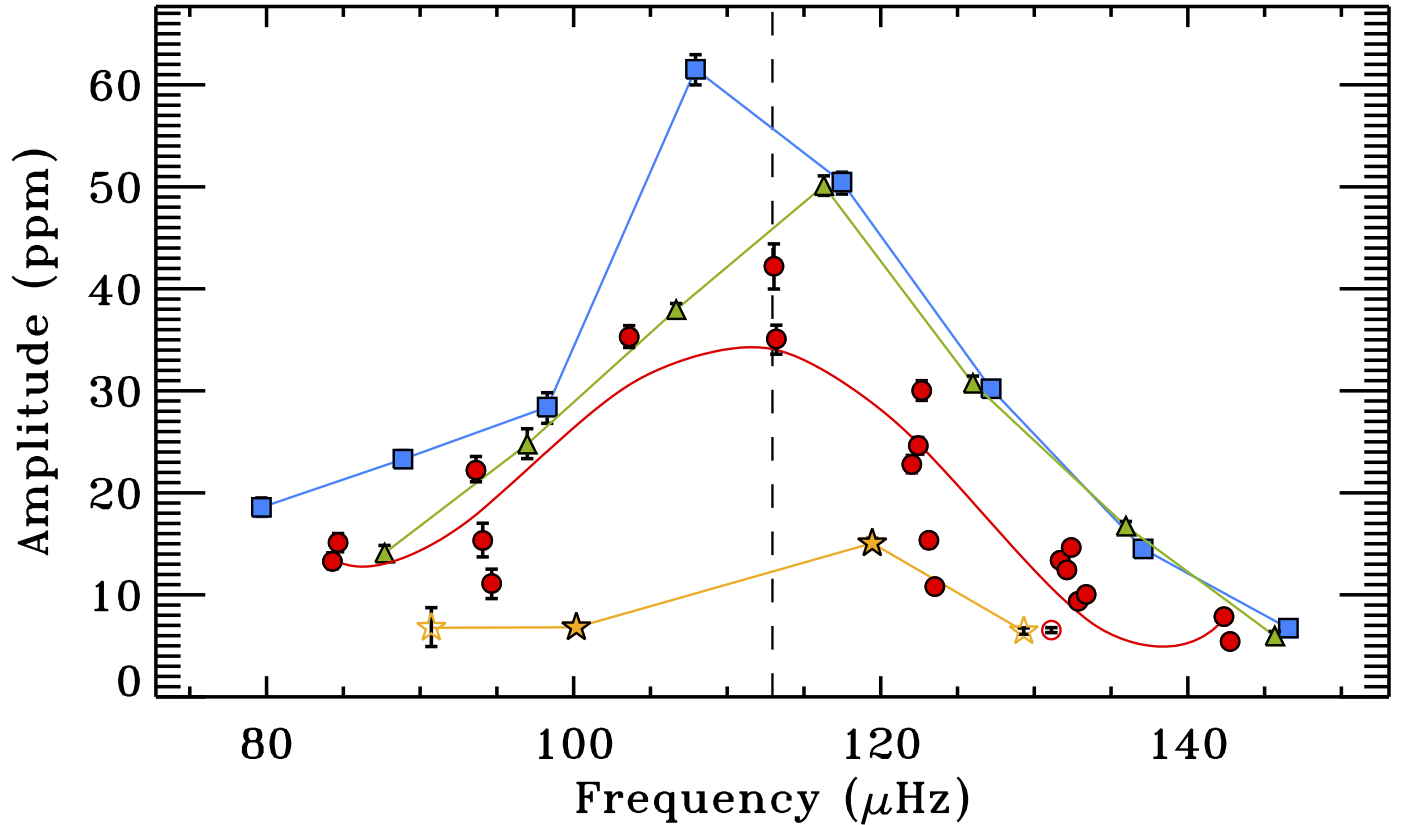
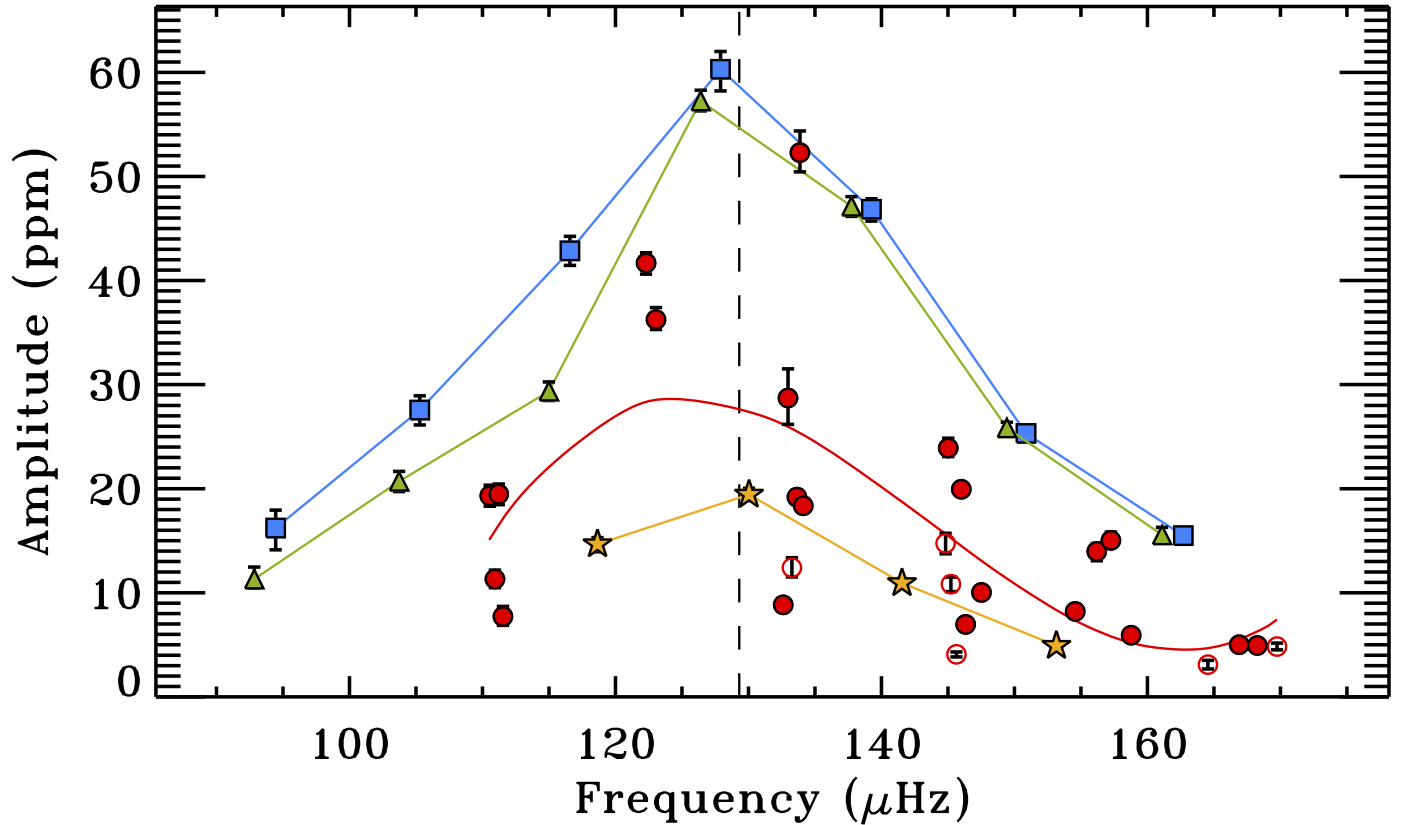
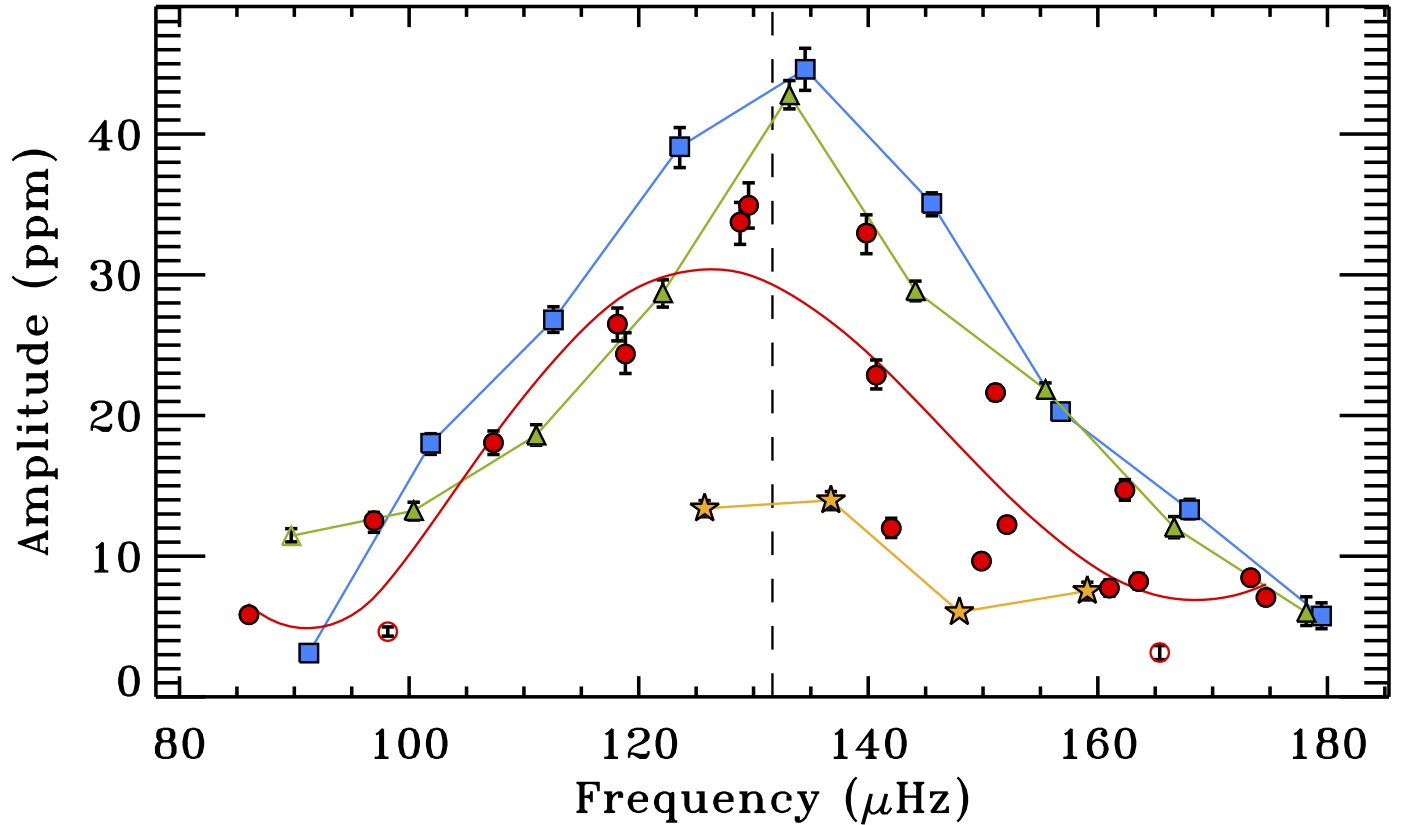
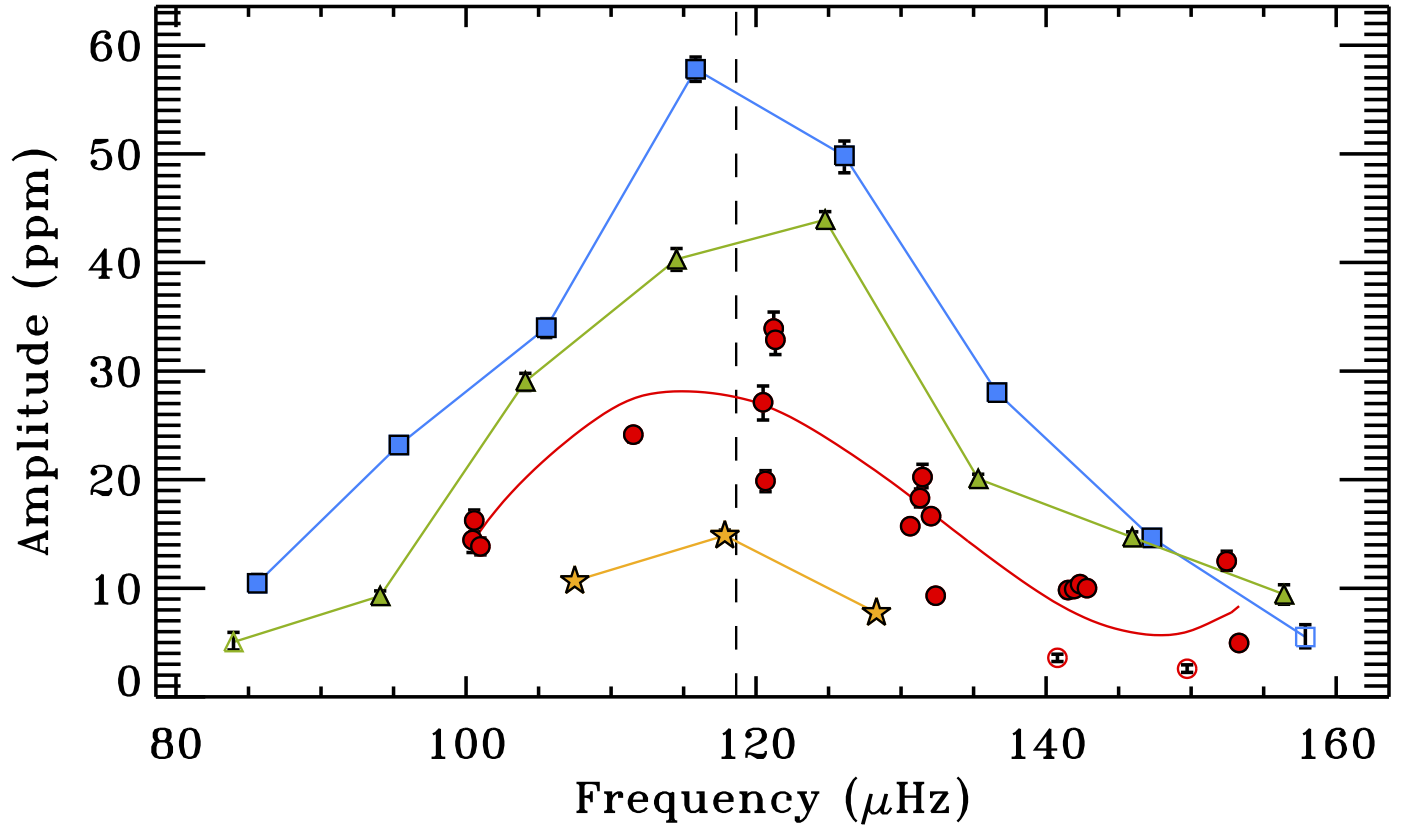
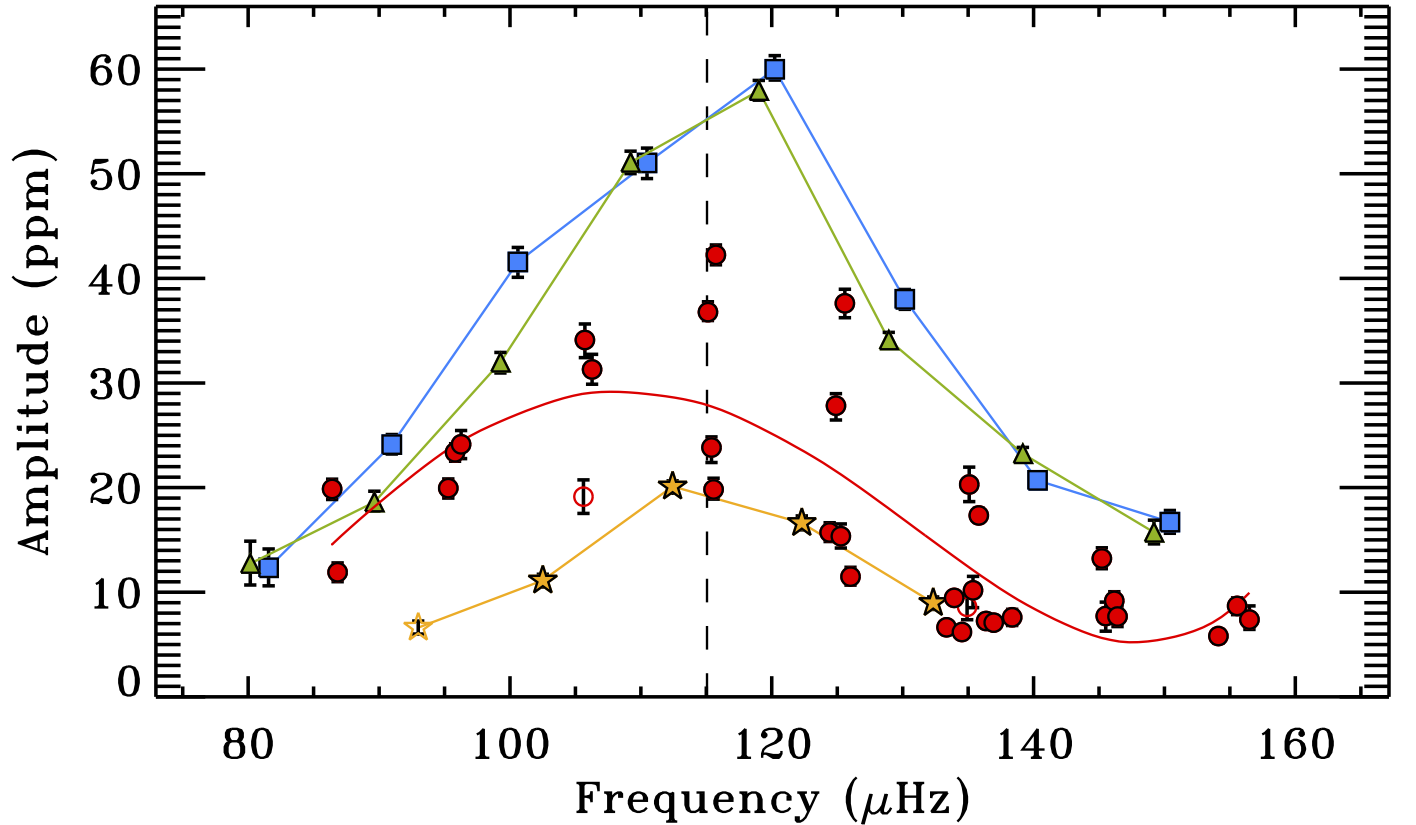
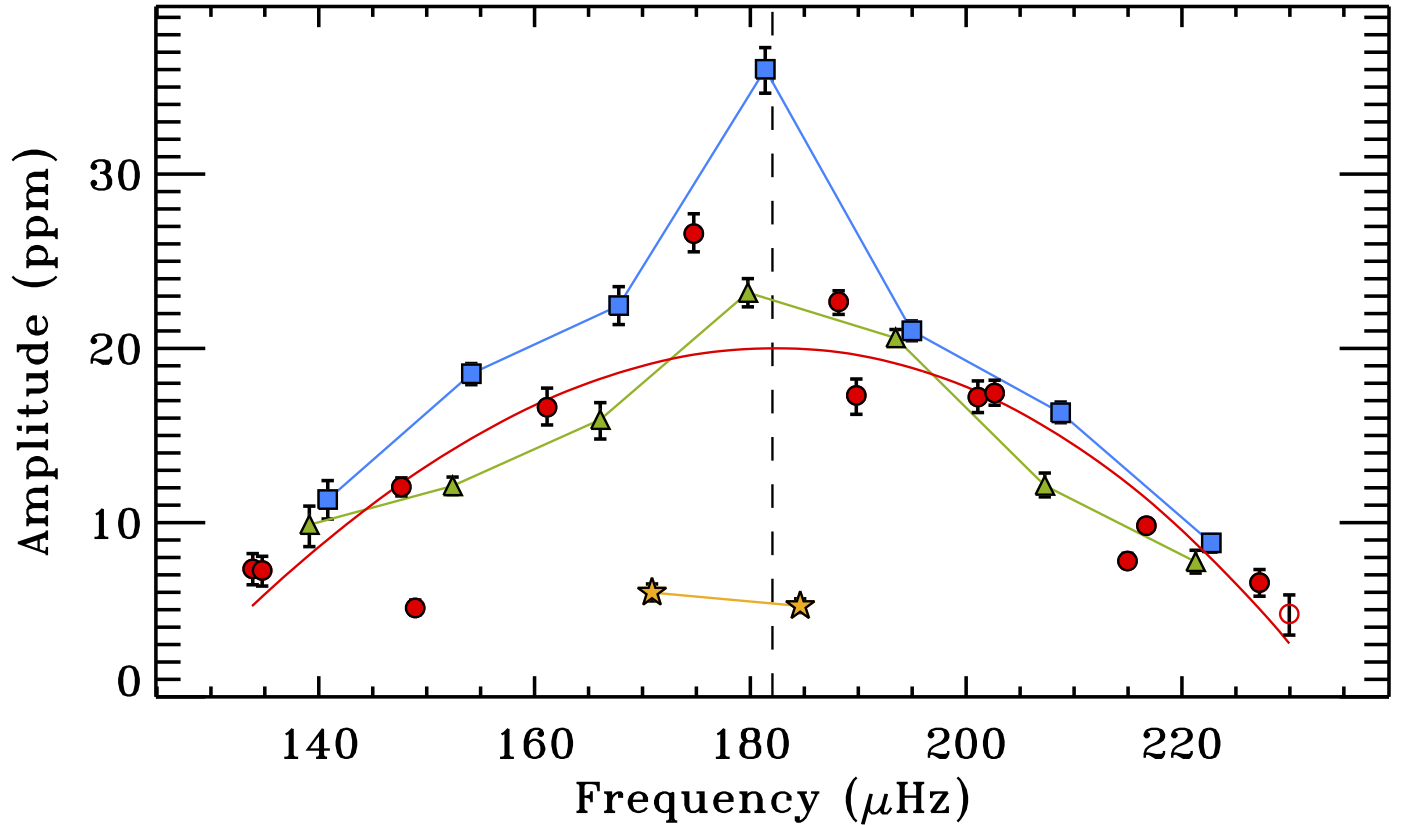
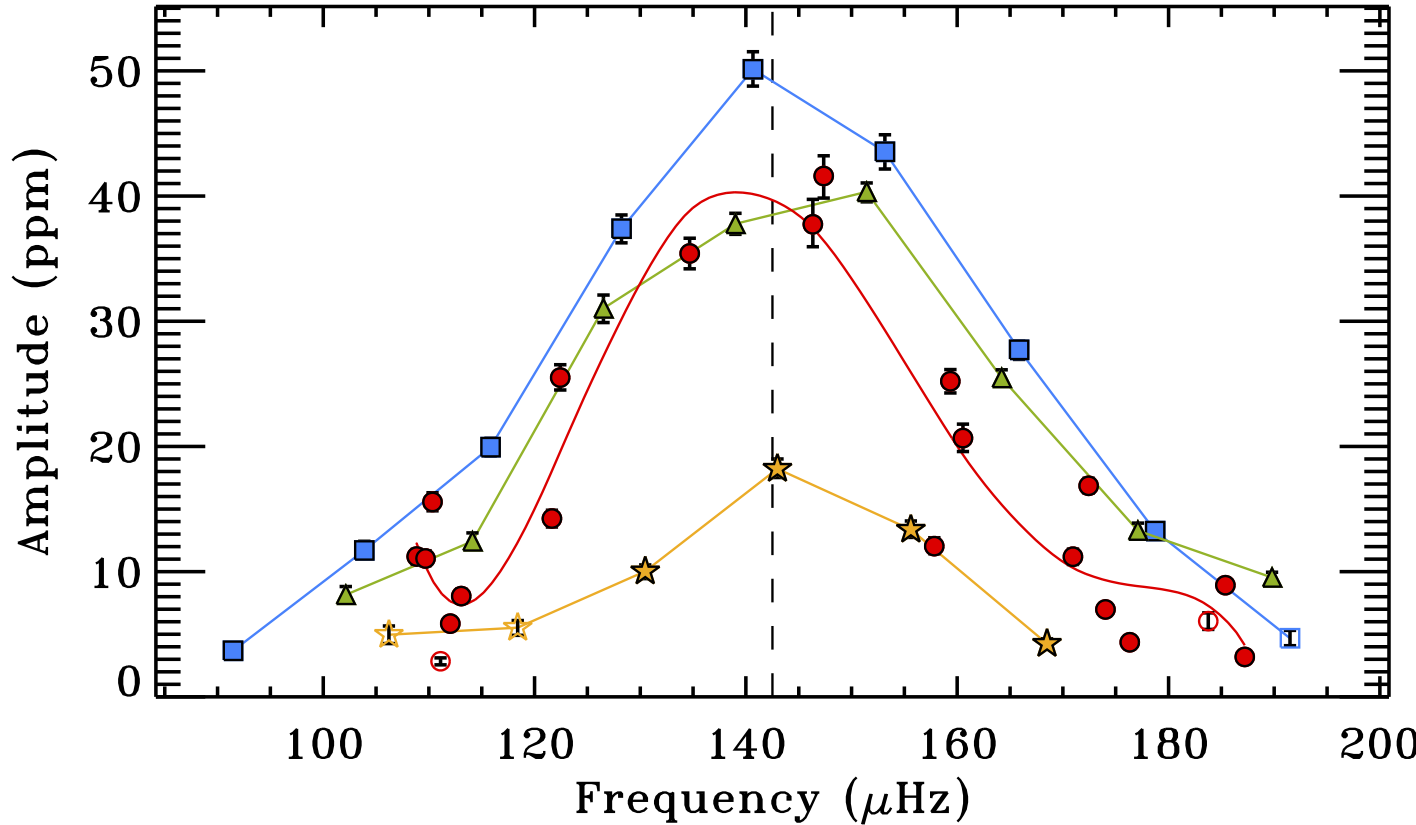
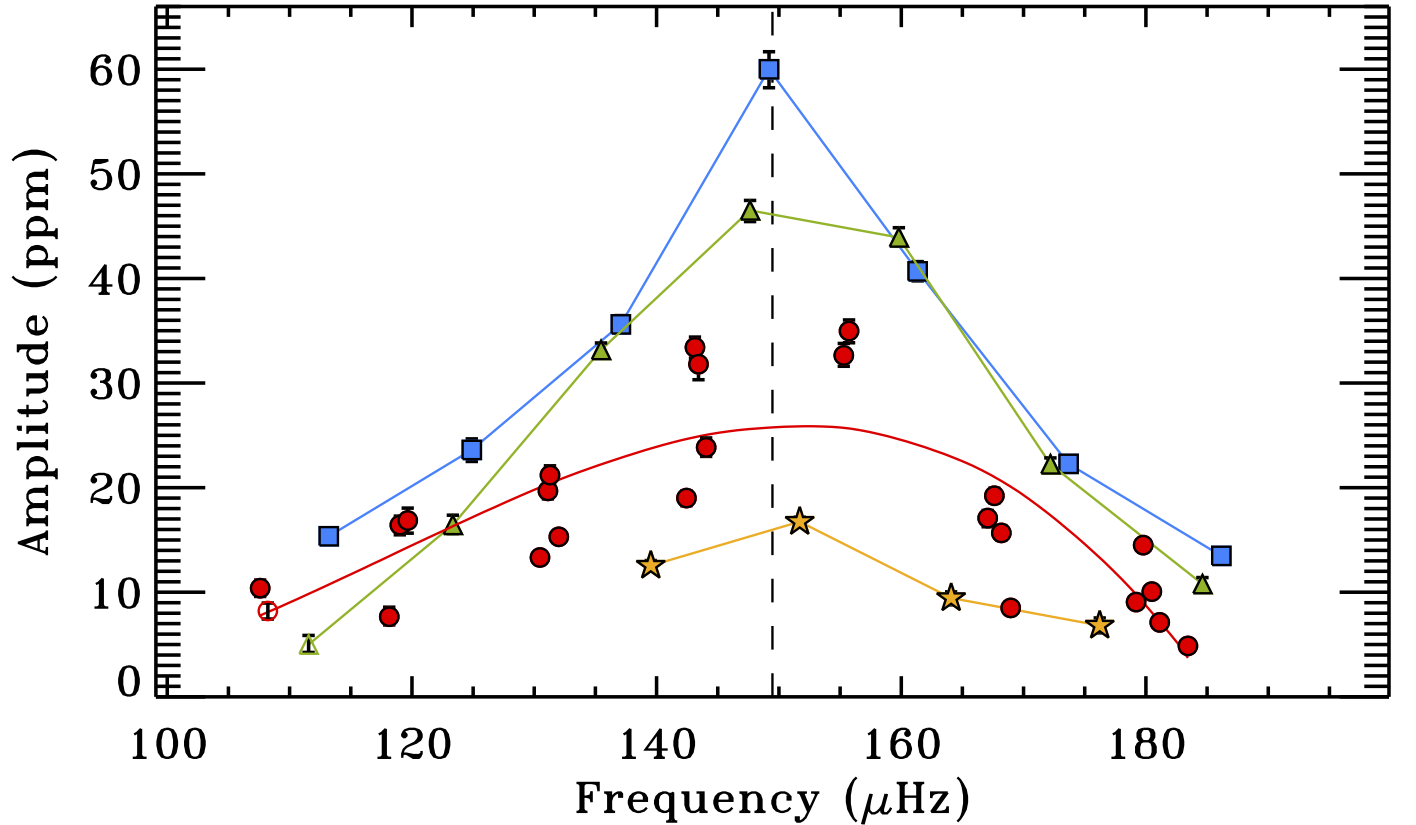
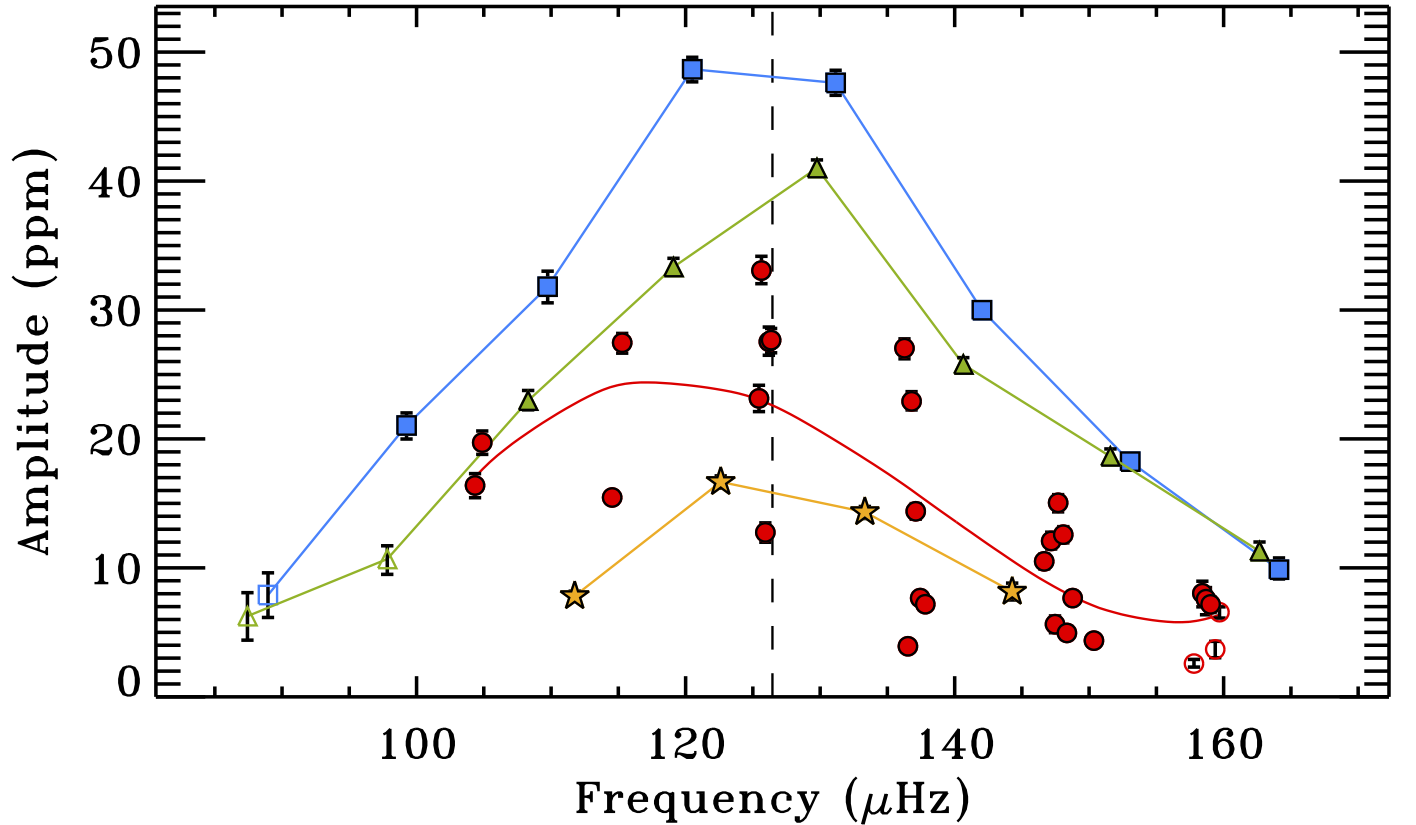
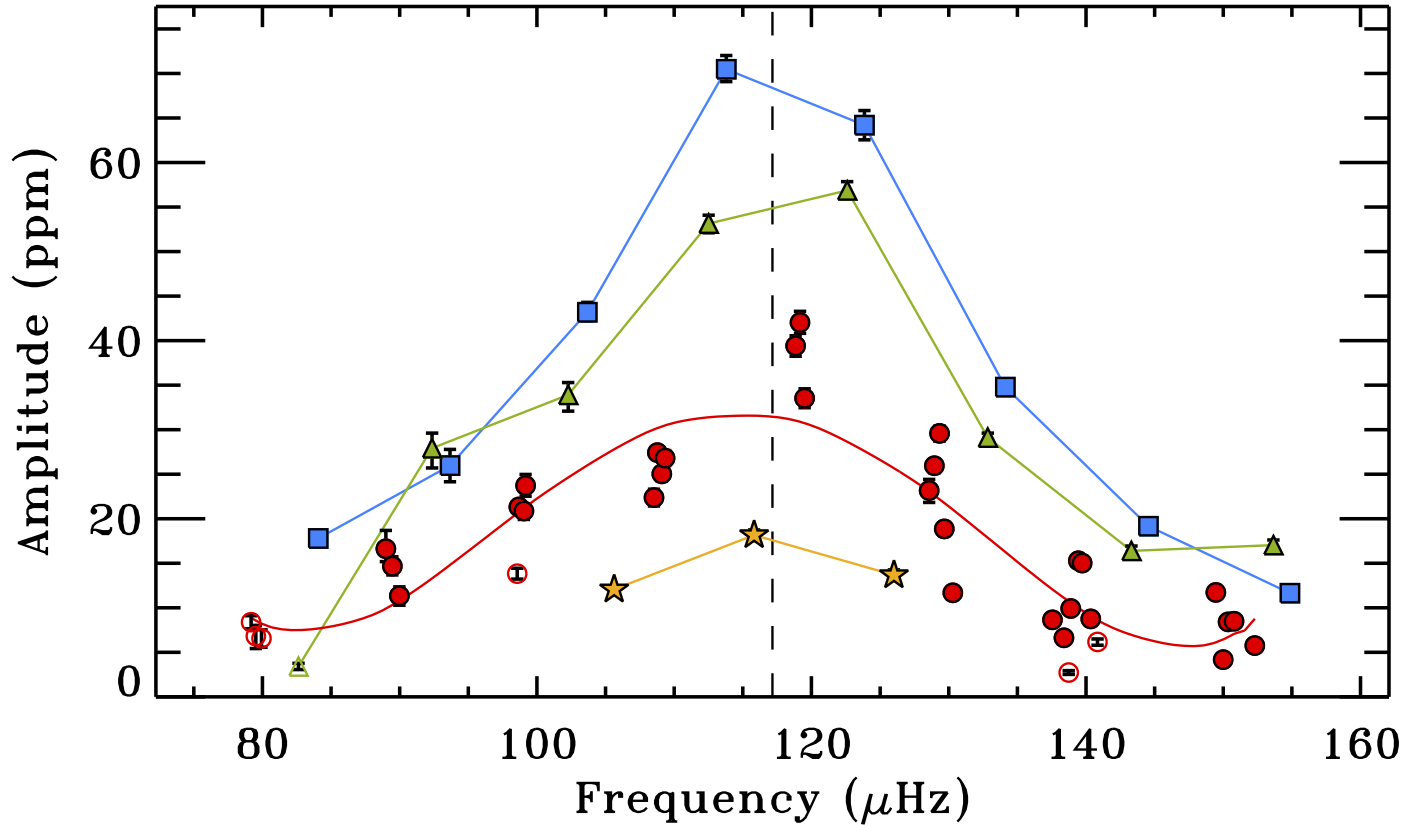
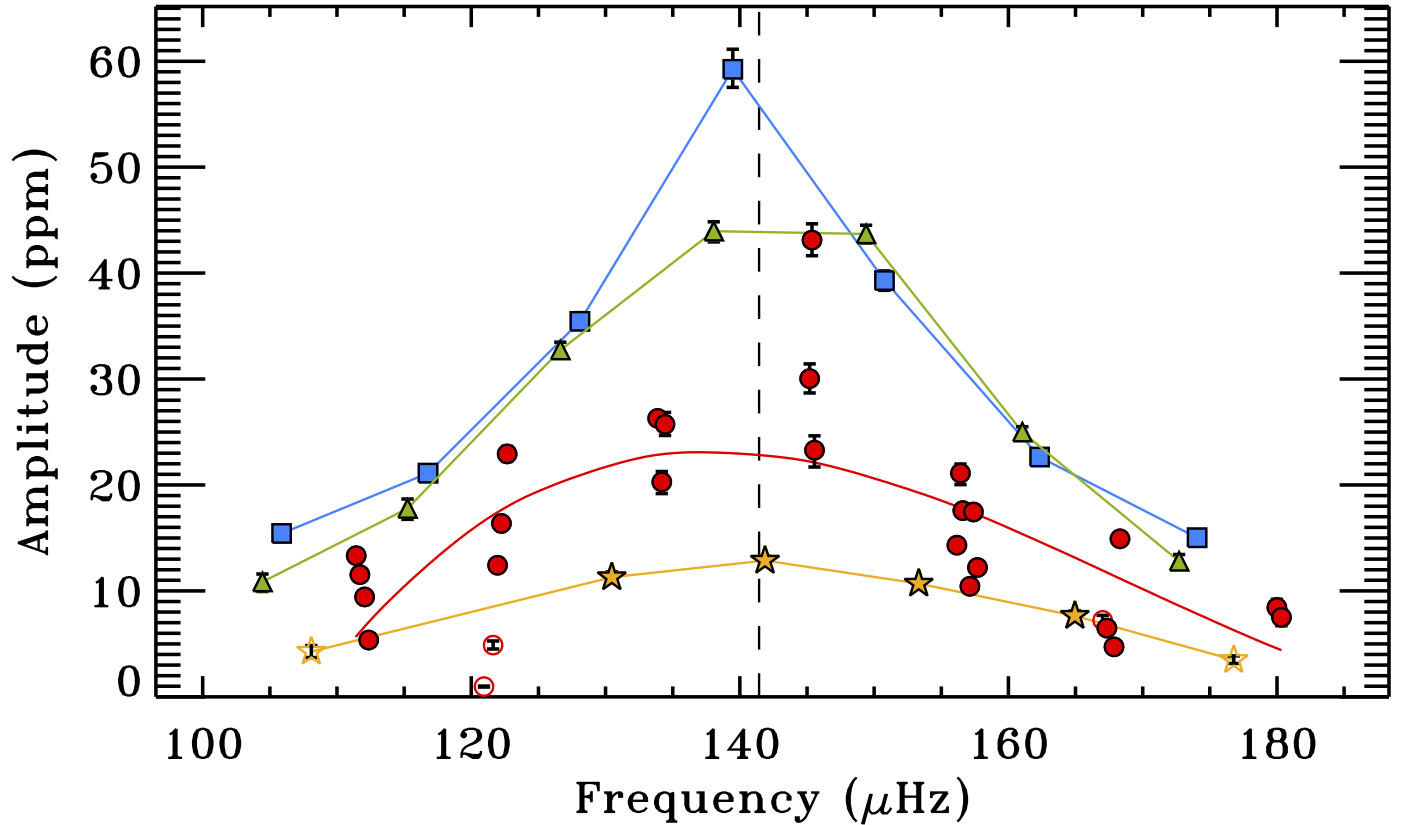
An example of the resulting mode amplitudes as a function of the corresponding oscillation frequencies for KIC 12008916 is given in Fig. 8 for the different angular degrees, including the resolved mixed modes for which a polynomial fit to enhance the trend was added. The plots for all the other stars can be found in Appendix B. By computing an average ratio (or visibility factor) of the amplitudes between modes, , and , resolved , and modes, , , , respectively, we find that , , and . The error bars are computed from the dispersion in the ratios coming from the sample analyzed. These visibilities are useful for setting up prior distributions on mode amplitudes in other red giant stars (see Sect. 5 for more discussion), while individual mode amplitudes can also be used to compare visibilities of LRGs with stars in different evolutionary stages (e.g. Ballot et al. 2011a; Benomar et al. 2013).
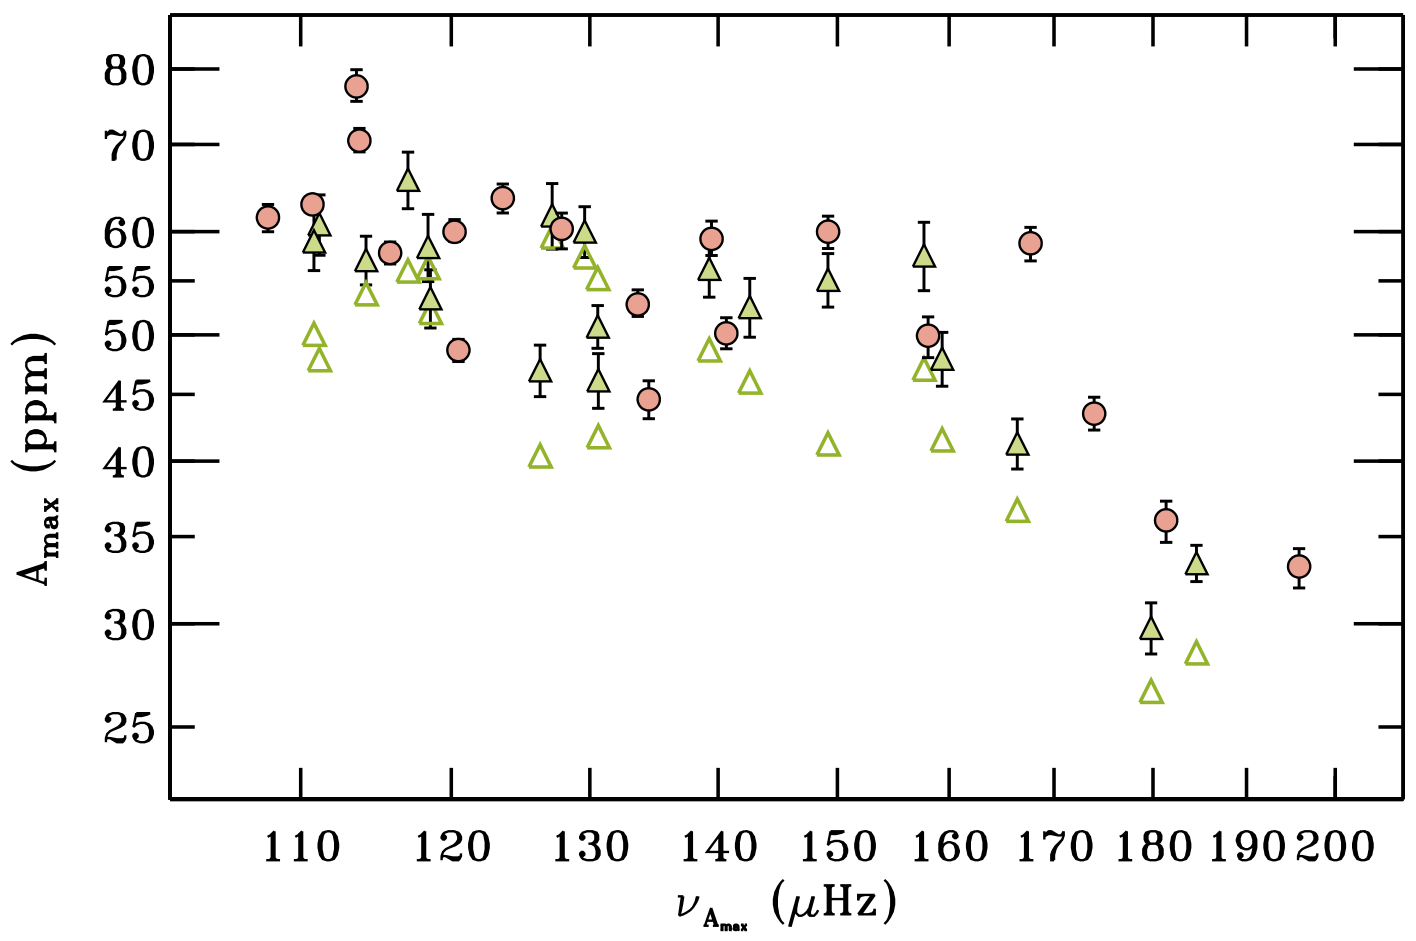
To show how the behavior of the mode amplitude varies from star to star, we plot the maximum radial mode amplitude of each star, here indicated as , against the corresponding radial mode frequency in Fig. 9 (red circles). We note that the amplitude measurements from this work agree on average within 6 % with those listed by Huber et al. (2011), despite the different datasets used and the method adopted, which in the latter case provides maximum amplitudes per radial mode from a global analysis of the power excess of the stellar oscillations (see Huber et al. 2011, and references therein for more details). The values and from this work are all part of the results coming from a detailed peak bagging analysis (see the tables in Appendix B). The amplitude scaling relation used for computing the predictions for the measurements provided by Huber et al. (2011), indicated with open green triangles in Fig. 9, is given by the best model of Corsaro et al. (2013) for the case of LC data. When comparing our measurements with the predictions, we find an agreement on average around 19 %. We point out that the amplitude scaling relation adopted for the comparison is however calibrated on a set of global parameters such as , , and from the power excess, and not on detailed measurements for an individual oscillation mode as those provided in this work.
5 Discussion & conclusions
Starting from the background fitting phase, we find a good agreement ( %) between our estimated parameters of the granulation signal, Eq. (3), and those available from Kallinger et al. (2014), proving that even with an additional year of observation this background signature has remained nearly unchanged for this sample of stars. This shows that we can easily retrieve prior distributions for the background free parameters of the RGs even if new datasets are used. This aspect is helpful for improving our performances in extracting oscillations from a large number of stars since the background fitting is a necessary step in the peak bagging analysis.
As shown by Fig. 6 for KIC 12008916, and in all the other figures in Appendix B for the entire sample of LRGs investigated, every star manifests a clear linewidth depression in the frequency region close to , consistent with the expectations for less evolved stars. This behavior is clear for modes (although the measured linewidths of the quadrupole modes are not the real ones, as stated in Sect. 4.1) and is less pronounced for resolved (or partially resolved) mixed modes, although still evident (see e.g. the polynomial fit shown in red in Fig. 6, top panel), whereas it is questionable for modes because the low number of fit peaks does not fully cover the observed frequency range of the oscillations. The presence of a depression in linewidth for all the stars is also supported by our computation of the normalized fraction of resolved to unresolved mixed modes, , given by Eq. (18). The average normalized fraction given by Eq. (19) instead tells us that even with four years of nearly continuous observations with Kepler, all the red giants in our sample are still dominated by the presence of unresolved mixed modes, except for KIC 12008916 where the unresolved modes basically equal in number those that are instead resolved or partially resolved. This proves that the lifetime of the modes, clearly not lower than that of the most g-dominated mixed modes, is still not measurable. A detailed study involving the new individual linewidth measurements provided here would definitely help to tighten the constraints on the physical relation between the location of the linewidth depression, the cut-off frequency, and in red giants, thus shedding light to our understanding of the damping mechanism of the oscillations, especially in the case of the dipole mixed modes (Grosjean et al. 2014).
Another significant result involving linewidths is their correlation with the stellar effective temperatures. In the comparison given in Fig. 7, we observe a temperature gradient in the linewidths that is steeper for main-sequence and subgiant stars than for RGs, thus flattening toward lower temperatures, as already found by Baudin et al. (2011) and Belkacem et al. (2012). Conversely to the large spread in linewidths found by Baudin et al. (2011) for the RGs observed with CoRoT, our linewidths appear to be much less dispersed, systematically lower, and quite correlated with , despite the small temperature range available, as also highlighted by the polynomial fit, and the corresponding confidence region, to our sample shown in Fig. 7. This is in agreement with the theoretical predictions by Belkacem et al. (2012). We find that the change in the slope of the correlation between linewidths and temperatures from our sample of RGs to that of the main-sequence and subgiant stars observed by Kepler and analyzed by Appourchaux et al. (2012), is more evident in the temperature range around K and could be related to a change in the regime responsible for the mode damping mechanism at the beginning of the RGB. Importantly, the temperature range of the RGs analyzed in this work, 4800-5500 K, covers the gap in observations between red giants and subgiant and main-sequence stars from previous works that were using CoRoT and Kepler data (e.g. Baudin et al. 2011; Belkacem et al. 2012; Corsaro et al. 2012). We therefore consider that the new results presented are important to perform a more realistic modeling of the underlying physics responsible for the observed change in gradient occurring at the bottom of the RGB.
We have noted that our measurements of maximum mode amplitude, available from Appendix B and plotted in Fig. 9, are in a good agreement ( %) with the amplitudes of maximum power derived by Huber et al. (2011) according to the method described by Kjeldsen et al. (2005, 2008). This shows that, at least for the range of investigated in this work, the existing amplitude scaling relations can in principle be used to retrieve raw predictions on maximum amplitudes of individual radial modes. By introducing the optimal amplitude scaling relation derived by Corsaro et al. (2013), we have that the amplitude predictions for our sample of stars agree within 19 %. By exploiting the average amplitude visibilities, , one is able to derive amplitude estimates for the different angular degrees. These tools are very useful for the preparation of prior distributions on mode amplitudes in RGs having Hz, hence they build the base for setting up the peak bagging analysis for a large number of stars. A wider range of will certainly allow to better test these simple relations and eventually obtain and calibrate one or more specific scaling relations for individual mode amplitudes in a similar fashion as investigated by Corsaro et al. (2013). Our physical comprehension and modeling of the stochastic excitation mechanism of the mixed modes in RGs (e.g. see Grosjean et al. 2014) will certainly benefit from individual mode amplitudes and corresponding linewidth measurements of the dipole mixed modes provided in this paper.
In addition, the remarkable precision level obtained on the individual mode frequencies of the modes of all the LRGs, ranging from to Hz, coupled with the large number of modes extracted from each star (spanning from six to nine different radial orders), allow us to constrain the regions of sharp structure variation caused by the He ii zone inside the red giants with an unprecedented level of detail (see Corsaro et al. 2015, for more details). The new frequency measurements derived here will help to improve existing stellar structure models of evolved low-mass stars settling in the RGB phase of the stellar evolution.
Through the peak bagging analysis exploiting the high-quality Kepler data used in this work, we could extract and characterize a total of more than 1600 different oscillation modes. Following the work proposed by CD14, we successfully extended the fitting procedure to the more complex case of the red giant stars, for which a large number of mixed modes is present. As shown by CD14, and now in this work, the Bayesian approach coupled with high-efficiency sampling algorithms, offers a valuable and robust way of inferring asteroseismic parameters from power spectra. This approach allows us to perform the fitting of many oscillation modes, i.e. of several tens of free parameters, in a reasonably short time (of the order of minutes). Besides, the computation of the Bayesian evidence has allowed us to quickly and easily test the peak significance of more than 600 oscillation modes, as also discussed in Sect. 3.3 and Sect. 4.
By adopting the peak bagging model given by Eq. (8), the Diamonds code has performed well for all the computations done. This is in general explained by an easy setting up of the prior distributions for the free parameters of the model, by the absence of degeneracies in the sampling of the parameter space when adopting individual parameters for each mode and with the combination of amplitude-linewidth instead of height-linewidth in the mode profile (see Eq. 5), and by the avoided estimation of the linewidths for the narrowest (namely unresolved) oscillation peaks (see Sect. 3.2). The latter case in particular proves that by using a mixture of two different profiles, hence distinguishing between resolved (or partially resolved) modes, and unresolved ones, considerably improves our performances for the fitting of the oscillations in RGs. The main drawbacks of this approach are related to the requirement of a visual inspection of the region of the PSD of the star containing the oscillations, thus involving the selection of the modes to be fit, the choice of the peak profile to be adopted, and the setting up of the corresponding prior distributions. However, these steps can all be improved and made easier by means of auxiliary tools based on existing asteroseismic scaling relations, as presented in Sect. 3.4. Since the number of mixed modes in RGs is largely dominant over that of modes, and since among the mixed modes most are still unresolved, as seen in nearly all the stars analyzed here with more than four years of observations (Sect. 4.1), we therefore recommend the adoption of a peak bagging model along the same lines as those described in Sect. 3.2 for future fitting of the oscillations in evolved low-mass stars.
The mode identification process, presented in Sect. 3.4, may sometimes be problematic for the case of the dipole mixed modes since having a reliable estimate of the true period spacing is necessary. By starting from the literature values listed in Table 1, we find that a refitting of was required for seven stars out of the 19 analyzed ( % of the sample), meaning that the extraction process for the mixed modes may need an additional search for a proper solution of , always coupled with a visual inspection of the result. Based on the experience gained with the analysis done for the 19 LRGs, we consider the visual inspection for the mode identification of the mixed modes an important and often decisive step, especially for those stars where the confusion limit due to the rotational splitting is present (KIC 8475025, KIC 9267654, KIC 11353313) and for those with variations in with the radial order (KIC 6144777 and KIC 12008916). This aspect clearly represents a limitation to the full automatization of the peak bagging analysis in red giant stars, but it might be improved in the future by analyzing and comparing the results arising from a larger variety of targets, especially those having higher rotation rates. We however stress that, provided that the used values of are accurate enough, the asymptotic relation for the mixed modes works remarkably well at reproducing their frequencies for all the peaks identified in our analysis. This is in agreement with the recent theoretical study by Jiang & Christensen-Dalsgaard (2014), who investigated the asymptotic regime of the mixed modes and confirmed the reliability of their asymptotic relation.
Last but not least, the firm detection of rotation in 14 stars of the sample will greatly help to constrain the physical mechanisms responsible for the angular momentum transport in RGs (e.g. Tayar & Pinsonneault 2013, and references therein). In particular, by reconstructing the rotational profile of the star up to the core level by using the mixed modes with different mixture content between and modes, provided in this work, it will be possible to investigate the evolution of the angular momentum transport inside the star starting from the main-sequence phase of the stellar evolution. Thanks to the variety of masses of the stars in our sample, spanning the range - (Table 1), the models involving the decoupling of the convective and radiative zones in low-mass RGs, expected after the first dredge up (Tayar & Pinsonneault 2013), can be intensively tested and refined.
To conclude, the full set of results presented in Sect. 4 and discussed in Sect. 5, representing the largest set of detailed asteroseismic mode measurements ever made available, with the high-precision and accuracy level achieved from four-years datasets, offers a great opportunity to perform thorough investigations and testing of the existing stellar models and stellar evolution theory, asteroseismic scaling relations, and of the underlying physics of both the damping and the excitation mechanisms of solar-like and mixed mode oscillations in red giant stars. Future works following the approach presented here to extend the peak bagging analysis to larger samples of red giants observed by Kepler, will definitely bring an outstanding improvement to our understanding level on the stellar physics of low-mass stars.
Acknowledgements.
E.C. is funded by the European Community’s Seventh Framework Programme (FP7/2007-2013) under grant agreement n∘312844 (SPACEINN). The research leading to these results has received funding from the European Research Council under the European Community’s Seventh Framework Programme (FP7/2007–2013) ERC grant agreement n∘227224 (PROSPERITY), from the Fund for Scientific Research of Flanders (G.0728.11), and from the Belgian federal science policy office (C90291 Gaia-DPAC). E.C. thanks F. Baudin, P. Beck, G. Davies, T. Kallinger and A. Miglio for useful discussions.References
- Anderson et al. (1990) Anderson, E. R., Duvall, Jr., T. L., & Jefferies, S. M. 1990, ApJ, 364, 699
- Appourchaux (2003) Appourchaux, T. 2003, Ap&SS, 284, 109
- Appourchaux et al. (2014) Appourchaux, T., Antia, H. M., Benomar, O., et al. 2014, arXiv:1403.7046 [astro-ph.SR] (A14)
- Appourchaux et al. (2012) Appourchaux, T., Benomar, O., Gruberbauer, M., et al. 2012, A&A, 537, A134
- Ballot et al. (2011a) Ballot, J., Barban, C., & van’t Veer-Menneret, C. 2011a, A&A, 531, A124
- Ballot et al. (2011b) Ballot, J., Gizon, L., Samadi, R., et al. 2011b, A&A, 530, A97
- Barban et al. (2009) Barban, C., Deheuvels, S., Baudin, F., et al. 2009, A&A, 506, 51
- Baudin et al. (2011) Baudin, F., Barban, C., Belkacem, K., et al. 2011, A&A, 529, A84
- Baudin et al. (2005) Baudin, F., Samadi, R., Goupil, M.-J., et al. 2005, A&A, 433, 349
- Beck et al. (2011) Beck, P. G., Bedding, T. R., Mosser, B., et al. 2011, Science, 332, 205
- Beck et al. (2014) Beck, P. G., Hambleton, K., Vos, J., et al. 2014, A&A, 564, A36
- Beck et al. (2012) Beck, P. G., Montalban, J., Kallinger, T., et al. 2012, Nature, 481, 55
- Bedding et al. (2010) Bedding, T. R., Huber, D., Stello, D., et al. 2010, ApJ, 713, L176
- Bedding et al. (2011) Bedding, T. R., Mosser, B., Huber, D., et al. 2011, Nature, 471, 608
- Belkacem et al. (2012) Belkacem, K., Dupret, M. A., Baudin, F., et al. 2012, A&A, 540, L7
- Belkacem et al. (2011) Belkacem, K., Goupil, M. J., Dupret, M. A., et al. 2011, A&A, 530, A142
- Benomar et al. (2009a) Benomar, O., Appourchaux, T., & Baudin, F. 2009a, A&A, 506, 15
- Benomar et al. (2009b) Benomar, O., Baudin, F., Campante, T. L., et al. 2009b, A&A, 507, L13
- Benomar et al. (2013) Benomar, O., Bedding, T. R., Mosser, B., et al. 2013, ApJ, 767, 158
- Benomar et al. (2014) Benomar, O., Belkacem, K., Bedding, T. R., et al. 2014, ApJ, 781, L29
- Borucki et al. (2010) Borucki, W. J., Koch, D., Basri, G., et al. 2010, Science, 327, 977
- Broomhall et al. (2014) Broomhall, A.-M., Miglio, A., Montalbán, J., et al. 2014, MNRAS, 440, 1828
- Chaplin et al. (2009) Chaplin, W. J., Houdek, G., Karoff, C., Elsworth, Y., & New, R. 2009, A&A, 500, L21
- Christensen-Dalsgaard (2004) Christensen-Dalsgaard, J. 2004, Sol. Phys., 220, 137
- Corsaro & De Ridder (2014) Corsaro, E. & De Ridder, J. 2014, A&A, 571, A71 (CD14)
- Corsaro et al. (2015) Corsaro, E., De Ridder, J., & García, R. A. 2015, (submitted)
- Corsaro et al. (2013) Corsaro, E., Fröhlich, H.-E., Bonanno, A., et al. 2013, MNRAS, 430, 2313
- Corsaro et al. (2012) Corsaro, E., Stello, D., Huber, D., et al. 2012, ApJ, 757, 190
- De Ridder et al. (2006) De Ridder, J., Arentoft, T., & Kjeldsen, H. 2006, MNRAS, 365, 595
- De Ridder et al. (2009) De Ridder, J., Barban, C., Baudin, F., et al. 2009, Nature, 459, 398
- Deheuvels et al. (2010) Deheuvels, S., Bruntt, H., Michel, E., et al. 2010, A&A, 515, A87
- Deheuvels et al. (2014) Deheuvels, S., Doğan, G., Goupil, M. J., et al. 2014, A&A, 564, A27
- Deheuvels et al. (2012) Deheuvels, S., García, R. A., Chaplin, W. J., et al. 2012, ApJ, 756, 19
- Fröhlich et al. (2012) Fröhlich, H.-E., Frasca, A., Catanzaro, G., et al. 2012, A&A, 543, A146
- García et al. (2011) García, R. A., Hekker, S., Stello, D., et al. 2011, MNRAS, 414, L6
- García et al. (2014) García, R. A., Mathur, S., Pires, S., et al. 2014, A&A, 568, A10
- Grosjean et al. (2014) Grosjean, M., Dupret, M.-A., Belkacem, K., et al. 2014, A&A, 572, A11
- Gruberbauer et al. (2009) Gruberbauer, M., Kallinger, T., Weiss, W. W., & Guenther, D. B. 2009, A&A, 506, 1043
- Handberg & Campante (2011) Handberg, R. & Campante, T. L. 2011, A&A, 527, A56
- Hekker et al. (2010) Hekker, S., Barban, C., Baudin, F., et al. 2010, A&A, 520, A60
- Huber et al. (2011) Huber, D., Bedding, T. R., Stello, D., et al. 2011, ApJ, 743, 143
- Huber et al. (2010) Huber, D., Bedding, T. R., Stello, D., et al. 2010, ApJ, 723, 1607
- Jeffreys (1961) Jeffreys, H. 1961, Theory of Probability (3rd Ed. OUP Oxford)
- Jenkins et al. (2010) Jenkins, J. M., Caldwell, D. A., Chandrasekaran, H., et al. 2010, ApJ, 713, L120
- Jiang & Christensen-Dalsgaard (2014) Jiang, C. & Christensen-Dalsgaard, J. 2014, MNRAS, 444, 3622
- Kallinger et al. (2014) Kallinger, T., De Ridder, J., Hekker, S., et al. 2014, A&A, 570, A41
- Kallinger et al. (2012) Kallinger, T., Hekker, S., Mosser, B., et al. 2012, A&A, 541, A51
- Kallinger et al. (2010a) Kallinger, T., Mosser, B., Hekker, S., et al. 2010a, A&A, 522, A1
- Kallinger et al. (2010b) Kallinger, T., Weiss, W. W., Barban, C., et al. 2010b, A&A, 509, A77
- Karoff et al. (2013) Karoff, C., Campante, T. L., Ballot, J., et al. 2013, ApJ, 767, 34
- Kjeldsen et al. (2008) Kjeldsen, H., Bedding, T. R., Arentoft, T., et al. 2008, ApJ, 682, 1370
- Kjeldsen et al. (2005) Kjeldsen, H., Bedding, T. R., Butler, R. P., et al. 2005, ApJ, 635, 1281
- Koch et al. (2010) Koch, D. G., Borucki, W. J., Basri, G., et al. 2010, ApJ, 713, L79
- Kumar et al. (1988) Kumar, P., Franklin, J., & Goldreich, P. 1988, ApJ, 328, 879
- Mathur et al. (2010) Mathur, S., García, R. A., Catala, C., et al. 2010, A&A, 518, A53
- Miglio et al. (2012) Miglio, A., Brogaard, K., Stello, D., et al. 2012, MNRAS, 419, 2077
- Miglio et al. (2013) Miglio, A., Chiappini, C., Morel, T., et al. 2013, MNRAS, 429, 423
- Miglio et al. (2015) Miglio, A., Girardi, L., Rodrigues, T. S., Stello, D., & Chaplin, W. J. 2015, Astrophysics and Space Science Proceedings, 39, 11
- Miglio et al. (2009) Miglio, A., Montalbán, J., Baudin, F., et al. 2009, A&A, 503, L21
- Miglio et al. (2010) Miglio, A., Montalbán, J., Carrier, F., et al. 2010, A&A, 520, L6
- Mosser et al. (2011a) Mosser, B., Barban, C., Montalbán, J., et al. 2011a, A&A, 532, A86
- Mosser et al. (2011b) Mosser, B., Belkacem, K., Goupil, M. J., et al. 2011b, A&A, 525, L9
- Mosser et al. (2014) Mosser, B., Benomar, O., Belkacem, K., et al. 2014, A&A, 572, L5
- Mosser et al. (2012a) Mosser, B., Goupil, M. J., Belkacem, K., et al. 2012a, A&A, 548, A10
- Mosser et al. (2012b) Mosser, B., Goupil, M. J., Belkacem, K., et al. 2012b, A&A, 540, A143
- Mosser et al. (2012c) Mosser, B., Goupil, M. J., Belkacem, K., et al. 2012c, VizieR Online Data Catalog, 354, 9143
- Pinsonneault et al. (2012) Pinsonneault, M. H., An, D., Molenda-Żakowicz, J., et al. 2012, ApJS, 199, 30
- Pires et al. (2014) Pires, S., Mathur, S., Garcia, R. A., et al. 2014, arXiv:1410.6088 [astro-ph.SR]
- Stello et al. (2013) Stello, D., Huber, D., Bedding, T. R., et al. 2013, ApJ, 765, L41
- Stello et al. (2011) Stello, D., Meibom, S., Gilliland, R. L., et al. 2011, ApJ, 739, 13
- Tassoul (1980) Tassoul, M. 1980, ApJS, 43, 469
- Tayar & Pinsonneault (2013) Tayar, J. & Pinsonneault, M. H. 2013, ApJ, 775, L1
- Thompson et al. (2013) Thompson, S. E., Christiansen, J. L., Jenkins, J. M., et al. 2013, Kepler Data Release 21 Notes (KSCI-19061-001), Kepler mission
- Vandakurov (1968) Vandakurov, Y. V. 1968, Sov. Ast., 11, 630
- Vrard et al. (2014) Vrard, M., Mosser, B., & Barban, C. 2014, in SF2A-2014: Proceedings of the Annual meeting of the French Society of Astronomy and Astrophysics, ed. J. Ballet, F. Martins, F. Bournaud, R. Monier, & C. Reylé, 531–534
Appendix A Results for the background fitting
The parameter values derived by means of Diamonds for the entire sample of 19 LRGs analyzed in this work are listed in Table 2 for the Harvey-like profiles , Eq. (3), and in Table 3 for the Gaussian envelope , Eq. (4). The background fits are shown in Fig. 10 for all the stars except KIC 12008916, which is instead shown in Fig. 2.
Referring to the definitions presented by CD14, the configuring parameters of Diamonds used for all the computations are: initial enlargement fraction , shrinking rate , number of live points , number of clusters , number of total drawing attempts , number of nested iterations before the first clustering , and number of nested iterations with the same clustering .
| KIC ID | |||||||
|---|---|---|---|---|---|---|---|
| (ppm2 Hz-1) | (ppm) | (Hz) | (ppm) | (Hz) | (ppm) | (Hz) | |
| 03744043 | |||||||
| 06117517 | |||||||
| 06144777 | |||||||
| 07060732 | |||||||
| 07619745 | |||||||
| 08366239 | |||||||
| 08475025 | |||||||
| 08718745 | |||||||
| 09145955 | |||||||
| 09267654 | |||||||
| 09475697 | |||||||
| 09882316 | |||||||
| 10123207 | |||||||
| 10200377 | |||||||
| 10257278 | |||||||
| 11353313 | |||||||
| 11913545 | |||||||
| 11968334 | |||||||
| 12008916 |
| KIC ID | |||
|---|---|---|---|
| (ppm2 Hz-1) | (Hz) | (Hz) | |
| 03744043 | |||
| 06117517 | |||
| 06144777 | |||
| 07060732 | |||
| 07619745 | |||
| 08366239 | |||
| 08475025 | |||
| 08718745 | |||
| 09145955 | |||
| 09267654 | |||
| 09475697 | |||
| 09882316 | |||
| 10123207 | |||
| 10200377 | |||
| 10257278 | |||
| 11353313 | |||
| 11913545 | |||
| 11968334 | |||
| 12008916 |
Appendix B Results for the oscillation modes
For listing the results from the peak bagging analysis we adopt a nomenclature similar to that used by CD14 and list the oscillation modes in ascending frequency order, divided by angular degree. Each mode can be identified uniquely by the set of numbers (Peak #, , ). An example of this nomenclature for KIC 12008916 is displayed in Fig. 5. The missing values for amplitudes and linewidths correspond to the cases of unresolved mixed modes, were only the heights are fit. The missing values for the detection probability represent peaks for which the significance test was not necessary due to their large height and the clear position with respect to the asymptotic relations for and mixed modes (Sect. 3.4).
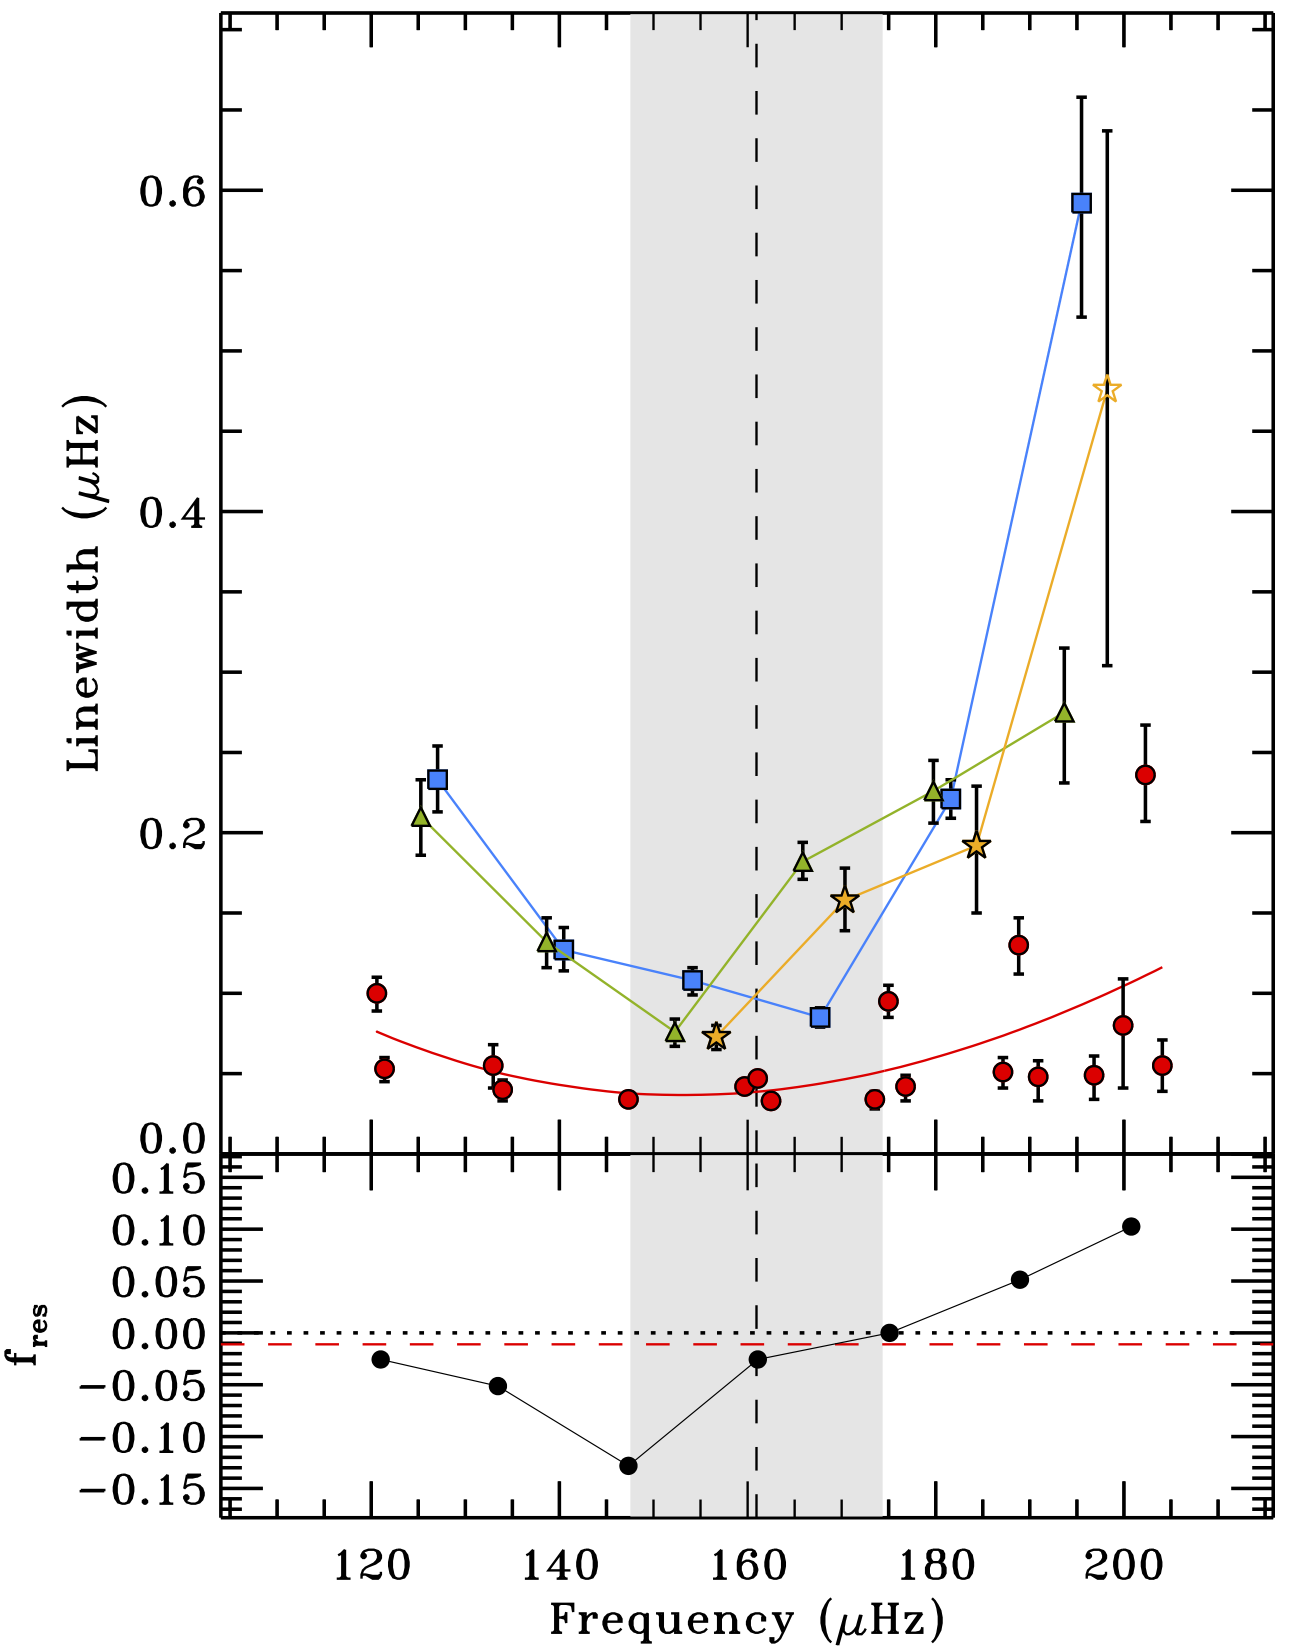
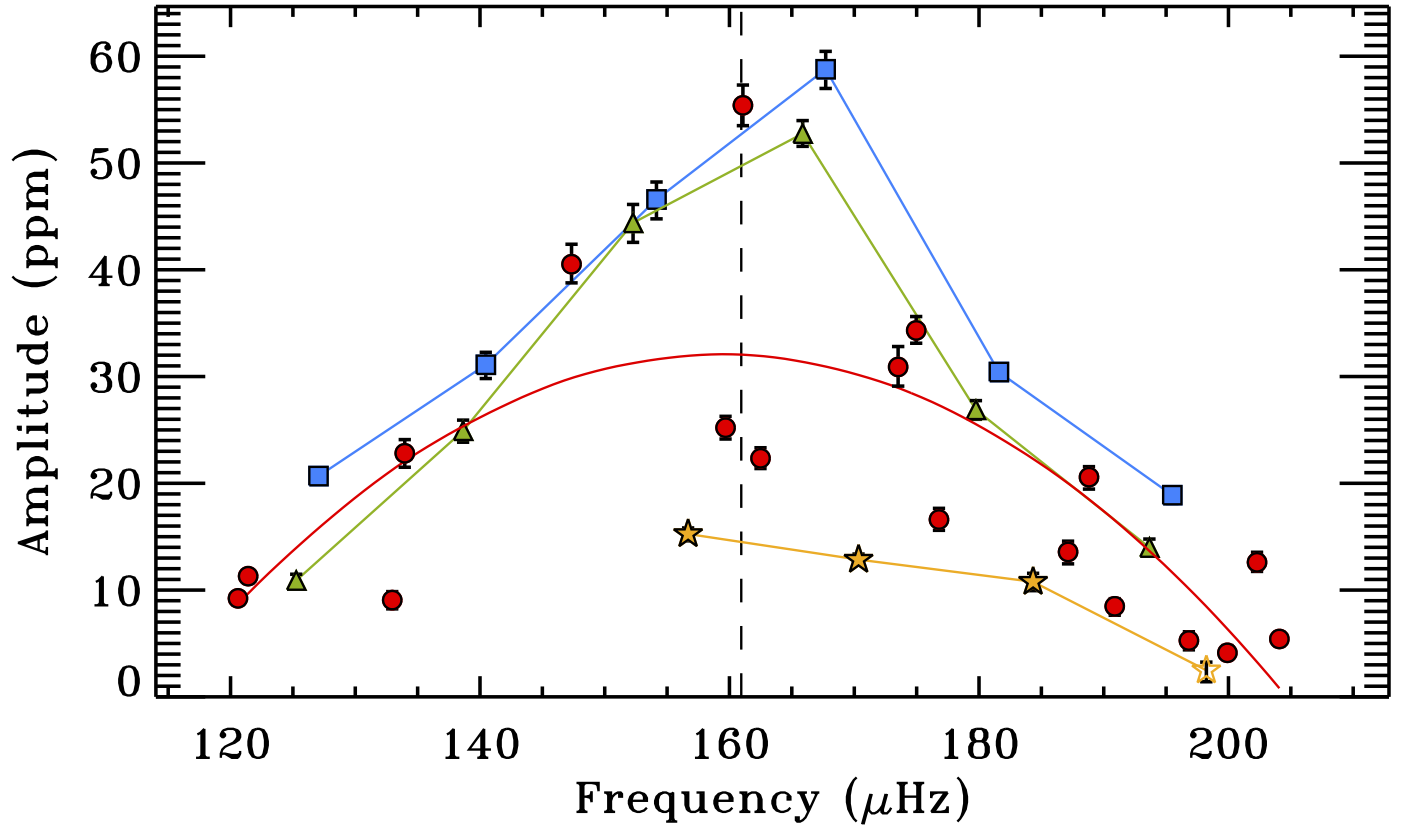
This appendix also includes the figures for mode linewidths and mode amplitudes, for all the stars of the sample, similarly to Fig. 6 and Fig. 8, respectively, shown for KIC 12008916.
Referring to the definitions presented by CD14, the configuring parameters of Diamonds used for all the computations are: initial enlargement fraction , shrinking rate , number of live points , number of clusters , number of total drawing attempts , number of nested iterations before the first clustering , and number of nested iterations with the same clustering .
| Peak # | Frequency | Amplitude | Linewidth | Height | |||
| (Hz) | (ppm) | (Hz) | (ppmHz) | ||||
| 0 | 1 | 0 | … | 0.999 | |||
| 1 | 1 | 0 | … | … | 0.901 | ||
| 2 | 1 | 0 | … | … | … | ||
| 3 | 1 | 0 | … | 0.984 | |||
| 4 | 1 | 0 | … | … | |||
| 5 | 1 | 0 | … | … | |||
| 6 | 1 | 0 | … | … | … | ||
| 7 | 1 | 0 | … | … | 1.000 | ||
| 8 | 1 | 0 | … | … | … | ||
| 9 | 1 | 0 | … | … | … | ||
| 10 | 1 | 0 | … | … | … | ||
| 11 | 1 | 0 | … | … | … | ||
| 12 | 1 | … | … | 0.956 | |||
| 13 | 1 | 0 | … | … | |||
| 14 | 1 | … | … | … | |||
| 15 | 1 | 0 | … | … | … | ||
| 16 | 1 | … | 0.160 | ||||
| 17 | 1 | 0 | … | … | |||
| 18 | 1 | … | … | … | |||
| 19 | 1 | … | … | 1.000 | |||
| 20 | 1 | 0 | … | … | … | ||
| 21 | 1 | 0 | … | … | 1.000 | ||
| 22 | 1 | … | … | 0.902 | |||
| 23 | 1 | 0 | … | … | 1.000 | ||
| 24 | 1 | … | … | 0.999 | |||
| 25 | 1 | 0 | … | … | … | ||
| 26 | 1 | … | … | 0.993 | |||
| 27 | 1 | 0 | … | … | 0.974 | ||
| 28 | 1 | … | … | 0.993 | |||
| 29 | 1 | … | … | … | |||
| 30 | 1 | 0 | … | … | … | ||
| 31 | 1 | … | … | … | |||
| 32 | 1 | … | … | … | |||
| 33 | 1 | 0 | … | … | … | ||
| 34 | 1 | … | … | … | |||
| 35 | 1 | … | … | … | |||
| 36 | 1 | 0 | … | … | … | ||
| 37 | 1 | … | … | … | |||
| 38 | 1 | … | … | … | |||
| 39 | 1 | 0 | … | … | … | ||
| 40 | 1 | 0 | … | … | … | ||
| 41 | 1 | 0 | … | … | … | ||
| 42 | 1 | 0 | … | … | 1.000 | ||
| 43 | 1 | … | … | 0.997 | |||
| 44 | 1 | 0 | … | … | … | ||
| 45 | 1 | 0 | … | … | … | ||
| 46 | 1 | … | … | 1.000 | |||
| 47 | 1 | 0 | … | … | … | ||
| 48 | 1 | … | 0.983 | ||||
| 49 | 1 | … | … | … | |||
| 50 | 1 | 0 | … | … |
| Peak # | Frequency | Amplitude | Linewidth | Height | |||
| (Hz) | (ppm) | (Hz) | (ppmHz) | ||||
| 51 | 1 | … | … | ||||
| 52 | 1 | … | … | ||||
| 53 | 1 | 0 | … | … | … | ||
| 54 | 1 | … | 0.159 | ||||
| 55 | 1 | … | … | … | |||
| 56 | 1 | 0 | … | … | … | ||
| 57 | 1 | … | … | … | |||
| 58 | 1 | … | … | 0.988 | |||
| 59 | 1 | 0 | … | … | … | ||
| 60 | 1 | … | … | 0.999 | |||
| 61 | 1 | 0 | … | … | … | ||
| 62 | 1 | 0 | … | … | 0.998 | ||
| 63 | 1 | 0 | … | … | … | ||
| 64 | 1 | 0 | … | … | 0.985 | ||
| 65 | 1 | … | … | … | |||
| 66 | 1 | 0 | … | … | … | ||
| 67 | 1 | … | … | … | |||
| 68 | 1 | 0 | … | … | |||
| 69 | 1 | 0 | … | … | |||
| 70 | 1 | … | 0.999 | ||||
| 71 | 1 | … | … | 0.987 | |||
| 72 | 1 | 0 | … | 1.000 | |||
| 73 | 1 | … | … | 1.000 | |||
| 74 | 1 | 0 | … | … | … | ||
| 75 | 1 | 0 | … | … | 0.999 | ||
| 76 | 1 | … | 1.000 | ||||
| 77 | 1 | 0 | … | … | … | ||
| 78 | 1 | … | 0.991 | ||||
| 79 | 1 | 0 | … | … | |||
| 80 | 1 | … | 0.003 | ||||
| 81 | 1 | 0 | … | … | |||
| 82 | 1 | 0 | … | … | 0.999 | ||
| 83 | 1 | 0 | … | 1.000 | |||
| 84 | 1 | 0 | … | 1.000 |
| Peak # | Frequency | Amplitude | Linewidth | Height | |||
| (Hz) | (ppm) | (Hz) | (ppmHz) | ||||
| 0 | 0 | 0 | … | 1.000 | |||
| 1 | 0 | 0 | … | … | |||
| 2 | 0 | 0 | … | … | |||
| 3 | 0 | 0 | … | … | |||
| 4 | 0 | 0 | … | … | |||
| 5 | 0 | 0 | … | … | |||
| 6 | 0 | 0 | … | … | |||
| 0 | 2 | 0 | … | 0.991 | |||
| 1 | 2 | 0 | … | … | |||
| 2 | 2 | 0 | … | … | |||
| 3 | 2 | 0 | … | … | |||
| 4 | 2 | 0 | … | … | |||
| 5 | 2 | 0 | … | … | |||
| 6 | 2 | 0 | … | … | |||
| 0 | 3 | 0 | … | 1.000 | |||
| 1 | 3 | 0 | … | … | |||
| 2 | 3 | 0 | … | … | |||
| 3 | 3 | 0 | … | 1.000 |
| Peak # | Frequency | Amplitude | Linewidth | Height | |||
| (Hz) | (ppm) | (Hz) | (ppmHz) | ||||
| 0 | 1 | 0 | … | … | … | ||
| 1 | 1 | 0 | … | … | |||
| 2 | 1 | 0 | … | … | |||
| 3 | 1 | 0 | … | … | … | ||
| 4 | 1 | 0 | … | … | 0.824 | ||
| 5 | 1 | 0 | … | … | 0.967 | ||
| 6 | 1 | 0 | … | … | … | ||
| 7 | 1 | 0 | … | … | 0.939 | ||
| 8 | 1 | 0 | … | … | … | ||
| 9 | 1 | 0 | … | … | |||
| 10 | 1 | 0 | … | … | … | ||
| 11 | 1 | 0 | … | … | … | ||
| 12 | 1 | 0 | … | … | 0.957 | ||
| 13 | 1 | 0 | … | … | 0.966 | ||
| 14 | 1 | 0 | … | … | … | ||
| 15 | 1 | 0 | … | … | … | ||
| 16 | 1 | 0 | … | … | |||
| 17 | 1 | 0 | … | … | |||
| 18 | 1 | 0 | … | … | … | ||
| 19 | 1 | 0 | … | … | 0.997 | ||
| 20 | 1 | 0 | … | … | 0.926 | ||
| 21 | 1 | 0 | … | … | … | ||
| 22 | 1 | … | … | 0.999 | |||
| 23 | 1 | 0 | … | … | … | ||
| 24 | 1 | 0 | … | … | … | ||
| 25 | 1 | 0 | … | … | … | ||
| 26 | 1 | … | 0.353 | ||||
| 27 | 1 | 0 | … | … | |||
| 28 | 1 | … | 1.000 | ||||
| 29 | 1 | 0 | … | … | |||
| 30 | 1 | … | 0.029 | ||||
| 31 | 1 | 0 | … | … | … | ||
| 32 | 1 | 0 | … | … | 1.000 | ||
| 33 | 1 | 0 | … | … | … | ||
| 34 | 1 | 0 | … | … | 1.000 | ||
| 35 | 1 | 0 | … | … | … | ||
| 36 | 1 | 0 | … | … | … | ||
| 37 | 1 | 0 | … | … | … | ||
| 38 | 1 | … | … | 0.986 | |||
| 39 | 1 | 0 | … | … | |||
| 40 | 1 | 0 | … | … | |||
| 41 | 1 | 0 | … | … | … | ||
| 42 | 1 | 0 | … | … | … | ||
| 43 | 1 | 0 | … | … | |||
| 44 | 1 | 0 | … | … | |||
| 45 | 1 | 0 | … | … | |||
| 46 | 1 | 0 | … | … | … | ||
| 47 | 1 | 0 | … | … | … | ||
| 48 | 1 | 0 | … | 1.000 | |||
| 49 | 1 | 0 | … | 1.000 | |||
| 50 | 1 | 0 | … | 1.000 | |||
| 51 | 1 | 0 | … | 1.000 | |||
| 52 | 1 | 0 | … | 1.000 |
| Peak # | Frequency | Amplitude | Linewidth | Height | |||
| (Hz) | (ppm) | (Hz) | (ppmHz) | ||||
| 0 | 0 | 0 | … | 1.000 | |||
| 1 | 0 | 0 | … | … | |||
| 2 | 0 | 0 | … | … | |||
| 3 | 0 | 0 | … | … | |||
| 4 | 0 | 0 | … | … | |||
| 5 | 0 | 0 | … | … | |||
| 6 | 0 | 0 | … | … | |||
| 7 | 0 | 0 | … | 1.000 | |||
| 0 | 2 | 0 | … | 0.914 | |||
| 1 | 2 | 0 | … | … | |||
| 2 | 2 | 0 | … | … | |||
| 3 | 2 | 0 | … | … | |||
| 4 | 2 | 0 | … | … | |||
| 5 | 2 | 0 | … | … | |||
| 6 | 2 | 0 | … | … | |||
| 7 | 2 | 0 | … | 1.000 | |||
| 8 | 2 | 0 | … | 1.000 | |||
| 0 | 3 | 0 | … | 1.000 | |||
| 1 | 3 | 0 | … | … | |||
| 2 | 3 | 0 | … | … | |||
| 3 | 3 | 0 | … | … |
| Peak # | Frequency | Amplitude | Linewidth | Height | |||
| (Hz) | (ppm) | (Hz) | (ppmHz) | ||||
| 0 | 1 | ? | … | 0.773 | |||
| 1 | 1 | ? | … | 0.988 | |||
| 2 | 1 | ? | … | … | 0.980 | ||
| 3 | 1 | ? | … | … | … | ||
| 4 | 1 | ? | … | 0.968 | |||
| 5 | 1 | ? | … | 1.000 | |||
| 6 | 1 | ? | … | 0.998 | |||
| 7 | 1 | ? | … | … | … | ||
| 8 | 1 | ? | … | … | … | ||
| 9 | 1 | 0 | … | … | 0.883 | ||
| 10 | 1 | 0 | … | … | 0.901 | ||
| 11 | 1 | 0 | … | … | 0.524 | ||
| 12 | 1 | 0 | … | … | 0.711 | ||
| 13 | 1 | … | … | 0.971 | |||
| 14 | 1 | … | … | 0.709 | |||
| 15 | 1 | 0 | … | … | 0.742 | ||
| 16 | 1 | … | … | … | |||
| 17 | 1 | … | 1.000 | ||||
| 18 | 1 | 0 | … | … | … | ||
| 19 | 1 | … | … | ||||
| 20 | 1 | … | … | ||||
| 21 | 1 | … | 1.000 | ||||
| 22 | 1 | … | 0.986 | ||||
| 23 | 1 | 0 | … | … | 0.993 | ||
| 24 | 1 | … | … | 0.785 | |||
| 25 | 1 | … | … | … | |||
| 26 | 1 | 0 | … | … | 0.865 | ||
| 27 | 1 | … | … | 0.556 | |||
| 28 | 1 | 0 | … | … | … | ||
| 29 | 1 | … | … | 0.845 | |||
| 30 | 1 | … | … | 0.999 | |||
| 31 | 1 | 0 | … | … | 0.969 | ||
| 32 | 1 | … | … | … | |||
| 33 | 1 | 0 | … | … | 0.999 | ||
| 34 | 1 | … | … | … | |||
| 35 | 1 | … | … | 0.996 | |||
| 36 | 1 | 0 | … | … | 0.903 | ||
| 37 | 1 | … | … | … | |||
| 38 | 1 | … | 0.999 | ||||
| 39 | 1 | 0 | … | … | |||
| 40 | 1 | … | … | ||||
| 41 | 1 | … | … | ||||
| 42 | 1 | 0 | … | … | … | ||
| 43 | 1 | … | … | … | |||
| 44 | 1 | … | … | 1.000 | |||
| 45 | 1 | 0 | … | … | … | ||
| 46 | 1 | … | … | … | |||
| 47 | 1 | … | … | … | |||
| 48 | 1 | … | … | … | |||
| 49 | 1 | 0 | … | … | 0.994 | ||
| 50 | 1 | … | … | … |
| Peak # | Frequency | Amplitude | Linewidth | Height | |||
| (Hz) | (ppm) | (Hz) | (ppmHz) | ||||
| 51 | 1 | 0 | … | … | 0.999 | ||
| 52 | 1 | … | … | … | |||
| 53 | 1 | 0 | … | … | … | ||
| 54 | 1 | … | … | … | |||
| 55 | 1 | … | … | … | |||
| 56 | 1 | 0 | … | … | 1.000 | ||
| 57 | 1 | … | … | … | |||
| 58 | 1 | … | … | … | |||
| 59 | 1 | 0 | … | … | |||
| 60 | 1 | … | … | ||||
| 61 | 1 | … | … | ||||
| 62 | 1 | 0 | … | … | … | ||
| 63 | 1 | … | … | … | |||
| 64 | 1 | … | … | … | |||
| 65 | 1 | 0 | … | … | … | ||
| 66 | 1 | … | … | … | |||
| 67 | 1 | … | … | 1.000 | |||
| 68 | 1 | … | … | … | |||
| 69 | 1 | … | … | … | |||
| 70 | 1 | 0 | … | … | 1.000 | ||
| 71 | 1 | … | … | … | |||
| 72 | 1 | … | … | … | |||
| 73 | 1 | 0 | … | … | |||
| 74 | 1 | … | … | ||||
| 75 | 1 | … | … | ||||
| 76 | 1 | … | … | ||||
| 77 | 1 | … | … | ||||
| 78 | 1 | 0 | … | … | |||
| 79 | 1 | … | … | ||||
| 80 | 1 | … | … | 0.932 | |||
| 81 | 1 | 0 | … | … | … | ||
| 82 | 1 | … | … | … | |||
| 83 | 1 | … | … | 0.693 | |||
| 84 | 1 | 0 | … | … | 0.509 | ||
| 85 | 1 | … | … | 0.339 | |||
| 86 | 1 | … | … | … | |||
| 87 | 1 | 0 | … | … | … | ||
| 88 | 1 | … | … | 0.996 | |||
| 89 | 1 | … | 1.000 | ||||
| 90 | 1 | 0 | … | … | … | ||
| 91 | 1 | … | … | ||||
| 92 | 1 | 0 | … | … | |||
| 93 | 1 | … | … | 0.998 | |||
| 94 | 1 | 0 | … | … | … | ||
| 95 | 1 | … | … | … | |||
| 96 | 1 | ? | … | … | 0.902 | ||
| 97 | 1 | ? | … | … | |||
| 98 | 1 | ? | … | … | |||
| 99 | 1 | ? | … | 1.000 |
| Peak # | Frequency | Amplitude | Linewidth | Height | |||
| (Hz) | (ppm) | (Hz) | (ppmHz) | ||||
| 0 | 0 | 0 | … | … | |||
| 1 | 0 | 0 | … | … | |||
| 2 | 0 | 0 | … | … | |||
| 3 | 0 | 0 | … | … | |||
| 4 | 0 | 0 | … | … | |||
| 5 | 0 | 0 | … | … | |||
| 6 | 0 | 0 | … | … | |||
| 7 | 0 | 0 | … | 1.000 | |||
| 0 | 2 | 0 | … | 0.994 | |||
| 1 | 2 | 0 | … | … | |||
| 2 | 2 | 0 | … | … | |||
| 3 | 2 | 0 | … | … | |||
| 4 | 2 | 0 | … | … | |||
| 5 | 2 | 0 | … | … | |||
| 6 | 2 | 0 | … | … | |||
| 7 | 2 | 0 | … | 1.000 | |||
| 0 | 3 | 0 | … | 0.699 | |||
| 1 | 3 | 0 | … | … | |||
| 2 | 3 | 0 | … | … | |||
| 3 | 3 | 0 | … | 1.000 | |||
| 4 | 3 | 0 | … | 0.855 |
| Peak # | Frequency | Amplitude | Linewidth | Height | |||
| (Hz) | (ppm) | (Hz) | (ppmHz) | ||||
| 0 | 1 | ? | … | … | 0.978 | ||
| 1 | 1 | ? | … | … | 0.939 | ||
| 2 | 1 | ? | … | … | 0.996 | ||
| 3 | 1 | ? | … | 1.000 | |||
| 4 | 1 | ? | … | … | 0.971 | ||
| 5 | 1 | ? | … | … | 0.995 | ||
| 6 | 1 | ? | … | … | 0.976 | ||
| 7 | 1 | ? | … | … | 0.904 | ||
| 8 | 1 | ? | … | … | 0.914 | ||
| 9 | 1 | ? | … | … | 0.936 | ||
| 10 | 1 | ? | … | … | 0.983 | ||
| 11 | 1 | ? | … | … | 0.999 | ||
| 12 | 1 | ? | … | … | 0.861 | ||
| 13 | 1 | ? | … | … | 0.786 | ||
| 14 | 1 | ? | … | 0.775 | |||
| 15 | 1 | ? | … | … | |||
| 16 | 1 | ? | … | … | 0.868 | ||
| 17 | 1 | ? | … | … | 0.891 | ||
| 18 | 1 | ? | … | … | |||
| 19 | 1 | ? | … | 0.998 | |||
| 20 | 1 | ? | … | … | 0.834 | ||
| 21 | 1 | ? | … | … | |||
| 22 | 1 | ? | … | … | 0.962 | ||
| 23 | 1 | ? | … | … | 0.962 | ||
| 24 | 1 | ? | … | … | 0.802 | ||
| 25 | 1 | ? | … | … | 0.852 | ||
| 26 | 1 | … | … | … | |||
| 27 | 1 | 0 | … | … | 0.621 | ||
| 28 | 1 | … | … | … | |||
| 29 | 1 | … | … | 0.662 | |||
| 30 | 1 | 0 | … | … | 0.998 | ||
| 31 | 1 | … | … | 0.999 | |||
| 32 | 1 | … | … | … | |||
| 33 | 1 | 0 | … | 0.974 | |||
| 34 | 1 | … | … | ||||
| 35 | 1 | … | … | ||||
| 36 | 1 | 0 | … | 0.998 | |||
| 37 | 1 | … | … | ||||
| 38 | 1 | … | … | … | |||
| 39 | 1 | 0 | … | … | … | ||
| 40 | 1 | … | … | … | |||
| 41 | 1 | … | … | 0.991 | |||
| 42 | 1 | 0 | … | … | 0.996 | ||
| 43 | 1 | … | … | … | |||
| 44 | 1 | 0 | … | … | 0.472 | ||
| 45 | 1 | … | … | 1.000 | |||
| 46 | 1 | 0 | … | … | 0.999 | ||
| 47 | 1 | … | … | … | |||
| 48 | 1 | … | … | … | |||
| 49 | 1 | 0 | … | … | … | ||
| 50 | 1 | … | … | … |
| Peak # | Frequency | Amplitude | Linewidth | Height | |||
| (Hz) | (ppm) | (Hz) | (ppmHz) | ||||
| 51 | 1 | … | … | ||||
| 52 | 1 | … | … | ||||
| 53 | 1 | … | … | ||||
| 54 | 1 | 0 | … | 1.000 | |||
| 55 | 1 | … | … | … | |||
| 56 | 1 | … | … | … | |||
| 57 | 1 | 0 | … | … | … | ||
| 58 | 1 | … | … | … | |||
| 59 | 1 | … | … | 0.988 | |||
| 60 | 1 | 0 | … | … | 0.980 | ||
| 61 | 1 | 0 | … | … | … | ||
| 62 | 1 | … | … | … | |||
| 63 | 1 | … | … | … | |||
| 64 | 1 | 0 | … | … | … | ||
| 65 | 1 | … | … | … | |||
| 66 | 1 | … | … | … | |||
| 67 | 1 | 0 | … | 1.000 | |||
| 68 | 1 | … | … | … | |||
| 69 | 1 | … | … | ||||
| 70 | 1 | 0 | … | … | |||
| 71 | 1 | … | … | … | |||
| 72 | 1 | … | 1.000 | ||||
| 73 | 1 | 0 | … | … | 0.979 | ||
| 74 | 1 | … | … | … | |||
| 75 | 1 | … | … | … | |||
| 76 | 1 | … | … | … | |||
| 77 | 1 | … | … | … | |||
| 78 | 1 | 0 | … | … | 1.000 | ||
| 79 | 1 | … | … | … | |||
| 80 | 1 | … | … | ||||
| 81 | 1 | 0 | … | … | … | ||
| 82 | 1 | … | … | ||||
| 83 | 1 | 0 | … | … | … | ||
| 84 | 1 | … | … | ||||
| 85 | 1 | … | … | … | |||
| 86 | 1 | 0 | … | … | … | ||
| 87 | 1 | … | … | … | |||
| 88 | 1 | … | … | 0.985 | |||
| 89 | 1 | 0 | … | … | 0.929 | ||
| 90 | 1 | ? | … | … | 0.999 | ||
| 91 | 1 | ? | … | … | … | ||
| 92 | 1 | ? | … | … | 0.989 | ||
| 93 | 1 | ? | … | 0.999 | |||
| 94 | 1 | ? | … | … | |||
| 95 | 1 | ? | … | … | |||
| 96 | 1 | ? | … | … | |||
| 97 | 1 | ? | … | 1.000 | |||
| 98 | 1 | ? | … | … | 0.987 | ||
| 99 | 1 | ? | … | … | 1.000 | ||
| 100 | 1 | ? | … | 0.993 | |||
| 101 | 1 | ? | … | 0.995 | |||
| 102 | 1 | ? | … | … | 0.996 | ||
| 103 | 1 | ? | … | … | 0.999 |
| Peak # | Frequency | Amplitude | Linewidth | Height | |||
| (Hz) | (ppm) | (Hz) | (ppmHz) | ||||
| 0 | 0 | 0 | … | 1.000 | |||
| 1 | 0 | 0 | … | … | |||
| 2 | 0 | 0 | … | … | |||
| 3 | 0 | 0 | … | … | |||
| 4 | 0 | 0 | … | … | |||
| 5 | 0 | 0 | … | … | |||
| 6 | 0 | 0 | … | … | |||
| 7 | 0 | 0 | … | … | |||
| 0 | 2 | 0 | … | 0.799 | |||
| 1 | 2 | 0 | … | 1.000 | |||
| 2 | 2 | 0 | … | … | |||
| 3 | 2 | 0 | … | … | |||
| 4 | 2 | 0 | … | … | |||
| 5 | 2 | 0 | … | … | |||
| 6 | 2 | 0 | … | … | |||
| 7 | 2 | 0 | … | 1.000 | |||
| 0 | 3 | 0 | … | 1.000 | |||
| 1 | 3 | 0 | … | 1.000 | |||
| 2 | 3 | 0 | … | 1.000 | |||
| 3 | 3 | 0 | … | 1.000 |
| Peak # | Frequency | Amplitude | Linewidth | Height | |||
| (Hz) | (ppm) | (Hz) | (ppmHz) | ||||
| 0 | 1 | ? | … | … | 0.998 | ||
| 1 | 1 | ? | … | 1.000 | |||
| 2 | 1 | ? | … | … | |||
| 3 | 1 | ? | … | 1.000 | |||
| 4 | 1 | ? | … | … | … | ||
| 5 | 1 | … | … | 1.000 | |||
| 6 | 1 | … | … | 1.000 | |||
| 7 | 1 | … | 1.000 | ||||
| 8 | 1 | … | 1.000 | ||||
| 9 | 1 | … | 1.000 | ||||
| 10 | 1 | … | … | ||||
| 11 | 1 | … | … | … | |||
| 12 | 1 | … | … | … | |||
| 13 | 1 | … | … | … | |||
| 14 | 1 | … | … | 0.998 | |||
| 15 | 1 | … | … | … | |||
| 16 | 1 | … | … | 0.988 | |||
| 17 | 1 | … | … | 0.962 | |||
| 18 | 1 | … | … | … | |||
| 19 | 1 | … | … | … | |||
| 20 | 1 | … | … | ||||
| 21 | 1 | … | … | ||||
| 22 | 1 | … | … | ||||
| 23 | 1 | … | … | … | |||
| 24 | 1 | … | … | … | |||
| 25 | 1 | … | … | 0.869 | |||
| 26 | 1 | … | … | … | |||
| 27 | 1 | … | … | … | |||
| 28 | 1 | … | … | … | |||
| 29 | 1 | … | … | … | |||
| 30 | 1 | … | … | … | |||
| 31 | 1 | … | … | ||||
| 32 | 1 | … | … | ||||
| 33 | 1 | … | … | ||||
| 34 | 1 | … | … | … | |||
| 35 | 1 | … | … | … | |||
| 36 | 1 | … | … | … | |||
| 37 | 1 | … | … | … | |||
| 38 | 1 | … | … | … | |||
| 39 | 1 | … | … | … | |||
| 40 | 1 | 0 | … | … | 0.999 | ||
| 41 | 1 | … | … | ||||
| 42 | 1 | … | … | ||||
| 43 | 1 | … | … | ||||
| 44 | 1 | … | … | ||||
| 45 | 1 | … | … | ||||
| 46 | 1 | … | … | … | |||
| 47 | 1 | … | … | … | |||
| 48 | 1 | … | … | 0.996 | |||
| 49 | 1 | … | … | … | |||
| 50 | 1 | … | … | … |
| Peak # | Frequency | Amplitude | Linewidth | Height | |||
| (Hz) | (ppm) | (Hz) | (ppmHz) | ||||
| 51 | 1 | … | … | ||||
| 52 | 1 | … | … | ||||
| 53 | 1 | … | … | ||||
| 54 | 1 | … | … | ||||
| 55 | 1 | … | 0.952 | ||||
| 56 | 1 | … | … | … | |||
| 57 | 1 | … | 0.351 | ||||
| 58 | 1 | … | 0.985 | ||||
| 59 | 1 | … | 1.000 | ||||
| 60 | 1 | … | 1.000 | ||||
| 61 | 1 | ? | … | 0.738 | |||
| 62 | 1 | ? | … | 1.000 |
| Peak # | Frequency | Amplitude | Linewidth | Height | |||
| (Hz) | (ppm) | (Hz) | (ppmHz) | ||||
| 0 | 0 | 0 | … | 1.000 | |||
| 1 | 0 | 0 | … | … | |||
| 2 | 0 | 0 | … | … | |||
| 3 | 0 | 0 | … | … | |||
| 4 | 0 | 0 | … | … | |||
| 5 | 0 | 0 | … | … | |||
| 6 | 0 | 0 | … | … | |||
| 7 | 0 | 0 | … | 0.997 | |||
| 0 | 2 | 0 | … | 1.000 | |||
| 1 | 2 | 0 | … | 1.000 | |||
| 2 | 2 | 0 | … | … | |||
| 3 | 2 | 0 | … | … | |||
| 4 | 2 | 0 | … | … | |||
| 5 | 2 | 0 | … | … | |||
| 6 | 2 | 0 | … | … | |||
| 7 | 2 | 0 | … | 1.000 | |||
| 0 | 3 | 0 | … | 1.000 |
| Peak # | Frequency | Amplitude | Linewidth | Height | |||
| (Hz) | (ppm) | (Hz) | (ppmHz) | ||||
| 0 | 1 | ? | … | … | 0.997 | ||
| 1 | 1 | ? | … | … | 1.000 | ||
| 2 | 1 | ? | … | … | 0.999 | ||
| 3 | 1 | … | … | 0.999 | |||
| 4 | 1 | … | … | 0.745 | |||
| 5 | 1 | … | … | ||||
| 6 | 1 | … | … | ||||
| 7 | 1 | … | 1.000 | ||||
| 8 | 1 | … | 1.000 | ||||
| 9 | 1 | … | 1.000 | ||||
| 10 | 1 | … | … | … | |||
| 11 | 1 | … | … | … | |||
| 12 | 1 | … | … | … | |||
| 13 | 1 | … | … | ||||
| 14 | 1 | … | … | ||||
| 15 | 1 | … | … | … | |||
| 16 | 1 | … | … | … | |||
| 17 | 1 | … | … | … | |||
| 18 | 1 | … | … | … | |||
| 19 | 1 | … | … | … | |||
| 20 | 1 | … | … | … | |||
| 21 | 1 | 0 | … | … | 1.000 | ||
| 22 | 1 | … | … | … | |||
| 23 | 1 | … | … | ||||
| 24 | 1 | … | … | ||||
| 25 | 1 | … | … | 0.999 | |||
| 26 | 1 | … | … | 1.000 | |||
| 27 | 1 | … | … | 1.000 | |||
| 28 | 1 | … | … | … | |||
| 29 | 1 | … | … | … | |||
| 30 | 1 | … | … | … | |||
| 31 | 1 | … | … | ||||
| 32 | 1 | … | … | ||||
| 33 | 1 | … | … | ||||
| 34 | 1 | … | … | … | |||
| 35 | 1 | … | … | … | |||
| 36 | 1 | … | … | … | |||
| 37 | 1 | 0 | … | … | |||
| 38 | 1 | … | … | ||||
| 39 | 1 | … | … | … | |||
| 40 | 1 | ? | … | … | 1.000 | ||
| 41 | 1 | 0 | … | … | |||
| 42 | 1 | 0 | … | … | |||
| 43 | 1 | … | 0.984 | ||||
| 44 | 1 | 0 | … | 1.000 |
| Peak # | Frequency | Amplitude | Linewidth | Height | |||
| (Hz) | (ppm) | (Hz) | (ppmHz) | ||||
| 0 | 0 | 0 | … | 1.000 | |||
| 1 | 0 | 0 | … | … | |||
| 2 | 0 | 0 | … | … | |||
| 3 | 0 | 0 | … | … | |||
| 4 | 0 | 0 | … | … | |||
| 5 | 0 | 0 | … | … | |||
| 6 | 0 | 0 | … | … | |||
| 7 | 0 | 0 | … | … | |||
| 8 | 0 | 0 | … | 0.983 | |||
| 0 | 2 | 0 | … | 0.996 | |||
| 1 | 2 | 0 | … | … | |||
| 2 | 2 | 0 | … | … | |||
| 3 | 2 | 0 | … | … | |||
| 4 | 2 | 0 | … | … | |||
| 5 | 2 | 0 | … | … | |||
| 6 | 2 | 0 | … | … | |||
| 7 | 2 | 0 | … | 0.997 | |||
| 0 | 3 | 0 | … | 0.990 | |||
| 1 | 3 | 0 | … | 0.472 | |||
| 2 | 3 | 0 | … | 1.000 |
| Peak # | Frequency | Amplitude | Linewidth | Height | |||
| (Hz) | (ppm) | (Hz) | (ppmHz) | ||||
| 0 | 1 | ? | … | 1.000 | |||
| 1 | 1 | ? | … | … | |||
| 2 | 1 | ? | … | … | 0.986 | ||
| 2 | 1 | ? | … | … | 1.000 | ||
| 3 | 1 | ? | … | … | … | ||
| 4 | 1 | ? | … | … | |||
| 5 | 1 | ? | … | … | |||
| 6 | 1 | ? | … | … | |||
| 7 | 1 | … | … | 0.984 | |||
| 8 | 1 | … | … | … | |||
| 9 | 1 | … | … | 0.999 | |||
| 10 | 1 | … | … | … | |||
| 11 | 1 | … | … | … | |||
| 12 | 1 | … | … | … | |||
| 13 | 1 | … | … | … | |||
| 14 | 1 | … | … | … | |||
| 15 | 1 | … | … | ||||
| 16 | 1 | … | … | … | |||
| 17 | 1 | … | … | … | |||
| 18 | 1 | … | … | … | |||
| 19 | 1 | … | … | … | |||
| 20 | 1 | 0 | … | … | 0.935 | ||
| 21 | 1 | … | … | 1.000 | |||
| 22 | 1 | … | … | … | |||
| 23 | 1 | … | … | 0.719 | |||
| 24 | 1 | … | … | 0.999 | |||
| 25 | 1 | … | … | 0.999 | |||
| 26 | 1 | … | … | … | |||
| 27 | 1 | … | … | … | |||
| 28 | 1 | … | … | … | |||
| 29 | 1 | … | … | … | |||
| 30 | 1 | … | … | ||||
| 31 | 1 | … | … | ||||
| 32 | 1 | … | … | … | |||
| 33 | 1 | … | … | … | |||
| 34 | 1 | … | … | … | |||
| 35 | 1 | … | … | … | |||
| 36 | 1 | … | … | … | |||
| 37 | 1 | … | … | 0.996 | |||
| 38 | 1 | … | … | 0.373 | |||
| 39 | 1 | … | … | … | |||
| 40 | 1 | … | … | … | |||
| 41 | 1 | … | … | … | |||
| 42 | 1 | … | … | ||||
| 43 | 1 | … | … | ||||
| 44 | 1 | … | … | ||||
| 45 | 1 | … | … | ||||
| 46 | 1 | … | … | ||||
| 47 | 1 | 0 | … | … | 0.494 | ||
| 48 | 1 | … | … | … | |||
| 49 | 1 | … | … | 0.887 | |||
| 50 | 1 | … | … | 0.158 |
| Peak # | Frequency | Amplitude | Linewidth | Height | |||
| (Hz) | (ppm) | (Hz) | (ppmHz) | ||||
| 51 | 1 | … | … | … | |||
| 52 | 1 | … | … | 0.902 | |||
| 53 | 1 | … | … | … | |||
| 54 | 1 | … | 0.942 | ||||
| 55 | 1 | … | … | ||||
| 56 | 1 | … | … | ||||
| 57 | 1 | … | … | ||||
| 58 | 1 | … | … | ||||
| 59 | 1 | … | … | ||||
| 60 | 1 | … | … | 0.727 | |||
| 61 | 1 | … | … | 0.975 | |||
| 62 | 1 | ? | … | … | 0.980 | ||
| 63 | 1 | ? | … | … | 0.987 | ||
| 64 | 1 | ? | … | 1.000 | |||
| 65 | 1 | ? | … | 0.998 |
| Peak # | Frequency | Amplitude | Linewidth | Height | |||
| (Hz) | (ppm) | (Hz) | (ppmHz) | ||||
| 0 | 0 | 0 | … | … | |||
| 1 | 0 | 0 | … | … | |||
| 2 | 0 | 0 | … | … | |||
| 3 | 0 | 0 | … | … | |||
| 4 | 0 | 0 | … | … | |||
| 5 | 0 | 0 | … | … | |||
| 6 | 0 | 0 | … | … | |||
| 7 | 0 | 0 | … | 1.000 | |||
| 0 | 2 | 0 | … | … | |||
| 1 | 2 | 0 | … | … | |||
| 2 | 2 | 0 | … | … | |||
| 3 | 2 | 0 | … | … | |||
| 4 | 2 | 0 | … | … | |||
| 5 | 2 | 0 | … | … | |||
| 6 | 2 | 0 | … | 0.999 | |||
| 0 | 3 | 0 | … | 0.927 | |||
| 1 | 3 | 0 | … | 0.997 | |||
| 2 | 3 | 0 | … | … | |||
| 3 | 3 | 0 | … | 0.959 |
| Peak # | Frequency | Amplitude | Linewidth | Height | |||
| (Hz) | (ppm) | (Hz) | (ppmHz) | ||||
| 0 | 1 | 0 | … | … | 0.994 | ||
| 1 | 1 | ? | … | … | 0.999 | ||
| 2 | 1 | 0 | … | … | … | ||
| 3 | 1 | 0 | … | … | … | ||
| 4 | 1 | 0 | … | … | … | ||
| 5 | 1 | 0 | … | … | 1.000 | ||
| 6 | 1 | ? | … | … | 0.999 | ||
| 7 | 1 | 0 | … | … | 0.998 | ||
| 8 | 1 | 0 | … | … | … | ||
| 9 | 1 | 0 | … | … | … | ||
| 10 | 1 | 0 | … | … | |||
| 11 | 1 | … | 1.000 | ||||
| 12 | 1 | 0 | … | … | |||
| 13 | 1 | … | 0.999 | ||||
| 14 | 1 | 0 | … | … | … | ||
| 15 | 1 | 0 | … | … | … | ||
| 16 | 1 | 0 | … | … | … | ||
| 17 | 1 | 0 | … | … | … | ||
| 18 | 1 | 0 | … | … | … | ||
| 19 | 1 | 0 | … | … | … | ||
| 20 | 1 | … | … | 1.000 | |||
| 21 | 1 | … | … | … | |||
| 22 | 1 | 0 | … | … | |||
| 23 | 1 | … | … | … | |||
| 24 | 1 | … | … | … | |||
| 25 | 1 | 0 | … | … | |||
| 26 | 1 | … | … | 1.000 | |||
| 27 | 1 | … | … | 1.000 | |||
| 28 | 1 | 0 | … | … | … | ||
| 29 | 1 | 0 | … | … | … | ||
| 30 | 1 | 0 | … | … | … | ||
| 31 | 1 | 0 | … | … | … | ||
| 32 | 1 | … | 1.000 | ||||
| 33 | 1 | 0 | … | … | |||
| 34 | 1 | … | 0.780 | ||||
| 35 | 1 | … | … | ||||
| 36 | 1 | 0 | … | … | |||
| 37 | 1 | … | … | ||||
| 38 | 1 | … | … | 0.678 | |||
| 39 | 1 | 0 | … | … | … | ||
| 40 | 1 | … | … | 0.531 | |||
| 41 | 1 | … | … | 1.000 | |||
| 42 | 1 | 0 | … | … | … | ||
| 43 | 1 | … | … | 1.000 | |||
| 44 | 1 | 0 | … | … | 0.711 | ||
| 45 | 1 | 0 | … | … | … | ||
| 46 | 1 | 0 | … | … | … | ||
| 47 | 1 | … | 0.022 | ||||
| 48 | 1 | 0 | … | … | |||
| 49 | 1 | … | 0.014 | ||||
| 50 | 1 | … | 0.295 |
| Peak # | Frequency | Amplitude | Linewidth | Height | |||
|---|---|---|---|---|---|---|---|
| (Hz) | (ppm) | (Hz) | (ppmHz) | ||||
| 51 | 1 | 0 | … | … | |||
| 52 | 1 | … | 0.995 | ||||
| 53 | 1 | 0 | … | 1.000 | |||
| 54 | 1 | 0 | … | … | |||
| 55 | 1 | 0 | … | … | |||
| 56 | 1 | 0 | … | … | |||
| 57 | 1 | 0 | … | 1.000 | |||
| 58 | 1 | 0 | … | 0.216 | |||
| 59 | 1 | 0 | … | 1.000 | |||
| 60 | 1 | ? | … | 1.000 | |||
| 61 | 1 | ? | … | 0.891 |
| Peak # | Frequency | Amplitude | Linewidth | Height | |||
| (Hz) | (ppm) | (Hz) | (ppmHz) | ||||
| 0 | 0 | 0 | … | … | |||
| 1 | 0 | 0 | … | … | |||
| 2 | 0 | 0 | … | … | |||
| 3 | 0 | 0 | … | … | |||
| 4 | 0 | 0 | … | … | |||
| 5 | 0 | 0 | … | … | |||
| 6 | 0 | 0 | … | … | |||
| 0 | 2 | 0 | … | 1.000 | |||
| 1 | 2 | 0 | … | … | |||
| 2 | 2 | 0 | … | … | |||
| 3 | 2 | 0 | … | … | |||
| 4 | 2 | 0 | … | … | |||
| 5 | 2 | 0 | … | … | |||
| 6 | 2 | 0 | … | … | |||
| 0 | 3 | 0 | … | … | |||
| 1 | 3 | 0 | … | … | |||
| 2 | 3 | 0 | … | … | |||
| 3 | 3 | 0 | … | 0.999 |
| Peak # | Frequency | Amplitude | Linewidth | Height | |||
| (Hz) | (ppm) | (Hz) | (ppmHz) | ||||
| 0 | 1 | 0 | … | … | 0.972 | ||
| 1 | 1 | 0 | … | 1.000 | |||
| 2 | 1 | 0 | … | … | … | ||
| 3 | 1 | 0 | … | … | … | ||
| 4 | 1 | 0 | … | … | |||
| 5 | 1 | 0 | … | … | … | ||
| 6 | 1 | 0 | … | 0.980 | |||
| 7 | 1 | 0 | … | … | … | ||
| 8 | 1 | 0 | … | … | … | ||
| 9 | 1 | 0 | … | … | 1.000 | ||
| 10 | 1 | 0 | … | … | |||
| 11 | 1 | 0 | … | … | … | ||
| 12 | 1 | 0 | … | … | … | ||
| 13 | 1 | 0 | … | … | 1.000 | ||
| 14 | 1 | 0 | … | … | 0.999 | ||
| 15 | 1 | 0 | … | … | … | ||
| 16 | 1 | 0 | … | … | … | ||
| 17 | 1 | 0 | … | … | 1.000 | ||
| 18 | 1 | 0 | … | … | … | ||
| 19 | 1 | 0 | … | … | |||
| 20 | 1 | 0 | … | … | |||
| 21 | 1 | 0 | … | … | … | ||
| 22 | 1 | 0 | … | … | 1.000 | ||
| 23 | 1 | 0 | … | … | … | ||
| 24 | 1 | 0 | … | … | … | ||
| 25 | 1 | 0 | … | … | … | ||
| 26 | 1 | 0 | … | … | |||
| 27 | 1 | 0 | … | … | |||
| 28 | 1 | 0 | … | … | … | ||
| 29 | 1 | 0 | … | … | … | ||
| 30 | 1 | 0 | … | … | … | ||
| 31 | 1 | 0 | … | … | 1.000 | ||
| 32 | 1 | 0 | … | … | … | ||
| 33 | 1 | 0 | … | … | |||
| 34 | 1 | 0 | … | … | |||
| 35 | 1 | 0 | … | … | |||
| 36 | 1 | 0 | … | … | … | ||
| 37 | 1 | 0 | … | … | … | ||
| 38 | 1 | 0 | … | … | |||
| 39 | 1 | 0 | … | … | |||
| 40 | 1 | 0 | … | … | |||
| 41 | 1 | 0 | … | … | … | ||
| 42 | 1 | 0 | … | … | |||
| 43 | 1 | 0 | … | … | |||
| 44 | 1 | 0 | … | … | |||
| 45 | 1 | 0 | … | 0.727 | |||
| 46 | 1 | 0 | … | … | |||
| 47 | 1 | 0 | … | … |
| Peak # | Frequency | Amplitude | Linewidth | Height | |||
| (Hz) | (ppm) | (Hz) | (ppmHz) | ||||
| 0 | 0 | 0 | … | … | |||
| 1 | 0 | 0 | … | … | |||
| 2 | 0 | 0 | … | … | |||
| 3 | 0 | 0 | … | … | |||
| 4 | 0 | 0 | … | … | |||
| 5 | 0 | 0 | … | … | |||
| 6 | 0 | 0 | … | … | |||
| 7 | 0 | 0 | … | … | |||
| 8 | 0 | 0 | … | 0.998 | |||
| 0 | 2 | 0 | … | 0.849 | |||
| 1 | 2 | 0 | … | … | |||
| 2 | 2 | 0 | … | … | |||
| 3 | 2 | 0 | … | … | |||
| 4 | 2 | 0 | … | … | |||
| 5 | 2 | 0 | … | … | |||
| 6 | 2 | 0 | … | … | |||
| 7 | 2 | 0 | … | … | |||
| 8 | 2 | 0 | … | 0.992 | |||
| 0 | 3 | 0 | … | 1.000 | |||
| 1 | 3 | 0 | … | … | |||
| 2 | 3 | 0 | … | … | |||
| 3 | 3 | 0 | … | 1.000 |
| Peak # | Frequency | Amplitude | Linewidth | Height | |||
| (Hz) | (ppm) | (Hz) | (ppmHz) | ||||
| 0 | 1 | ? | … | … | 0.998 | ||
| 1 | 1 | ? | … | … | 0.997 | ||
| 2 | 1 | ? | … | … | 1.000 | ||
| 3 | 1 | ? | … | … | 1.000 | ||
| 4 | 1 | ? | … | … | 1.000 | ||
| 5 | 1 | ? | … | … | 0.980 | ||
| 6 | 1 | ? | … | … | 0.989 | ||
| 7 | 1 | … | … | 1.000 | |||
| 8 | 1 | … | … | … | |||
| 9 | 1 | … | … | 1.000 | |||
| 10 | 1 | … | 1.000 | ||||
| 11 | 1 | … | … | ||||
| 12 | 1 | … | … | ||||
| 13 | 1 | … | … | 1.000 | |||
| 14 | 1 | … | … | … | |||
| 15 | 1 | … | … | 1.000 | |||
| 16 | 1 | ? | … | … | 0.995 | ||
| 17 | 1 | ? | … | … | … | ||
| 18 | 1 | ? | … | … | … | ||
| 19 | 1 | ? | … | … | … | ||
| 20 | 1 | ? | … | … | |||
| 21 | 1 | ? | … | … | 1.000 | ||
| 22 | 1 | ? | … | … | 0.974 | ||
| 23 | 1 | … | … | … | |||
| 24 | 1 | … | … | 1.000 | |||
| 25 | 1 | … | … | 0.556 | |||
| 26 | 1 | … | … | 1.000 | |||
| 27 | 1 | … | … | 0.998 | |||
| 28 | 1 | … | … | … | |||
| 29 | 1 | … | … | … | |||
| 30 | 1 | … | … | ||||
| 31 | 1 | … | … | ||||
| 32 | 1 | … | … | ||||
| 33 | 1 | … | … | ||||
| 34 | 1 | … | … | … | |||
| 35 | 1 | … | … | … | |||
| 36 | 1 | … | … | 0.990 | |||
| 37 | 1 | … | … | 0.998 | |||
| 38 | 1 | … | … | 1.000 | |||
| 39 | 1 | … | … | … | |||
| 40 | 1 | … | … | … | |||
| 41 | 1 | … | … | 1.000 | |||
| 42 | 1 | … | … | 1.000 | |||
| 43 | 1 | … | … | … | |||
| 44 | 1 | … | … | ||||
| 45 | 1 | … | … | ||||
| 46 | 1 | … | … | ||||
| 47 | 1 | … | … | ||||
| 48 | 1 | … | … | ||||
| 49 | 1 | … | … | … | |||
| 50 | 1 | … | … | 0.992 |
| Peak # | Frequency | Amplitude | Linewidth | Height | |||
| (Hz) | (ppm) | (Hz) | (ppmHz) | ||||
| 51 | 1 | … | … | 0.964 | |||
| 52 | 1 | … | … | 1.000 | |||
| 53 | 1 | … | 0.960 | ||||
| 54 | 1 | … | … | ||||
| 55 | 1 | … | … | ||||
| 56 | 1 | … | … | ||||
| 57 | 1 | … | 1.000 | ||||
| 58 | 1 | ? | … | 0.953 | |||
| 59 | 1 | ? | … | … | |||
| 60 | 1 | ? | … | 0.998 |
| Peak # | Frequency | Amplitude | Linewidth | Height | |||
| (Hz) | (ppm) | (Hz) | (ppmHz) | ||||
| 0 | 0 | 0 | … | 1.000 | |||
| 1 | 0 | 0 | … | … | |||
| 2 | 0 | 0 | … | … | |||
| 3 | 0 | 0 | … | … | |||
| 4 | 0 | 0 | … | … | |||
| 5 | 0 | 0 | … | … | |||
| 6 | 0 | 0 | … | … | |||
| 7 | 0 | 0 | … | 0.982 | |||
| 0 | 2 | 0 | … | 0.903 | |||
| 1 | 2 | 0 | … | 1.000 | |||
| 2 | 2 | 0 | … | … | |||
| 3 | 2 | 0 | … | … | |||
| 4 | 2 | 0 | … | … | |||
| 5 | 2 | 0 | … | … | |||
| 6 | 2 | 0 | … | … | |||
| 7 | 2 | 0 | … | 1.000 | |||
| 0 | 3 | 0 | … | 0.997 | |||
| 1 | 3 | 0 | … | … | |||
| 2 | 3 | 0 | … | … |
| Peak # | Frequency | Amplitude | Linewidth | Height | |||
| (Hz) | (ppm) | (Hz) | (ppmHz) | ||||
| 0 | 1 | 0 | … | … | 0.995 | ||
| 1 | 1 | 0 | … | … | 0.986 | ||
| 2 | 1 | 0 | … | … | … | ||
| 3 | 1 | 0 | … | … | |||
| 4 | 1 | 0 | … | 1.000 | |||
| 5 | 1 | 0 | … | … | … | ||
| 6 | 1 | 0 | … | … | 0.985 | ||
| 7 | 1 | 0 | … | … | 0.986 | ||
| 8 | 1 | 0 | … | … | 0.699 | ||
| 9 | 1 | 0 | … | … | … | ||
| 10 | 1 | 0 | … | … | |||
| 11 | 1 | 0 | … | … | |||
| 12 | 1 | 0 | … | … | |||
| 13 | 1 | 0 | … | … | … | ||
| 14 | 1 | 0 | … | … | 0.986 | ||
| 15 | 1 | 0 | … | … | 0.992 | ||
| 16 | 1 | 0 | … | … | … | ||
| 17 | 1 | 0 | … | … | … | ||
| 18 | 1 | 0 | … | … | … | ||
| 19 | 1 | … | … | … | |||
| 20 | 1 | … | 0.980 | ||||
| 21 | 1 | 0 | … | … | |||
| 22 | 1 | … | … | 0.985 | |||
| 23 | 1 | … | … | 1.000 | |||
| 24 | 1 | 0 | … | … | |||
| 25 | 1 | … | … | … | |||
| 26 | 1 | 0 | … | … | … | ||
| 27 | 1 | 0 | … | … | … | ||
| 28 | 1 | 0 | … | … | 0.990 | ||
| 29 | 1 | … | … | 0.928 | |||
| 30 | 1 | 0 | … | … | 0.442 | ||
| 31 | 1 | … | … | 0.941 | |||
| 32 | 1 | … | … | 1.000 | |||
| 33 | 1 | 0 | … | … | … | ||
| 34 | 1 | … | … | 0.948 | |||
| 35 | 1 | … | … | … | |||
| 36 | 1 | 0 | … | … | |||
| 37 | 1 | … | … | ||||
| 38 | 1 | … | … | ||||
| 39 | 1 | 0 | … | … | |||
| 40 | 1 | … | … | … | |||
| 41 | 1 | … | … | … | |||
| 42 | 1 | 0 | … | … | … | ||
| 43 | 1 | 0 | … | … | … | ||
| 44 | 1 | … | … | … | |||
| 45 | 1 | 0 | … | … | … | ||
| 46 | 1 | 0 | … | … | … | ||
| 47 | 1 | 0 | … | … | … | ||
| 48 | 1 | … | … | … | |||
| 49 | 1 | 0 | … | … | … | ||
| 50 | 1 | 0 | … | … | 1.000 |
| Peak # | Frequency | Amplitude | Linewidth | Height | |||
| (Hz) | (ppm) | (Hz) | (ppmHz) | ||||
| 51 | 1 | 0 | … | … | … | ||
| 52 | 1 | ? | … | 1.000 | |||
| 53 | 1 | 0 | … | … | |||
| 54 | 1 | ? | … | … | |||
| 55 | 1 | 0 | … | … | |||
| 56 | 1 | … | 1.000 | ||||
| 57 | 1 | 0 | … | … | … | ||
| 58 | 1 | 0 | … | … | 0.993 | ||
| 59 | 1 | … | 1.000 | ||||
| 60 | 1 | 0 | … | … | |||
| 61 | 1 | … | 1.000 | ||||
| 62 | 1 | … | 0.961 | ||||
| 63 | 1 | 0 | … | … | |||
| 64 | 1 | … | 1.000 | ||||
| 65 | 1 | 0 | … | … | |||
| 66 | 1 | ? | … | 1.000 | |||
| 67 | 1 | 0 | … | … | |||
| 68 | 1 | 0 | … | 0.997 | |||
| 69 | 1 | 0 | … | … | 0.998 | ||
| 70 | 1 | … | … | 0.998 | |||
| 71 | 1 | 0 | … | … | |||
| 72 | 1 | … | 0.998 | ||||
| 73 | 1 | 0 | … | … | |||
| 74 | 1 | … | 0.998 | ||||
| 75 | 1 | 0 | … | 0.998 | |||
| 76 | 1 | 0 | … | 1.000 | |||
| 77 | 1 | 0 | … | 0.998 |
| Peak # | Frequency | Amplitude | Linewidth | Height | |||
| (Hz) | (ppm) | (Hz) | (ppmHz) | ||||
| 0 | 0 | 0 | … | 0.999 | |||
| 1 | 0 | 0 | … | … | |||
| 2 | 0 | 0 | … | … | |||
| 3 | 0 | 0 | … | … | |||
| 4 | 0 | 0 | … | … | |||
| 5 | 0 | 0 | … | … | |||
| 6 | 0 | 0 | … | … | |||
| 7 | 0 | 0 | … | 1.000 | |||
| 0 | 2 | 0 | … | 1.000 | |||
| 1 | 2 | 0 | … | … | |||
| 2 | 2 | 0 | … | … | |||
| 3 | 2 | 0 | … | … | |||
| 4 | 2 | 0 | … | … | |||
| 5 | 2 | 0 | … | … | |||
| 6 | 2 | 0 | … | … | |||
| 7 | 2 | 0 | … | 1.000 | |||
| 0 | 3 | 0 | … | 0.170 | |||
| 1 | 3 | 0 | … | 1.000 | |||
| 2 | 3 | 0 | … | … | |||
| 3 | 3 | 0 | … | … | |||
| 4 | 3 | 0 | … | 1.000 |
| Peak # | Frequency | Amplitude | Linewidth | Height | |||
| (Hz) | (ppm) | (Hz) | (ppmHz) | ||||
| 0 | 1 | 0 | … | 1.000 | |||
| 1 | 1 | 0 | … | 1.000 | |||
| 2 | 1 | 0 | … | … | 1.000 | ||
| 3 | 1 | 0 | … | … | … | ||
| 4 | 1 | 0 | … | … | |||
| 5 | 1 | 0 | … | 1.000 | |||
| 6 | 1 | 0 | … | … | 0.977 | ||
| 7 | 1 | 0 | … | … | 0.998 | ||
| 8 | 1 | 0 | … | … | … | ||
| 9 | 1 | 0 | … | … | … | ||
| 10 | 1 | 0 | … | … | |||
| 11 | 1 | 0 | … | … | … | ||
| 12 | 1 | 0 | … | … | … | ||
| 13 | 1 | 0 | … | … | … | ||
| 14 | 1 | 0 | … | … | … | ||
| 15 | 1 | 0 | … | … | |||
| 16 | 1 | 0 | … | … | … | ||
| 17 | 1 | 0 | … | … | … | ||
| 18 | 1 | 0 | … | … | … | ||
| 19 | 1 | 0 | … | … | … | ||
| 20 | 1 | 0 | … | … | |||
| 21 | 1 | 0 | … | … | |||
| 22 | 1 | 0 | … | … | … | ||
| 23 | 1 | 0 | … | … | … | ||
| 24 | 1 | 0 | … | … | 1.000 | ||
| 25 | 1 | 0 | … | … | |||
| 26 | 1 | 0 | … | … | |||
| 27 | 1 | 0 | … | … | … | ||
| 28 | 1 | 0 | … | … | 0.983 | ||
| 29 | 1 | 0 | … | 1.000 | |||
| 30 | 1 | 0 | … | … | |||
| 31 | 1 | 0 | … | … | 0.999 | ||
| 32 | 1 | 0 | … | 1.000 | |||
| 33 | 1 | 0 | … | 0.961 |
| Peak # | Frequency | Amplitude | Linewidth | Height | |||
| (Hz) | (ppm) | (Hz) | (ppmHz) | ||||
| 0 | 0 | 0 | … | 1.000 | |||
| 1 | 0 | 0 | … | … | |||
| 2 | 0 | 0 | … | … | |||
| 3 | 0 | 0 | … | … | |||
| 4 | 0 | 0 | … | … | |||
| 5 | 0 | 0 | … | … | |||
| 6 | 0 | 0 | … | 1.000 | |||
| 0 | 2 | 0 | … | … | |||
| 1 | 2 | 0 | … | … | |||
| 2 | 2 | 0 | … | … | |||
| 3 | 2 | 0 | … | … | |||
| 4 | 2 | 0 | … | … | |||
| 5 | 2 | 0 | … | … | |||
| 6 | 2 | 0 | … | 0.998 | |||
| 0 | 3 | 0 | … | 1.000 | |||
| 1 | 3 | 0 | … | 1.000 |
| Peak # | Frequency | Amplitude | Linewidth | Height | |||
| (Hz) | (ppm) | (Hz) | (ppmHz) | ||||
| 0 | 1 | 0 | … | … | 0.998 | ||
| 1 | 1 | 0 | … | 1.000 | |||
| 2 | 1 | 0 | … | … | |||
| 3 | 1 | 0 | … | … | 0.999 | ||
| 4 | 1 | 0 | … | … | 0.915 | ||
| 5 | 1 | 0 | … | … | … | ||
| 6 | 1 | 0 | … | … | |||
| 7 | 1 | 0 | … | … | |||
| 8 | 1 | 0 | … | … | … | ||
| 9 | 1 | 0 | … | … | … | ||
| 10 | 1 | 0 | … | … | 1.000 | ||
| 11 | 1 | 0 | … | … | 1.000 | ||
| 12 | 1 | 0 | … | … | … | ||
| 13 | 1 | 0 | … | … | |||
| 14 | 1 | 0 | … | … | … | ||
| 15 | 1 | 0 | … | … | … | ||
| 16 | 1 | 0 | … | … | … | ||
| 17 | 1 | 0 | … | … | … | ||
| 18 | 1 | 0 | … | … | … | ||
| 19 | 1 | 0 | … | … | … | ||
| 20 | 1 | 0 | … | … | |||
| 21 | 1 | 0 | … | … | |||
| 22 | 1 | 0 | … | … | |||
| 23 | 1 | 0 | … | … | … | ||
| 24 | 1 | 0 | … | … | 1.000 | ||
| 25 | 1 | 0 | … | … | 1.000 | ||
| 26 | 1 | 0 | … | … | … | ||
| 27 | 1 | 0 | … | … | |||
| 28 | 1 | 0 | … | … | |||
| 29 | 1 | 0 | … | … | |||
| 30 | 1 | 0 | … | … | … | ||
| 31 | 1 | 0 | … | … | … | ||
| 32 | 1 | 0 | … | … | |||
| 33 | 1 | 0 | … | … | |||
| 34 | 1 | 0 | … | … | |||
| 35 | 1 | 0 | … | 1.000 | |||
| 36 | 1 | 0 | … | 0.992 | |||
| 37 | 1 | 0 | … | … | |||
| 38 | 1 | 0 | … | 1.000 |
| Peak # | Frequency | Amplitude | Linewidth | Height | |||
|---|---|---|---|---|---|---|---|
| (Hz) | (ppm) | (Hz) | (ppmHz) | ||||
| 0 | 0 | 0 | … | … | |||
| 1 | 0 | 0 | … | … | |||
| 2 | 0 | 0 | … | … | |||
| 3 | 0 | 0 | … | … | |||
| 4 | 0 | 0 | … | … | |||
| 5 | 0 | 0 | … | … | |||
| 0 | 2 | 0 | … | 1.000 | |||
| 1 | 2 | 0 | … | … | |||
| 2 | 2 | 0 | … | … | |||
| 3 | 2 | 0 | … | … | |||
| 4 | 2 | 0 | … | … | |||
| 5 | 2 | 0 | … | … | |||
| 0 | 3 | 0 | … | … | |||
| 1 | 3 | 0 | … | … | |||
| 2 | 3 | 0 | … | 1.000 | |||
| 3 | 3 | 0 | … | 0.109 |
| Peak # | Frequency | Amplitude | Linewidth | Height | |||
| (Hz) | (ppm) | (Hz) | (ppmHz) | ||||
| 0 | 1 | 0 | … | … | 0.960 | ||
| 1 | 1 | 0 | … | … | 0.997 | ||
| 2 | 1 | 0 | … | … | 0.987 | ||
| 3 | 1 | 0 | … | … | 0.994 | ||
| 4 | 1 | 0 | … | … | 0.998 | ||
| 5 | 1 | 0 | … | … | 0.963 | ||
| 6 | 1 | 0 | … | … | |||
| 7 | 1 | 0 | … | … | |||
| 8 | 1 | 0 | … | … | |||
| 9 | 1 | 0 | … | 0.908 | |||
| 10 | 1 | 0 | … | 0.999 | |||
| 11 | 1 | 0 | … | 0.997 | |||
| 12 | 1 | 0 | … | … | 0.990 | ||
| 13 | 1 | 0 | … | … | 1.000 | ||
| 14 | 1 | 0 | … | … | 1.000 | ||
| 15 | 1 | 0 | … | … | |||
| 16 | 1 | 0 | … | … | |||
| 17 | 1 | 0 | … | … | … | ||
| 18 | 1 | 0 | … | … | … | ||
| 19 | 1 | 0 | … | … | 0.917 | ||
| 20 | 1 | 0 | … | … | … | ||
| 21 | 1 | 0 | … | … | … | ||
| 22 | 1 | 0 | … | … | … | ||
| 23 | 1 | 0 | … | … | … | ||
| 24 | 1 | 0 | … | … | |||
| 25 | 1 | 0 | … | … | … | ||
| 26 | 1 | 0 | … | … | … | ||
| 27 | 1 | 0 | … | … | … | ||
| 28 | 1 | 0 | … | … | … | ||
| 29 | 1 | 0 | … | … | … | ||
| 30 | 1 | 0 | … | … | … | ||
| 31 | 1 | 0 | … | … | |||
| 32 | 1 | 0 | … | … | |||
| 33 | 1 | 0 | … | … | … | ||
| 34 | 1 | 0 | … | … | … | ||
| 35 | 1 | 0 | … | … | … | ||
| 36 | 1 | 0 | … | … | … | ||
| 37 | 1 | 0 | … | … | … | ||
| 38 | 1 | 0 | … | … | |||
| 39 | 1 | 0 | … | … | |||
| 40 | 1 | 0 | … | … | |||
| 41 | 1 | 0 | … | … | … | ||
| 42 | 1 | 0 | … | … | … | ||
| 43 | 1 | 0 | … | … | |||
| 44 | 1 | 0 | … | … | |||
| 45 | 1 | 0 | … | … | |||
| 46 | 1 | 0 | … | 0.998 | |||
| 47 | 1 | 0 | … | … | 0.970 | ||
| 48 | 1 | 0 | … | 0.618 | |||
| 49 | 1 | 0 | … | … | |||
| 50 | 1 | 0 | … | 0.993 |
| Peak # | Frequency | Amplitude | Linewidth | Height | |||
|---|---|---|---|---|---|---|---|
| (Hz) | (ppm) | (Hz) | (ppmHz) | ||||
| 0 | 0 | 0 | … | 0.990 | |||
| 1 | 0 | 0 | … | 1.000 | |||
| 2 | 0 | 0 | … | … | |||
| 3 | 0 | 0 | … | … | |||
| 4 | 0 | 0 | … | … | |||
| 5 | 0 | 0 | … | … | |||
| 6 | 0 | 0 | … | … | |||
| 7 | 0 | 0 | … | … | |||
| 8 | 0 | 0 | … | 0.839 | |||
| 0 | 2 | 0 | … | 1.000 | |||
| 1 | 2 | 0 | … | … | |||
| 2 | 2 | 0 | … | … | |||
| 3 | 2 | 0 | … | … | |||
| 4 | 2 | 0 | … | … | |||
| 5 | 2 | 0 | … | … | |||
| 6 | 2 | 0 | … | … | |||
| 7 | 2 | 0 | … | … | |||
| 0 | 3 | 0 | … | 0.514 | |||
| 1 | 3 | 0 | … | 0.801 | |||
| 2 | 3 | 0 | … | 1.000 | |||
| 3 | 3 | 0 | … | … | |||
| 4 | 3 | 0 | … | … | |||
| 5 | 3 | 0 | … | 1.000 |
| Peak # | Frequency | Amplitude | Linewidth | Height | |||
| (Hz) | (ppm) | (Hz) | (ppmHz) | ||||
| 0 | 1 | ? | … | 1.000 | |||
| 1 | 1 | ? | … | 0.941 | |||
| 2 | 1 | ? | … | … | 1.000 | ||
| 3 | 1 | ? | … | 0.998 | |||
| 4 | 1 | ? | … | … | |||
| 5 | 1 | ? | … | … | |||
| 6 | 1 | … | … | 0.992 | |||
| 7 | 1 | … | … | … | |||
| 8 | 1 | … | … | 1.000 | |||
| 9 | 1 | … | … | 1.000 | |||
| 10 | 1 | … | … | ||||
| 11 | 1 | … | … | ||||
| 12 | 1 | … | … | ||||
| 13 | 1 | … | … | ||||
| 14 | 1 | … | … | … | |||
| 15 | 1 | … | … | … | |||
| 16 | 1 | … | … | … | |||
| 17 | 1 | … | … | … | |||
| 18 | 1 | … | … | … | |||
| 19 | 1 | … | … | … | |||
| 20 | 1 | … | … | ||||
| 21 | 1 | … | … | ||||
| 22 | 1 | … | … | ||||
| 23 | 1 | 0 | … | … | 0.994 | ||
| 24 | 1 | … | … | ||||
| 25 | 1 | … | … | … | |||
| 26 | 1 | … | … | … | |||
| 27 | 1 | … | … | … | |||
| 28 | 1 | … | … | … | |||
| 29 | 1 | … | … | … | |||
| 30 | 1 | … | … | 0.998 | |||
| 31 | 1 | … | … | … | |||
| 32 | 1 | … | … | … | |||
| 33 | 1 | … | … | … | |||
| 34 | 1 | … | … | … | |||
| 35 | 1 | … | … | ||||
| 36 | 1 | … | … | ||||
| 37 | 1 | 0 | … | … | 0.975 | ||
| 38 | 1 | … | … | … | |||
| 39 | 1 | … | … | 1.000 | |||
| 40 | 1 | … | … | … | |||
| 41 | 1 | … | … | … | |||
| 42 | 1 | … | … | … | |||
| 43 | 1 | … | … | … | |||
| 44 | 1 | … | … | … | |||
| 45 | 1 | … | … | ||||
| 46 | 1 | … | … | ||||
| 47 | 1 | … | … | ||||
| 48 | 1 | … | … | ||||
| 49 | 1 | … | … | … | |||
| 50 | 1 | … | … | 0.997 | |||
| 51 | 1 | … | … | 1.000 | |||
| 52 | 1 | … | … | 1.000 | |||
| 53 | 1 | … | … | 1.000 | |||
| 54 | 1 | … | … | 1.000 | |||
| 55 | 1 | … | … | ||||
| 56 | 1 | … | … | ||||
| 57 | 1 | … | … | ||||
| 58 | 1 | … | … | ||||
| 59 | 1 | … | 1.000 |
| Peak # | Frequency | Amplitude | Linewidth | Height | |||
| (Hz) | (ppm) | (Hz) | (ppmHz) | ||||
| 0 | 0 | 0 | … | … | |||
| 1 | 0 | 0 | … | … | |||
| 2 | 0 | 0 | … | … | |||
| 3 | 0 | 0 | … | … | |||
| 4 | 0 | 0 | … | … | |||
| 5 | 0 | 0 | … | … | |||
| 6 | 0 | 0 | … | … | |||
| 0 | 2 | 0 | … | 0.977 | |||
| 1 | 2 | 0 | … | … | |||
| 2 | 2 | 0 | … | … | |||
| 3 | 2 | 0 | … | … | |||
| 4 | 2 | 0 | … | … | |||
| 5 | 2 | 0 | … | … | |||
| 6 | 2 | 0 | … | … | |||
| 0 | 3 | 0 | … | … | |||
| 1 | 3 | 0 | … | … | |||
| 2 | 3 | 0 | … | 1.000 | |||
| 3 | 3 | 0 | … | 1.000 |
| Peak # | Frequency | Amplitude | Linewidth | Height | |||
| (Hz) | (ppm) | (Hz) | (ppmHz) | ||||
| 0 | 1 | ? | … | … | 0.983 | ||
| 1 | 1 | ? | … | … | 0.996 | ||
| 2 | 1 | ? | … | … | 1.000 | ||
| 3 | 1 | ? | … | … | 0.995 | ||
| 4 | 1 | ? | … | … | 0.997 | ||
| 5 | 1 | … | … | … | |||
| 6 | 1 | 0 | … | … | 0.997 | ||
| 7 | 1 | … | … | … | |||
| 8 | 1 | … | … | … | |||
| 9 | 1 | 0 | … | … | 0.994 | ||
| 10 | 1 | ? | … | … | |||
| 11 | 1 | ? | … | … | |||
| 12 | 1 | … | … | … | |||
| 13 | 1 | … | … | … | |||
| 14 | 1 | ? | … | … | … | ||
| 15 | 1 | ? | … | … | 0.995 | ||
| 16 | 1 | … | … | 1.000 | |||
| 17 | 1 | … | … | 1.000 | |||
| 18 | 1 | … | … | … | |||
| 19 | 1 | … | … | … | |||
| 20 | 1 | ? | … | … | |||
| 21 | 1 | 0 | … | … | 0.999 | ||
| 22 | 1 | ? | … | … | |||
| 23 | 1 | 0 | … | … | 0.999 | ||
| 24 | 1 | … | … | … | |||
| 25 | 1 | … | … | … | |||
| 26 | 1 | 0 | … | … | … | ||
| 27 | 1 | … | … | … | |||
| 28 | 1 | … | … | … | |||
| 29 | 1 | 0 | … | … | 0.846 | ||
| 30 | 1 | … | … | 0.997 | |||
| 31 | 1 | … | … | … | |||
| 32 | 1 | 0 | … | … | … | ||
| 33 | 1 | … | … | … | |||
| 34 | 1 | … | … | … | |||
| 35 | 1 | … | … | … | |||
| 36 | 1 | … | … | … | |||
| 37 | 1 | 0 | … | … | … | ||
| 38 | 1 | … | … | ||||
| 39 | 1 | … | … | ||||
| 40 | 1 | 0 | … | … | |||
| 41 | 1 | … | … | ||||
| 42 | 1 | … | … | ||||
| 43 | 1 | 0 | … | … | … | ||
| 44 | 1 | … | … | … | |||
| 45 | 1 | … | … | … | |||
| 46 | 1 | 0 | … | … | 0.980 | ||
| 47 | 1 | … | … | … | |||
| 48 | 1 | … | … | 1.000 | |||
| 49 | 1 | 0 | … | … | 0.989 | ||
| 50 | 1 | … | … | 0.995 |
| Peak # | Frequency | Amplitude | Linewidth | Height | |||
| (Hz) | (ppm) | (Hz) | (ppmHz) | ||||
| 51 | 1 | … | … | 1.000 | |||
| 52 | 1 | 0 | … | … | 0.997 | ||
| 53 | 1 | … | … | … | |||
| 54 | 1 | … | … | … | |||
| 55 | 1 | … | … | ||||
| 56 | 1 | 0 | … | … | |||
| 57 | 1 | … | … | ||||
| 58 | 1 | … | … | ||||
| 59 | 1 | 0 | … | … | |||
| 60 | 1 | … | … | ||||
| 61 | 1 | … | … | 1.000 | |||
| 62 | 1 | … | … | 0.998 | |||
| 63 | 1 | … | … | 1.000 | |||
| 64 | 1 | 0 | … | … | … | ||
| 65 | 1 | 0 | … | … | 0.998 | ||
| 66 | 1 | … | … | 0.999 | |||
| 67 | 1 | … | … | 1.000 | |||
| 68 | 1 | … | … | ||||
| 69 | 1 | … | … | ||||
| 70 | 1 | 0 | … | … | |||
| 71 | 1 | … | … | ||||
| 72 | 1 | … | … | ||||
| 73 | 1 | 0 | … | … | |||
| 74 | 1 | … | … | ||||
| 75 | 1 | … | 1.000 | ||||
| 76 | 1 | … | 0.929 | ||||
| 77 | 1 | 0 | … | … | |||
| 78 | 1 | … | … | ||||
| 79 | 1 | … | … | ||||
| 80 | 1 | 0 | … | 0.338 | |||
| 81 | 1 | … | 0.958 |
| Peak # | Frequency | Amplitude | Linewidth | Height | |||
| (Hz) | (ppm) | (Hz) | (ppmHz) | ||||
| 0 | 0 | 0 | … | 0.981 | |||
| 1 | 0 | 0 | … | … | |||
| 2 | 0 | 0 | … | … | |||
| 3 | 0 | 0 | … | … | |||
| 4 | 0 | 0 | … | … | |||
| 5 | 0 | 0 | … | … | |||
| 6 | 0 | 0 | … | … | |||
| 7 | 0 | 0 | … | 1.000 | |||
| 0 | 2 | 0 | … | 0.840 | |||
| 1 | 2 | 0 | … | 0.806 | |||
| 2 | 2 | 0 | … | … | |||
| 3 | 2 | 0 | … | … | |||
| 4 | 2 | 0 | … | … | |||
| 5 | 2 | 0 | … | … | |||
| 6 | 2 | 0 | … | … | |||
| 7 | 2 | 0 | … | 1.000 | |||
| 0 | 3 | 0 | … | 1.000 | |||
| 1 | 3 | 0 | … | … | |||
| 2 | 3 | 0 | … | … | |||
| 3 | 3 | 0 | … | 1.000 |
| Peak # | Frequency | Amplitude | Linewidth | Height | |||
| (Hz) | (ppm) | (Hz) | (ppmHz) | ||||
| 0 | 1 | ? | … | … | 0.974 | ||
| 1 | 1 | ? | … | 0.955 | |||
| 2 | 1 | ? | … | 0.381 | |||
| 3 | 1 | ? | … | 0.612 | |||
| 4 | 1 | ? | … | … | 0.992 | ||
| 5 | 1 | ? | … | … | |||
| 6 | 1 | ? | … | … | |||
| 7 | 1 | ? | … | 1.000 | |||
| 8 | 1 | … | … | 0.964 | |||
| 9 | 1 | … | … | … | |||
| 10 | 1 | 0 | … | … | 0.975 | ||
| 11 | 1 | … | 0.900 | ||||
| 12 | 1 | … | … | ||||
| 13 | 1 | 0 | … | … | 0.289 | ||
| 14 | 1 | … | … | ||||
| 15 | 1 | … | … | ||||
| 16 | 1 | 0 | … | … | 0.436 | ||
| 17 | 1 | … | … | 0.963 | |||
| 18 | 1 | … | … | … | |||
| 19 | 1 | 0 | … | … | 0.114 | ||
| 20 | 1 | … | … | 0.999 | |||
| 21 | 1 | … | … | 0.906 | |||
| 22 | 1 | … | … | 0.999 | |||
| 23 | 1 | … | … | 0.950 | |||
| 24 | 1 | … | … | 0.993 | |||
| 25 | 1 | … | … | … | |||
| 26 | 1 | … | … | … | |||
| 27 | 1 | … | … | … | |||
| 28 | 1 | 0 | … | … | 0.853 | ||
| 29 | 1 | … | … | ||||
| 30 | 1 | … | … | ||||
| 31 | 1 | 0 | … | … | 0.987 | ||
| 32 | 1 | … | … | ||||
| 33 | 1 | … | … | ||||
| 34 | 1 | 0 | … | … | 0.977 | ||
| 35 | 1 | … | … | … | |||
| 36 | 1 | … | … | … | |||
| 37 | 1 | … | … | … | |||
| 38 | 1 | … | … | 1.000 | |||
| 39 | 1 | … | … | … | |||
| 40 | 1 | … | … | … | |||
| 41 | 1 | … | … | 1.000 | |||
| 42 | 1 | … | … | … | |||
| 43 | 1 | … | … | … | |||
| 44 | 1 | … | … | 0.843 | |||
| 45 | 1 | … | … | … | |||
| 46 | 1 | … | … | … | |||
| 47 | 1 | … | … | … | |||
| 48 | 1 | … | … | … | |||
| 49 | 1 | … | … | … | |||
| 50 | 1 | … | … |
| Peak # | Frequency | Amplitude | Linewidth | Height | |||
| (Hz) | (ppm) | (Hz) | (ppmHz) | ||||
| 51 | 1 | 0 | … | … | 0.772 | ||
| 52 | 1 | … | … | ||||
| 53 | 1 | … | … | ||||
| 54 | 1 | … | … | … | |||
| 55 | 1 | … | … | … | |||
| 56 | 1 | 0 | … | … | 0.821 | ||
| 57 | 1 | … | … | … | |||
| 58 | 1 | … | … | … | |||
| 59 | 1 | … | … | 0.997 | |||
| 60 | 1 | 0 | … | … | 0.124 | ||
| 61 | 1 | … | … | … | |||
| 62 | 1 | … | … | … | |||
| 63 | 1 | … | … | … | |||
| 64 | 1 | 0 | … | … | 0.872 | ||
| 65 | 1 | … | … | … | |||
| 66 | 1 | … | … | ||||
| 67 | 1 | 0 | … | … | 0.761 | ||
| 68 | 1 | … | … | ||||
| 69 | 1 | … | … | ||||
| 70 | 1 | 0 | … | … | 0.689 | ||
| 71 | 1 | … | … | ||||
| 72 | 1 | … | … | ||||
| 73 | 1 | 0 | … | … | 0.903 | ||
| 74 | 1 | … | … | 0.996 | |||
| 75 | 1 | … | … | … | |||
| 76 | 1 | … | … | 0.966 | |||
| 77 | 1 | … | … | … | |||
| 78 | 1 | 0 | … | … | 0.783 | ||
| 79 | 1 | … | … | 0.998 | |||
| 80 | 1 | … | … | 0.993 | |||
| 81 | 1 | … | … | ||||
| 82 | 1 | … | 1.000 | ||||
| 83 | 1 | 0 | … | 0.165 | |||
| 84 | 1 | … | … | ||||
| 85 | 1 | … | … | ||||
| 86 | 1 | … | … | ||||
| 87 | 1 | … | … | ||||
| 88 | 1 | 0 | … | … | 0.545 | ||
| 89 | 1 | … | 0.781 | ||||
| 90 | 1 | … | … | 0.997 | |||
| 91 | 1 | 0 | … | … | 0.793 | ||
| 92 | 1 | … | … | … | |||
| 93 | 1 | … | … | ||||
| 94 | 1 | … | 0.998 | ||||
| 95 | 1 | … | 0.999 | ||||
| 96 | 1 | … | 1.000 | ||||
| 97 | 1 | … | 0.992 |
| Peak # | Frequency | Amplitude | Linewidth | Height | |||
| (Hz) | (ppm) | (Hz) | (ppmHz) | ||||
| 0 | 0 | 0 | … | 1.000 | |||
| 1 | 0 | 0 | … | … | |||
| 2 | 0 | 0 | … | … | |||
| 3 | 0 | 0 | … | … | |||
| 4 | 0 | 0 | … | … | |||
| 5 | 0 | 0 | … | … | |||
| 6 | 0 | 0 | … | … | |||
| 7 | 0 | 0 | … | 1.000 | |||
| 0 | 2 | 0 | … | 0.797 | |||
| 1 | 2 | 0 | … | … | |||
| 2 | 2 | 0 | … | … | |||
| 3 | 2 | 0 | … | … | |||
| 4 | 2 | 0 | … | … | |||
| 5 | 2 | 0 | … | … | |||
| 6 | 2 | 0 | … | … | |||
| 7 | 2 | 0 | … | … | |||
| 0 | 3 | 0 | … | … | |||
| 1 | 3 | 0 | … | … | |||
| 2 | 3 | 0 | … | 1.000 |
| Peak # | Frequency | Amplitude | Linewidth | Height | |||
| (Hz) | (ppm) | (Hz) | (ppmHz) | ||||
| 0 | 1 | ? | … | … | 0.985 | ||
| 1 | 1 | ? | … | … | 0.995 | ||
| 2 | 1 | ? | … | … | 0.999 | ||
| 3 | 1 | ? | … | … | 0.975 | ||
| 4 | 1 | ? | … | … | 0.988 | ||
| 5 | 1 | ? | … | … | 0.998 | ||
| 6 | 1 | … | … | 0.993 | |||
| 7 | 1 | 0 | … | … | 0.998 | ||
| 8 | 1 | … | … | 0.993 | |||
| 9 | 1 | … | … | … | |||
| 10 | 1 | 0 | … | … | |||
| 11 | 1 | ? | … | … | |||
| 12 | 1 | 0 | … | … | |||
| 13 | 1 | … | 0.993 | ||||
| 14 | 1 | 0 | … | … | 0.861 | ||
| 15 | 1 | … | … | 0.952 | |||
| 16 | 1 | … | … | 0.957 | |||
| 17 | 1 | 0 | … | … | 0.980 | ||
| 18 | 1 | 0 | … | … | 0.984 | ||
| 19 | 1 | … | … | 0.561 | |||
| 20 | 1 | 0 | … | … | 0.921 | ||
| 21 | 1 | … | … | 0.799 | |||
| 22 | 1 | 0 | … | … | 0.979 | ||
| 23 | 1 | … | 0.635 | ||||
| 24 | 1 | 0 | … | … | … | ||
| 25 | 1 | … | 0.492 | ||||
| 26 | 1 | … | … | ||||
| 27 | 1 | 0 | … | … | |||
| 28 | 1 | … | … | … | |||
| 29 | 1 | … | … | ||||
| 30 | 1 | 0 | … | … | … | ||
| 31 | 1 | … | … | 0.990 | |||
| 32 | 1 | … | … | 0.981 | |||
| 33 | 1 | 0 | … | … | 0.843 | ||
| 34 | 1 | … | … | 0.989 | |||
| 35 | 1 | … | … | … | |||
| 36 | 1 | 0 | … | … | 0.397 | ||
| 37 | 1 | … | … | 0.626 | |||
| 38 | 1 | 0 | … | … | … | ||
| 39 | 1 | … | … | 0.764 | |||
| 40 | 1 | … | … | … | |||
| 41 | 1 | 0 | … | … | … | ||
| 42 | 1 | … | … | … | |||
| 43 | 1 | … | … | … | |||
| 44 | 1 | 0 | … | … | … | ||
| 45 | 1 | … | … | ||||
| 46 | 1 | … | … | ||||
| 47 | 1 | 0 | … | … | |||
| 48 | 1 | … | … | … | |||
| 49 | 1 | … | … | 1.000 | |||
| 50 | 1 | 0 | … | … | 1.000 |
| Peak # | Frequency | Amplitude | Linewidth | Height | |||
| (Hz) | (ppm) | (Hz) | (ppmHz) | ||||
| 51 | 1 | 0 | … | … | 0.978 | ||
| 52 | 1 | … | … | 0.987 | |||
| 53 | 1 | … | … | … | |||
| 54 | 1 | 0 | … | … | … | ||
| 55 | 1 | … | … | 0.999 | |||
| 56 | 1 | … | … | … | |||
| 57 | 1 | 0 | … | … | … | ||
| 58 | 1 | … | … | … | |||
| 59 | 1 | … | … | ||||
| 60 | 1 | 0 | … | … | |||
| 61 | 1 | … | … | ||||
| 62 | 1 | … | … | … | |||
| 63 | 1 | 0 | … | … | … | ||
| 64 | 1 | … | … | … | |||
| 65 | 1 | … | … | … | |||
| 66 | 1 | 0 | … | … | 0.998 | ||
| 67 | 1 | … | … | … | |||
| 68 | 1 | 0 | … | … | 0.998 | ||
| 69 | 1 | 0 | … | … | 0.987 | ||
| 70 | 1 | … | … | … | |||
| 71 | 1 | 0 | … | … | … | ||
| 72 | 1 | … | … | 0.964 | |||
| 73 | 1 | … | … | ||||
| 74 | 1 | 0 | … | … | |||
| 75 | 1 | … | … | ||||
| 76 | 1 | … | … | ||||
| 77 | 1 | 0 | … | … | |||
| 78 | 1 | … | … | ||||
| 79 | 1 | … | … | … | |||
| 80 | 1 | 0 | … | … | 0.817 | ||
| 81 | 1 | … | … | 0.998 | |||
| 82 | 1 | 0 | … | … | 0.999 | ||
| 83 | 1 | … | … | 0.985 | |||
| 84 | 1 | 0 | … | 0.808 | |||
| 85 | 1 | … | … | ||||
| 86 | 1 | … | 0.995 | ||||
| 87 | 1 | 0 | … | … | |||
| 88 | 1 | … | … | … | |||
| 89 | 1 | 0 | … | … | 0.998 | ||
| 90 | 1 | 0 | … | 0.999 | |||
| 91 | 1 | … | 0.996 |
| Peak # | Frequency | Amplitude | Linewidth | Height | |||
|---|---|---|---|---|---|---|---|
| (Hz) | (ppm) | (Hz) | (ppmHz) | ||||
| 0 | 0 | 0 | … | … | |||
| 1 | 0 | 0 | … | … | |||
| 2 | 0 | 0 | … | … | |||
| 3 | 0 | 0 | … | … | |||
| 4 | 0 | 0 | … | … | |||
| 5 | 0 | 0 | … | … | |||
| 6 | 0 | 0 | … | … | |||
| 0 | 2 | 0 | … | 1.000 | |||
| 1 | 2 | 0 | … | … | |||
| 2 | 2 | 0 | … | … | |||
| 3 | 2 | 0 | … | … | |||
| 4 | 2 | 0 | … | … | |||
| 5 | 2 | 0 | … | … | |||
| 6 | 2 | 0 | … | … | |||
| 0 | 3 | 0 | … | 0.309 | |||
| 1 | 3 | 0 | … | … | |||
| 2 | 3 | 0 | … | … | |||
| 3 | 3 | 0 | … | … | |||
| 4 | 3 | 0 | … | 1.000 | |||
| 5 | 3 | 0 | … | 0.968 |
| Peak # | Frequency | Amplitude | Linewidth | Height | |||
| (Hz) | (ppm) | (Hz) | (ppmHz) | ||||
| 0 | 1 | … | 0.954 | ||||
| 1 | 1 | … | 0.892 | ||||
| 2 | 1 | … | 0.999 | ||||
| 3 | 1 | … | 1.000 | ||||
| 4 | 1 | … | … | ||||
| 5 | 1 | … | 1.000 | ||||
| 6 | 1 | … | 0.960 | ||||
| 7 | 1 | … | … | 0.999 | |||
| 8 | 1 | … | … | … | |||
| 9 | 1 | … | … | … | |||
| 10 | 1 | … | … | … | |||
| 11 | 1 | … | … | … | |||
| 12 | 1 | … | … | ||||
| 13 | 1 | … | … | ||||
| 14 | 1 | … | … | 1.000 | |||
| 15 | 1 | … | … | 1.000 | |||
| 16 | 1 | … | … | 1.000 | |||
| 17 | 1 | … | … | … | |||
| 18 | 1 | … | 1.000 | ||||
| 19 | 1 | … | … | ||||
| 20 | 1 | … | … | ||||
| 21 | 1 | … | 1.000 | ||||
| 22 | 1 | … | … | … | |||
| 23 | 1 | … | … | 1.000 | |||
| 24 | 1 | … | … | … | |||
| 25 | 1 | … | … | 0.999 | |||
| 26 | 1 | … | … | 0.002 | |||
| 27 | 1 | … | … | … | |||
| 28 | 1 | … | … | ||||
| 29 | 1 | … | … | ||||
| 30 | 1 | … | … | ||||
| 31 | 1 | … | … | ||||
| 32 | 1 | … | … | … | |||
| 33 | 1 | … | … | 0.996 | |||
| 34 | 1 | … | … | … | |||
| 35 | 1 | … | … | … | |||
| 36 | 1 | … | … | … | |||
| 37 | 1 | … | … | ||||
| 38 | 1 | … | … | ||||
| 39 | 1 | … | … | … | |||
| 40 | 1 | … | … | … | |||
| 41 | 1 | … | … | 0.986 | |||
| 42 | 1 | … | … | 0.998 | |||
| 43 | 1 | … | … | ||||
| 44 | 1 | … | … | ||||
| 45 | 1 | … | 1.000 | ||||
| 46 | 1 | … | … | ||||
| 47 | 1 | … | 1.000 | ||||
| 48 | 1 | … | … | … | |||
| 49 | 1 | … | 1.000 | ||||
| 50 | 1 | … | 1.000 |
| Peak # | Frequency | Amplitude | Linewidth | Height | |||
| (Hz) | (ppm) | (Hz) | (ppmHz) | ||||
| 0 | 0 | 0 | … | 1.000 | |||
| 1 | 0 | 0 | … | … | |||
| 2 | 0 | 0 | … | … | |||
| 3 | 0 | 0 | … | … | |||
| 4 | 0 | 0 | … | … | |||
| 5 | 0 | 0 | … | … | |||
| 6 | 0 | 0 | … | … | |||
| 0 | 2 | 0 | … | … | |||
| 1 | 2 | 0 | … | … | |||
| 2 | 2 | 0 | … | … | |||
| 3 | 2 | 0 | … | … | |||
| 4 | 2 | 0 | … | … | |||
| 5 | 2 | 0 | … | 1.000 | |||
| 0 | 3 | 0 | … | 1.000 | |||
| 1 | 3 | 0 | … | 1.000 | |||
| 2 | 3 | 0 | … | 1.000 |