Internet comments as a barometer of public opinion
Abstract
Social susceptibility is defined and analyzed using data from CNN news website. The current models of opinion dynamics, voting, and herding in closed communities are extended, and the community’s response to the injection of a group with predetermined and permanent opinions is calculated. A method to estimate the values of possible response in Internet communities that follow a specific developing subject is developed. The level of social influence in a community follows from the statistics of responses (”like” and ”dislike” votes) to the comments written by the members of the same community. Three real cases of developing news stories are analyzed. We suggest that Internet comments may predict the level of social response similar to a barometer that predicts the intensity of a coming storm in still calm environment.
In recent years, governments throughout the Arab world have been overthrown by uprisings that followed the self-immolation of a single person, Mohamed Bouazizi. Similarly, the Occupy Wall Street protest movement was triggered by a single call to action via a social network. Such cases raise an important question: How can an individual possessing no special reputation or authority mobilize an entire community by a single call to stand and fight, while large and professionally organized companies may remain unnoticed? Answering this question will help estimating the appropriate timing and the required size for an initial group to evoke a large-scale social response.
A clear and strong display of personal opinions affects the decision-making processes of others. This phenomenon of social influence may be either positive or negative. Positive social influence facilitates the correlated behavior called herdingBanerjee (1992). Herding contributes significantly to the formation of market pricesCont and Bouchaud (2000)Sznajd-Weron and Weron (2002), the results of artificial market experimentsSalganik et al. (2006)Borghesi and Bouchaud (2007)Muchnik et al. (2013), traffic flowsHelbing (2001), voting outcomesDurrett et al. (2012)Fernandez-Gracia et al. (2014), and dynamics of social networksSznajd-Weron and Sznajd (2000)Galam (2003)Castellano et al. (2009).
Acute herding phenomena, such as social revolutions or financial crises, are extremely difficult to predict, though they are evident when they occurSornette (2003). A parameter, such as temperature in phase transitions, is required to estimate the stability of a community’s opinion, i.e. the potential of a small perturbation to culminate in abrupt changes in opinion dynamics. Therefore, to understand the population dynamics prior to a possible transition, it is important to develop a quantitative analysis of herding as a function of time.
Internet communities are of special interest for the analysis of the herding phenomenon. Individual opinions are widely exposed in binary form of ”like” and ”dislike” votes (”likes” and ”dislikes”) over Internet news websites and via social networks. The data span any important event and expose millions of opinionsBond et al. (2012). Simultaneous analysis of a developing news story and the corresponding herding in relevant Internet communities may provide a unique opportunity to study the opinion dynamics in a population as it approaches a critical point and becomes unstable. To the best of our knowledge, the definition and evaluation of the temporal dynamics of herding phenomenon in Internet communities remains a challenge.
In this Article, we estimate the social influence as a function of time in Internet communities that followed any of the following three news stories reported on the CNN website: the Zimmerman trial, Iran Nuclear Negotiations, and the US government shutdown of 2013. We show continuous herding dynamics in all three cases and significant amplification of social influence near the verdict announcement in the Zimmerman case. The method we propose allows for the quantitative estimation of a community response to the injection of a group of non-responsive individuals with predefined opinion. This quantitative analysis is possible due to our novel approach to herding as the conditional probabilities to agree or disagree with other people’s opinions. This approach differs from the generally accepted treatment of herding as a topology of social interactions’ networkCont and Bouchaud (2000).
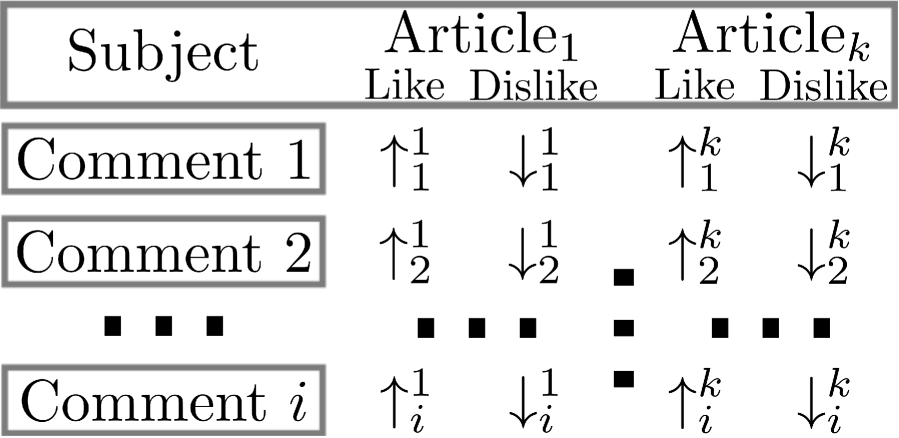
To estimate social susceptibility, we use a specific type of Internet news discussion. Some Internet news websites provide a commentary section where readers can comment and vote (i.e., like or dislike) other readers’ comments (see Fig. 1). A reader can usually vote for any number of comments, with the restriction of one vote per comment. These data constitute a natural large scale social experiment where the population responds to some external signal (i.e., a comment). A comment, however, is not completely external, but rather created by a community member who responds to the comments of other community members. Consequently, statistics of Internet comments and responses can be used as a measure for mean field opinion dynamics of the corresponding community.
Consider a large population of individuals who are debating on a subject and continuously voting in favor of (up ) or against it (down ). The debate process implies that individuals may change their vote in time. In our model, the interaction between individual and any other randomly selected individual is expressed by the fact that the probability per contact of individual to vote down () depends on the vote of individual . This conditional probability is given by Feigel (2008):
| (1) |
where is the vote of individual ( for up vote and for down vote) and parameter () is the probability per contact of individual voting down given individual is voting up (down), respectively, regardless of the vote of individual prior to the interaction with individual .
In a well mixed homogeneous population, where the number of contacts per individual is and , the probability of an individual to vote down is
| (2) |
Defining as the mean fraction of individuals who vote up, and noting that mean field assumptions imply , Eq. (2) may be written as
| (3) |
resulting in a steady state expression for (the ”public opinion”) as a function of conditional probabilities
| (4) |
In order to measure social influence, consider a population of individuals characterized by , which is perturbed by applying the specific value of mean vote to a fraction of the population. The new mean vote of the population is given by
| (5) |
The response function of the population is defined by the fraction of players who flip votes in response to the perturbation, i.e. outside the perturbation group. An explicit expression for is obtained using Eq. (5)
| (6) |
where . Obviously, the population response function is zero for and for .
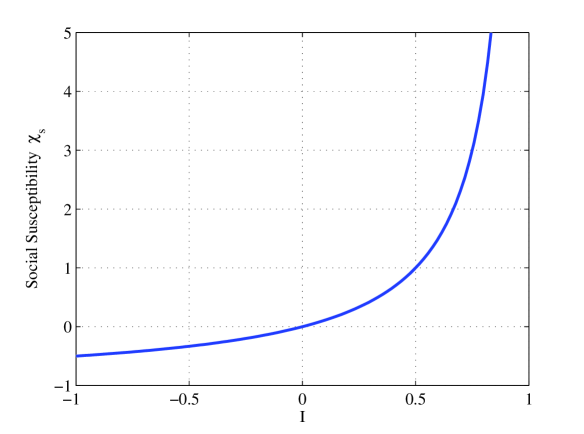
The herding parameter is a measure of the social influence of one individual on others, because is the difference of conditional probabilities for correlated and anti-correlated behaviors, see 1. It is similar to herding or percolation parameter from Cont and Bouchaud (2000). However, since our definition of the herding parameter accounts for both positive and negative social influence, it is better suited for analyzing opinion dynamics in binary vote communities.
The social susceptibility , is defined as
| (7) |
and is the average size of a group whose members follow the change of opinion of a single member (not including the initiating member itself). The size of the perturbation group required to convert a population to the mean vote of the perturbed group (including the polarized cases ) is obtained by substituting in Eq. (6) and using Eq. (7)
| (8) |
where .
Conditional probabilities define herding , which in turn defines the social stability of the community. To calculate conditional probabilities and as a function of likes and dislikes votes for comment of article (see Fig. 1), we assume that voters’ and commentators’ populations are equivalent and that the number of comments and votes is large enough to apply mean field assumption. Consequently, the probabilities for a commentator and a voter to be in favor of the article subject are both equal to . Therefore, the comments should consist of two groups with opposite opinions and relative sizes and , respectively.
According to the definition of the conditional probabilities (Eq. 1), the ratio between likes and all responses (likes and dislikes) for a positive comment (to ) is . However, this ratio for a negative comment (to ) equals since expressing a like vote for a negative comment is equivalent to expressing a dislike vote for the article subject commented upon. Consequently, the probability of a dislike vote for a comment is different from the probability to dislike subject , as defined in (Eq. 3). Therefore, the probability of a dislike vote for a comment is:
| (9) |
The result is invariant under the transformation , reflecting the uncertainty regarding the opinion of the Internet article itself. Hence, the division of the comments into two groups with contrasting opinions does not reveal the opinions themselves. Since is invariant under the transformation , we arbitrarily chose . An interesting consequence of Eq. (9) is that , i.e. comments cannot include only dislikes because the community cannot dislike its own opinion.
Calculating of , and of the community proceeds through iterations. First, all comments are sorted by their like vote fraction. Then, at each step , the comments are divided into two groups with ratio of and according to their like vote fraction, where group receives the comments with the highest like vote fraction and group receives all other comments. The population characteristic parameters and are then calculated according to:
| (10) |
A new population mean vote is calculated using the values of and :
| (11) |
The process is repeated until the convergence of , and .
| Article’s topic | Publish Date | |||||
|---|---|---|---|---|---|---|
| 1 | Zimmerman Trial | 24/06/13 | 0.14 | 0.53 | 0.77 | 0.63 |
| 2 | Zimmerman Trial | 05/07/13 | 0.12 | 0.38 | 0.84 | 0.34 |
| 3 | Zimmerman Trial | 12/07/13 | 0.08 | 0.47 | 0.87 | 0.64 |
| 4 | Zimmerman Trial | 13/07/13 | 0.04 | 0.57 | 0.91 | 1.10 |
| 5 | Zimmerman Trial | 17/07/13 | 0.04 | 0.67 | 0.89 | 1.70 |
| 6 | Zimmerman Trial | 25/07/13 | 0.06 | 0.77 | 0.79 | 2.39 |
| 7 | Iran Nuclear Program | 25/10/13 | 0.16 | 0.58 | 0.72 | 0.74 |
| 8 | Iran Nuclear Program | 23/11/13 | 0.15 | 0.56 | 0.75 | 0.70 |
| 9 | Iran Nuclear Program | 24/11/13 | 0.15 | 0.59 | 0.73 | 0.78 |
| 10 | US Govt. Shutdown | 01/10/13 | 0.16 | 0.51 | 0.75 | 0.53 |
| 11 | US Govt. Shutdown | 02/10/13 | 0.13 | 0.51 | 0.79 | 0.63 |
| 12 | US Govt. Shutdown | 02/10/13 | 0.09 | 0.48 | 0.85 | 0.62 |
The formalism of the analysis of the social influence presented above is applied to news articles published on the CNN website that discuss three different topics. The first story includes six articles, published between June 24th and July 25th, 2013, covering the George Zimmerman Trial Zim (a, b, c, d, e, f). These articles cover the legal proceeding, the verdict, and the post-verdict jurors’ opinions about the trial. The second story includes three articles, published between October 25th and November 25th, 2013, covering the negotiations and signing of the Geneva interim agreement on the Iranian nuclear program Ira (a, b, c). The third story includes three articles, published on October 1st and 2nd, 2013, covering the US federal government shutdown of that year Shu (a, b, c). These articles cover the first day of the shutdown and the White House failing efforts to end it. The results of these analyses are presented in Table 1 and in Fig. 3.
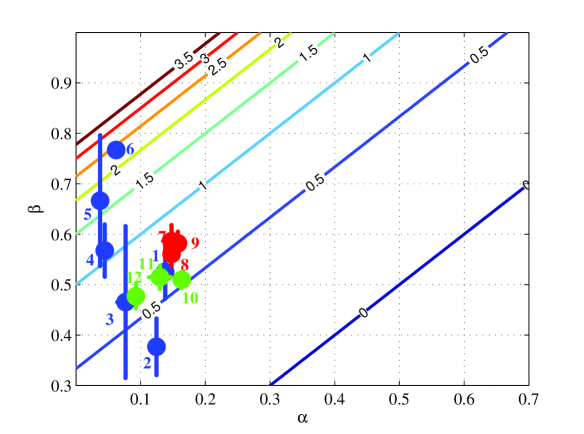
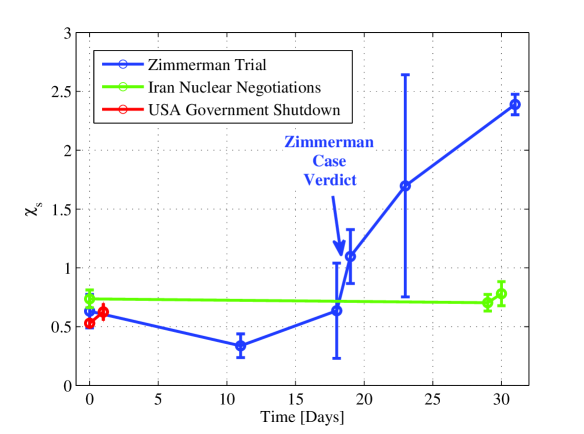
All three cases exhibit a continuous dynamics in space, as shown in Fig. 3. This result is interesting considering that the analysis is applied to different articles, covering different stories, spanning from days to months. It indicates a slow change of opinions in the community.
In the Iran Nuclear Program and US Government shutdown cases, the population’s characteristic parameters are constant, although they correspond to different CNN articles and, in the case of the Iran Nuclear Program, span one month. This result may also indicate the absence of special events during the observation period.
The social susceptibility level in the Zimmerman trial case changes near the verdict announcement. In the period prior to the verdict day (points 1-3 in Fig. 3), the level of social susceptibility in the population remains almost constant and similar to the social susceptibility in the other cases (i.e., ), despite the changes in and . From the verdict day on (points 4-6), the social susceptibility in the community grows rapidly and the population approaches the singular point . It is out of the scope of this work to interpret social phenomena, though the results demonstrate that our method allows to observe the otherwise hidden herding level in a community together with its response to social triggers.
The limitations of our work include the absence of external force, i.e. government control, and lack of interaction topology constrains, such as the prevalence of near-neighbors interactions. Omitting topological constraints seems to be justified in Internet communities. The same is true regarding forces that shape opinion or add weight to some opinion, such as government control or mass media. We assume that the Internet is still a free zone. The model can be extended to include such force, though there is no clear way to quantify it.
Shortly after the data collection phase for this work was completed, the CNN website has changed its comments policy and the dislike count per comment is no longer displayed. This change made the CNN website articles and comments unsuitable for the above comment analysis procedure, since the main assumption underlying our model, i.e., that both like and dislike vote counts are available to all individuals in the population, is no longer valid. This study demonstrates the potential of both like/dislike votes in estimating the social state of a community and may contribute to the evolving formation of the Internet news format.
To conclude, the developed tools for social influence in Internet communities reveal the previously hidden level of herding and social influence as a function of time in populations. In addition, this work provides a measure for the stability of public opinion in a community and for the size of a group capable to cause critical change in average opinion. The presented method can be compared with other methods and can be extended to other fields such as financial marketsOster and Feigel (2015). Therefore, this work enables an intriguing comparison of the herding in the same community calculated from different sources, such as Internet news and financial markets.
References
- Banerjee (1992) A. Banerjee, Quant. J. of Econ. 107, 797 (1992).
- Cont and Bouchaud (2000) R. Cont and J. Bouchaud, MacroEcon. Dyn. 4, 170 (2000).
- Sznajd-Weron and Weron (2002) K. Sznajd-Weron and R. Weron, Int. J. of Mod. Phys. C 13, 115 (2002).
- Salganik et al. (2006) M. J. Salganik, P. S. Dodds, and D. J. Watts, Science 311, 854 (2006).
- Borghesi and Bouchaud (2007) C. Borghesi and J.-P. Bouchaud, Quality & Quantity 41, 557 (2007).
- Muchnik et al. (2013) L. Muchnik, S. Aral, and S. J. Taylor, Science 341, 647 (2013).
- Helbing (2001) D. Helbing, Rev. of Mod. Phys. 73, 1067 (2001).
- Durrett et al. (2012) R. Durrett, J. P. Gleeson, A. L. Lloyd, P. J. Mucha, F. Shi, D. Sivakoff, J. E. S. Socolar, and C. Varghese, Proc. of Nat. Acad. of Science 109, 3682 (2012).
- Fernandez-Gracia et al. (2014) J. Fernandez-Gracia, K. Suchecki, J. J. Ramasco, M. San Miguel, and V. M. Eguiluz, Phys. Rev. Lett. 112 (2014).
- Sznajd-Weron and Sznajd (2000) K. Sznajd-Weron and J. Sznajd, Int. J. of Mod. Phys. C 11, 1157 (2000).
- Galam (2003) S. Galam, Phys. A: Stat. Mech. 320, 571 (2003).
- Castellano et al. (2009) C. Castellano, S. Fortunato, and V. Loreto, Rev. of Mod. Phys. 81, 591 (2009).
- Sornette (2003) D. Sornette, Phys. Reports 378, 1 (2003).
- Bond et al. (2012) R. M. Bond, C. J. Fariss, J. J. Jones, A. D. Kramer, C. Marlow, J. E. Settle, and J. H. Fowler, Nature 489, 295 (2012).
- Feigel (2008) A. Feigel, J. of Theor. Biol. 254, 768 (2008).
- Zim (a) Zimmerman opening statements: Expletives and a knock-knock joke, URL http://edition.cnn.com/2013/06/24/justice/zimmerman-trial/.
- Zim (b) In zimmerman trial, it’s a jury of millions, URL http://edition.cnn.com/2013/07/05/justice/zimmerman-jury-millions/.
- Zim (c) After days of court drama, jurors set to resume deliberating zimmerman’s fate, URL http://edition.cnn.com/2013/07/12/justice/zimmerman-trial/.
- Zim (d) George zimmerman found not guilty of murder in trayvon martin’s death, URL http://edition.cnn.com/2013/07/13/justice/zimmerman-trial/.
- Zim (e) Exclusive: Juror pushes for new laws following zimmerman trial, URL http://edition.cnn.com/2013/07/17/justice/zimmerman-verdict-aftermath/.
- Zim (f) Zimmerman juror to abc: He ’got away with murder’, URL http://edition.cnn.com/2013/07/25/justice/zimmerman-juror-b29-interview/.
- Ira (a) Nuclear group: Time iran would need to make uranium for a bomb ’too short’, URL http://edition.cnn.com/2013/10/25/world/meast/iran-nuclear-report/.
- Ira (b) Obama: Iran nuclear deal limits ability to create nuclear weapons, URL http://edition.cnn.com/2013/11/23/world/meast/iran-nuclear-talks-geneva/.
- Ira (c) 3-decade gridlock broken: The nuclear deal with iran in geneva, URL http://edition.cnn.com/2013/11/24/world/meast/iran-nuclear-deal/.
- Shu (a) Latest house bid fails as bitter back-and-forth over government shutdown rages, URL http://edition.cnn.com/2013/10/01/politics/government-shutdown/.
- Shu (b) Progress? obama invites congressional leaders for talks on shutdown.
- Shu (c) No end in sight to government shutdown after ’unproductive’ white house meeting, URL http://edition.cnn.com/2013/10/02/politics/government-shutdown/.
- Oster and Feigel (2015) E. Oster and A. Feigel, submitted (2015).
I Supplementary Material
Here we include the detailed procedure to obtain the social influence parameter from Internet discussion data. The algorithm’s input are two vectors containing the number of likes and dislikes each comments received, and , respectively (see Fig. s1). The length of these two vectors is the number of comments , usually few thousands. The output is the resulted population parameters and and their error margin.
The initial value of is taken using the probability for a voter to be in favor of a comment - , which is a measurable parameter given by the ratio of like votes to the total votes:
| (12) |
Taking into account (9) and :
| (13) |
The initial value is always chosen to be .
Then one proceeds:
-
1.
Initialization
-
(a)
Choose value for the number of voters’ threshold: . Start with .
-
(b)
From now on, consider only comments above the threshold: .
-
(c)
Define the initial value of the mean vote by solving the equation:
Take only the solution .
-
(a)
-
2.
Classification of comments
-
(a)
Order the comments according to their like vote fraction: .
-
(b)
Divide the comments into two groups with ratio of and according to their like vote fraction, i.e., for group take the comments with the highest like vote fraction and for group take all other comments.
-
(c)
Calculate the population characteristic parameters and :
-
(d)
Calculate the new population mean vote using the values of and :
-
(e)
Repeat stages (a)-(d) until the values of and converge.
-
(a)
-
3.
Analyzing
-
(a)
Increase the threshold for the number of voters by 1, and repeat stages 1-2.
-
(b)
End when the number of comments above the threshold is less than 50.
-
(c)
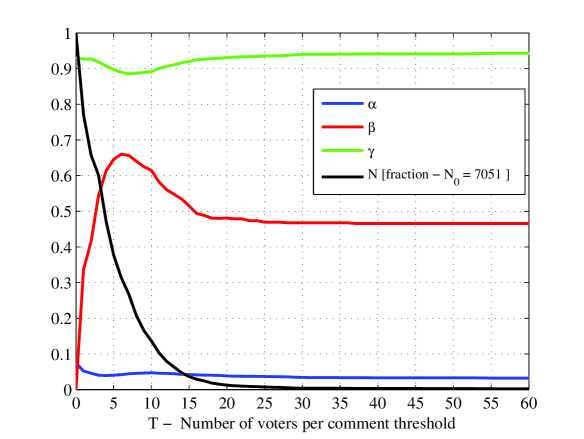
The resulted and are the weighted mean over all permitted thresholds:
-
(d)
The resulting and are the equivalent standard deviations over all permitted thresholds.
-
(a)
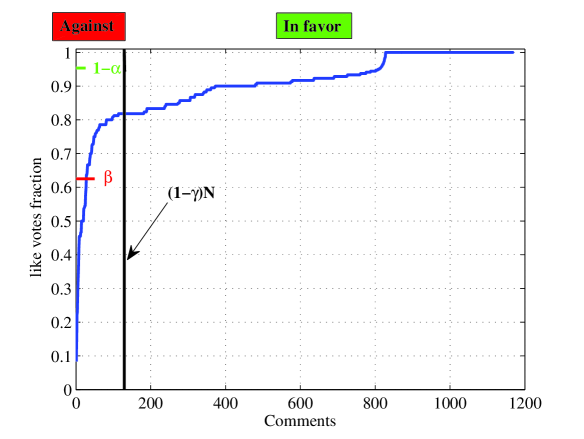
Fig. 5 presents the like vote fraction distribution for the comments of the CNN article announcing the not guilty verdict in the Zimmerman trail (point 4 in the article), for T = 10. The concept of the classification of comments’ procedure and the way the population parameters and are extracted can be well understood in this presentation. For sensitivity of the model to the value of the threshold see Fig. 6.