Radio monitoring of the hard state jets in the 2011 outburst of MAXI J1836194
Abstract
MAXI J1836194 is a Galactic black hole candidate X-ray binary that was discovered in 2011 when it went into outburst. In this paper, we present the full radio monitoring of this system during its ‘failed’ outburst, in which the source did not complete a full set of state changes, only transitioning as far as the hard intermediate state. Observations with the Karl G. Jansky Very Large Array (VLA) and Australia Telescope Compact Array (ATCA) show that the jet properties changed significantly during the outburst. The VLA observations detected linearly polarised emission at a level of 1% early in the outburst, increasing to 3% as the outburst peaked. High-resolution images with the Very Long Baseline Array (VLBA) show a 15 mas jet along the position angle , in agreement with the electric vector position angle found from our polarisation results (), implying that the magnetic field is perpendicular to the jet. Astrometric observations suggest that the system required an asymmetric natal kick to explain its observed space velocity. Comparing quasi-simultaneous X-ray monitoring with the 5 GHz VLA observations from the 2011 outburst shows an unusually steep hard-state radio/X-ray correlation of , where and denote the radio and X-ray luminosities, respectively. With ATCA and Swift monitoring of the source during a period of re-brightening in 2012, we show that the system lay on the same steep correlation. Due to the low inclination of this system, we then investigate the possibility that the observed correlation may have been steepened by variable Doppler boosting.
keywords:
X-rays: binaries – radio continuum: stars – stars: individual (MAXI J1836-194) – ISM: jets and outflows1 Introduction
Relativistic jets are observed from actively-accreting black holes on all scales, from stellar-mass black holes in low-mass X-ray binary (LMXB) systems to supermassive black holes at the centres of galaxies. There is a clear but poorly understood relationship between the morphology and spectrum of the jets and the structure of the accretion flow (e.g. Fender, 2010; Gallo, 2010). LMXBs provide ideal laboratories to study jets and their connection to the accretion flow as they evolve through their full duty cycles on humanly-observable timescales. Spending the majority of their lifetimes in a low-luminosity quiescent state, LMXBs occasionally go through a much brighter outburst phase (the result of increased accretion onto the central compact object) where the jet properties change significantly as the system transitions through a number of canonical X-ray states (see Belloni et al. 2011 for a full review of X-ray spectral states).
In a typical outburst, LMXBs are initially observed in the hard state (HS), which is associated with persistent radio emission from a steady, partially self-absorbed, compact jet (Dhawan et al., 2000; Corbel et al., 2000; Stirling et al., 2001) that has a flat or inverted, optically-thick radio spectrum (, where ; Fender 2001). As the outburst progresses, the accretion rate increases and the system may transit through a number of intermediate states as it approaches the soft state. During the transition to the full soft state the jet emission transforms into discrete, bright, relativistically-moving knots with an optically-thin radio spectrum (Corbel et al., 2004; Fender et al., 2004). The compact jet is quenched by at least 2.5 orders of magnitude (Fender et al., 1999a; Coriat et al., 2011; Russell et al., 2011b) as the jet spectral break moves to lower frequencies (Corbel et al. 2013b; Russell et al. 2013b; Russell et al. 2014a) and particle acceleration seemingly occurs at different locations within the jet (Russell et al., 2014a). At the end of the outburst, the X-ray luminosity decreases and the source transitions back to the hard state. In this reverse state transition the compact jet is gradually re-established (first switching on in the radio band and then the infrared/optical band; Miller-Jones et al. 2012; Corbel et al. 2013b; Kalemci et al. 2013), indicating the potential build up of particle accelerating structures increasingly closer to the black hole.
The processes that are responsible for launching the jet outflow are poorly understood. However, there exists a well-studied relationship between the radio and X-ray luminosities in hard state LMXBs, which has been observed for both individual sources (e.g. GX 3394; Hannikainen et al. 1998; Corbel et al. 2003, 2013b) and the entire sample of BH X-ray binaries (e.g. Gallo et al. 2003). Although recent work has cast some doubt over the universality of the relation (Gallo et al., 2014), it is generally described by two distinct power-law tracks in the radio/X-ray luminosity plane, an upper track and a lower, steeper, ‘radio-quiet’ track (Gallo et al., 2012; Coriat et al., 2011; Corbel et al., 2013b). The track followed by a given source does not appear to be connected to any property of the object (such as spin; Soleri & Fender 2011) and there is evidence for some individual sources transitioning between the two tracks as their X-ray luminosity fades (Coriat et al., 2011; Jonker et al., 2012; Ratti et al., 2012). It has also been suggested that this bimodal relationship may also exist in AGN, supporting the theory that the mechanisms responsible for extracting energy from the accretion flow are similar across the mass scale (King et al., 2013).
High resolution, very long baseline interferometry (VLBI) observations can reveal important information about the changing properties of the jet during an outburst. Directly imaging the jet can determine the orientation of the jet axis, the bulk motion and structure of the jet, and how these change with the evolving accretion flow. While discrete ejecta have been observed in a number of systems in outburst (e.g. Mirabel & Rodríguez, 1994; Tingay et al., 1995; Hjellming & Rupen, 1995; Fender et al., 1999b), the hard state compact jet has only been spatially resolved in two systems, GRS 1915105 (Dhawan et al., 2000) and Cygnus X1 (Stirling et al., 2001), both of which are not standard LMXBs. High-cadence observations of the discrete ejecta can determine their proper motions. Extrapolating backwards in time, the moment of launching may then be coupled to changes within the accretion flow to identify the mechanisms responsible for launching (Miller-Jones et al., 2012). Astrometric observations of a system over time may also allow for the proper motion of the system to be calculated, which can then be used to constrain the formation mechanism of black holes (for full discussion, see Miller-Jones, 2014, and references therein).
1.1 MAXI J1836194
MAXI J1836194 was discovered at the onset of its outburst in August 2011, triggering an intensive multiwavelength observing campaign. Classified as a black hole candidate due to its radio and X-ray properties (Strohmayer & Smith, 2011; Miller-Jones et al., 2011; Russell et al., 2011a; Reis et al., 2012; Russell et al., 2014b), MAXI J1836194 transitioned from the hard state (spectral states are defined by X-ray spectral and timing properties; Ferrigno et al., 2012) to the hard intermediate state (HIMS) on 2011 September 11. The outburst ‘failed’ to enter the full soft state, remaining in the HIMS (see Brocksopp et al. 2004 for further discussion on failed outbursts), reaching its softest point on September 16, following which it transitioned back to the hard state on September 28 and faded towards quiescence. In 2012 March, the system underwent a period of renewed activity (Krimm et al., 2012; Yang et al., 2012; Grebenev et al., 2013) before returning to quiescence by 2012 July 05 (Yang et al., 2012b). This low-inclination system (between 4∘ and 15∘; Russell et al. 2014b) is between 4 and 10 kpc away (Russell et al., 2014a) and has proven itself to be an ideal system in which to study the evolution of the radio jet due to its bright radio emission (Russell et al. 2013b; Russell et al. 2014a). In this paper we present results from an intensive VLA, ATCA and VLBA radio monitoring campaign of MAXI J1836194, which began during the early phase of the outburst (2011 September 3) and continued until the source became sun constrained (our last radio observation occurred on 2011 December 3). We also present ATCA and quasi-simultaneous Swift monitoring of the source during its 2012 re-flare. In particular, we will discuss the evolution of the polarised radio jet, the jet morphology, and the VLBI astrometry during the 2011 outburst, as well as the hard state radio/X-ray correlation as the system faded towards quiescence.
2 Observations
2.1 Radio observations
2.1.1 VLA
From 2011 September 3 through December 3, we conducted an intensive monitoring campaign on MAXI J1836194 with the Karl G. Jansky Very Large Array (VLA), under project code VLA/10B-218. We have previously presented the six epochs of VLA observations with simultaneous millimetre, mid-/near-infrared, optical and X-ray data (Russell et al. 2013b; Russell et al. 2014a). Here, we report the full 18 epochs of VLA radio observations covering the rise, transition to and from the HIMS, and subsequent decay of the 2011 outburst of MAXI J1836194. The VLA observations were taken every 2–5 days during the brighter phase of the outburst (September 3 – September 30) and every 1 – 2 weeks as the outburst decayed, until the final observation on 2011 December 3. The array was in its most-extended A configuration until September 12, in the AD move-configuration until September 18, and thereafter in the most-compact D configuration.
The observations were taken over a wide range of frequencies (between 1 and 43 GHz) with an integration time of 3 seconds for all observations prior to November 11, following which the data were taken with an integration time of 5 seconds. The lowest-frequency 1–2 GHz observations were recorded in two 512-MHz basebands, each containing eight 64-MHz sub-bands made up of sixty-four 1-MHz channels. All other frequencies were recorded in two 1024-MHz basebands comprised of eight 128-MHz sub-bands made up of sixty-four 2-MHz channels. Following standard data reduction procedures within the Common Astronomy Software Application (CASA; McMullin et al. 2007) the data were corrected for shadowing, instrumental issues, and radio frequency interference. 3C286 was used for bandpass and amplitude calibration, J14072827 was used as a polarisation leakage calibrator, and phase calibration was performed using the nearby ( away) compact source J18202528. Calibrated data were then imaged on a per-baseband basis using the multi-frequency synthesis algorithm within CASA and subjected to multiple rounds of self-calibration. To determine the flux density of the source, we fitted a point source to the target in the image plane (Stokes ) and standard VLA systematic errors were added. Stokes and were also measured at the position of the peak source flux in the lower-frequency (10 GHz) data (Table 1). At no epoch was the source observed to be significantly extended.
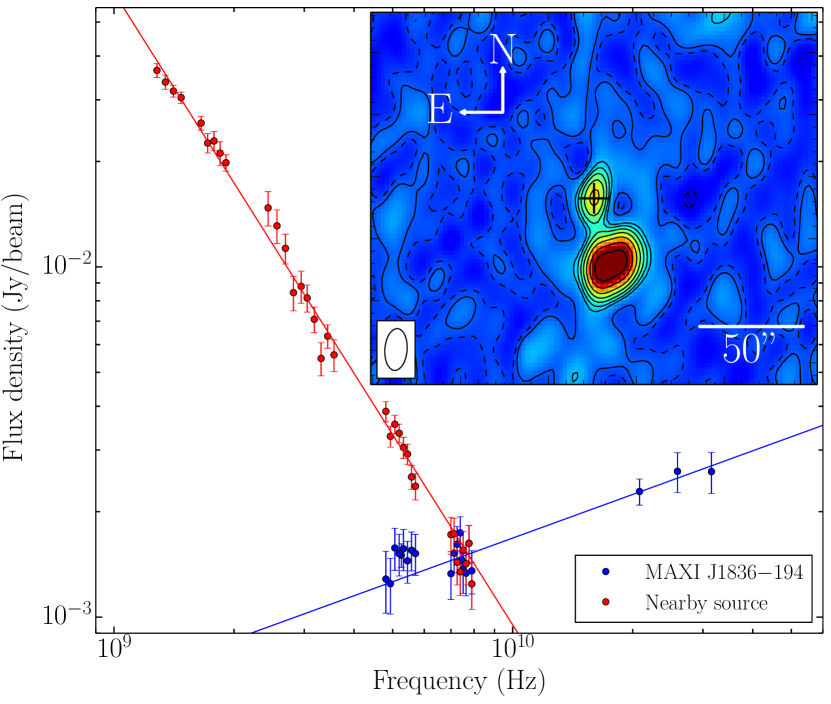
A nearby source is located to the south-west of MAXI J1836194 (30′′away; see Figure 1, inset). This unrelated, steep-spectrum source was not aligned with the jet axis and was not variable over the duration of the outburst. At times when the VLA was in its most compact D-configuration (for all observations after 2011 September 18), our low-frequency (4 GHz) VLA observations could not resolve the target from the confusing source. Therefore, where unresolved, our observations of MAXI J1836194 are contaminated by the nearby source. We must determine the spectrum of the unrelated object to estimate its contribution and then subtract from necessary observations. Using an epoch when MAXI J1836194 was faint (2011 November 01), we measured the brightness of the confusing source (Figure 1). At frequencies where we were unable to resolve the two sources from each other, we subtracted the expected MAXI J1836194 brightness (determined by fitting a power law to the higher frequencies) from the total spectrum to give an approximation of the unrelated source. Fitting the measured radio flux densities, , against frequency, , with a power law, we then estimate the spectrum of the nearby source and MAXI J1836194. The spectrum of MAXI J1836194 was well fit by a single power law at all epochs.
| Date | MJD | Frequency | Flux density | |||
|---|---|---|---|---|---|---|
| (UT) | (GHz) | (mJy) | (mJy beam-1) | (mJy beam-1) | ||
| 2012 Sep 03 | 55807.1 | 4.60 | 27.20.3 | 0.240.05 | -0.290.06 | 0.640.03 |
| 7.90 | 38.40.5 | 0.670.06 | -0.490.07 | |||
| 2011 Sep 05 | 55809.1 | 5.00 | 23.20.3 | 0.080.02 | -0.080.02 | 0.840.04 |
| 7.45 | 32.50.4 | 0.180.02 | -0.160.02 | |||
| 2011 Sep 07 | 55811.2 | 1.50 | 18.10.4 | – | – | 0.510.01 |
| 5.00 | 28.60.7 | 0.250.07 | -0.130.07 | |||
| 7.45 | 39.30.9 | 0.580.09 | -0.080.08 | |||
| 20.80 | 682 | – | – | |||
| 25.90 | 792 | – | – | |||
| 32.02 | 885 | – | – |
2.1.2 VLBA
| Date | MJD | Freq. | Flux | Beam | Major | Minor | Position |
|---|---|---|---|---|---|---|---|
| 2011 | (GHz) | density | size | axis | axis | Angle | |
| (UT) | (mJy) | (mas) | (as) | (as) | (∘) | ||
| Sep 04 | 8.42 | ||||||
| 2.27 | |||||||
| Sep 09 | 8.42 | ||||||
| 2.27 | |||||||
| Sep 19 | 8.42 | ||||||
| 2.27 | |||||||
| Oct 12 | 8.42 | ||||||
| 2.27 | |||||||
| Nov 18 | 8.42 |
MAXI J1836194 was observed five times with the VLBA during the outburst, for between 4 and 6 hours per epoch, under project code BM339 (Table 2). We observed in dual polarisation mode, with 64 MHz of bandwidth per polarisation. In the first four epochs, we made use of the dual 13/4-cm recording mode to split the bandwidth equally between two frequency bands centred at 8.4 and 2.25 GHz. However, since our VLA monitoring indicated the source flux density to be mJy at the time of the final epoch, we observed at 8.4 GHz only on November 18, using the full 64 MHz of available bandwidth.
The observations were phase-referenced, using the closest available extragalactic calibrator source, J1832-2039, from the VLBA Calibrator Survey (VCS; Beasley et al., 2002), whose assumed position (from the most up-to-date global astrometric solution available at the time of the observations111http://astrogeo.org/vlbi/solutions/rfc_2011c/) was , (1.6∘ from the target source). The phase referencing cycle time was 3 minutes, spending 2 minutes on the target source and 1 minute on the phase reference calibrator in each cycle. Every seventh observation of the target was substituted for a 1-minute observation of an astrometric check source. We used two different check sources, alternating between J1845-2200, taken from the Fourth VLBA Calibrator Survey (VCS-4; Petrov et al., 2006), and J1825-1718, from the Second VLBA Calibrator Survey (VCS-2; Fomalont et al., 2003). 30 minutes at the start and end of each observation were used for geodetic blocks, observing several bright extragalactic calibrators over a range of elevations. This improved the accuracy of the phase referencing process by allowing us to solve for unmodelled tropospheric delays and clock errors.
The data were correlated using the VLBA-DiFX implementation of the software correlator developed by Deller et al. (2007), and reduced using the Astronomical Image Processing System (aips; Greisen, 2003), according to standard procedures. Data with elevations were flagged, to prevent the increased atmospheric phase fluctuations at low elevations from affecting the astrometric accuracy. Scatter-broadening affected the data at 2.25 GHz, reducing the amplitude measured on the longer baselines, and we were unable to calibrate the station at Mauna Kea (MK). Phase solutions for MAXI J1836-194 were derived by fringe-fitting the phase reference calibrator, using as a model the best available image of the calibrator following self-calibration.
For the first four epochs, the data were imaged with robust weighting as a compromise between sensitivity and resolution. For the first three epochs, phase-only self-calibration was performed down to a solution interval of 5 minutes. These phase corrections were applied, before a single round of amplitude and phase calibration was used to adjust the overall amplitude gains of the individual antennas. By the fourth epoch, the source was significantly fainter, and we were only able to perform a single round of phase-only self calibration on a timescale of 1 hour. For the faint, fifth epoch, we imaged the data with natural weighting to maximise the sensitivity, but the source was too faint for self-calibration.
Since the final images showed the source to be marginally resolved in the first four epochs, we exported the self-calibrated data to Difmap (Shepherd, 1997), and fit the source with a single elliptical Gaussian in the uv-plane. Since Difmap does not provide uncertainties on fitted model parameters, we used the best-fitting values as initial estimates for the AIPS task uvfit, which was used to determine the final fitted source sizes.
2.1.3 ATCA
The Australia Telescope Compact Array (ATCA) observed MAXI J1836194 four times during its 2011 outburst and five times in 2012 (Table 3). All observations were taken at 5.5 and 9.0 GHz with a bandwidth of 2 GHz at each frequency. The ATCA data were reduced using standard routines in ATNF’s MIRIAD package (Sault et al., 1995). Primary flux calibration for all observations was done using 1934638. Phase calibration was carried out with 1817254 during the 2011 September 05, 20, and 21 observations. 1908201 was used for all other observations, except on 2012 April 08 where 1829207 was used. Due to a combination of antenna shadowing in the compact H75 configuration and a missing antenna, only one baseline was usable for the 2011 September 20 and 21 observations. Therefore, for these two epochs a point source was fit to the calibrated data in the uv-plane. For all other observations, calibrated data were then exported to Difmap for imaging and flux densities were obtained by fitting a point source model to the target in the image plane (Table 3). Due to the compact array configuration on 2011 September 20 and 21, our ATCA observations were unable to resolve MAXI J1836194 from a nearby unrelated object. The flux density of the nearby source was subtracted from our measured flux density to estimate the flux density of MAXI J1836194 in our ATCA observations (see Section 2.1.1 and Figure 1 for further discussion).
The radio counterpart of MAXI J1836194 was detected for all 2011 observations at a position coincident with those of the X-ray and optical counterparts. During our 2012 observations, the source was detected only on April 08 (during the minor re-flare). When detected, the source was found to be unresolved within the ATCA beam.
| Date | MJD | Array | Freq. | Flux |
| (UT) | config. | (GHz) | density | |
| (mJy) | ||||
| 2011 Sep 05 | 55809.45 | 6B | 5.5 | 282 |
| 9.0 | 364 | |||
| 2011 Sep 20 | 55824.22 | H75 | 5.5 | 454a |
| 9.0 | 503a | |||
| 2011 Sep 21 | 55825.21 | H75 | 5.5 | 394a |
| 9.0 | 443a | |||
| 2011 Dec 01 | 55897.27 | 1.5D | 5.5 | 0.40.1 |
| 9.0 | 0.240.05 | |||
| 2012 Jan 13 | 55939.92 | 6A | 5.5 | 0.09 |
| 9.0 | 0.270.07 | |||
| 2012 Feb 03 | 55960.05 | 6A | 5.5 | 0.11 |
| 9.0 | 0.21 | |||
| 2012 Apr 08 | 56024.94 | H168 | 5.5 | 0.640.05 |
| 9.0 | 0.680.04 | |||
| 2012 Jun 24 | 56102.73 | 6D | 5.5 | 0.23 |
| 9.0 | 0.28 | |||
| 2012 Aug 24 | 56163.30 | 6A | 5.5 | 0.07 |
| 9.0 | 0.09 | |||
| Preliminary results for the 2012 April 08 epoch were reported | ||||
| by Coriat et al. (2012). | ||||
| aThe flux density of the nearby source was subtracted from our | ||||
| measured flux density (see Section 2.1.1). | ||||
2.2 X-ray observations
2.2.1 RXTE
The outburst of MAXI J1836194 was monitored with the Proportional Counter Array (PCA) on board the Rossi X-ray Timing Explorer (RXTE; see Jahoda et al. 1996, 2006). A total of 74 pointed observations sample this outburst, for a period of about 92 days. The RXTE data were reduced using the Heasoft software package v6.8, following the standard steps described in the RXTE cookbook. To estimate the source intensity and a spectral colour, we followed Altamirano et al. (2008): we used the 16 second time-resolution Standard 2 mode of all active Proportional Counter Units (PCUs, all layers) in each observation. The hard colour was defined as the count rate ratio (6–16 keV)/(2–6 keV) and the intensity was defined as total count rate in the 2.0–20.0 keV band (Figure 3). We subtracted the background and performed deadtime corrections on a per-PCU basis. To take into account response differences between PCUs, we normalised the intensity and hard colour by the Crab before estimating the average intensity and hard colour on a per-observation basis. Due to the low column density along the line-of-sight ( cm-2; Russell et al. 2014a) and the spectrum being dominated by a power-law component during the hard state decay, the 3–9 keV band during the decay phase of the outburst was unaffected by absorption.
Due to Sun constraints, no simultaneous RXTE data were available to coincide with the 2011 December 3 VLA data (the final RXTE epoch was 2011 November 25). We estimate the X-ray intensity on December 3 by fitting the observed exponential decay of the source following its transition back to the hard state (see Figure 2), and extrapolating to the required date (error bars were conservatively estimated from the uncertainty of the exponential fit).
2.3 Swift XRT
The Swift X-ray telescope (XRT) monitored MAXI J1836194 during its period of renewed activity in 2012. From the HEASARC public archives, we retrieved XRT observations taken on 2012 April 06 and 09, June 15 and 29 (which were closest in time to our April 08 and June 24 ATCA observations). The 2012 April observations (characterised by a higher count rate) were taken in windowed-timing mode, while those from 2012 June (when the source was fainter) were in photon-counting mode. We extracted the spectral files and their associated background, response and ancillary response files with the online XRT data product generator (Evans et al., 2009). The X-ray spectra were then fit with the X-Ray Spectral Fitting Package (XSPEC) version 12.7 (Arnaud, 1996). We modelled the spectra in the 0.4–10 keV band with a simple disk-blackbody plus power-law, absorbed by a (fixed) line-of-sight Galactic cm-2 (Russell et al., 2014a) and free intrinsic absorption. More complex fits with physical Comptonisation models or irradiated disk models did not improve the fit due to the low signal-to-noise ratio of our data. Moreover, our primary interest was in the flux from the power-law component in the 3–9 keV band, rather than the details of the soft component. Therefore, a disk-blackbody plus power-law model was adequate. On 2012 April 06 and 09, a faint disk-blackbody component was significantly detected with a temperature keV (from the combined spectra), but the 3–9 keV flux was entirely dominated by the power-law component () and was unaffected by absorption (total cm-2). On 2012 June 15, the spectrum was best fit by a simple power law (). On 2012 June 29, the source was no longer significantly detected. We therefore estimated a 90% confidence limit to its net count rate from the number of counts detected in the source and background regions (using Bayesian statistics; Kraft et al. 1991). We converted this count rate upper limit to a flux upper limit assuming the same spectral model that we fit to the 2012 June 15 spectrum.
3 Results
3.1 Source evolution
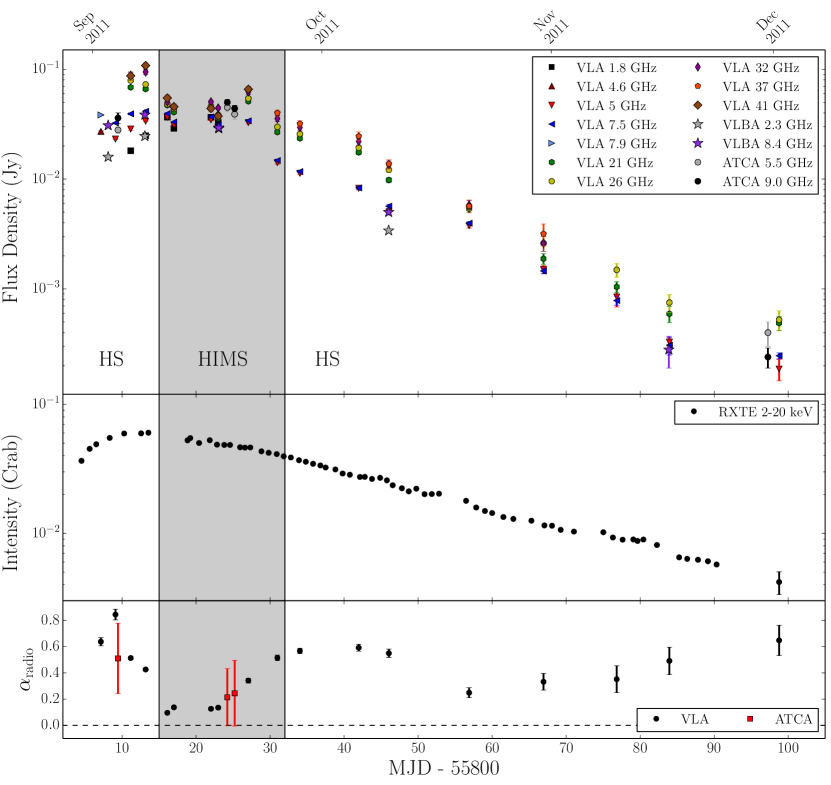
With our VLA, VLBA, and ATCA monitoring, we observed the brightening and decay of the compact jet of MAXI J1836194 during its 2011 outburst (Figure 2, top panel). The VLA, VLBA and ATCA radio observations (Tables 1, 2 and 3, respectively) show that the flux density of the system increased during the bright, early hard state and HIMS, before the outburst failed. The VLA radio spectrum (which was initially inverted in the hard state) flattened as the system softened and transitioned to the HIMS (Figure 2, bottom panel). Never entering the soft state, the source transitioned back to the hard state on September 28 and the radio emission faded by 2 orders of magnitude and the spectrum became more inverted during the decay towards quiescence.
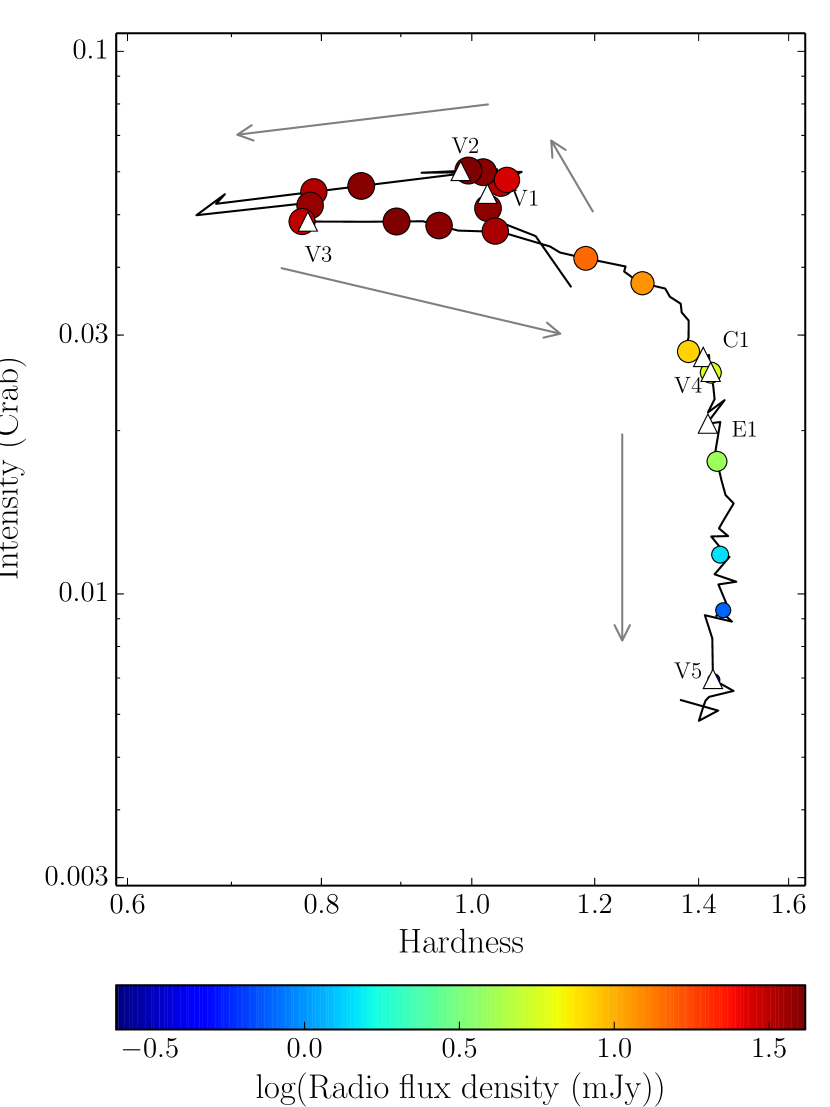
The X-ray evolution of a black hole X-ray binary is often visualised with a hardness intensity diagram (HID), which shows the variation of X-ray intensity with X-ray spectral shape (where harder spectra are dominated by the X-ray power-law component and the softer emission by the blackbody disk emission; e.g. Fender et al. 2004). Figure 3 shows how the flux density of the VLA and ATCA observations varied with X-ray intensity and spectral shape, and indicates the timing of the VLA, ATCA and VLBA radio observations.
3.2 Polarisation of the radio jet
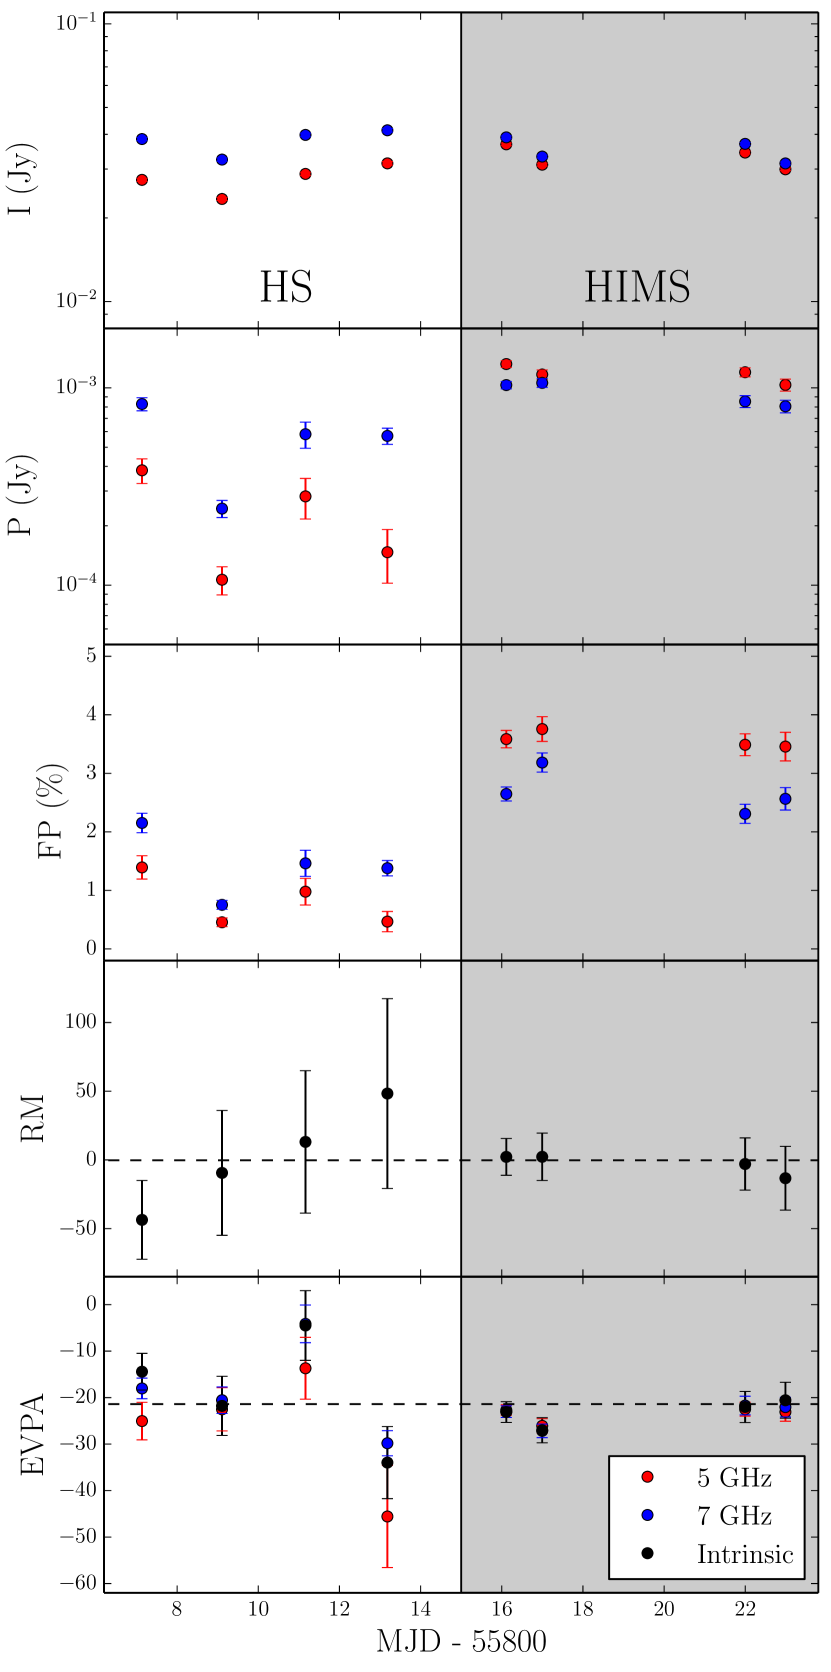
Linear polarisation was significantly detected () for the first eight VLA epochs at both 5 and 7.5 GHz (see Figure 4, second panel). The linear polarisation (P), fractional polarisation (FP) and polarisation position angle (PA) were derived from the measured flux densities of the Stokes and images, where P, FP and PA. Following the September 18 epoch the target faded and the VLA shifted to a more compact configuration and, due to the presence of the polarised confusing source, we were not able to place any constraints on the source polarisation.
Faraday rotation is the rotation of the plane of polarisation as a function of wavelength (), due to birefringence of the interstellar and local medium. The rotation measure, RM, is given by (where is the thermal electron density along the line of sight, is the magnetic field along the line of sight, and is the source distance). The intrinsic electric vector position angle (EVPA) of the source is related to the wavelength and polarisation position angle by EVPAPARM. Therefore, the RM and EVPA can be determined from the 5 and 7.5 GHz observations by linearly fitting the PA for all 16 subbands (ensuring we do not suffer from an ambiguity). Our results show that the RM and EVPA remained constant within errors throughout the outburst and we find that rad m-2 and EVPA (Figure 4, fourth and fifth panel, respectively).
3.3 VLBA radio morphology
Our VLA, ATCA and VLBA radio observations show similar flux densities of MAXI J1836194 during its outburst. Also, contemporaneous VLBI observations of MAXI J1836194 with the CVN (on 2011 October 10) and the EVN (on 2011 October 17) reported by Yang et al. (2012a), show similar flux densities to our contempraneous radio observations, suggesting that the high resolution observations do not resolve out any significant extended emission.
| Date | MJD | Freq. | R.A. | Dec. |
|---|---|---|---|---|
| 2011 | (GHz) | |||
| (UT) | ||||
| Sep 04 | 8.42 | 18:35:43.4445732(8) | -19:19:10.48441(3) | |
| Sep 09 | 8.42 | 18:35:43.4445671(5) | -19:19:10.48438(2) | |
| Sep 19 | 8.42 | 18:35:43.4445587(4) | -19:19:10.48470(2) | |
| Oct 12 | 8.42 | 18:35:43.444564(1) | -19:19:10.48520(4) | |
| Nov 18 | 8.42 | 18:35:43.444519(6) | -19:19:10.4853(2) |
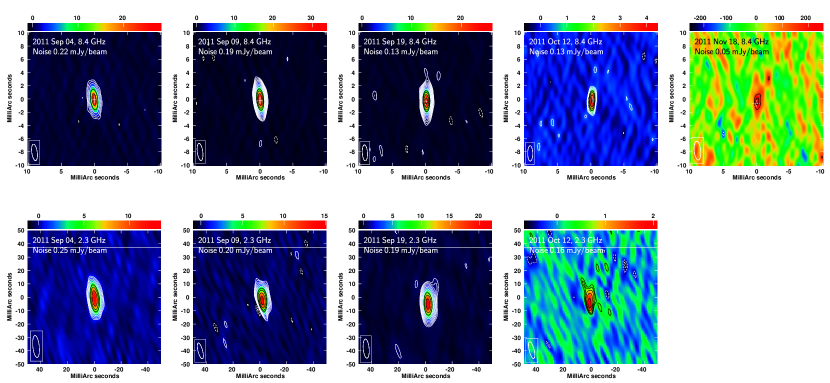
The compact jet was not directly resolved in the individual images, except on September 19 at 2.3 GHz. Model fitting in the uv-plane shows the source to be slightly extended at all frequencies, and in all but the last epoch (Table 2), as confirmed during the deconvolution process while imaging. As a check on the quality of the fits, the fitted Gaussian was subtracted from the uv-data, and the data were re-imaged. The resulting residual images were noise-like, with the exception of the 2.3 GHz September 19 observation, for which some structure remained at the level of 1.0 mJy beam-1, suggesting that a simple elliptical Gaussian was not a good representation and that the source structure was more complex (Figure 5). However, since it can account for 96% of the emission at that epoch, we take the fitted parameters as a good approximation to the source structure in this epoch, together with a faint residual jet component separated by 15 mas from the core, along the position angle . Excluding the September 04 2.27 GHz observation, which was taken early in the outburst with relatively low resolution, model fitting in the uv-plane gave a consistent position angle, with a weighted mean of . Hereafter, we take the weighted mean as indicative of the observed jet axis. The fitted major axis of the source (which was smaller at higher-frequency, corresponding to smaller scales within the jet; see also Rushton et al. 2012) did not change significantly during the outburst (Table 2).
3.4 Astrometry
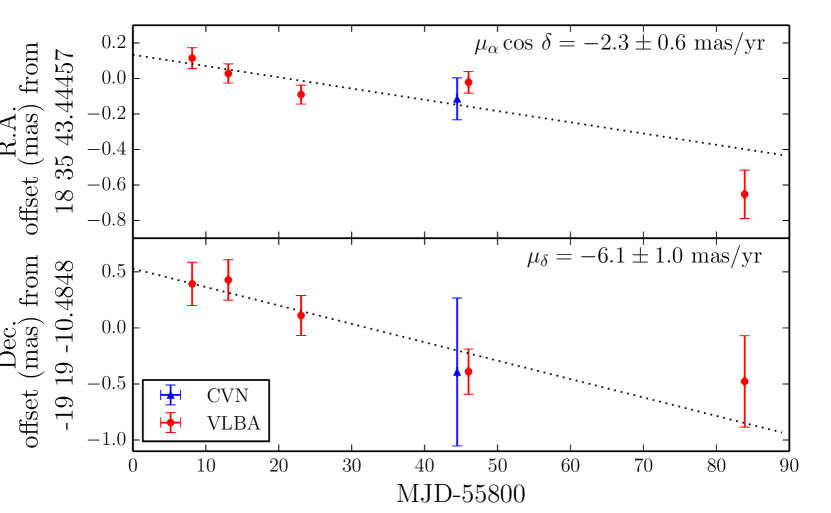
To constrain the proper motion of the system, we measured the source position in each of the 8.4 GHz images prior to performing any self-calibration (Table 4). In all cases, we fitted the source in the image plane with an elliptical Gaussian, for consistency with the known source structure. We estimated systematics from the scatter on the two check source positions over the five epochs, weighted by their relative distance to the phase calibrator. Over the two months of our observing campaign, the fitted source position changed by 0.760.09 mas in right ascension (R.A.) and 0.90.2 mas in declination (Dec.). To increase the size of our data set, we included the 8.3-GHz position derived by Yang et al. (2012a) from their Chinese VLBI Network (CVN) observations. Although the CVN observations used the same phase reference source, J1832-2039, they used a less recent global astrometric solution to determine the assumed position of that calibrator, so we corrected for the shift in calibrator position before adding the CVN point to our astrometric sample.
We also attempt to correct for the motion of the optical depth surface along the jet axis, by calculating the expected core shift as a fraction of the component of proper motion along the VLBI jet axis. Heinz (2006) present a model for the expected core shift in a compact jet. Assuming equipartition between the particles and the magnetic field and following their assumptions, we calculate the expected core shift at each epoch. We find a cumulative shift that is 15% of the total positional shift along the jet axis, which we include (on a point by point basis) in the uncertainties of our proper motion fit.
Using jackknife resampling with a linear function to fit the motion in both co-ordinates, we derived proper motions in R.A. and Dec. of
| (1) | ||||
| (2) |
with the reference position
| (3) | ||||
| (4) |
at the reference date of MJD 55800.0 (Table 2 and Figure 6).
4 Discussion
4.1 The evolving compact jet
During the initial radio observations of MAXI J1836194, the system was in the hard X-ray spectral state. In this state, the radio spectrum was very inverted (Figure 2, bottom panel) and linear polarisation was observed at levels of a few percent (Figure 4), significantly lower than the maximum expected theoretical levels for a perfectly ordered magnetic field. Synchrotron theory predicts linear polarisation at levels of up to 10% for optically-thick synchrotron emission and up to 72% for optically-thin synchrotron emission in the presence of an ordered magnetic field (Pacholczyk & Swihart, 1967; Scheuer & Williams, 1968; Rybicki & Lightman, 1979; Longair, 2011). However, these levels have rarely been observed in LMXBs (Fender, 2003). For example, like MAXI J1836194, linear polarisation at levels of a few percent was observed in the hard states of V404 Cyg (Han & Hjellming, 1992) and GX 3394 (Corbel et al., 2000). The low polarisation implies either that the magnetic field was intrinsically disordered on large scales (e.g. Brocksopp et al., 2007), possibly due to multiple polarised components (which are polarised differently; Stirling et al. 2004), a rotation of the polarisation angle within the jet (Blandford & Königl, 1979) or Faraday rotation within the jet (see Brocksopp et al. 2013 for further discussion).
As the system transitioned to the HIMS, the radio emission brightened, the radio spectrum flattened, and the linear polarisation remained at a few percent (although it did increase marginally). During this time, the polarisation spectrum steepened slightly (Figure 4, second panel), which the evolution of FP shows is not just due to the change in the spectral index of Stokes I. While our observations do not allow for a clear interpretation of this result, we speculate that this steepening may have been due to the magnetic field becoming intrinsically more ordered further along the jet (away from the compact object), or less ordered closer to the compact object. The outburst then failed in the HIMS and the radio spectrum became more inverted as the source transitioned back to the hard state.
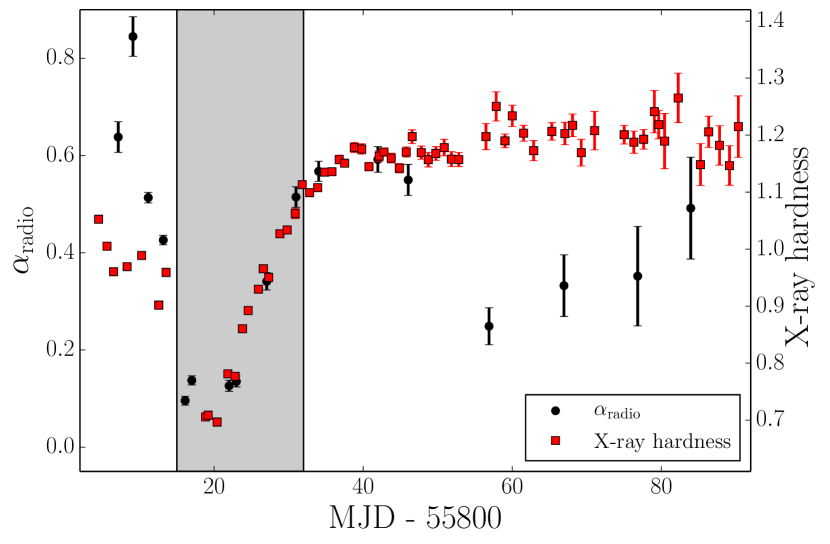
During the initial hard state observations of MAXI J1836194, the radio spectrum was very inverted, with a spectral index of (determined from the Stokes I). While X-ray binaries in the hard state typically exhibit flat or slightly inverted radio spectra, where (e.g. Fender, 2001; McClintock et al., 2009; Russell et al., 2013a; Brocksopp et al., 2013; van der Horst et al., 2013; Curran et al., 2014), inversions of were observed during the decay phase of the 2010-2011 outburst of GX 3394 (Corbel et al., 2013a). The radio spectrum of MAXI J1836194 then flattened (to ) as the system transitioned into the HIMS. Our results show that during the transition phases of the outburst, the radio spectrum appeared to track the X-ray hardness (Figure 7). However, during the hard state decay the spectrum of the radio jet continued to evolve while the X-ray hardness remained steady. During this time, the jet spectral break was observed to change by an order of magnitude indicating that the jet properties are still changing significantly (Russell et al. 2013b; Kalemci et al. 2013; Russell et al. 2014a).
A flattening of the radio spectrum as the source softens has been observed in some (but not all) other systems. The shape of the spectrum is thought to be dependent on the geometry of the compact jet and the flow of material along the jet (e.g. the bulk flow velocity along the jet and shocks and turbulence within the compact jet; Blandford & Königl 1979; Falcke & Biermann 1995; Kaiser 2006; Pe’er & Casella 2009; Jamil et al. 2010; Malzac 2013, 2014). At the beginning of its 2003 outburst, the radio spectrum of H 1743322 showed a similar evolution to MAXI J1836194, where the inverted spectrum of the compact jet flattened as the system softened during its transition to the intermediate state (McClintock et al., 2009). MAXI J1836194 reached its softest point in the HIMS, following which the jet spectrum became more inverted as the system transitioned back to the hard state. GX 339-4 (Corbel et al., 2013a) showed a similar evolution where the radio spectrum became more inverted following the transition back to the hard state (after the compact jet was re-established). However, a radio spectrum that steepens as the source softens is not observed in all LMXBs (e.g. van der Horst et al., 2013; Curran et al., 2014). From this small sample, the difference in the evolution of the jet spectrum between systems does not appear to be related to any physical parameter of the system such as inclination angle and black hole mass. While it appears that the evolution of the radio spectrum must be driven by some property of the accretion flow (that may also be driving X-ray hardness), the surrounding environment, or the magnetic field (that may affect the jet flow and shape), our observations do not allow us to identify what processes may be driving the evolution.
Interestingly, while the flux density of the target changed, the fitted size of the compact jet at 8 GHz remained relatively constant (Table 2). According to Heinz (2006), the distance of the radio core along the jet axis, , is expected to scale with the observed flux density, , where . The size of the compact jet, , is expected to scale linearly with the distance of the radio core from the origin (Paragi et al., 2013). Therefore, the fitted size of the compact jet should relate to the flux density of the system, where . In our VLBA observations we therefore expect to see the jet change size by a factor of 2.5 at 8 GHz. However, our results show that the jet size remained steady during the outburst (even as the jet faded significantly), which could be due to physical properties of the jet changing as it faded (such as changes to the opening angle, jet confinement region etc.).
The VLA observations show that the RM remained approximately constant throughout the observations (Figure 4), where RM32 rad m-2 (to 1). This result is consistent with values found by Taylor et al. (2009) for radio sources along a similar line of sight (where RM 100 rad m-2). Faraday rotation of the linearly polarised synchrotron emission is related to the thermal electron density and magnetic field along the line of sight. Therefore, the stable RM suggests that the rotation is not dominated by local material (to the source). The low value of the RM suggests that Faraday rotation is most likely not responsible for the low levels of observed linear polarisation.
4.2 Jet axis alignment
We find an agreement between the calculated EVPA (; Section 3.2) and the observed VLBI jet axis (; Section 3.3). The total jet spectrum is composed of contributions from both the optically-thick and optically-thin regions of each of the individual synchrotron components (Blandford & Königl, 1979; Hjellming & Johnston, 1988). Fractional polarisation is considerably higher in the optically-thin region of each synchrotron component than the optically-thick region; hence, it is expected that the observed polarisation is dominated by contributions from the optically-thin region of each synchrotron component (Zdziarski et al., 2014) and therefore that the EVPA will be aligned perpendicular to the magnetic field. This implies that the magnetic field is perpendicular to the jet axis in MAXI J1836194. A perpendicular magnetic field may arise from shock compression of the magnetic field (Laing, 1980), knots or hotspots in the jet (Dreher et al., 1987), or a helical magnetic field structure dominating the observed emission (Marscher et al., 2008), a consequence of the rotation of the accretion disk from which the jets may be launched (Koide et al., 2002; Komissarov et al., 2007; Marscher et al., 2008; Gómez et al., 2008). A similar alignment between jet axis and EVPA has also been observed in the black hole X-ray binaries GX 3394 (Corbel et al., 2000), GRO J1655-40 (Hannikainen et al., 2000) and Cygnus X1 (Russell & Shahbaz, 2014, although this measurement is model-dependent). Polarisation studies of BL Lac sources have shown a bimodal distribution of the EVPA relative to the jet axis, where the majority of sources show an alignment between the EVPA and the jet axis (e.g. Cohen et al. 2014 and references therein). If an alignment between the EVPA and jet axis is common to black hole X-ray binaries, high resolution images would not be required to determine the orientation of the jets.
4.3 Proper motion
From this single outburst we calculate the proper motion of the system by linearly fitting its VLBI positions in both co-ordinates over time (see Section 3.4 and Figure 6), which can then be used to constrain the formation mechanism of the black hole. Black holes in LMXB systems are thought to form in two ways (Fryer & Kalogera, 2001): either a massive star collapsing directly into a black hole (e.g. Mirabel & Rodrigues, 2003; Dhawan et al., 2007), or delayed formation in a supernova, as fallback on to the neutron star of material ejected during the explosion creates the black hole (e.g. Mirabel et al., 2001). Following a supernova, the centre of mass of the ejected material continues moving with the velocity of the progenitor immediately prior to the explosion. The centre of mass of the binary system then recoils in the opposite direction and is constrained to lie in the orbital plane (Blaauw kick; Blaauw 1961). In the presence of asymmetries in the supernova explosion, a further asymmetric kick, which need not be in the orbital plane, may be imparted to the binary (e.g. Brandt & Podsiadlowski, 1995; Portegies Zwart & Yungelson, 1998; Lai et al., 2001; Gualandris et al., 2005; Willems et al., 2005; Fragos et al., 2009). For further discussion on formation see Miller-Jones (2014) and references therein.
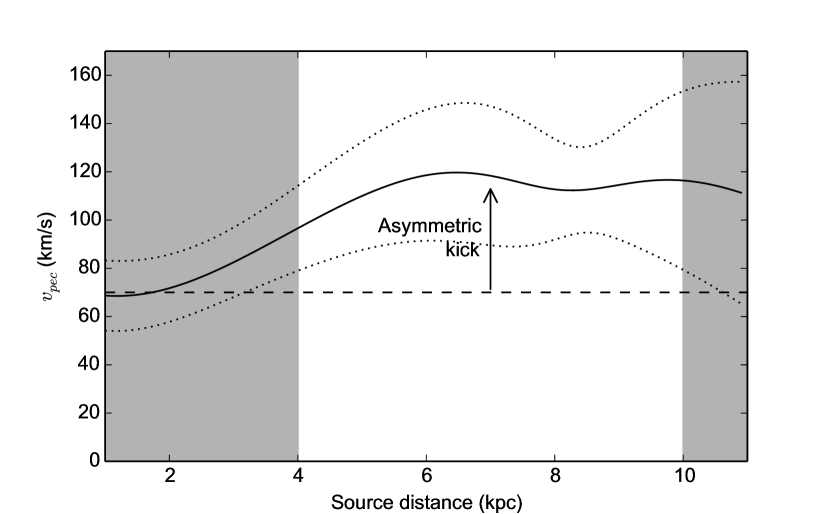
With our calculated proper motion, source distance (4–10 kpc; Russell et al. 2014a), and systemic radial velocity (6115 km s-1; Russell et al. 2014b), we can determine the peculiar velocity of this system. We calculate the heliocentric Galactic space velocity components using the formalism of Johnson & Soderblom (1987), assuming the standard solar motion measured by Schönrich et al. (2010). We assume circular rotation about the Galactic Centre in the plane of the disk, a flat rotation curve with a tangential velocity of 240 km s-1, and a Galactocentric distance for the Sun of 8.34 kpc (Reid et al., 2014b). Defining the peculiar velocity as the difference between the measured three-dimensional space velocity and the expected motion of the system due to Galactic rotation (see, e.g. Dhawan et al., 2007), we find that the peculiar velocity is km s-1 (Figure 8). Since stellar velocity dispersion in the disk gives a typical peculiar velocity of km s-1 even for the oldest M-type stars (Mignard, 2000), and typical Blaauw kicks in LMXBs (while system parameter dependent) have a maximum recoil velocity of km s-1 (e.g. Nelemans et al., 1999), an asymmetric natal kick was most likely required in MAXI J1836194.
This is just the sixth system in which constraints have been placed on the formation mechanism of the black hole (see Miller-Jones, 2014, and references therein). While measuring the distribution of black hole kick velocities can constrain the formation mechanism of black holes, these observations must be carried out in a quiescent or hard state, which are faint (high resolution observations of LMXBs are generally taken during full outburst). Therefore, with so few systems having accurate constraints, there is relatively little observational data on black hole kicks and observations such as these are required to make further progress.
4.4 Radio/X-ray correlation
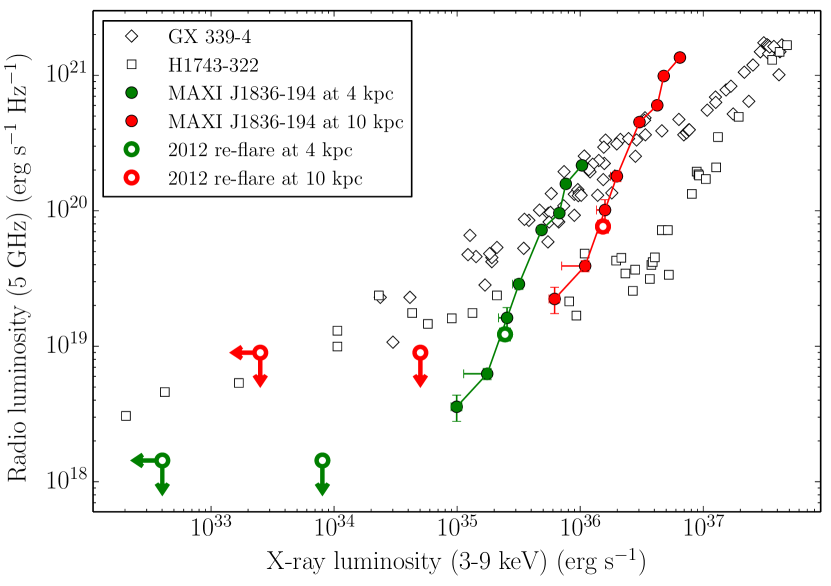
The decay phase of the outburst allows us to probe the hard-state radio/X-ray correlation of MAXI J1836194. In Figure 9 we plot the observed hard state radio/X-ray correlation of MAXI J1836194 with representative data from the upper branch (GX 3394; Corbel et al. 2013b) and the lower branch (H1743322; Coriat et al. 2011). For comparison, we calculate the luminosities of MAXI J1836194 over the same energies as Corbel et al. (2013b) and Coriat et al. (2011). During the decay, we find a steeper than usual radio/X-ray correlation, with an index of 1.8 0.2. This correlation index does not appear to be dependent on frequency (e.g. taking any band of our radio data produces a similar index) and therefore cannot be explained by the changing radio spectral index. Comparing this result with expected relations from Plotkin et al. (2012) also shows that the steep correlation cannot be explained by models where the X-ray emission originates either as inverse Compton from a corona, or is dominated by optically thin synchrotron radiation from the jet. We note that our 2011 X-ray observations only span 1 order of magnitude in X-ray luminosity () and deviations from the expected relationship have been found when the X-ray luminosity range is roughly one order of magnitude (thought to be due to changes in the spectral index, electron cooling, additional X-ray emitting regions, etc; Corbel et al. 2013b). However, if we include ATCA and Swift monitoring of the source during (and following) a re-brightening phase in 2012 we extend the X-ray luminosity range. Our 2012 data show that the source appears to lie on same steep track and at 51034 erg s-1 the source is still radio under-luminous compared to other X-ray binaries at comparable (Figure 9). The relation we observe also holds over 2.5 orders of magnitude in radio luminosity and does not appear to be random scatter about the standard correlation. Given the low inclination of this system (between 4∘ and 15∘; Russell et al. 2014b) it is plausible that variable Doppler boosting affects the correlation. We now investigate this possibility.
Assuming random inclination angles and highly variable boosting, Soleri & Fender (2011) tested a model to determine if variable boosting could account for the scatter of the radio/X-ray correlation for the available sample of black holes. With their model, they were able to qualitatively reproduce both the scatter of the correlation, as well as the ‘radio-quiet’ lower branch but noted that the model had its limitations. Here, we use a similar approach to test if the steep radio/X-ray correlation could be explained by variable relativistic beaming. While recent work has cast doubt over the universality of the two well-defined tracks for the radio/X-ray correlation (Gallo et al., 2014), we assume that the intrinsic radio luminosity of MAXI J1836194 lies on the lower canonical hard-state tracks. We then determine what boosting would be required to account for the observed radio luminosity, testing whether a variable can plausibly account for the steeper than usual correlation. For the system to lie on the upper track, the radio emission at low X-ray luminosities would need to be significantly deboosted (while being boosted at higher X-ray luminosities; Figure 9). Deboosted radio emission has been observed in LMXBs (e.g. XTE J1752223; Yang et al. 2010) but is unlikely to have affected our observations due to the low inclination angle of the system.
We assume that the X-ray emission remains unbeamed (but see Markoff et al. 2005; Russell et al. 2010) and relate the observed beamed radio luminosity, , to the intrinsic radio luminosity, , by
| (5) |
where is the Doppler factor, n=2 (for a continuously replenished jet; Fender 2006), and is the spectral index of the radio emission. The Doppler factor is a function of where , is the velocity of the jet emission as a fraction of the speed of light, and is the inclination of the system; because , we are then able to calculate the Lorentz factor required to shift the modelled intrinsic radio luminosity to that observed.
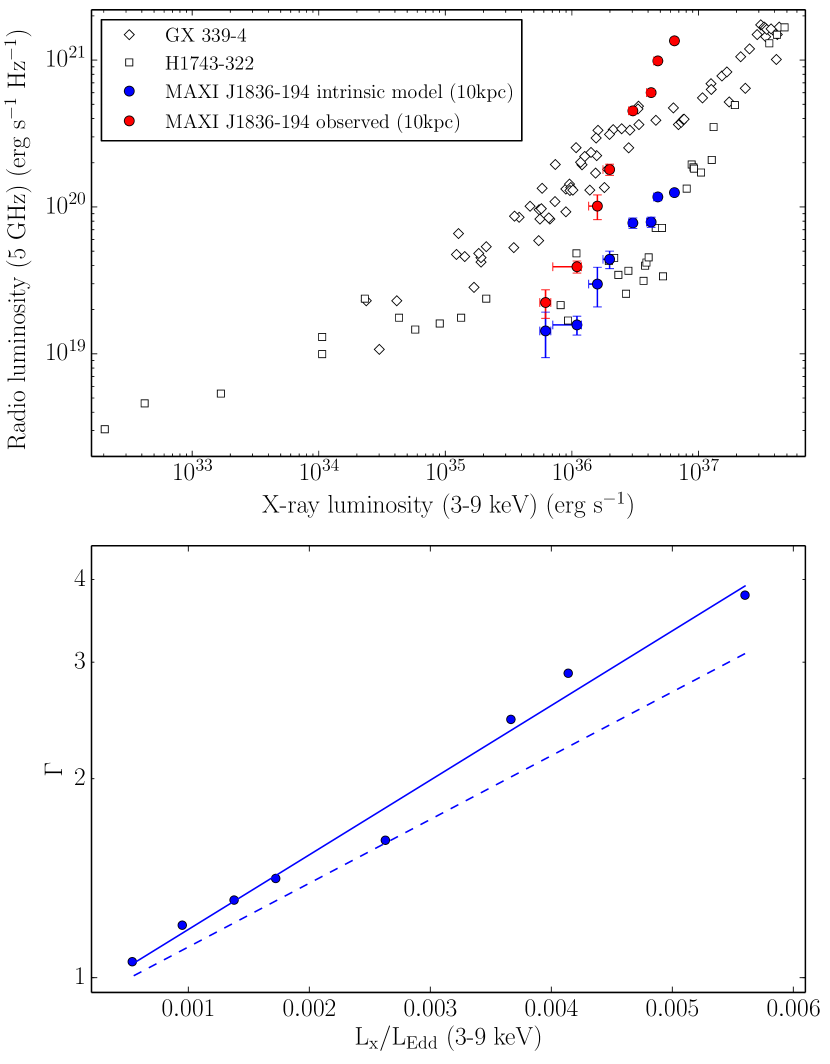
If we assume an inclination angle of 10∘ (Russell et al., 2014b), a source distance of 10 kpc (Russell et al., 2014a) and a jet axis perpendicular to the plane of the binary, then for to lie on the lower track of the radio/X-ray correlation must change by a factor of 3–4 during the outburst (from 1 at the lowest X-ray luminosity to 3–4 at the highest; Figure 10). This result is sensitive to the normalisation of the assumed intrinsic radio luminosity, therefore we have tested a range of normalisations that account for the observed scatter about the lower track. The maximum values of are higher than previously thought for both a compact jet (where 2; Fender et al. 2004) and the transient jet of GRS 1915+105 (where 1.61.9; Reid et al. 2014a). However, due to the low inclination of MAXI J1836194, the values we estimate are not so high that beaming can be ruled out as an explanation for the steep radio/X-ray correlation. Fitting against X-ray luminosity (as a fraction of the Eddington luminosity for a 10 M⊙ black hole) gives , where and 100–120. With this result, the bulk Lorentz factor becomes larger than 1 above 0.05 percent . For comparison, Soleri & Fender (2011) found becomes above 0.1 percent . This level of boosting would be expected to have consequences on the observed radio spectrum, which coupled with the radio spectral index may then provide some insight into physical parameters of the jet (such as the opening angle). However, a full modelling analysis would be required to determine the jet parameters which is beyond the scope of this paper.
At a source distance of 8 kpc, the radio emission at low X-ray luminosities falls well below the canonical relation (Figure 9) and could not be explained unless it was deboosted. Due to the low inclination angle of the system, we do not expect deboosting. Therefore, if we assume that the steep radio/X-ray correlation is due to a variable Lorentz factor, MAXI J1836194 must be at a distance greater than 8 kpc.
Our results show that relativistic beaming can account for the observed radio/X-ray correlation in MAXI J1836194. However, similar to the results of Soleri & Fender (2011), if we applied our boosting argument to the full sample of LMXBs we would see the correlation break down at X-ray luminosities percent Eddington. Following an outburst, black hole LMXBs generally transition back to the hard state at luminosities between 0.3 and 3 percent Eddington (Kalemci et al., 2013), with a mean value of 2 percent (Maccarone, 2003), demonstrating that X-ray luminosities of percent Eddington are expected during the hard state decay. Heinz & Merloni (2004) analysed the radio/X-ray relation of GX 3394 and V404 Cyg and argued that similar Lorentz factors are expected between sources. We therefore conclude that while a variable Lorentz factor can explain the unusually steep radio/X-ray correlation in MAXI J1836194, it cannot be universally applied to the broad sample of black hole binaries.
It is possible that the steep correlation is a temporary deviation from the standard track (Corbel et al., 2013b). However, when we include data from the 2012 re-flare, we see the source appears to lie on the same steep radio/X-ray track and the steep correlation and does not immediately rejoin the standard track. This system could simply produce an intrinsically steep correlation (2 from the steeper track of Coriat et al. 2011, or 4 from that of Gallo et al. 2012, but see recent results from Gallo et al. 2014), however, this index cannot be explained by models of X-ray emission originating as inverse Compton from a corona, or being dominated by optically-thin synchrotron emission from the compact jet.
5 Conclusions
We have presented the full VLA, ATCA and VLBA monitoring of MAXI J1836194 during its 2011 outburst. With our intensive radio coverage of the system we have observed the evolution of the polarised compact jet. We find that the compact jet was linearly polarised at a few percent during the early, bright phase of the outburst. At later times we were unable to place any constraint on the linear polarisation from the source. We determined the VLBI jet axis and found an alignment with the EVPA (which was calculated from the measured Stokes parameters). This implies that the magnetic field was perpendicular to the compact jet axis, possibly due to a helical structure from the rotation of the accretion disk or compression due to internal shocks within the compact jet. If this alignment is common for all LMXBs then high resolution VLBI observations may not be required to determine the orientation of the jet. However, further studies are required to gauge whether the EVPA is always aligned with the jet axis. Calculating the peculiar velocity from our astrometric observations, we find that the black hole likely required an asymmetric natal kick during formation to account for its high peculiar velocity. During the decay phase of the outburst we observed an unusually steep radio/X-ray correlation where , much steeper than other black hole LMXB systems. We test whether the steep correlation may be due to a variable jet Lorentz factor. If we assume that the correlation agrees with the radio quiet radio/X-ray correlation track, the Lorentz factor needs to vary from 1 at low X-ray luminosities to 3–4 at high X-ray luminosities to produce the observed correlation. However, this relation is unlikely to explain to the full sample of black hole LMXBs, and it is possible that we are observing a temporary deviation to the standard correlation. Interestingly, data from a re-flare event in 2012 show that the source appears to once again lie on the unusually steep track followed during the 2011 outburst. If the steep radio/X-ray correlation is due only to a variable Lorentz factor, our data require that the source lies at a distance greater than 8 kpc.
Acknowledgments
We would like to thank the anonymous referee for their helpful comments and suggestions. We also thank Tom Maccarone for useful discussions. This research was supported under the Australian Research Council’s Discovery Projects funding scheme (project number DP 120102393). DA acknowledges support from the Royal Society. SC acknowledges funding support from the French Research National Agency: CHAOS project ANR-12-BS05-0009 (http://www.chaos-project.fr) and financial support from the UnivEarthS Labex program of Sorbonne Paris Cité (ANR-10-LABX-0023 and ANR-11-IDEX-0005-02). GRS and AJT are supported by an NSERC Discovery Grant. TMB acknowledges support from INAF-PRIN 2012-6. SM acknowledges support by the Spanish Ministerio de Economía y Competitividad and European Social Funds through a Ramón y Cajal Fellowship and the Spanish Ministerio de Ciencia e Innovación (SM; grant AYA2013-47447-C03-1-P). This research has made use of NASA’s Astrophysics Data System. The International Centre for Radio Astronomy Research is a joint venture between Curtin University and the University of Western Australia, funded by the state government of Western Australia and the joint venture partners. The National Radio Astronomy Observatory is a facility of the National Science Foundation operated under cooperative agreement by Associated Universities, Inc. The Australia Telescope Compact Array is part of the Australia Telescope National Facility which is funded by the Commonwealth of Australia for operation as a National Facility managed by CSIRO.
References
- Altamirano et al. (2008) Altamirano, D., van der Klis, M., Méndez, M., Jonker, P. G., Klein-Wolt, M., & Lewin, W. H. G. 2008, ApJ, 685, 436
- Arnaud (1996) Arnaud, K. A. 1996, in Astronomical Society of the Pacific Conference Series, Vol. 101, Astronomical Data Analysis Software and Systems V, ed. G. H. Jacoby & J. Barnes, 17
- Beasley et al. (2002) Beasley, A. J., Gordon, D., Peck, A. B., Petrov, L., MacMillan, D. S., Fomalont, E. B., & Ma, C. 2002, ApJS, 141, 13
- Belloni et al. (2011) Belloni, T. M., Motta, S. E., & Muñoz-Darias, T. 2011, Bulletin of the Astronomical Society of India, 39, 409
- Blaauw (1961) Blaauw, A. 1961, BAIN, 15, 265
- Blandford & Königl (1979) Blandford, R. D., & Königl, A. 1979, ApJ, 232, 34
- Brandt & Podsiadlowski (1995) Brandt, N., & Podsiadlowski, P. 1995, MNRAS, 274, 461
- Brocksopp et al. (2004) Brocksopp, C., Bandyopadhyay, R. M., & Fender, R. P. 2004, NA, 9, 249
- Brocksopp et al. (2013) Brocksopp, C., Corbel, S., Tzioumis, A., Broderick, J. W., Rodriguez, J., Yang, J., Fender, R. P., & Paragi, Z. 2013, MNRAS, 432, 931
- Brocksopp et al. (2007) Brocksopp, C., Miller-Jones, J. C. A., Fender, R. P., & Stappers, B. W. 2007, MNRAS, 378, 1111
- Cohen et al. (2014) Cohen, M. H., et al. 2014, ApJ, 787, 151
- Corbel et al. (2013a) Corbel, S., et al. 2013a, MNRAS, 431, L107
- Corbel et al. (2013b) Corbel, S., Coriat, M., Brocksopp, C., Tzioumis, A. K., Fender, R. P., Tomsick, J. A., Buxton, M. M., & Bailyn, C. D. 2013b, MNRAS, 428, 2500
- Corbel et al. (2004) Corbel, S., Fender, R. P., Tomsick, J. A., Tzioumis, A. K., & Tingay, S. 2004, ApJ, 617, 1272
- Corbel et al. (2000) Corbel, S., Fender, R. P., Tzioumis, A. K., Nowak, M., McIntyre, V., Durouchoux, P., & Sood, R. 2000, A&A, 359, 251
- Corbel et al. (2003) Corbel, S., Nowak, M. A., Fender, R. P., Tzioumis, A. K., & Markoff, S. 2003, A&A, 400, 1007
- Coriat et al. (2011) Coriat, M., et al. 2011, MNRAS, 414, 677
- Coriat et al. (2012) Coriat, M., Tzioumis, T., Fender, R., Corbel, S., & Brocksopp, C. 2012, The Astronomer’s Telegram, 4038, 1
- Curran et al. (2014) Curran, P. A., et al. 2014, MNRAS, 437, 3265
- Deller et al. (2007) Deller, A. T., Tingay, S. J., Bailes, M., & West, C. 2007, PASP, 119, 318
- Dhawan et al. (2007) Dhawan, V., Mirabel, I. F., Ribó, M., & Rodrigues, I. 2007, ApJ, 668, 430
- Dhawan et al. (2000) Dhawan, V., Mirabel, I. F., & Rodríguez, L. F. 2000, ApJ, 543, 373
- Dreher et al. (1987) Dreher, J. W., Carilli, C. L., & Perley, R. A. 1987, ApJ, 316, 611
- Evans et al. (2009) Evans, P. A., et al. 2009, MNRAS, 397, 1177
- Falcke & Biermann (1995) Falcke, H., & Biermann, P. L. 1995, A&A, 293, 665
- Fender (2003) Fender, R. 2003, Ap&SS, 288, 79
- Fender (2006) Fender, R. 2006, Jets from X-ray binaries, ed. W. H. G. Lewin & M. van der Klis (Cambridge University Press, Cambridge), 381
- Fender (2010) Fender, R. 2010, in Lecture Notes in Physics, Berlin Springer Verlag, Vol. 794, The Jet Paradigm, ed. T. Belloni, 115
- Fender et al. (1999a) Fender, R., et al. 1999a, ApJ, 519, L165
- Fender (2001) Fender, R. P. 2001, MNRAS, 322, 31
- Fender et al. (2004) Fender, R. P., Belloni, T. M., & Gallo, E. 2004, MNRAS, 355, 1105
- Fender et al. (1999b) Fender, R. P., Garrington, S. T., McKay, D. J., Muxlow, T. W. B., Pooley, G. G., Spencer, R. E., Stirling, A. M., & Waltman, E. B. 1999b, MNRAS, 304, 865
- Ferrigno et al. (2012) Ferrigno, C., Bozzo, E., Del Santo, M., & Capitanio, F. 2012, A&A, 537, L7
- Fomalont et al. (2003) Fomalont, E. B., Petrov, L., MacMillan, D. S., Gordon, D., & Ma, C. 2003, AJ, 126, 2562
- Fragos et al. (2009) Fragos, T., Willems, B., Kalogera, V., Ivanova, N., Rockefeller, G., Fryer, C. L., & Young, P. A. 2009, ApJ, 697, 1057
- Fryer & Kalogera (2001) Fryer, C. L., & Kalogera, V. 2001, ApJ, 554, 548
- Gallo (2010) Gallo, E. 2010, in Lecture Notes in Physics, Berlin Springer Verlag, Vol. 794, The Jet Paradigm, ed. T. Belloni, 85
- Gallo et al. (2003) Gallo, E., Fender, R. P., & Pooley, G. G. 2003, MNRAS, 344, 60
- Gallo et al. (2012) Gallo, E., Miller, B. P., & Fender, R. 2012, MNRAS, 423, 590
- Gallo et al. (2014) Gallo, E., et al. 2014, MNRAS, 445, 290
- Gómez et al. (2008) Gómez, L., Rodríguez, L. F., Loinard, L., Lizano, S., Allen, C., Poveda, A., & Menten, K. M. 2008, ApJ, 685, 333
- Grebenev et al. (2013) Grebenev, S. A., Prosvetov, A. V., & Sunyaev, R. A. 2013, Astronomy Letters, 39, 367
- Greisen (2003) Greisen, E. W. 2003, Information Handling in Astronomy - Historical Vistas, 285, 109
- Gualandris et al. (2005) Gualandris, A., Colpi, M., Portegies Zwart, S., & Possenti, A. 2005, ApJ, 618, 845
- Han & Hjellming (1992) Han, X., & Hjellming, R. M. 1992, ApJ, 400, 304
- Hannikainen et al. (1998) Hannikainen, D. C., Hunstead, R. W., Campbell-Wilson, D., & Sood, R. K. 1998, A&A, 337, 460
- Hannikainen et al. (2000) Hannikainen, D. C., Hunstead, R. W., Campbell-Wilson, D., Wu, K., McKay, D. J., Smits, D. P., & Sault, R. J. 2000, ApJ, 540, 521
- Heinz (2006) Heinz, S. 2006, ApJ, 636, 316
- Heinz & Merloni (2004) Heinz, S., & Merloni, A. 2004, MNRAS, 355, L1
- Hjellming & Johnston (1988) Hjellming, R. M., & Johnston, K. J. 1988, ApJ, 328, 600
- Hjellming & Rupen (1995) Hjellming, R. M., & Rupen, M. P. 1995, Nature, 375, 464
- Jahoda et al. (2006) Jahoda, K., Markwardt, C. B., Radeva, Y., Rots, A. H., Stark, M. J., Swank, J. H., Strohmayer, T. E., & Zhang, W. 2006, ApJS, 163, 401
- Jahoda et al. (1996) Jahoda, K., Swank, J. H., Giles, A. B., Stark, M. J., Strohmayer, T., Zhang, W., & Morgan, E. H. 1996, in Society of Photo-Optical Instrumentation Engineers (SPIE) Conference Series, Vol. 2808, EUV, X-Ray, and Gamma-Ray Instrumentation for Astronomy VII, ed. O. H. Siegmund & M. A. Gummin, 59
- Jamil et al. (2010) Jamil, O., Fender, R. P., & Kaiser, C. R. 2010, MNRAS, 401, 394
- Johnson & Soderblom (1987) Johnson, D. R. H., & Soderblom, D. R. 1987, AJ, 93, 864
- Jonker et al. (2012) Jonker, P. G., Miller-Jones, J. C. A., Homan, J., Tomsick, J., Fender, R. P., Kaaret, P., Markoff, S., & Gallo, E. 2012, MNRAS, 423, 3308
- Kaiser (2006) Kaiser, C. R. 2006, MNRAS, 367, 1083
- Kalemci et al. (2013) Kalemci, E., Dinçer, T., Tomsick, J. A., Buxton, M. M., Bailyn, C. D., & Chun, Y. Y. 2013, ApJ, 779, 95
- King et al. (2013) King, A. L., Miller, J. M., Reynolds, M. T., Gültekin, K., Gallo, E., & Maitra, D. 2013, ApJ, 774, L25
- Koide et al. (2002) Koide, S., Shibata, K., Kudoh, T., & Meier, D. L. 2002, Science, 295, 1688
- Komissarov et al. (2007) Komissarov, S. S., Barkov, M. V., Vlahakis, N., & Königl, A. 2007, MNRAS, 380, 51
- Kraft et al. (1991) Kraft, R. P., Burrows, D. N., & Nousek, J. A. 1991, ApJ, 374, 344
- Krimm et al. (2012) Krimm, H. A., et al. 2012, The Astronomer’s Telegram, 3966, 1
- Lai et al. (2001) Lai, D., Chernoff, D. F., & Cordes, J. M. 2001, ApJ, 549, 1111
- Laing (1980) Laing, R. A. 1980, MNRAS, 193, 439
- Longair (2011) Longair, M. S. 2011, High Energy Astrophysics (Cambridge University Press, U.K.)
- Maccarone (2003) Maccarone, T. J. 2003, A&A, 409, 697
- Malzac (2013) Malzac, J. 2013, MNRAS, 429, L20
- Malzac (2014) Malzac, J. 2014, MNRAS, 443, 299
- Markoff et al. (2005) Markoff, S., Nowak, M. A., & Wilms, J. 2005, ApJ, 635, 1203
- Marscher et al. (2008) Marscher, A. P., et al. 2008, Nature, 452, 966
- McClintock et al. (2009) McClintock, J. E., Remillard, R. A., Rupen, M. P., Torres, M. A. P., Steeghs, D., Levine, A. M., & Orosz, J. A. 2009, ApJ, 698, 1398
- McMullin et al. (2007) McMullin, J. P., Waters, B., Schiebel, D., Young, W., & Golap, K. 2007, in Astronomical Society of the Pacific Conference Series, Vol. 376, Astronomical Data Analysis Software and Systems XVI, ed. R. A. Shaw, F. Hill, & D. J. Bell, 127
- Mignard (2000) Mignard, F. 2000, A&A, 354, 522
- Miller-Jones (2014) Miller-Jones, J. C. A. 2014, PASA, 31, 16
- Miller-Jones et al. (2012) Miller-Jones, J. C. A., et al. 2012, MNRAS, 421, 468
- Miller-Jones et al. (2011) Miller-Jones, J. C. A., Sivakoff, G. R., Rupen, M., & Altamirano, D. 2011, The Astronomer’s Telegram, 3628, 1
- Mirabel et al. (2001) Mirabel, I. F., Dhawan, V., Mignani, R. P., Rodrigues, I., & Guglielmetti, F. 2001, Nature, 413, 139
- Mirabel & Rodrigues (2003) Mirabel, I. F., & Rodrigues, I. 2003, Science, 300, 1119
- Mirabel & Rodríguez (1994) Mirabel, I. F., & Rodríguez, L. F. 1994, Nature, 371, 46
- Nelemans et al. (1999) Nelemans, G., Tauris, T. M., & van den Heuvel, E. P. J. 1999, A&A, 352, L87
- Pacholczyk & Swihart (1967) Pacholczyk, A. G., & Swihart, T. L. 1967, ApJ, 150, 647
- Paragi et al. (2013) Paragi, Z., et al. 2013, MNRAS, 432, 1319
- Pe’er & Casella (2009) Pe’er, A., & Casella, P. 2009, ApJ, 699, 1919
- Petrov et al. (2006) Petrov, L., Kovalev, Y. Y., Fomalont, E. B., & Gordon, D. 2006, AJ, 131, 1872
- Plotkin et al. (2012) Plotkin, R. M., Markoff, S., Kelly, B. C., Körding, E., & Anderson, S. F. 2012, MNRAS, 419, 267
- Portegies Zwart & Yungelson (1998) Portegies Zwart, S. F., & Yungelson, L. R. 1998, A&A, 332, 173
- Ratti et al. (2012) Ratti, E. M., et al. 2012, MNRAS, 423, 2656
- Reid et al. (2014a) Reid, M. J., McClintock, J. E., Steiner, J. F., Steeghs, D., Remillard, R. A., Dhawan, V., & Narayan, R. 2014a, ArXiv e-prints
- Reid et al. (2014b) Reid, M. J., et al. 2014b, ApJ, 783, 130
- Reis et al. (2012) Reis, R. C., Miller, J. M., Reynolds, M. T., Fabian, A. C., & Walton, D. J. 2012, ApJ, 751, 34
- Rushton et al. (2012) Rushton, A., et al. 2012, MNRAS, 419, 3194
- Russell et al. (2011a) Russell, D. M., et al. 2011a, The Astronomer’s Telegram, 3689, 1
- Russell et al. (2010) Russell, D. M., Maitra, D., Dunn, R. J. H., & Markoff, S. 2010, MNRAS, 405, 1759
- Russell et al. (2013a) Russell, D. M., et al. 2013a, MNRAS, 429, 815
- Russell et al. (2011b) Russell, D. M., Miller-Jones, J. C. A., Maccarone, T. J., Yang, Y. J., Fender, R. P., & Lewis, F. 2011b, ApJ, 739, L19
- Russell et al. (2013b) Russell, D. M., et al. 2013b, ApJ, 768, L35
- Russell & Shahbaz (2014) Russell, D. M., & Shahbaz, T. 2014, MNRAS, 438, 2083
- Russell et al. (2014a) Russell, T. D., Soria, R., Miller-Jones, J. C. A., Curran, P. A., Markoff, S., Russell, D. M., & Sivakoff, G. R. 2014a, MNRAS, 439, 1390
- Russell et al. (2014b) Russell, T. D., Soria, R., Motch, C., Pakull, M. W., Torres, M. A. P., Curran, P. A., Jonker, P. G., & Miller-Jones, J. C. A. 2014b, MNRAS, 439, 1381
- Rybicki & Lightman (1979) Rybicki, G. B., & Lightman, A. P. 1979, Radiative processes in astrophysics (Wiley, New York)
- Sault et al. (1995) Sault, R. J., Teuben, P. J., & Wright, M. C. H. 1995, in Astronomical Society of the Pacific Conference Series, Vol. 77, Astronomical Data Analysis Software and Systems IV, ed. R. A. Shaw, H. E. Payne, & J. J. E. Hayes, 433
- Scheuer & Williams (1968) Scheuer, P. A. G., & Williams, P. J. S. 1968, ARA&A, 6, 321
- Schönrich et al. (2010) Schönrich, R., Binney, J., & Dehnen, W. 2010, MNRAS, 403, 1829
- Shepherd (1997) Shepherd, M. C. 1997, in Astronomical Society of the Pacific Conference Series, Vol. 125, Astronomical Data Analysis Software and Systems VI, ed. G. Hunt & H. Payne, 77
- Soleri & Fender (2011) Soleri, P., & Fender, R. 2011, MNRAS, 413, 2269
- Stirling et al. (2004) Stirling, A. M., Spencer, R. E., Cawthorne, T. V., & Paragi, Z. 2004, MNRAS, 354, 1239
- Stirling et al. (2001) Stirling, A. M., Spencer, R. E., de la Force, C. J., Garrett, M. A., Fender, R. P., & Ogley, R. N. 2001, MNRAS, 327, 1273
- Strohmayer & Smith (2011) Strohmayer, T. E., & Smith, E. A. 2011, The Astronomer’s Telegram, 3618, 1
- Taylor et al. (2009) Taylor, A. R., Stil, J. M., & Sunstrum, C. 2009, ApJ, 702, 1230
- Tingay et al. (1995) Tingay, S. J., et al. 1995, Nature, 374, 141
- van der Horst et al. (2013) van der Horst, A. J., et al. 2013, MNRAS, 436, 2625
- Willems et al. (2005) Willems, B., Henninger, M., Levin, T., Ivanova, N., Kalogera, V., McGhee, K., Timmes, F. X., & Fryer, C. L. 2005, ApJ, 625, 324
- Yang et al. (2010) Yang, J., Brocksopp, C., Corbel, S., Paragi, Z., Tzioumis, T., & Fender, R. P. 2010, MNRAS, 409, L64
- Yang et al. (2012a) Yang, J., et al. 2012a, MNRAS, 426, L66
- Yang et al. (2012b) Yang, Y. J., Curran, P., Kennea, J. A., & Kong, A. K. H. 2012b, The Astronomer’s Telegram, 4255, 1
- Yang et al. (2012) Yang, Y. J., Wijnands, R., & Kennea, J. A. 2012, The Astronomer’s Telegram, 3975, 1
- Zdziarski et al. (2014) Zdziarski, A. A., Pjanka, P., Sikora, M., & Stawarz, Ł. 2014, MNRAS, 442, 3243
| Date | MJD | Frequency | Flux density | |||
|---|---|---|---|---|---|---|
| (UT) | (GHz) | (mJy) | (mJy beam-1) | (mJy beam-1) | ||
| 2012 Sep 03 | 55807.1 | 4.60 | 27.20.3 | 0.240.05 | -0.290.06 | 0.640.03 |
| 7.90 | 38.40.5 | 0.670.06 | -0.490.07 | |||
| 2011 Sep 05 | 55809.1 | 5.00 | 23.20.3 | 0.080.02 | -0.080.02 | 0.840.04 |
| 7.45 | 32.50.4 | 0.180.02 | -0.160.02 | |||
| 2011 Sep 07 | 55811.2 | 1.50 | 18.10.4 | – | – | 0.510.01 |
| 5.00 | 28.60.7 | 0.250.07 | -0.130.07 | |||
| 7.45 | 39.30.9 | 0.580.09 | -0.080.08 | |||
| 20.80 | 682 | – | – | |||
| 25.90 | 792 | – | – | |||
| 32.02 | 885 | – | – | |||
| 41.00 | 878 | – | – | |||
| 2011 Sep 09 | 55813.2 | 1.60 | 24.90.5 | – | – | 0.430.01 |
| 5.00 | 33.70.6 | -0.000.06 | -0.150.05 | |||
| 7.45 | 41.40.9 | 0.290.05 | -0.490.05 | |||
| 20.80 | 662 | – | – | |||
| 25.90 | 732 | – | – | |||
| 32.02 | 955 | – | – | |||
| 41.00 | 1086 | – | – | |||
| 2011 Sep 12 | 55816.1 | 1.60 | 36.70.6 | – | – | 0.100.01 |
| 5.00 | 36.60.8 | 0.930.05 | -0.940.05 | |||
| 7.45 | 39.50.8 | 0.720.05 | -0.740.04 | |||
| 20.80 | 472 | – | – | |||
| 25.90 | 482 | – | – | |||
| 32.02 | 513 | – | – | |||
| 41.00 | 553 | – | – | |||
| 2011 Sep 13 | 55817.0 | 1.60 | 29.00.5 | – | – | 0.140.01 |
| 5.00 | 31.00.4 | 0.720.06 | -0.920.06 | |||
| 7.45 | 33.10.4 | 0.620.05 | -0.860.05 | |||
| 20.80 | 40.71 | – | – | |||
| 25.90 | 442 | – | – | |||
| 32.02 | 463 | – | – | |||
| 41.00 | 463 | – | – | |||
| 2011 Sep 18 | 55822.0 | 1.50 | 371 | – | – | 0.130.01 |
| 5.00 | 34.70.4 | 0.850.06 | -0.850.06 | |||
| 7.45 | 36.90.9 | 0.620.06 | -0.590.06 | |||
| 20.80 | 441 | – | – | |||
| 25.90 | 462 | – | – | |||
| 32.02 | 502 | – | – | |||
| 41.00 | 4413 | – | – | |||
| 2011 Sep 18 | 55822.9 | 1.56 | 332 | – | – | 0.140.01 |
| 5.00 | 29.70.4 | 0.720.07 | -0.750.07 | |||
| 7.45 | 31.30.4 | 0.580.06 | -0.560.06 | |||
| 20.80 | 35.50.7 | – | – | |||
| 25.90 | 382 | – | – | |||
| 32.02 | 442 | – | – | |||
| 41.00 | 372 | – | – | |||
| 2011 Sep 23 | 55827.061 | 5.00 | 32.70.8 | – | – | 0.340.02 |
| 7.45 | 34.00.8 | – | – | |||
| 20.80 | 512 | – | – | |||
| 25.90 | 542 | – | – | |||
| 32.02 | 623 | – | – | |||
| 41.00 | 664 | – | – | |||
| 2011 Sep 26 | 55830.9 | 5.00 | 14.10.4 | – | – | 0.510.02 |
| 7.45 | 14.80.4 | – | – | |||
| 2011 Sep 26 | 55830.9 | 20.80 | 271 | – | – | |
| 25.90 | 301 | – | – | 0.510.02 | ||
| 31.52 | 362 | – | – | |||
| 37.52 | 402 | – | – | |||
| 2011 Sep 30 | 55834.0 | 5.26 | 11.30.3 | – | – | 0.570.02 |
| 7.45 | 11.70.3 | – | – | |||
| 20.80 | 23.50.9 | – | – | |||
| 25.90 | 261 | – | – | |||
| 31.52 | 302 | – | – | |||
| 37.52 | 322 | – | – | |||
| 2011 Oct 07 | 55841.9 | 5.26 | 80.3 | – | – | 0.590.03 |
| 7.45 | 80.3 | – | – | |||
| 20.80 | 17.50.9 | – | – | |||
| 25.90 | 19.30.9 | – | – | |||
| 31.52 | 222 | – | – | |||
| 37.52 | 252 | – | – | |||
| 2011 Oct 12 | 55846.0 | 5.26 | 5.00.3 | – | – | 0.550.03 |
| 7.45 | 5.70.2 | – | – | |||
| 20.80 | 9.80.5 | – | – | |||
| 25.90 | 12.20.7 | – | – | |||
| 31.52 | 141 | – | – | |||
| 37.52 | 141 | – | – | |||
| 2011 Oct 22 | 55856.9 | 5.26 | 3.80.2 | – | – | 0.250.04 |
| 7.45 | 4.00.2 | – | – | |||
| 20.80 | 5.30.4 | – | – | |||
| 25.90 | 5.60.4 | – | – | |||
| 31.52 | 5.80.6 | – | – | |||
| 37.52 | 5.70.8 | – | – | |||
| 2011 Nov 01 | 55866.9 | 5.26 | 1.50.1 | – | – | 0.330.06 |
| 7.45 | 1.460.08 | – | – | |||
| 20.80 | 1.90.2 | – | – | |||
| 25.90 | 2.60.4 | – | – | |||
| 31.52 | 2.60.4 | – | – | |||
| 37.52 | 3.20.7 | – | – | |||
| 2011 Nov 11 | 55876.8 | 5.26 | 0.80.2 | – | – | 0.40.1 |
| 7.45 | 0.80.1 | – | – | |||
| 20.80 | 1.00.1 | – | – | |||
| 25.90 | 1.50.2 | – | – | |||
| 2011 Nov 18 | 55883.9 | 5.26 | 0.330.03 | – | – | 0.50.1 |
| 7.45 | 0.310.06 | – | – | |||
| 20.80 | 0.60.1 | – | – | |||
| 25.90 | 0.80.1 | – | – | |||
| 2011 Dec 03 | 55898.8 | 5.26 | 0.190.04 | – | – | 0.70.1 |
| 7.45 | 0.250.02 | – | – | |||
| 20.80 | 0.490.07 | – | – | |||
| 25.90 | 0.50.1 | – | – |