3C 57 as an Atypical Radio-Loud Quasar: Implications for the Radio-Loud/Radio-Quiet Dichotomy
Abstract
Lobe-dominated radio-loud (LD RL) quasars occupy a restricted domain in the 4D Eigenvector 1 (4DE1) parameter space which implies restricted geometry/physics/kinematics for this subclass compared to the radio-quiet (RQ) majority of quasars. We discuss how this restricted domain for the LD RL parent population supports the notion for a RQ-RL dichotomy among Type 1 sources. 3C 57 is an atypical RL quasar that shows both uncertain radio morphology and falls in a region of 4DE1 space where RL quasars are rare.
We present new radio flux and optical spectroscopic measures designed to verify its atypical optical/UV spectroscopic behaviour and clarify its radio structure. The former data confirms that 3C 57 falls off the 4DE1 quasar “main sequence” with both extreme optical Feii emission ( 1) and a large Civ1549 profile blueshift ( -1500 km s-1). These parameter values are typical of extreme Population A sources which are almost always RQ. New radio measures show no evidence for flux change over a 50+ year timescale consistent with compact steep-spectrum (CSS or young LD) over core-dominated morphology. In the 4DE1 context where LD RL are usually low L/LEdd quasars we suggest that 3C 57 is an evolved RL quasar (i.e. large Black Hole mass) undergoing a major accretion event leading to a rejuvenation reflected by strong Feii emission, perhaps indicating significant heavy metal enrichment, high bolometric luminosity for a low redshift source and resultant unusually high Eddington ratio giving rise to the atypical Civ1549.
keywords:
quasars: general – quasars: emission lines – quasars: line: profiles – quasars: individual: 3C 571 Introduction
The origin of radio-loudness in quasars remains a perplexing question fifty years after their discovery. Ironically radio-loud (RL) quasars were the first to be discovered despite the fact that today they account for only 8 of the low redshift quasar population. After 50+ years we do not know if RL quasars represent a distinct physical subset of the radio-quiet (RQ) quasar population or simply episodes through which all or most quasars pass. There is even confusion about the definition of a RL (or a RQ) quasar. In this paper we simplify the problem by focussing only on low redshift ( 0.7) Type 1 AGN/quasars that show broad (most in the range FWHM H =1000 – 12000 km s-1) emission line spectra including optical Feii emission. We assume that they represent the parent population of highly accreting AGN and interpret them in the 4DE1 context (Sulentic et al., 2000a, 2007; Zamfir et al., 2008, hereafter Z08).
We can unambiguously define a RL Type 1 quasar if we consider only the lobe-dominated (LD) RL sources which we assume to be the parent population of classical Type 1 RL quasars. They show radio/optical flux ratios 70, or better, 31.6 erg s-1 Hz-1. “Better” because we avoid sensitivity of optical flux measures to internal extinction/galaxy orientation effects. No bona fide LD sources are found below our specified limits. Our RQ-RL boundary is set by the radio luminosities of the weakest sources showing LD radio morphology (Sulentic et al., 2003). At low redshift (z <0.7) LD structure is seen only in quasars with bolometric luminosity brighter than log Lbol= 44.0 erg s-1. The 46 LD sources analysed by Z08 using an SDSS DR5 subsample of 470 quasars (0.7 and brighter than g=17.5 or i=17.5) show a radio luminosity range of nearly 3 dex ( =31.7-34.4 erg s-1 Hz-1) and also a 3dex optical range (44-47 erg s-1).
Core-dominated (CD) radio sources cannot be used to define a RQ-RL boundary because they span a radio luminosity range of 6 dex ( = 29 – 35) from weak radio-detected RQ to the most luminous RL sources found in SDSS DR5 (Z08 supplemented by de Vries et al., 2006). This corresponds to RK values from less than 10 to several thousand. The highest luminosity CD sources are interpreted as relativistically boosted LD sources oriented preferentially to our line of sight. Such sources often show apparent superluminal motions (e.g. Zensus et al., 2002). As we proceed from the strongest towards weaker CD sources, and approach radio luminosities 31.6 erg s-1 Hz-1 the problem becomes acute. They are not luminous enough to be aligned or misaligned LD sources. Across our adopted RQ-RL boundary (=70) only CD (and weak core-jet) sources are found and in numbers increasing with decreasing radio power. A survey of radio emission for PG quasars (Kellermann et al., 1989) led to a suggested RQ - RL boundary near RK =10 using both LD and CD detections. The choice of this boundary rather than =70 can have strong effects on statistical inferences when searching for differences between RL and RQ sources.
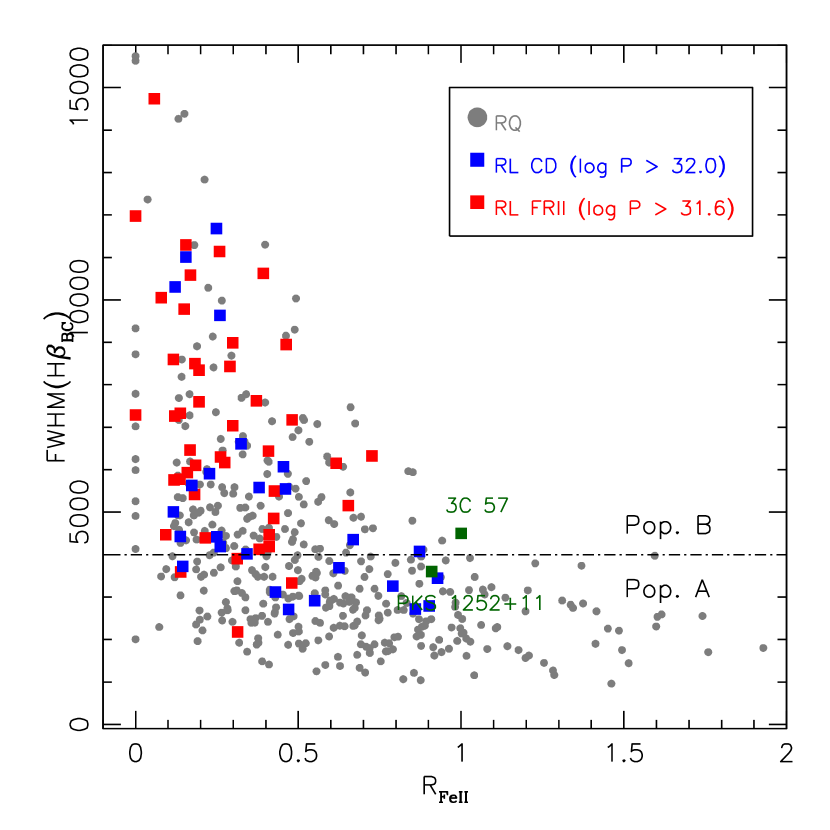
Contextualization can be helpful in relating quasar subclasses as well as the relation of individual sources to specific subclasses. Towards this goal we adopted a 4D Eigenvector 1 parameter space (Sulentic et al., 2000a, b, 2007) based on four diagnostic measures: 1) Full width half maximum (FWHM) of broad () H; 2) Flux ratio of optical Feii4570 blue blend and broad H (); 3) profile shift at half maximum of high ionization Civ1549 c(1/2) and 4) soft X-ray photon index (). In the 4DE1 domain RL sources do not distribute like the RQ majority but instead show a preference for FWHMH 4000 km s-1, 0.5, unshifted Civ1549 profile and absence of a soft Xray excess (i.e., 2). This is especially true for the LD RL parent population. Figure 1 shows the 4DE1 optical plane for the SDSS DR5 quasar sample (Z08) with LD RL marked as filled red squares, luminous CD sources ( 32.0) as filled blue squares and RQ quasars as filled grey circles. We designate sources above and below FWHM H=4000km s-1as Population B (Pop B) and Population A (Pop A) respectively. The difference in 4DE1 domain occupation can be argued to be evidence that RL sources (the majority are Pop B) are fundamentally different from RQ quasars. However this interpretation is complicated by the fact that 40% of RQ sources also occupy the same (Pop B) domain as the RL sources.
This paper considers an apparently nonconformist quasar 3C 57 (z= 0.67) that is unambiguously RL ( erg s-1Hz-1 and 3.0). As such we expect it to show RL typical (average) 4DE1 parameter measures: 1) FWHM H 6940 km s-1; 2) 0.22; 3) Civ1549 +50 km s-1 and 4) 2.15 (Sulentic et al., 2007). In two of the four measures, 3C 57 is wildly discordant showing: 1 and Civ1549 blueshift km s-1 (Sulentic et al., 2007, and this paper). These values are even extreme for RQ Pop A quasars. RQ sources have average values of Civ1549 = -580 km s-1 and 0.48 (Marziani et al., 1996; Sulentic et al., 2007; Richards et al., 2011).
New spectra were obtained for 3C 57 with three motivations: 1) to verify FWHM H and confirm the previous unusually high measures, 2) to search for changes in the H profile that are sometimes observed in RL sources (Corbin & Smith, 2000) and 3) to obtain high S/N line profile measures of Mgii2800 for use as a potentially more reliable Black Hole (BH) mass estimator (Marziani et al., 2013a, b). New radio observations were also obtained to shed light on the ambiguous morphological interpretations of 3C 57. It is very radio luminous and its apparent core-jet structure leads us to expect flux variations over the 50+ year time span since its discovery.
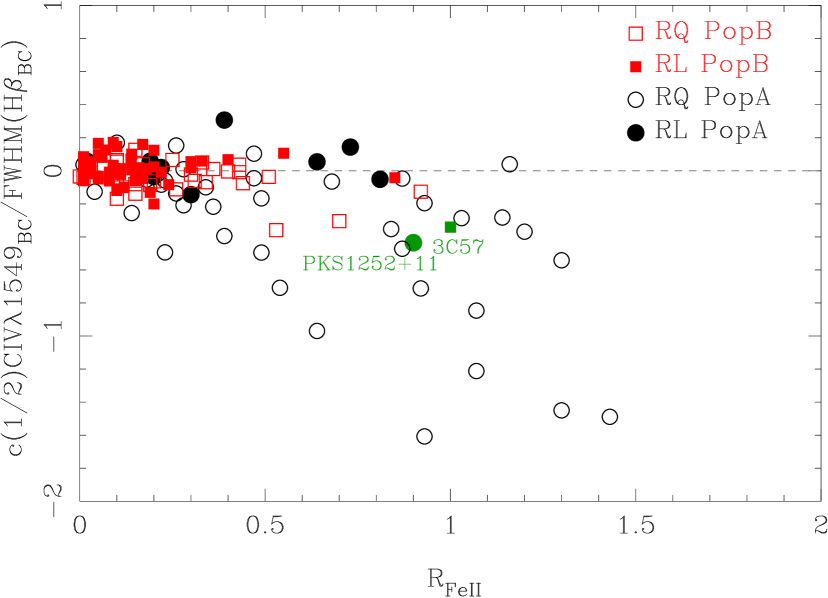
The HST archive contained usable spectra for 130 low quasars as of late 2006 with a strong bias for RL sources. Figure 2 shows a UV-optical plane of 4DE1 where FWHM normalized Civ1549 centroid shift is plotted against . Open/filled black circles show RQ and RL Pop A quasars respectively. RQ and RL Pop B sources are indicated by open/filled red squares. Six of the 59 RL sources in the HST-FOS archival sample show a Civ1549 blueshift larger than 1000 km s-1while the mean centroid shift value for the RL sources is +52km s-1(Sulentic et al., 2007). If one normalizes the shift value by FWHM H we find two sources that stand out: 3C 57 and PKS 1252+11. This plot best illustrates the nature of 3C 57. We present here new radio and optical spectroscopic data that we hope will shed some light on the nature of 3C 57 (and PKS 1252+11) and why it (they) contravenes the clear trends in 4DE1. UV data have been taken from the HST-FOS archive and reanalysed. We use this to reconsider the definitions of radio-loudness.
New optical and radio observations are presented in Section 2 along with details of spectral analysis in 2.1. Section 3 presents results from analysis of new and literature data. Section 4 discusses the relation between RL quasars, Civ1549 blueshifts, and the possible RQ-RL dichotomy. 4.3 considers how winds might be affected by radio outbursts while section 5 summarizes our inferences and conclusions.
| Obs: | ORM | CAHA | Asiago |
|---|---|---|---|
| Tel | NOT2.5m | 3.5m | 1.82m |
| Instr. | ALFOSC | TWIN | AFOSC |
| Scale | 0.19”/px | 0.56”/px | 0.26”/px |
| Grism | GR5 | T13 and T11 | GR4 |
| Slit | 1.3” | 1.2” | 1.26” |
| Disp | 3.15Å/px | 2.14Å/px | 4.92Å/px |
| 2.41Å/px | |||
| Range | 5550-9400Å | 3400-5800Å | 3200-8200Å |
| 5450-10150Å | |||
| Date | 29Aug2011 | 22Oct2012 | 05Dec2012 |
| Texp | 4x900s | 3x900s | 3x1200s |
| Flux (mJy) | Reference |
|---|---|
| 3C 57 | |
| 1390 80 | Kuehr et al. 1981 |
| 1350 | Wright et al. 1990 |
| 1372 72 | Griffith et al. 1994 |
| 1441 30 | This paper (Observed in 2011) |
| PKS 1252+11 | |
| 1140 50 | Kuehr et al. 1981 |
| 1030 70 | Kuehr et al. 1981 |
| 641 | VLA, Laurent-Muehleisen et al. 1997 |
| 961 30 | This paper (Observed in 2011) |
2 Observations
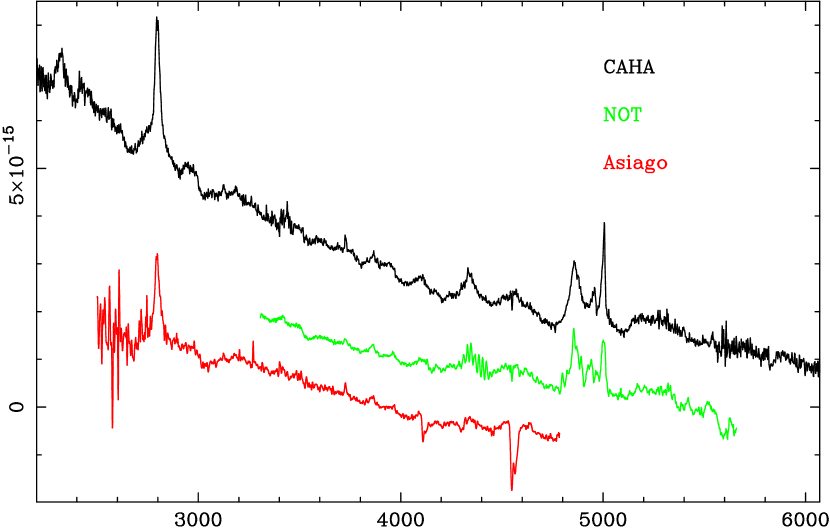
New long slit optical spectroscopic observations of 3C 57 were carried out in three different telescopes: Calar Alto Observatory (CAHA, Almería Spain), El Roque de los Muchachos Observatory (ORM La Palma, Spain) and Asiago Observatory (Italy), in three different runs within a 15 month period. Table 1 summarizes the new data where we tabulate the instrumental setup for each observation as follows: telescope, spectrograph, spatial scale in arcsec/px, used grism, slit width in arcsec, spectral dispersion in Å/pix and wavelength range. We also report the date of observation and the total integration time. The slit was oriented at parallactic angle to minimize effects of atmospheric differential refraction in the spectra. In the case of the TWIN spectrograph at CAHA with two arms, the observations were obtained simultaneously in the blue (grism #T13) and red (#T11) spectral regions. The three new spectra are plotted in Figure 3 with CAHA, NOT and Asiago spectra shown in black, green and red respectively. NOT and Asiago spectra have been vertically shifted to avoid confusion.
Data reduction was carried out in a standard way using the IRAF package. Spectra have been overscan corrected, nightly bias subtracted and flat-fielded with the normalized flat-field obtained after median combination of the flats. Wavelength calibration was obtained using standard lamp exposures. The apall task was used for object extraction and background subtraction. Instrumental response and flux calibration were obtained each night through observations of spectrophotometric standard stars from the list of Oke (1990) that we also use to remove telluric absorption bands.
New 5 GHz radio observations of 3C 57 were also carried out during November 14, 2011 using the single dish 32 m IRA-INAF antenna at Medicina in on-the-fly cross-scan mode. PKS 1252+11, the other known RL with a large Civ1549 blueshift, was also observed on Nov. 15 2011. Flux calibration was achieved using standard sources from the list of Ott et al. (1994). Fluxes and uncertainties that include calibrator uncertainty are reported in Table 2.
UV data have been taken from the HST-FOS archive. A re-analysis of UV spectra is presented in this paper. The 3C57 spectrum covers Siiv1397, Civ1549 and Ciii]1909 and was presented in Sulentic et al. (2007).
2.1 Multicomponent analysis
All strong emission lines in the spectra were fit using the IRAF task specfit which employs a minimization technique appropriate for nonlinear multicomponent analysis (Kriss, 1994). Marziani et al. (2009) provide a thorough description of analysis procedures for the optical spectral range; Marziani et al. (2013a, b) of the Mgii2800 range and Negrete et al. (2014) for the UV spectral range.
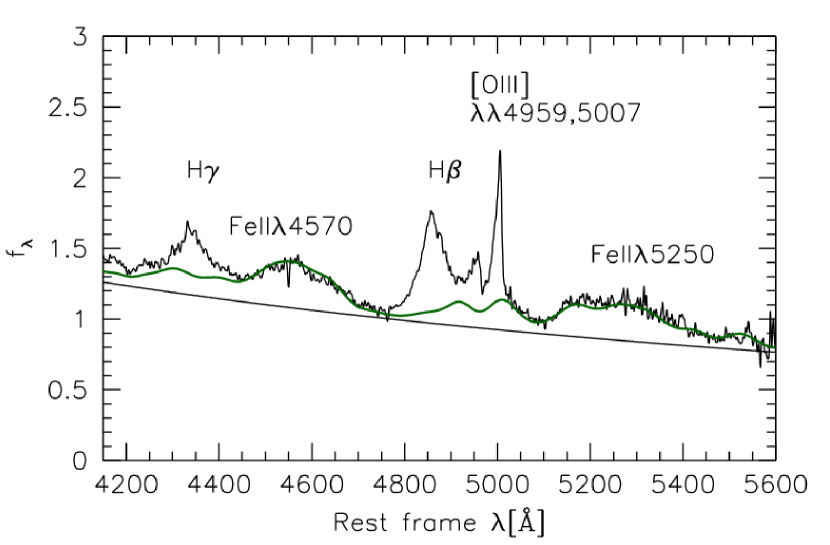
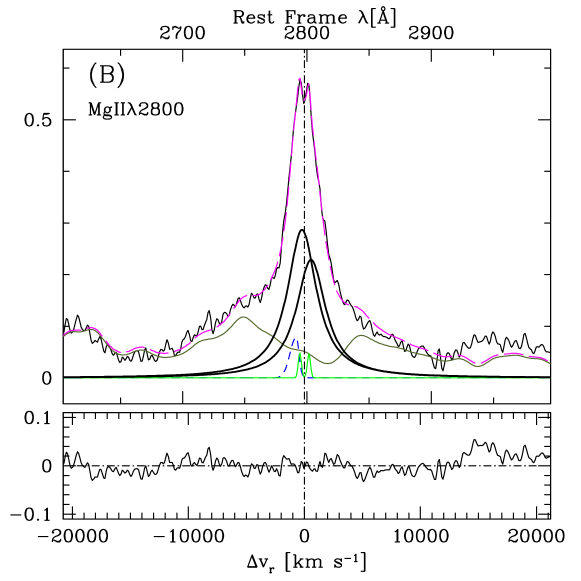
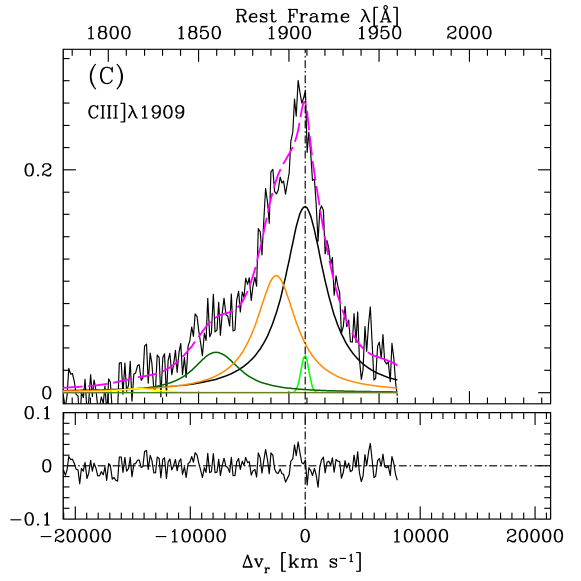
All broad components were fit with Lorentzian profiles and the remaining lines with Gaussians (see §3.2 for a justification of this procedure). The specfit task adopted a power-law continuum dominating over any host galaxy contribution (MgII absorption band was not detected), as well as Feii templates in both the optical and UV. We use the Feii templates obtained by Marziani et al. (2009) for the H spectral region and Bruhweiler & Verner (2008) for the UV. The specfit task then scales and chooses an optical broadening factor for the template that minimises . The minimisation procedures involve all components (continuum, Feii, emitting line components, etc.) simultaneously in order to construct a model of the spectrum. This allows us to consider the [Oiii]4959 and[Oiii]5007 lines with proper physical constraints (same shift and FWHM and a ratio 1:3; Dimitrijević et al. 2007), and to avoid any subjectivity in the placement of continuum. Spectral coverage was wide enough to ensure that a portion of continuum with no or faint emission features was available to the fitting routine. Since we are mainly interested in a detailed reproduction of line profiles, a local continuum was fit for each spectral region considered in this study. Fig. 4 shows the continuum and Feii placement from the specfit analysis of the H spectral range as an example of our approach. The fitting routine allows for the pseudo continuum created by Feii emission and the fitted spectral range is wide enough to include wavelength intervals where the pseudo-continuum is low. Note that the continuum and Feii emission were not set a priori, but computed in the same minimum fits that allowed us to retrieve H and other emission line parameters. Line fits (after continuum subtraction) are shown in Fig. 5. All fits were carried out over a wide wavelength range; however, we show four windows restricted to a lower range of the H (CAHA), Mgii2800 (CAHA), Ciii]1909 blend(FOS) and Civ1549 (FOS) centroids to facilitate comparison. Residuals are shown below each fit.
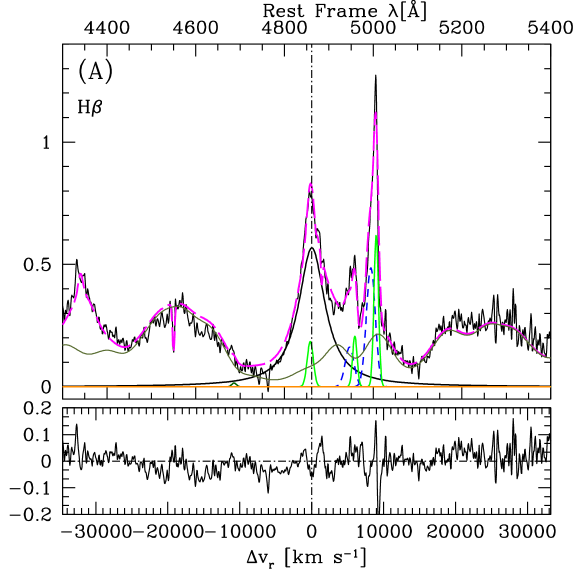
We used a window from 4200Å to 5500 Å to fit H which include H+[Oiii]4363, Heii4686 and [Oiii]4959,5007. Fits (see Fig.5a) assume that [Oiii]4959 and [Oiii]5007 have the same FWHM for narrow and blueshifted semibroad components and that their flux ratio is [Oiii]4959 /[Oiii]5007=1/3. Two components, narrow () and broad (), were considered to model H. We also fit H assuming the same number of components (narrow and broad) as H (and same FWHM values). From the H fits we obtain also an optical Feii flux (99 erg s-1 cm-2) that together with measures of H (95 erg s-1 cm-2) yields an estimate of 4DE1 parameter (1).
Modelling of Mgii2800 used a 2600Å – 3050Å window where only this blend was detected. Each line of the Mgii2800 doublet was fitted by assuming broad, narrow and semi-broad blueshifted components (Fig 5b). The spectral window 1720Å – 1960Å includes Ciii]1909 Siii1814 (in yellow), Aliii1860 (in dark green), Siiii]1892 (in orange) and Feiii1914. FWHM of broad components of Siii1814, the doublet of Aliii1860, and Siiii]1892 are assumed to have the same value as Ciii]1909. We also assume a narrow component for Ciii]1909. For the sake of comparison we expand the window to 2045Å in Fig 5c.
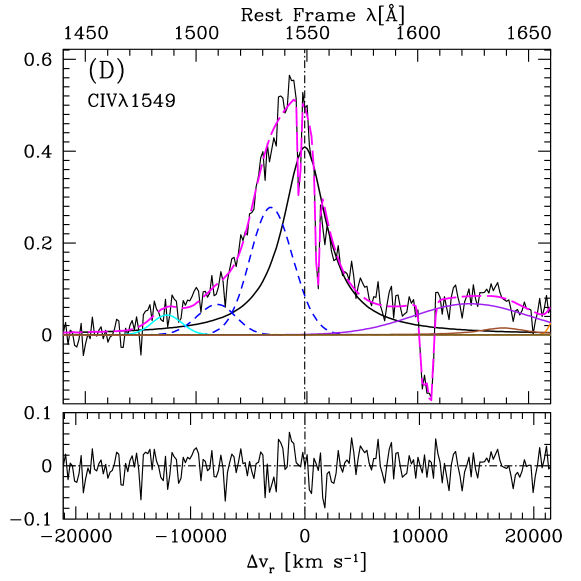
The Civ1549 model (Fig.5d) includes unshifted and blue components (in black and blue respectively) and the fits to Niv]1486 (in cyan), Siii1533 , Heii1640 and Oiii]1663. We assume that Heii1640 also shows broad and blue components (shown in brown and violet respectively) with the same FWHMs and shifts as broad and blue Civ1549. All these measurements are listed in Table 3 where we include measures of equivalent width, flux, FWHM and shift (with respect to the narrow component). We give broad, blue and total fitting parameters for Civ1549. Reported uncertainties have been computed by measuring the effect, on each parameter, of the change of continuum placement. To do that we repeat the specfit analysis changing the continuum by +/- 1 sigma level, that for the S/N accounted in the spectra means 2-3%. We also add quadratically the formal fitting error provided by specfit. The corresponding uncertainties are in agreement with those obtained for similar S/N data by Marziani et al. (2003a, 2013b), Negrete et al. (2013, 2014) and Marziani & Sulentic (2014). For the heavily blended lines at 1900Å FWHM and intensity uncertainties were estimated through a analysis of a mock spectrum with the same S/N and intensity ratio and line width (as done in Negrete et al. 2014).
3 Results
3.1 3C 57: A Steep Spectrum Radio-Loud Source
3C 57 shows strong radio emission with = 34.4 erg s-1 (Griffith et al., 1994) and 1400 (see Table 4). Both parameters indicate a classical RL quasar. 3C 57 has been a dangerous source in the past because of its compact structure leading to inclusion in samples of CD sources (Wills et al., 1992) while its steep spectrum (SS: = -0.7) warned that it was resolved (Morganti et al., 1993). More recent VLA maps (Reid et al., 1999) finally resolved the central core source into an elongated structure. The optical position of the quasar lies near the centre (see Fig 6) of the elongated source suggesting that it could be an LD RL with lobe separation of 1.5 arcsec. If the two peaks are interpreted as lobes then the flux ratio suggests some degree of alignment towards our line of sight. If the quasar coincides with the weaker (north) peak then a core-jet morphology would be implied putting it in the same class as PKS 1252+11. The small separation (17 kpc projected) also suggests either a preferred alignment and/or a young LD. A satellite component about 15 arcsec distant may be the relic of a past outburst. It shows no connection to the central elongated source which contains the bulk of the radio flux.

3C 57 is not included in the 470 brightest SDSS-DR quasar sample because it lies outside the SDSS fields. It is useful to compare it with the 46 LD RL sources in the SDSS-DR5 sample. Considering the distribution of all these sources in the plane defined by optical and radio luminosities ( vs ; see Figure 6 in Z08) we find that 3C 57 is located in the upper right corner revealing extreme radio and optical properties relative to this local RL sample. Actually the bolometric luminosity of 3C 57 ( 46.98) is higher than all 470 sources in the SDSS-DR5 sample. In the upper corner of this plane we find the most luminous CD RL quasars which are the best candidates for relativistically boosted sources while LD in this corner are the best candidates for young RL sources. Our motivation for new radio observations was to search for variability which might be expected if 3C 57 (or PKS 1252+11) were an aligned CD source. The 5 GHz specific fluxes reported in Table 2 show no evidence for changes in radio power over 30+ years. The high and stable radio power favours the idea that 3C 57 is a young LD quasar (instead of a relativistically boosted source) oriented with jet lobe axis far from our line-of-sight. Since the radio power did not change we can assume that the large radio power and the unusually large Civ1549 blueshift coexist at the same time. Spectral index and linear size of 3C 57 meet defining criteria for CSS sources (O’Dea, 1998). Absence of variability and resolved double radio morphology are consistent with 3C 57 as a young somewhat aligned lobe-dominated source.
The new and older radio observations for PKS 1252+11 (Table 2) show evidence for possible changes (fading) consistent with its Flat Spectrum (FS) CD morphology.
| Obs. | EW (Å) | Fluxa | FWHMb | Shiftb |
|---|---|---|---|---|
| [Oiii]5007 | 8 | 131 | 72557 | +187 |
| [Oiii]5007BLUE | 12 | 202 | 1426145 | -535 |
| HBC | 62 | 9510 | 4500470 | +223 |
| Feii4570 | 56 | 9910 | — | — |
| Mgii2800BC | 25 | 12210 | 3056245c | +189 |
| Ciii]1909BC | 11 | 17717 | 4318430 | 0d |
| Siiii]1892BC | 7 | 11018 | 4318430 | 0d |
| Aliii1860BC | 3 | 3912 | 4318430c | +248 |
| Civ1549Tot | 26 | 56757 | 6714673 | -1454 |
| Civ1549BC | 17 | 37632 | 4627398 | +51 |
| Civ1549BLUE | 9 | 20026 | 4729602 | -3034 |
(a) In units of erg s-1 cm-2. (b) Relative to the central wavelength of the narrow component in km s-1.(c) FWHM of a single broad component. (d) Fixed.
3.2 Optical and UV properties
The new spectroscopic measurements confirm that 3C 57 shows mixed characteristics of a Pop A ( 1) and Pop B (FWHM H = 4500 km s-1) source. Coming back to Figure 1 the marked CD RL are the sources most likely connected to the LD parent population in an orientation-unification scenario. If the radio axis is oriented perpendicular to a broad line emitting accretion disk in such a scenario, the CD tend to show smaller FWHM H and stronger Feii expected if the disk is oriented closer to face-on. 3C 57 is clearly an outlier in this plot. Technically it falls in 4DE1 bin B2 (Sulentic et al., 2002) but the bin boundaries shift upwards for higher luminosity quasars (Marziani et al., 2009). The bolometric luminosity of 3C 57 is high enough to place it in bin A2 which would be more consistent with measured and Civ1549 shift values. We do not detect a significant Mgii2800 blueshift which is also consistent with bin A2 quasars (Marziani et al. 2013a, blueshifts are most common in bin A3/A4 sources). The Civ1549 profile shows an outflow-dominated profile that can be fit with: 1) a symmetric (assumed equal to the scaled and shifted H profile) plus 2) a strong excess on the blue side – modelled here using two gaussians.111Note that the total excess with respect to the is assumed to model the radial component of the wind/outflow. Its shape offers an observational constraint for outflow models. No meaning can be ascribed to the individual Gaussian components used to model the blue excess. Our reanalysis of the UV spectrum (more detailed than the one carried out in 2007) confirms a large shift amplitude (typical of extreme Pop A sources) with total profile shift at FWHM -1454 km s-1and a shift of the modelled blue component of -3000 km s-1(Table 3).
Another difference between Pop A and Pop B sources involves the shape of broad H. Pop A and Pop B profiles are best fit with Lorentzian and (double) Gaussian models respectively. Given that the optical/UV data are consistent with a Pop A source we report in Table 3 intensity values derived from Lorentzian fits. Normalized Civ1549 blueshifts with amplitude greater than 1000 km s-1are relatively frequent among largely RQ Pop A sources (Figure 2). They are rare among RL sources not only at low- but also at high for sources of similar luminosity (Sulentic et al., 2014). Higher luminosity ( 47) RL quasars no longer exist in the local Universe. Results for high redshift quasars from an SDSS analysis suggest that Civ1549 blueshifts may be much more common even among RL sources (Richards et al., 2011). At lower or , as can be seen in Figure 2, there is a strong concentration of mostly Pop B RL around mean values = 0.2 and = 0 km s-1. The RQ Pop A sources show a much wider parameter space dispersion towards larger and Civ1549 blueshifts. 3C 57 in this plot (and PKS 1252+11) is located in the Pop A domain and shows the most extreme properties for a RL quasar in the HST low sample.
3C 57 was monitored in the Catalina Real-time Transient Survey (CRTS, Drake et al. 2012) for almost seven years (from JD 53705.20724 – 56250.55267). No large V magnitude variations were detected with an average V magnitude (computed from 269 observations) . The rms scatter was 0.09 which is comparable to the quoted uncertainty of individual measurements (0.08 - 0.1). There is evidence for small amplitude nonrandom variability (possibly sinusoidal, amplitude 0.1) but a more detailed study would be needed. There is no observational evidence of a significant change in the line profiles in our spectra. We verify this by scaling the NOT and CAHA spectra that cover H and the CAHA and Asiago spectra that cover Mgii2800. A difference between CAHA and NOT on the red side is due to the poor correction because of telluric absorption in the NOT. The Asiago spectrum is not well corrected for atmospheric extinction at its blue end. The line profiles look consistent if data quality is taken into account.
3.3 RL Sources With Large Civ1549 Blueshifts.
3C 57 is not unique as a RL source showing a significant Civ1549 profile blueshift. It is one of six RL sources in the HST-FOS archive with Civ1549 blueshift -1000 km s-1 (Sulentic et al., 2007). Observational properties are presented for these sources in Table 4. For each object we list the 4DE1 parameters (FWHM H, Civ1549 shift, the normalized shift using FWHM H and ), EW(Civ1549), accretion parameters (, log and log ) and the radio properties ( , morphology, spectral index () and lobe separation). The 4DE1 parameters and EW(Civ1549) were taken from Sulentic et al. (2007). In the case of 3C 57 we have recalculated FWHM H, , Civ1549 shift and EW(Civ1549) using the new data. In the accretion parameters the bolometric luminosity () is estimated from the luminosity at 5100Å assuming the standard bolometric correcting factor (10; Richards et al., 2006), the have been computed with the L-FWHM scaling from Vestergaard & Peterson (2006).
| Name | 4DE1 parameters | Accretion parameters | Radio-loudness parameters | ||||||||||||
|---|---|---|---|---|---|---|---|---|---|---|---|---|---|---|---|
| FWHM H | Shift | ShiftNorm | EW(CIV) | Morph.a | Sep. | ||||||||||
| km s-1 | km s-1 | Å | erg s-1 | M⊙ | erg s-1Hz-1 | arcsec | |||||||||
| 3C 057 | 4500 | 1.0 | -1454 | -0.32 | 2.28 | 18 | 46.83 | 8.98 | -0.26 | 3.078 | 33.71 | SS LD/CJ | -0.58 | 1.50 | |
| Pictor A | 18400 | 0.01 | -1110 | -0.06 | 2.34 | 176 | 43.72 | 8.51 | -2.90 | 4.217 | 32.60 | SS LD | -1.58 | 480.00 | |
| PKS 1252+11 | 3600 | 0.90 | -1570 | -0.44 | 1.88 | 23 | 46.85 | 8.99 | -0.25 | 2.971 | 33.56 | FS CJ | -0.16 | 0.03 | |
| PKS 1355-41 | 8978 | 0.10 | -1070 | -0.12 | 1.96 | 74 | 46.13 | 9.17 | -1.15 | 2.856 | 33.34 | SS LD | -0.82 | 48.00 | |
| 3C 390.3 | 12688 | 0.12 | -1285 | -0.10 | 1.8 | 132 | 44.83 | 8.78 | -2.06 | 3.450 | 32.48 | SS LD | -0.78 | 210.00 | |
| PKS 2349-01 | 5805 | 0.20 | -1170 | -0.20 | 2.44 | 291 | 45.78 | 8.60 | -0.94 | 2.961 | 32.59 | SS LD | -0.74 | 18.00 | |
(a) SS LD corresponds to Steep Spectrum Lobed Dominated and FS CJ corresponds to Flat Spectrum Core Jet
The radio parameters for 3C 57 and PKS 1252+11 have been updated to the values derived in this paper while those for the remaining objects have been calculated from the best available data in the literature (FIRST data preferred).
The sources in Table 4 show a large diversity in 4DE1 optical/UV/X-ray measures as well as radio properties. Four of them fall in the Pop B optical domain of 4DE1 as expected for RL sources. The two associated with sources showing FWHM H 10000 km s-1(Pictor A and 3C 390.3) cannot be usefully compared with 3C 57 since they show such broad, and occasionally double-peaked, profiles. If we normalize the Civ1549 shift by either FWHM H or FWHM Civ1549BC the shift of such sources becomes much less significant compared to 3C 57. The normalized Civ1549 shifts of the two other Pop B sources (PKS 1355-41 and PKS 2349-01) also become less prominent after normalization. The source that remains most similar to 3C 57 is PKS 1252+11 (Fig. 2) which also shows strong Feii placing it outside of the Pop B domain. Five of six sources in Table 4 show steep spectrum radio SEDs and double lobe morphology. The exception is PKS 1252+11 with a flat spectrum and core-jet (CJ) morphology. CD sources come in two flavours. Those with steep (CSS) and flat (FS/CS) radio SEDs. The former and latter are sometimes referred to as ”young” and ”frustrated” radio sources respectively. The former are interpreted as birthing LD sources (e.g. van Breugel et al., 1984) while the latter might be failed attempts to generate LD sources, frustrated by a spiral host galaxy morphology (Fanti et al., 1995) or perhaps an unfavourable BH spin. 3C 57 appears to be a good candidate for a young LD.
Three of the sources in Table 4 can be argued to show ”young” radio morphology – two (3C 57 and PKS 2349-01) with very closely-spaced LD structure and PKS 1252+11 interpreted as an LD precursor or dying frustrated source. The other three LD sources show wide enough lobe separations to preclude the assumption of a recent outburst. If we focus on 3C 57 and PKS 1252+11 as the sources with largest normalized Civ1549 shift then we can argue that these sources should be considered separately from the others. The outburst age might be related with the surprisingly large Civ1549 outflows where the RL activity has not yet disrupted the wind. In such a scenario we assume that the scarcity of large Civ1549 blueshifts in RL sources, compared to RQ where they are common, involves quenching of the outflows by the onset of radio activity.
For the sake of comparison, one can also consider superluminal 3C 273 arguably the first quasar. It shows log(P20cm) erg s-1 Hz-1 similar to 3C 57 with a core-jet (or core-lobe) morphology similar to PKS 1252+11. The Civ1549 shift c()=-552 km s-1while = 0.57 and FWHM H3500 km s-1places it in bin A2 of the 4DE1 optical plane. These properties make 3C 273 a Pop A source consistent with the interpretation that is an aligned LD with undetected far-side lobe. In the optical plane of 4DE1 (Figure 1) it lies at the transition region between LD and CD sources. One can search for additional RL sources showing large Civ1549 shifts in the SDSS archive. The catalogue of Shen et al. (2011) reveals (among 2347 RL quasars with 100 and ) a total of 43 sources with Civ1549 blueshift 2000 km s-1. Visual examination of the spectra suggests that perhaps ten have high enough S/N to make the blueshift credible and to tentatively assign them (using the UV criteria of Negrete et al. 2014; Marziani & Sulentic 2014) to 4DE1 bins A2/A3. 3C 57 is not unique but apparently belongs to a tiny minority of RL sources showing significant Civ1549 blueshifts and extreme (high ) bin A2/A3 properties.
4 Discussion
4.1 Civ1549 blueshifts and RL quasars.
Low redshift quasar samples (Sulentic et al., 2000a; Marziani et al., 2003a; Zamfir et al., 2010) show LD RL sources occupying a restricted zone in Eigenvector space (Figure 1). RL sources are largely what we call Pop B quasars which are characterised by: 1) broad Balmer line profiles (FWHM H 4000 km s-1), 2) weak Feii optical emission ( 0.5), 3) absence of a Civ1549 blueshift and 4) absence of a soft-X-ray excess. RQ sources sharing the Pop B zone with the RL also show weak or absent Civ1549 blueshifts (Kuraszkiewicz et al., 2004; Sulentic et al., 2007). Perhaps the absence of Civ1549 blueshifts is related to Pop B rather than to radio-loudness, or perhaps the RQ Pop B sources are pre/post-cursors of RL activity. Do they all possess the same trigger (BH spin and/or host galaxy morphology) that enables radio-loudness?
There is of course also the issue of quasar luminosity. A recent comparison between low sources (HST-FOS spectra) and 20 quasars at z 2.3 0.2 using the GTC (in a narrow bolometric luminosity 0.5 erg s-1 range Sulentic et al. (2014)) shows no evidence for significant Civ1549 blueshifts in either sample. Apparently Civ1549 blueshifts are not common in Pop B sources below 46.5 erg s-1 and are possibly even rarer in RL sources. Is Civ1549 blueshift correlated with source luminosity? Our main study (Sulentic et al., 2007) – that has the considerable advantage of reliable rest frame estimations based on narrow emission lines – suggests that the answer is “no”. 4DE1 parameters do not directly correlate with source luminosity which was found to be an Eigenvector 2 parameter (Boroson & Green, 1992). All of our studies involving low samples, and also a higher redshift VLT sample of 53 quasars (Marziani et al., 2009), point towards Eddington ratio as the principal driver of 4DE1 diversity and hence of the Civ1549 blueshift. The Pop A end of the 4DE1 main sequence shows systematically higher values of Eddington ratio than the Pop B end. Indeed we find that 3C 57 shows an unusually high Eddington ratio for a RL quasar (Table 4).
Why do large SDSS samples (Richards et al., 2011) point toward a near ubiquity of Civ1549 blueshifts including, albeit smaller, Civ1549 blueshifts in the majority of RL quasars? Our mean/median Civ1549 blueshift (-600100 km s-1) values for RQ sources is in general agreement with their SDSS results in the = 45-47 erg s-1range. The systematic discrepancy appears in RL sources. The explanation can be due two effects: 1) they do not use the improved redshift determinations from Hewett & Wild (2010) for RLs (only for RQ) and 2) they use the old definition for the RQ-RL boundary 10. As explained earlier we adopt 70 (and/or erg s-1 Hz-1) for this boundary. In Figure 1 we adopt a more extreme boundary ( erg s-1 Hz-1) for RL CD sources only–under the assumption that marginally strong CD sources are unlikely to be aligned LDs. We argue that the pure CD population between 10 and 70 are not classical RLs. Many may be LD precursors but they are still growing. There are a lot of sources in Richards et al. (2011) with between 10 and 70. If our interpretation is correct then we expect them to show Civ1549 properties similar to the RQ majority. This would add a large number of Civ1549 blueshifts to the “RL” population that do not belong there. A new and larger SDSS based sample of LD sources (Kimball et al., 2011) fully confirms our adopted RL limit.
4.2 The nature of 3C 57 and implications for the RQ/RL Dichotomy.
The outstanding property of 3C 57 involves the coexistence of a large Civ1549 blueshift with a RL source showing young core-jet (or aligned LD) structure. This implies that powerful relativistic ejection and a high ionization wind, thought to be associated with the accretion disk, can coexist. It also implies that powerful radio emission can occur in a quasar radiating at a relatively high Eddington ratio. This goes against previous arguments that powerful radio emission is unsteady, or even impossible at high (Fender & Belloni, 2004; Ponti et al., 2012; Neilsen & Lee, 2009). Those theoretical arguments are however based mainly on Galactic black hole X-ray binaries and it is not obvious that a close analogy with quasars can be made. It also appears to violate 4DE1 empiricism (Figure 1) where RL sources occupy the low end of the quasar main sequence.
The two main emission components in 3C 57 (at 5 GHz) show a projected separation of kpc which is approximately twice the effective radius ( 8 kpc, Kotilainen & Falomo 2000) inferred for the host galaxy. The projected linear size is consistent with a CSS SED source showing kpc-scale radio emission comparable to the size of the host galaxy. The development of extended (LD) radio emission requires a time , where is the speed at the working surface of the jet (Krolik, 1999, p. 298), and is the separation between the two lobes then yrs in the case of 3C 57. The central black hole mass is estimated to be M⊙ (Table 4) with an efficiency of 0.07 (Netzer, 2013). The time needed for growing to this mass value is yr if the source has been constantly accreting matter at a rate of 17 M⊙yr-1 – implied by the observed / ratio ( -0.26). The accretion time scale is an upper limit that includes the possibility of re-igniting the RL quasar activity.
Wu (2009b) found that CSS sources exhibit a rather high median value of ( = -0.56) that is typical of the A2 spectral region (-0.52) following Marziani et al. (2013b). Wu (2009a) suggested that a relatively short duty-cycle is triggered by a radiation pressure instability within an optically thick, geometrically thin accretion disk (Czerny et al., 2009). In this interpretation, the detached radio component seen about 15 arcsec away from quasar may be a relic of past activity cycles.
The optical and UV spectra of 3C 57 are consistent with a scenario usually associated with Pop A sources of spectral types A2/A3 i.e., young or rejuvenated sources in the 4DE1 scheme. The wide majority of these sources are RQ and associated with higher accretion rates, enhanced star formation and chemical enrichment (Marziani et al., 2001; Sani et al., 2010; Marziani & Sulentic, 2014). These are the sources that most frequently show a Civ1549 blueshift in excess of -1000 km s-1. Zamanov et al. (2002) suggest that [Oiii]4959,5007 blueshifts are also associated with the high-ionization outflow originating in these highly accreting sources. 3C 57 is not a blue outlier however, the [Oiii]5007 profile shows a striking blueward asymmetry that can be modelled assuming a core plus semibroad component with a relatively large blueshift. This is at variance with evolved Pop B LD (FRII) sources that show large EW [Oiii]5007 along with a narrow and symmetric core that appears to be consistent with dominance of the gravitational field of the host spheroid (e.g., Boroson, 2003; Marziani et al., 2003b, 2006; Buttiglione et al., 2011). The relatively low equivalent width of [Oiii]5007 as found in 3C 57 has also been associated with a relatively young, not fully developed narrow line region (Zamanov et al., 2002; Komossa et al., 2008).
4.3 Is the wind ubiquitous and how are outflow properties affected by radio-loudness?
The jet kinetic power can be written as
| (1) |
where is the front end surface of the jet of solid angle at distance from the black hole, is the jet bulk expansion velocity and the jet pressure within .
| (2) |
where is in units of erg s-1 (typical RL values are , Gu et al. 2009), is in units of sterad, is at 0.1 pc ( Rg for a black hole mass of M⊙) and is the jet bulk expansion velocity in units of km s-1. exceeds the thermal pressure of the Broad Line Region (BLR) gas:
| (3) |
(where is the mass density, the temperature in units of K, and the number density in units of cm-3), as well as the hydrostatic pressure of a column of gas like the one expected to emit the blueshifted component ascribed to the accretion disk wind:
| (4) |
where is ambient gas column density in units of cm-2, and is the black hole mass in units of solar masses. The first implication is that there should be a zone of avoidance close to the radio axis. A second implication is that the cocoon associated with the powerful relativistic ejection is also expected to sweep the gas within the broad line region. Elementary considerations based on the model of Begelman & Cioffi (1989) would suggest a cocoon pressure in directions perpendicular to that of the jet propagation:
| (5) |
Therefore, if the cocoon side pressure is as strong as inferred from these elementary computations (that neglects general relativistic and magnetohydrodynamical effects associated with the jet tight collimation), we expect a strong, destructive effect on a high ionization wind, especially in the innermost BLR.
Observations of powerful RL sources reported in §3.3 indicate that the high-ionization outflow producing Civ1549 and other lines is not suppressed, even if hampered or altered. There is a different dependence on luminosity of the median and average Civ1549 shift in the Shen et al. (2011) data for both RQ and RL: for RL, Civ1549 shifts are smaller amplitude and the luminosity dependence is shallower, with shifts above km s-1 being very rare for RL sources (c.f. Richards et al., 2011).
A first inference could be that RL activity produces a wider cone of avoidance around the disk axis: i.e. suppresses emission along radial lines of flow close to the jet axis. In this case the outflow may be more equatorially confined giving rise to more symmetric profiles and to systematically lower shifts for RL, especially for CD RLs where the flow should be viewed pole on. It is not clear whether this is the case: the sample of Sulentic et al. (2007) is small, while Richards et al. (2011) include many core sources that may not be RL (=10-70). In this interpretation the radio morphology of 3C 57 may hint at a favourable orientation, coupled with a significant outflow due to the high . Another possibility (not conflicting with the previous one) is that the wind is forced to start at larger distances from the central black hole (the cocoon pressure decreases with ) reaching a lower terminal velocity (still significantly above the escape velocity from the system). Larger emitting distances may also be consistent with the models of Zamanov et al. (2002) and Komossa et al. (2008).
Large (above 1000 km s-1) Civ1549 blueshifts appear to be rare: the tentative estimates of §3.3 yield a prevalence 0.5 % – 2%. The rarity of these sources suggests another possible explanation for the 3C 57 (and PKS 1252+11) blueshift: the radio activity ignited too recently to have yet disrupted the wind. For 3C 57 ( ) the dynamical timescale of the BLR is 100 yr. The derived is large this indicates that 3C 57 is a rejuvenated quasar. If the duty cycle of rejuvenated quasars is yr (Czerny et al., 2009), then one may expect % of sources whose BLR has not been yet fully affected by the onset of radio activity.
5 Conclusions
The 4D Eigenvector formalism reveals that the majority of RL quasars show a restricted zone of parameter space occupation compared to the RQ majority. This restriction is clearest when we focus on the unambiguously RL LD sources. They show restricted ranges of radio power ( erg s-1Hz-1), bolometric luminosity ( erg s-1), FWHM H ( 4000 km s-1), ( 0.5), ( 2.5) and modest Civ1549 blueshifts. Since the defining 4DE1 parameters are assumed to measure aspects of BLR physics and source geometry/kinematics this implies either: 1) If all quasars are capable of radio-loudness then important physical and/or kinematic properties of the BLR must change before the onset of a RL event or, 2) as an alternative reflected in the Pop A- Pop B distinction, RL represent a distinct class of quasars driven perhaps by different BH spin and/or host galaxy morphology. The RQ sources sharing the same 4DE1 parameter domain with the RL might represent currently radio-inactive Pop B quasars. We see a RQ-RL dichotomy if we consider only LD sources (as the RL parent population). CD sources are likely a mix of (rare) aligned LD sources, LD precursors and frustrated cores incapable of producing classical LD structure. CD sources above erg s-1 Hz-1 distribute in 4DE1 as expected if they are aligned LD (e.g. FWHM H near lower limit of LD) in an orientation unification scenario while CD with do not. The weaker CD sources also distribute in 4DE1 space the same as the RQ majority.
There are always exceptions to the rule. The cases of 3C 57 and PKS 1211+11 show that a prominent high-ionization outflow probably driven by radiation pressure can coexist with powerful radio emission, although the simultaneous detection of both phenomena appears to be rare. This result suggests that high accretion and relativistic radio ejection may not be mutually exclusive for supermassive black holes, as found in the case of stellar mass black holes, and, at the same time, that radio emission has a quantitative effect on the high-ionization outflows.
3C 57 shows extreme optical and radio properties compared to the local RL population and is therefore unambiguously RL ( erg s-1 Hz-1 and log 3). However it shows two 4DE1 parameters that are highly discordant with the RL majority: unusually strong optical Feii emission ( 1) and a large Civ1549 blueshift -1500 km s-1. It also shows an estimated Eddington ratio ( ) much higher than the majority of RL quasars and typical of a Population A2 source. VLA maps resolve it leading to an interpretation of 3C 57, which shows a CSS radio SED, as a core-jet or aligned LD source. The radio flux stability favours a young LD quasar. The Civ1549 profile blueshift implies that there is a wind or outflow from a highly accreting disk. The general absence of Civ1549 blueshifts in RL sources suggested the onset of radio activity somehow disrupts or confines the wind. A search of the SDSS quasar catalogue suggests that 3C 57 belongs to a tiny minority of RL sources with significant Civ1549 blueshift and high Eddington ratio.
It is clear that whatever the physical properties of the BLR in normal quasars, the RL show a restricted range in those properties presumably connected to their large and low . 3C 57 is then likely hosted by an early-type galaxy if the large BH mass implies a large bulge mass via the BH mass – bulge mass correlation. The unusual properties are most easily understood if 3C 57 is undergoing an apparently rare major accretion event. This assumes that the rare unusually strong FeII emission in a RL is a signature of such events. This causes 3C 57 to show properties typical of the opposite end of the 4DE1 main sequence (higher BLR density, metallicity and accretion disk wind). The CIV wind is either too strong to be disrupted or the event is so recent that this disruption has not yet occurred.
Acknowledgements
We acknowledge Dra Simona Righini for observations in INAF-IRA radiotelescope station in Medicina (Italy). We would like to thank Drs. Jaime Perea and Isabel Márquez for all the fruitful discussions on the subject and their help with the observations. We also thank the anonymous referee for many useful comments which helped to significantly improve the presentation of our analysis. Part of this work was supported by Junta de Andalucía through Grant TIC-114 and by the Spanish Ministry for Science and Innovation through Grants AYA2010-15169, AYA2011-1544-E and AYA2013-42227-P. This research is based in part on data obtained with the 1.82m Copernico Telescope at the Asiago Observatory. Based partially on observations made with the 3.5m telescope at the Spanish-German Observatory in Calar Alto (CAHA, Almería Spain) jointly operated by the Max-Planck-Institut für Astronomie Heidelberg and the Instituto de Astrofísica de Andalucía (CSIC). We thank all the CAHA staff for their high professionalism and support with the observations. Some data presented here were obtained with ALFOSC, which is provided by the Instituto de Astrofísica de Andalucía (IAA) under a joint agreement with the University of Copenhagen and NOTSA.
References
- Begelman & Cioffi (1989) Begelman, M. C. & Cioffi, D. F. 1989, ApJ, 345, L21
- Boroson (2003) Boroson, T. A. 2003, ApJ, 585, 647
- Boroson & Green (1992) Boroson, T. A. & Green, R. F. 1992, ApJS, 80, 109
- Bruhweiler & Verner (2008) Bruhweiler, F., & Verner, E. 2008, ApJ, 675, 83
- Buttiglione et al. (2011) Buttiglione, S., Capetti, A., Celotti, A., et al. 2011, A&A, 525, A28
- Corbin & Smith (2000) Corbin, M. R. & Smith, P. S. 2000, ApJ, 532, 136
- Czerny et al. (2009) Czerny, B., Siemiginowska, A., Janiuk, A., Nikiel-Wroczyński, B., & Stawarz, Ł. 2009, ApJ, 698, 840
- de Vries et al. (2006) de Vries, W. H., Becker, R. H., & White, R. L. 2006, AJ, 131, 666
- Dimitrijević et al. (2007) Dimitrijević, M. S., Popović, L. Č., Kovačević, J., Dačić, M., & Ilić, D. 2007, MNRAS, 374, 1181
- Drake et al. (2012) Drake, A. J., Djorgovski, S. G., Mahabal, A., et al. 2012, IAU Symposium, 285, 306
- Fanti et al. (1995) Fanti, C., Fanti, R., Dallacasa, D., et al. 1995, A&A, 302, 317
- Fender & Belloni (2004) Fender, R. & Belloni, T. 2004, ARA&A, 42, 317
- Griffith et al. (1994) Griffith, M. R., Wright, A. E., Burke, B. F., & Ekers, R. D. 1994, ApJS, 90, 179
- Gu et al. (2009) Gu, M., Cao, X., & Jiang, D. R. 2009, MNRAS, 396, 984
- Hewett & Wild (2010) Hewett, P. C. & Wild, V. 2010, MNRAS, 405, 2302
- Kellermann et al. (1989) Kellermann, K. I., Sramek, R., Schmidt, M., Shaffer, D. B., & Green, R. 1989, AJ, 98, 1195
- Kimball et al. (2011) Kimball, A. E., Ivezić, Ž., Wiita, P. J., & Schneider, D. P. 2011, AJ, 141, 182
- Komossa et al. (2008) Komossa, S., Xu, D., Zhou, H., Storchi-Bergmann, T., & Binette, L. 2008, ApJ, 680, 926
- Kotilainen & Falomo (2000) Kotilainen, J. K. & Falomo, R. 2000, A&A, 364, 70
- Kriss (1994) Kriss, G. 1994, Astronomical Data Analysis Software and Systems III, A.S.P. Conference Series, 61, 437
- Krolik (1999) Krolik, J. H. 1999, Active galactic nuclei : from the central black hole to the galactic environment (Princeton University Press)
- Kuehr et al. (1981) Kuehr, H., Witzel, A., Pauliny-Toth, I. I. K., & Nauber, U. 1981, A&AS, 45, 367
- Kuraszkiewicz et al. (2004) Kuraszkiewicz, J. K., Green, P. J., Crenshaw, D. M., et al. 2004, ApJS, 150, 165
- Laurent-Muehleisen et al. (1997) Laurent-Muehleisen, S. A., Kollgaard, R. I., Ryan, P. J., et al. 1997, A&AS, 122, 235
- Marziani et al. (2006) Marziani, P., Dultzin-Hacyan, D., & Sulentic, J. W. 2006, Accretion onto Supermassive Black Holes in Quasars: Learning from Optical/UV Observations (New Developments in Black Hole Research), 123
- Marziani & Sulentic (2014) Marziani, P. & Sulentic, J. W. 2014, MNRAS, 442, 1211
- Marziani et al. (1996) Marziani, P., Sulentic, J. W., Dultzin-Hacyan, D., Calvani, M., & Moles, M. 1996, ApJS, 104, 37
- Marziani et al. (2013a) Marziani, P., Sulentic, J. W., Plauchu-Frayn, I., & del Olmo, A. 2013a, A& A 555, A89
- Marziani et al. (2013b) Marziani, P., Sulentic, J. W., Plauchu-Frayn, I., & del Olmo, A. 2013b, ApJ, 764, 150
- Marziani et al. (2009) Marziani, P., Sulentic, J. W., Stirpe, G. M., Zamfir, S., & Calvani, M. 2009, A&Ap, 495, 83
- Marziani et al. (2003a) Marziani, P., Sulentic, J. W., Zamanov, R., et al. 2003a, ApJS, 145, 199
- Marziani et al. (2001) Marziani, P., Sulentic, J. W., Zwitter, T., Dultzin-Hacyan, D., & Calvani, M. 2001, ApJ, 558, 553
- Marziani et al. (2003b) Marziani, P., Zamanov, R. K., Sulentic, J. W., & Calvani, M. 2003b, MNRAS, 345, 1133
- Morganti et al. (1993) Morganti, R., Killeen, N. E. B., & Tadhunter, C. N. 1993, MNRAS, 263, 1023
- Negrete et al. (2013) Negrete, C. A., Dultzin, D., Marziani, P., & Sulentic, J. W. 2013, ApJ, 771, 31
- Negrete et al. (2014) Negrete, C. A., Dultzin, D., Marziani, P., & Sulentic, J. W. 2014, ApJ, 794, 95
- Neilsen & Lee (2009) Neilsen, J. & Lee, J. C. 2009, Nature, 458, 481
- Netzer (2013) Netzer, H. 2013, The Physics and Evolution of Active Galactic Nuclei (Cambridge University Press)
- O’Dea (1998) O’Dea C. P., 1998, PASP, 110, 493
- Oke (1990) Oke, J. B. 1990, AJ, 99, 1621
- Ott et al. (1994) Ott, M., Witzel, A., Quirrenbach, A., et al. 1994, A&A, 284, 331
- Ponti et al. (2012) Ponti, G., Fender, R. P., Begelman, M. C., et al. 2012, MNRAS, 422, L11
- Reid et al. (1999) Reid, R. I., Kronberg, P. P., & Perley, R. A. 1999, ApJS, 124, 285
- Richards et al. (2011) Richards, G. T., Kruczek, N. E., Gallagher, S. C., et al. 2011, AJ, 141, 167
- Richards et al. (2006) Richards, G. T., Lacy, M., Storrie-Lombardi, L. J., et al. 2006, ApJS, 166, 470
- Roeser, Demleitner, & Schilbach (2010) Roeser S., Demleitner M., Schilbach E., 2010, AJ, 139, 2440
- Sani et al. (2010) Sani, E., Lutz, D., Risaliti, G., et al. 2010, MNRAS, 403, 1246
- Shen et al. (2011) Shen, Y., Richards, G. T., Strauss, M. A., et al. 2011, ApJS, 194, 45
- Sulentic et al. (2007) Sulentic, J. W., Bachev, R., Marziani, P., Negrete, C. A., & Dultzin, D. 2007, ApJ, 666, 757
- Sulentic et al. (2014) Sulentic, J. W., Marziani, P., del Olmo, A., et al. 2014, A& A 570, A96
- Sulentic et al. (2000a) Sulentic, J. W., Marziani, P., & Dultzin-Hacyan, D. 2000a, ARA&A, 38, 521
- Sulentic et al. (2002) Sulentic, J. W., Marziani, P., Zamanov, R., et al. 2002, ApJ, 566, L71
- Sulentic et al. (2000b) Sulentic, J. W., Marziani, P., Zwitter, T., Dultzin-Hacyan, D., & Calvani, M. 2000b, ApJ, 545, L15
- Sulentic et al. (2003) Sulentic, J. W., Zamfir, S., Marziani, P., et al. 2003, ApJ, 597, L17
- van Breugel et al. (1984) van Breugel, W., Miley, G., & Heckman, T. 1984, AJ, 89, 5
- Vestergaard & Peterson (2006) Vestergaard, M. & Peterson, B. M. 2006, ApJ, 641, 689
- Wills et al. (1992) Wills, B. J., Wills, D., Breger, M., Antonucci, R. R. J., & Barvainis, R. 1992, ApJ, 398, 454
- Wright et al. (1990) Wright, A. E., Wark, R. M., Troup, E., et al. 1990, Proceedings of the Astronomical Society of Australia, 8, 261
- Wu (2009a) Wu, Q. 2009a, ApJ, 701, L95
- Wu (2009b) Wu, Q. 2009b, MNRAS, 398, 1905
- Zamanov et al. (2002) Zamanov, R., Marziani, P., Sulentic, J. W., et al. 2002, ApJ, 576, L9
- Zamfir et al. (2008) Zamfir, S., Sulentic, J. W., & Marziani, P. 2008, MNRAS, 387, 856
- Zamfir et al. (2010) Zamfir, S., Sulentic, J. W., Marziani, P., & Dultzin, D. 2010, MNRAS, 403, 1759
- Zensus et al. (2002) Zensus, J. A., Ros, E., Kellermann, K. I., et al. 2002, AJ, 124, 662