Transfer of spectral weight across the gap of Sr2IrO4 induced by La doping
Abstract
We study with Angle Resolved PhotoElectron Spectroscopy (ARPES) the evolution of the electronic structure of Sr2IrO4, when holes or electrons are introduced, through Rh or La substitutions. At low dopings, the added carriers occupy the first available states, at bottom or top of the gap, revealing an asymmetric gap of 0.7eV, in good agreement with STM measurements. At further doping, we observe a reduction of the gap and a transfer of spectral weight across the gap, although the quasiparticle weight remains very small. We discuss the origin of the in-gap spectral weight as a local distribution of gap values.
pacs:
71.30.-h, 71.27.-a, 79.60.-iThe reaction of an insulator to doping can reveal many things on its underlying structure. For a band insulator, a simple shift of the chemical potential into bands that were previously completely filled or empty can be expected. If more complex electronic correlations are involved, the formation of in-gap states and/or large transfer of spectral weight across the gap could occur GeorgesRMP96 ; MeindersPRB93 . This problem received a lot of attention in the case of cuprates DamascelliRMP03 ; KMShenPRL04 . It is very interesting to investigate this in Sr2IrO4, whose insulating nature is not completely understood. The idea driving the field for a few years is that strong spin-orbit coupling reshapes the electronic structure in a way that enhances correlations BJKimPRL08 . Especially, a narrow half-filled band of J=1/2 character forms at the Fermi level, which could be split by correlations to form a Mott insulator. The exact role of the antiferromagnetic (AF) ordering observed below 240 K YeCaoPRB13 in the insulating nature is still debated MartinsPRL11 ; AritaPRL12 . On the other hand, applying pressure, even up to 55 GPa, was not able to close the gap ZoccoJCondMat14 , which is surprising for a Mott insulator. In this context, it would be interesting to know more about the electronic structure of doped phases, which exhibit metallic-like behaviors even for rather low doping rates GeCaoPRB11 ; QiCaoPRB12 ; LeeTokuraPRB12 ; ClancyPRB14 .

Recently, a few Angle Resolved Photoemission (ARPES) studies of doped iridate phases were reported, but they lead to quite a confusing picture. For Rh substitutions, which results in effective hole doping ClancyPRB14 , a metallic-like state was observed, albeit with residual pseudogaps instead of well defined quasiparticles (QP) peaks CaoDessauCondMat14 . Another kind of metallic state was observed by evaporating K on the surface of Sr2IrO4, which presumably dopes electrons into it KimScience14 . In this case, well defined QP were observed, with strong momentum and temperature dependences that resemble those found in the cuprates and even possible signs of superconductivityKimCondMat15 ; YanCondMat15 . Very recently, results similar to intermediate K coverage were reproduced in La doped Sr2IrO4 deLaTorre124 . In these cases, a large Fermi Surface (FS) containing 1 electrons was apparently observed ( is the number of added carriers), although the spectral weight along it could be strongly modulated. In contrast, La doping in Sr3Ir2O7 apparently produces a small FS containing only the added x electronsTorrePRL14 with a progressive reduction of the gap HeNatMat15 . Clearly, the phenomenology of the metal-insulator transition in this system is still an intriguing and open problem.
To better understand this, we present here a study of both hole and electron doped Sr2IrO4, using respectively Rh and La substitutions. Upon doping, we observe a nearly rigid shift of the band structure, towards the Fermi level for Rh and to higher binding energies for La. This reveals an electronic gap of 0.7eV, larger than what is usually assumed, because it is significantly larger on the unoccupied side. The spectral weight at the Fermi level follows a distribution in k-space that is surprisingly different for Rh (circular-like) and La (squarish-like). By examining the nature of the in-gap weight, we attribute this to a local distribution of gap values. This is in good agreement with observation by STM that the gap can be strongly reduced near defects DaiPRB14 ; OkadaNatMat13 . At the largest La doping that we could synthesize, we observe a small QP peak emerging at the M point.
The samples were prepared using a self-flux method, as reported in KimScience09 . Fig. 1 shows examples of the resistivity and magnetization measured for the main samples that will be used in this study. Their exact doping was estimated by Energy Dispersion X-ray analysis to be 1.5 for La1, 4 for La2 and 15 for Rh1. Upon La and Rh dopings, the resistivity drops, as observed by other groups GeCaoPRB11 ; QiCaoPRB12 ; LeeTokuraPRB12 , with a slight upturn at low temperatures. The magnetic transition is suppressed by doping and it is not detectable anymore in the La2 and Rh1 samples. ARPES experiments were carried out at the CASSIOPEE beamline of SOLEIL synchrotron and the APE beamline of ELETTRA synchrotron, with a SCIENTA R-4000 analyser and an overall resolution better than 15meV.
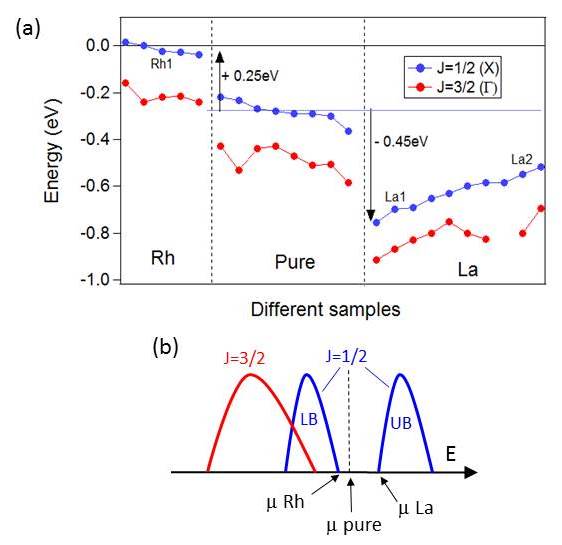
Fig. 2 summarizes the changes in energy for the top of the J=1/2 and J=3/2 bands in a series of compounds with different concentration of Rh (from 10 to 15), La (from 1 to 4) and several pure compounds. We will give details in Fig. 3 on how these positions are determined. They are sorted with respect to the J=1/2 value, which loosely corresponds to the doping level (we suspect that impurities and/or defects also play a role to fix the chemical potential position). Fig. 2 evidences that, as soon as Rh and La are used, the bands suddenly shift in opposite directions to the bottom or top of the gap, as sketched in Fig. 2b. These shifts are not symmetric, being 0.2eV for Rh and -0.45eV for La. This is in very good agreement with the gap measured by STM DaiPRB14 , which is also asymmetric, of 0.15eV on the hole side and 0.47eV on the electron side. This confirms that the gap is larger than what is generally believed. For larger La doping, the bands shift back to the Fermi level, which we attribute to a reduction of the gap by up to 0.15eV. A similar behavior was observed recently in Sr3Ir2O7 at low La dopings HeNatMat15 . For Rh, the gap lies on the unoccupied side, so that we cannot easily comment with ARPES on its size.
In Fig. 3, we detail this evolution. In the first column, we show the dispersion along the direction corresponding to the Ir-O-Ir bond, named X in the unit cell containing 2 Ir CrawfordPRB94 . In Sr2IrO4, the t2g manifold is filled with 5 electrons and split into a quartet of Jeff=3/2 character and a doublet of Jeff=1/2 character BJKimPRL08 . In Density Functional Theory (DFT) calculations, both bands should cross the Fermi level. In reality, the J=3/2 band is pushed below EF and the J=1/2 band is gapped, as confirmed by previous ARPES studies in Sr2IrO4 BJKimPRL08 ; WangDessauPRB13 and Ba2IrO4 MoserNJP13 ; UchidaPRB14 . Along X, a band of J=3/2 character is observed at and a band of J=1/2 character at X BJKimPRL08 ; WangDessauPRB13 ; MoserNJP13 ; UchidaPRB14 . Their dispersions are highlighted by red and blue lines for clarity (these guides are modeled on the DFT dispersions and then shifted to match the data). The lineshapes at and X are detailed by the Energy Distribution Curves (EDC) in the second and third columns. These peak positions are the ones reported in Fig. 2.
In pure Sr2IrO4, the band approaching the closest from the Fermi level is the J=1/2 band at X, so that integration of the spectral weight at -20meV in a 50meV window gives patches of high intensity near X [Fig. 2(a4)]. Note that just the tail of the peak reaches EF, so that this map is not a Fermi Surface.
For a sample doped with 15 Rh (Rh1, second row), the bands are shifted almost rigidly towards the Fermi level, by approximately 0.2eV. While the J=3/2 band is still well below EF and completely filled, the J=1/2 band now crosses the Fermi level. There is however no detectable quasiparticle at kF, as can be seen from the EDC in Fig. 3(b3). In fact, the crossing is not even as sharp as expected for a Fermi Dirac function. From the point at half maximum on the leading edge (see arrows), one could define a residual pseudogap of 30meV. A similar behavior was reported in CaoDessauCondMat14 . We sketch this situation in Fig. 3(b5), although we do not know if there is still a gap with UB. The spectral weight distribution map follows circles, sketched by blue dotted lines. If we neglect the pseudogap, this is the shape expected in DFT calculations for the Fermi Surface of the J=1/2 band of Sr2IrO4 near half doping. The circle radius kF=0.630.04Å-1 defines an area corresponding to 0.950.1 electrons/Ir. This is compatible, within error bars, with a transfer of one hole per Rh to Ir.
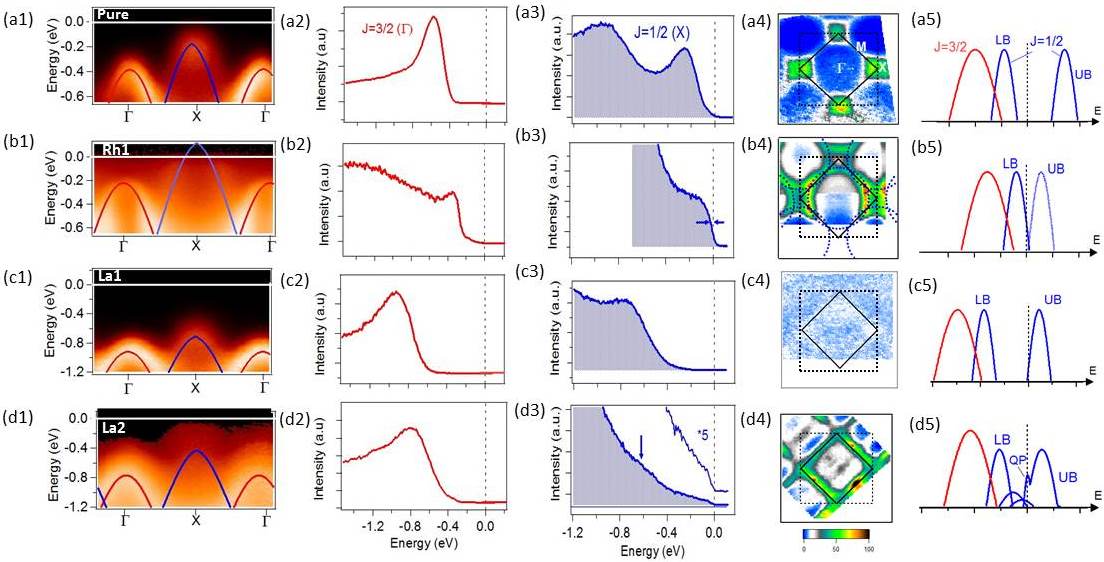
In Fig. 3c and 3d, we study 2 La dopings. At small doping (La1, in Fig. 3c), the bands are strongly shifted down by about 0.45eV, in the opposite direction compared to Rh. As can be seen from the EDCs, the weight at the Fermi level is nearly zero and no clear features can be observed after integration. In this situation, there are enough added electrons to shift the Fermi level at the bottom of UB, but they do not modify the electronic structure of the insulator [Fig. 3(c5)]. With further La doping, the gap reduces, as discussed in Fig. 2, which shifts the bands upward by 150meV in La 2 (4th row). While this shift is almost rigid for the J=3/2 band, whose EDC shape is similar to that of La1, it is not for J=1/2. The J=1/2 peak is almost undetectable in the EDC of Fig. 3(d3) (see arrow) and the lost weight appears to be transferred into the gap, as evidenced by the large tail of non zero intensity that extends up to the Fermi level. Although the weight at EF is very small, the EDC exhibits a small step there. The distribution of weight at the Fermi level in Fig. 3(d4) is surprisingly well defined and forms a nearly perfect square along the 2 Ir BZ boundary. This is very different from the Rh case, although one could have expected similar shape from electron-hole symmetry.
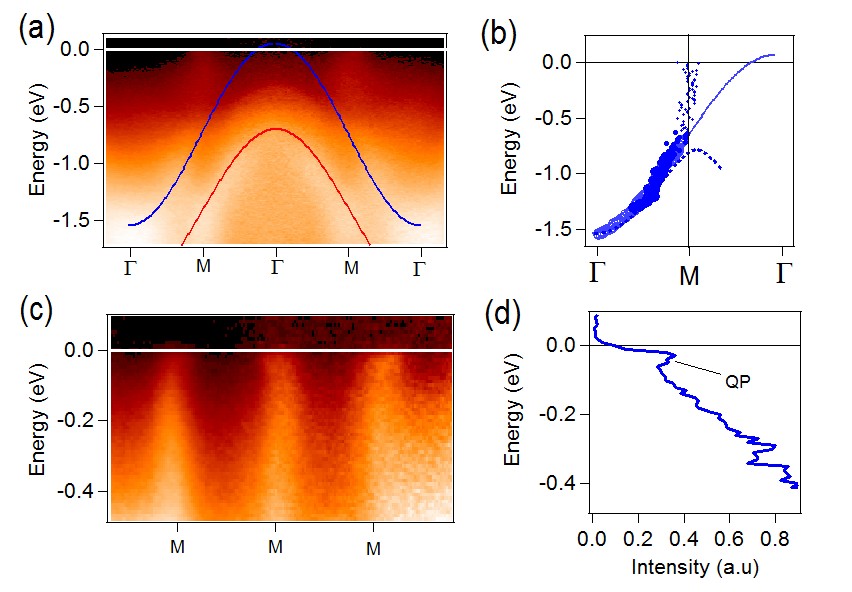
The map nervertheless display higher intensity points at M (yellow color), which correspond to the appearance of a QP peak at M, as illustrated in Fig. 4. Along M [Fig. 4(a)], we observe a J=3/2 hole band centered at (red line) and a deep electron band formed by the J=1/2 band (blue line, given by the DFT dispersion shifted down by 0.48 eV). The bottom of the band near -1.5eV is quite clear, but this band suddenly loses weight when reaching M. In Fig. 4b, its dispersion is extracted by fitting the Momentum Distribution Curves (MDCs) to Lorentzians. The peak positions are shown by blue markers and their amplitudes by the markers’ size. The J=1/2 dispersion follows the blue line, up to binding energy of -0.6 eV, where the correlation gap opens, as sketched by the dotted line. In the gapped region, we nevertheless observe reduced but non negligible intensity, as emphasized in Fig. 4c along MM direction. If fitted by MDC analysis, this in-gap weight gives rise to a nearly vertical line at M, from -0.6eV up to EF. Such a “vertical dispersion” often occurs when the MDC analysis picks up the tail of a broad peak VallaScience99 . It is particularly clear here due to the anomalously large weight in the tail of the J=1/2 EDC. Near the Fermi level, a small peak can be seen at M [Fig. 4(d)], which contrasts with the step observed at X in Fig. 3(d3). As shown in ref.deLaTorre124 , this peak forms a small pocket around M with further La doping.
On the other hand, most of the weight picked up by the map in Fig. 3d4 is dominated by the in-gap states. The fact that it forms a square very clearly indicates that the gap is tied to the 2 Ir BZ boundaries. Any interaction resulting in a 2 Ir unit cell could produce such a gap. In Sr2IrO4, the unit cell always contains 2 inequivalent Ir, because of the rotation of the oxygen octahedra CrawfordPRB94 . However, such a rotation cannot lift the degeneracy between the two bands at X. Moreover, in Ba2IrO4, where there is no such rotation, a similar gap is observed MoserNJP13 ; UchidaPRB14 . Interestingly, a distortion consisting of alternated elongation and squeezing along c of the oxygen octahedra has recently been proposed for Sr2IrO4 TorchinskyPRL15 . It could in principle produce such a behavior, although it is likely too small to produce such a large gap. The most likely candidate is of course the AF order that also produces a similar 2 Ir unit cell YeCaoPRB13 . Even though the gap does not close at TN in Sr2IrO4 MoonPRB09 , and though TN is strongly suppressed here by La doping, it is possible that AF fluctuations persisting above the transition are strong enough to maintain a pseudogap. In Ba2IrO4, a reduction of the gap above TN was suggested following similar reasonings UchidaPRB14 .
The most natural way to explain the large tail of the peak would then be a local distribution of gap values. In Fig. 3(d5), we sketch the 2 types of spectral weight transfer from the main LB occurring with La doping, (i) to the tail of the peak formed with LB having lower gap values and (ii) to the QP band. In fact, a rather similar picture emerges from STM studies. In ref. DaiPRB14 , the authors observed in Sr2IrO4 a gap as large as 0.62eV away from defects, but as small as 0.25eV near a defect, for example an oxygen vacancy. A similar behavior was observed in Sr3Ir2O7 OkadaNatMat13 . This creates on average a tail into the gap, quite similar to the one we describe here. Indeed, even in pure Sr2IrO4, we do see a small weight inside the gap behaving very similarly to that found in the La doped compounds. It is very likely that this is why the chemical potential is pinned at 0.2eV above the gap, which is the position expected for the J=1/2 band in the DFT calculation. Korneta et al. showed that at sufficient oxygen vacancies concentration (around 4), a metallic state forms KornetaPRB10 , suggesting that these “defect states” can be the precursor of a true metallic state.
In the case of surface doped Sr2IrO4 (which yields electron doping, like La), a good metallic state, with well defined QP and circular FS, seems to be realized KimScience14 . Interestingly, the position of the J=3/2 band in this study is back to its original position near -0.5eV (see Fig. S1 of ref.KimScience14 ). From the trend presented in Fig. 2, this case would then find its place as an extrapolation to larger La dopings, when the gap completely closes. The circular FS is analogous to the case of Rh we report here, restoring the idea of electron-hole symmetry. A difference is that there is no well defined QP in the case of Rh. They might develop at larger Rh dopings, but they could also be washed out by the disorder associated with the in-plane Ir/Rh substitutions.
Finally, our picture for La doping is the following. At low doping levels, the La impurities generate a small amount of free negative charges that shift the Fermi Level to the bottom of the unoccupied band. By further increasing the La concentration, the gap is slightly reduced, at most by 150 meV for the dopings considered here. Locally, the La sites may further weaken the gap, creating a distribution of gap values responsible for large in-gap weight. Eventually, some percolation effect probably leads to the formation of conducting channels. The nature of correlation in this new state is one of the most interesting questions raised by the study of these iridates. The dispersive feature observed in all cases (pure, Rh and La doped) is well described by the unrenormalized DFT dispersion after appropriate shifts and should be viewed as a sizable incoherent feature. In the Rh case, it is difficult to separate this incoherent weight from the possibly emerging QP band at its top. In the La case, it becomes easier as the QP band forms on the other side of the gap. The transfer of spectral weight we observe as a function of doping is characteristic of a correlated system. The large size of the gap revealed by our study confirms STM results and is an important point that should be reproduced by any theory of this system. We also show that the gap can be highly sensitive to the local environment, which influences the way the doping proceeds. A better understanding of this effect should shed light on the nature of the gap and possible differences between chemical and surface doping, beyond the doping values both methods can presently reach.
References
- (1) A. Georges, G. Kotliar, W. Krauth, and M. J. Rozenberg, Rev. Mod. Phys. 68, 13 (1996)
- (2) M. B. J. Meinders, H. Eskes, and G. A. Sawatzky, Phys. Rev. B 48, 3916 (1993)
- (3) A. Damascelli, Z. Hussain, and Z.-X. Shen, Rev. Mod. Phys. 75, 473 (2003)
- (4) K. M. Shen, F. Ronning, D. H. Lu, W. S. Lee, N. J. C. Ingle, W. Meevasana, F. Baumberger, A. Damascelli, N. P. Armitage, L. L. Miller, Y. Kohsaka, M. Azuma, M. Takano, H. Takagi, and Z.-X. Shen, Phys. Rev. Lett. 93, 267002 (2004)
- (5) B. J. Kim, H. Jin, S. J. Moon, J.-Y. Kim, B.-G. Park, C. S. Leem, J. Yu, T. W. Noh, C. Kim, S.-J. Oh, J.-H. Park, V. Durairaj, G. Cao, and E. Rotenberg, Phys. Rev. Lett. 101, 076402 (2008)
- (6) F. Ye, S. Chi, B. C. Chakoumakos, J. A. Fernandez-Baca, T. Qi, and G. Cao, Phys. Rev. B 87, 140406 (2013)
- (7) C. Martins, M. Aichhorn, L. Vaugier, and S. Biermann, Phys. Rev. Lett. 107, 266404 (2011)
- (8) R. Arita, J. Kuneš, A. V. Kozhevnikov, A. G. Eguiluz, and M. Imada, Phys. Rev. Lett. 108, 086403 (2012)
- (9) D. A. Zocco, J. J. Hamlin, B. D. White, B. J. Kim, J. R. Jeffries, S. T. Weir, Y. K. Vohra, J. W. Allen, and M. B. Maple, Journal of Physics: Condensed Matter 26, 255603 (2014)
- (10) M. Ge, T. Qi, O. Korneta, D. De Long, P. Schlottmann, W. Crummett, and G. Cao, Phys. Rev. B 84, 100402 (2011)
- (11) T. Qi, O. Korneta, L. Li, K. Butrouna, V. Cao, X. Wan, P. Schlottmann, R. Kaul, and G. Cao, Phys. Rev. B 86, 125105 (2012)
- (12) J. Lee, Y. Krockenberger, K. Takahashi, M. Kawasaki, and Y. Tokura, Phys. Rev. B 85, 035101 (2012)
- (13) J. P. Clancy, A. Lupascu, H. Gretarsson, Z. Islam, Y. F. Hu, D. Casa, C. S. Nelson, S. C. LaMarra, G. Cao, and Y.-J. Kim, Phys. Rev. B 89, 054409 (2014)
- (14) Y. Cao et al., cond-mat/1406.4978
- (15) Y. Kim et al., Science 345, 187 (2014)
- (16) Y. Kim et al., cond-mat/1506.06639
- (17) Y. Yan et al., cond-mat/1506.06557
- (18) A. de la Torre et al., cond-mat/1506.00616
- (19) A. de la Torre, E. Hunter, A. Subedi, S. McKeown Walker, A. Tamai, T. Kim, M. Hoesch, R. Perry, A. Georges, and F. Baumberger, Phys. Rev. Lett. 113, 256402 (2014)
- (20) J. He et al., Nature materials 14, 577 (2015)
- (21) J. Dai, E. Calleja, G. Cao, and K. McElroy, Phys. Rev. B 90, 041102 (2014)
- (22) Y. Okada et al., Nature materials 12, 707 (2013)
- (23) B. J. Kim et al., Science 323, 1329 (2009)
- (24) M. K. Crawford, M. A. Subramanian, R. L. Harlow, J. A. Fernandez-Baca, Z. R. Wang, and D. C. Johnston, Phys. Rev. B 49, 9198 (1994)
- (25) Q. Wang, Y. Cao, J. A. Waugh, S. R. Park, T. F. Qi, O. B. Korneta, G. Cao, and D. S. Dessau, Phys. Rev. B 87, 245109 (2013)
- (26) S. Moser et al., New Journal of Physics 16, 013008 (2014)
- (27) M. Uchida, Y. F. Nie, P. D. C. King, C. H. Kim, C. J. Fennie, D. G. Schlom, and K. M. Shen, Phys. Rev. B 90, 075142 (2014)
- (28) T. Valla et al., Science 285, 2110 (1999)
- (29) D. H. Torchinsky, H. Chu, L. Zhao, N. B. Perkins, Y. Sizyuk, T. Qi, G. Cao, and D. Hsieh, Phys. Rev. Lett. 114, 096404 (2015)
- (30) S. Moon, H. Jin, W. Choi, J. Lee, S. Seo, J. Yu, G. Cao, T. Noh, and Y. Lee, Phys. Rev. B 80, 195110 (2009)
- (31) O. B. Korneta, T. Qi, S. Chikara, S. Parkin, L. E. De Long, P. Schlottmann, and G. Cao, Phys. Rev. B 82, 115117 (2010)