Stellar populations of bulges at low redshift
Abstract
This chapter summarizes our current understanding of the stellar population properties of bulges and outlines important future research directions.
1 Introduction
The stellar populations of bulges provide a fossil record of their formation and evolutionary history, including insights into the duration and efficiency of the primary epochs of star formation. In previous chapters, we have learnt that there are three main types of bulges: the classical, the disky, and the boxy/peanut. All of them show different structural and kinematical properties and different formation scenarios are proposed to explain them. In these scenarios, the star formation history is predicted to be different, e.g., the proposed mechanisms to form classical bulges imply rapid and efficient star formation while disky bulges are believed to form slowly and at lower redshifts from the inflow of mainly gaseous material to the center of the galaxy (see Wyse et al., 1997; Kormendy & Kennicutt, 2004, for reviews).
Boxy/peanut bulges are believed to be parts of bars seen edge-on and have their origin in vertical instabilities of the disk. Therefore they are expected to have a similar stellar population compared to the inner disk. In principle then we should be able to distinguish between different formation scenarios simply by studying the different ages, metallicities and abundances ratios of the bulges. The situation, however, it is not that straightforward; as discussed in other chapters (see e.g. Chapter 2.3) internal processes related with disk instabilities can also occur at high redshift and in short timescales. Furthermore, bulges with properties resembling pseudobulges can form, not only by internal processes related with the presence of non-axisymmetric components, but also by accretion of gas and galaxies (Guedes et al., 2013; Querejeta et al., 2015; Eliche-Moral et al., 2011; Obreja et al., 2013). However, getting information on the ages, metallicities and abundances ratios in the different types of bulges constitute, undoubtedly, a strong constrain for scenarios of bulge formation and, therefore, several authors have studied the problem. With the exception of the MW and M31, in which we can resolve individual stars, studies of bulges have to deal with integrated properties, through their mean color or absorption lines. Such unresolved stellar populations studies have been far less common for bulges than for elliptical galaxies. The reason is that disk galaxies have more dust and ionized gas. The first affects the colors and the second fills the Balmer lines, the most important age diagnostics in the optical. In addition, bulges have, in general, lower surface brightness than ellipticals and the presence of several morphological components, such as disks, bars, rings, etc., complicates the interpretation of the results. Lastly, the light coming from the disk may contaminate the bulge spectrum in a way that is difficult to quantify. This problem is especially acute for studies of stellar population gradients.
Furthermore, over many years, unresolved stellar populations studies have been done comparing the integrated colors or absorption lines with the theoretical predictions for single stellar populations (SSP); that is, an essentially coeval population of stars formed with a given initial mass function with the same chemical abundance pattern. While this scenario may not be a bad approximation for massive elliptical galaxies, bulges, especially those formed secularly, are believed to have a more extended star formation history. This means that the young populations, which have low mass-to-light ratios, bias the analyses of composite populations, if present (e.g. Trager et al., 2000).
The relatively low number of studies, the small – and biased – samples, and the difficulties pointed out above have led to a lack of consensus about important results concerning the stellar populations of bulges, as I will show in this review. However, in the last decade, stellar population models which predict not only individual spectral features, but the entire synthetic spectra for a population of a given age and metallicity (Vazdekis, 1999; Bruzual & Charlot, 2003; Vazdekis et al., 2010; Coelho et al., 2007; Walcher et al., 2009; Conroy et al., 2014) have been released. The availability of these models is stimulating the development of numerical algorithms to invert the observed galaxy spectrum onto a basis of independent components (combination of single stellar populations, age-metallicity relation, and dust extinction). Also, new specialized software allow the separation of the light coming from the stars and ionized gas in a reliable way (e.g. Sarzi et al., 2006). In addition to this, new data from integral field spectrographs (e.g. Bacon et al., 2001; Cappellari & et al., 2011; Blanc et al., 2013) are changing the way we see galaxies (Sánchez & et al., 2012; Rosales-Ortega et al., 2010). The analysis of these datasets allows one to associate stellar population properties with morphological and kinematical characteristics of the galaxies, making the interpretation of stellar populations more secure. Therefore, the development of the field is very promising and we foresee important advances in the decades to come.
In this chapter, I will try to review the state of the art in the area, trying to highlight the necessary steps to get a better understanding of the star formation histories of these complex systems. Section 2 summarizes the general results obtained with single apertures. Section 3 compile the works on the possible influence of bars in the stellar populations of bulges and on the stellar populations of bars themselves. Section 4 outline the results obtained with full spectral fitting techniques and Sect. 5 reports on the studies of stellar population gradients in bulges. In Sect. 6, I show the results about the possible connection between the stellar populations of bulges and disks while in Sect. 7 the main results are summarized. In Sect. 8, I give some thoughts of what I think the next steps for the study of stellar populations in bulges should be.
2 Results obtained with single aperture
2.1 General properties
The first studies of stellar populations in bulges were performed using optical and near-infrared broadband photometry (Balcells & Peletier, 1994; Terndrup et al., 1994; Peletier & Balcells, 1996; Bell & de Jong, 2000; de Jong, 1996). These works demonstrated that changes in the bulge colors are linked to galaxy luminosity, potential well, and local surface brightness, with more massive/luminous bulges and higher surface brightness regions being redder than less massive/luminous and lower surface brightness ones. They also showed that early-type bulges are red, as red as elliptical galaxies, and with very little dispersion in their colors (Peletier & Balcells, 1996). These results do not apply to the few late-type galaxies analyzed, where significantly bluer colors are measured.
Early interpretation of these data pointed to early-type bulges being as old as ellipticals with late-type, less massive ones being younger and/or more metal poor. The small dispersion in the colors was interpreted as being due to small dispersion in the age of early-type bulges (maximum of 2 Gyr). This, in principle, is in agreement with the classical and disky bulge formation scenarios (see Sect. 1) if, as it seems the case, secularly formed disky bulges are more common in late-type and in less massive galaxies (Kormendy & Kennicutt, 2004; Ganda et al., 2009)111Note, however, that a significant number of local massive spiral galaxies appears to have dominant pseudobulges, defined as those bulges with , that includes both disky and boxy/peanut bulges (Kormendy et al., 2010). Furthermore, pseudobulges are also found in S0 galaxies (Laurikainen et al. 2012)..
One problem of using colors is the well known age-metallicity degeneracy (Worthey, 1994). Bluer bulges can be either younger or more metal poor and, without this information, it is difficult to extract conclusions about their formation mechanisms. Further complications are the presence of emission lines and dust extinction that also affect the colors. In particular, dust extinction depends on the inclination and, therefore, inclination is another parameter that needs to be taken into account when comparing the colors of different types of bulges and also when comparing the results from different studies (see Ganda et al., 2009). All these obstacles make very difficult to extract useful conclusions about the stellar populations of bulges using only colors. For these reasons studies with colors need to be complemented with those using information of the absorption lines with different sensitivities to age and metallicity and that are not affected by dust extinction (MacArthur, 2005).
The first spectroscopic studies of bulges analyzed the relation of line-strength indices (the so-called Lick/IDS indices, see Gorgas et al., 1993; Worthey et al., 1994) with the central velocity dispersion ( hereafter) – used as a proxy for the dynamical mass of the galaxy. Lick/IDS indices measure the strength of the most prominent absorption lines in the optical galaxy spectra and are sensitive to changes of the mean age, chemical abundances and, to a lesser extent, the initial mass function (e.g. Vazdekis et al., 2010; Bruzual & Charlot, 2003; Thomas et al., 2003; Schiavon, 2007; Conroy & van Dokkum, 2012). These studies confirmed the similarity of bulges with elliptical galaxies for early-type galaxies (earlier than Sbc, Bender et al., 1993; Fisher et al., 1996; Idiart et al., 1996).
However, it has been pointed out that this similarity may be due to the fact that the majority of these early analyses were performed on samples that are biased towards early-type spirals (earlier than Sbc, Kormendy & Kennicutt, 2004). In the last few years, however, several studies have included in their samples late-type bulges and analyzed, mostly, the relation between the Mg-sensitive indices (Mg2 and Mgb) and the central . When these bulges were included, differences between elliptical and bulges were found. However, the nature of these differences is still not clear. Some authors claim that bulges are located below the Mg- relation obtained for ellipticals, which is commonly interpreted as bulges having a younger stellar population (Prugniel et al., 2001; Chiappini et al., 2002; Ganda et al., 2007; Morelli et al., 2008). Other authors find that the slope of the Mg- is steeper for bulges (Falcón-Barroso et al., 2002), while Trager et al. (1999) and Proctor & Sansom (2002) report that only low-mass bulges depart from the relation between spectral indices and drawn by large bulges. On the other hand, other studies do not find any systematic difference in the Mg- relation of bulges and elliptical galaxies but find that the scatter among this relation for bulges is larger than the equivalent one for ellipticals (Moorthy & Holtzman, 2006; Peletier et al., 2007). Similar conclusions were obtained using other line-strength indices.
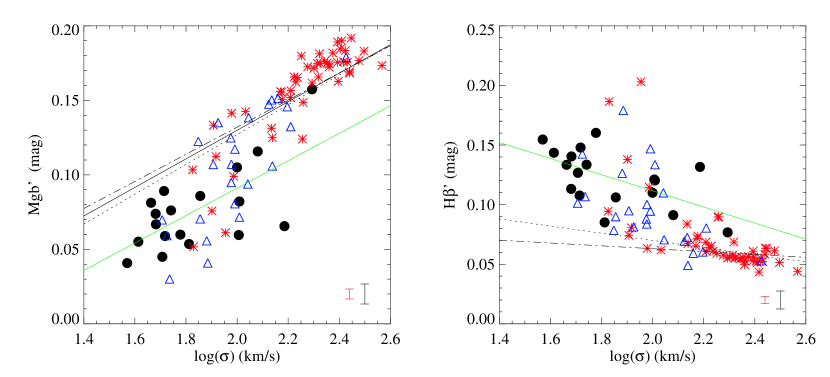
Some of the discrepancies in the conclusions of different studies may be due to differences in the mass distribution (or central ) of the selected sample. For example, Fig. 1 shows the relation between the Mgb and H indices (measured in magnitudes) for a sample of late-type and early-type bulges and elliptical galaxies from Ganda et al. (2007). It can be seen that despite the relations between line-strength and indices followed by late-type bulges and early-type galaxies running apparently parallel to each other, the differences may just be related with the different range of central . In fact, the differences disappear at low-, where even early-type galaxies (E and S0222Classically, studies of stellar populations include E and S0 galaxies in the same group.) deviate from the relation defined by massive ellipticals.
Furthermore, bulges, contrary to massive elliptical galaxies, are rotationally supported. Some authors have cautioned (Prugniel & Simien, 1994; Falcón-Barroso et al., 2002) that by not taking into account the rotation in the measurements, one may be underestimating their binding energy. The contribution to the rotation may by calculated as , as in Prugniel & Simien (1994), where is the rotational velocity. Falcón-Barroso et al. (2002) claim that a mean suffices to bring the bulges back to the Mg2- relation defined by giant ellipticals333Note, however, that the majority of low-luminosity elliptical galaxies are also rotationally supported (Emsellem & et al., 2011).. Other studies have also claimed a better correlation between the line-strength indices and (an indicator of the total potential well) than between line-strength indices and the central (Prugniel et al., 2001).
2.2 Comparison with SSP models
Nevertheless, the similarity found by some authors between the index- relation of bulges and elliptical galaxies may not reflect a real similarity in their stellar content. Line-strength indices are not free from the age-metallicity degeneracy (e.g., Mg2 and Mgb can be lower in younger or in more metal stellar populations). Therefore, large differences between the ages of bulges and ellipticals could exist and not be reflected in these relations if there is a complementary age-metallicity relation (e.g. Trager et al., 2000). The advantage of using these characteristics, though, is that the sensitivity to variations of age and metallicity of each different index varies. A way to partially break the age-metallicity degeneracy is to combine indices more sensitive to mean age variations (i.e., the Balmer lines) with those more sensitive to abundance variations in the so-called index-index diagrams. Figure 2 shows one of these diagrams combining the composite index
which is fairly insensitive to variations of Fe abundances444The elements are those chemical elements predominantly formed via fusion with a helium nucleus. Their most abundant isotopes therefore have nucleon numbers that are multiples of four (e.g., O, Ne, Mg, Si, S, Ar, Ca, Ti). These elements are mainly synthesized in Type II supernovae, while Type Ia supernovae produce elements of the iron peak (V, Cr, Mn, Fe, Co and Ni). In chemical evolution models, type II supernovae produce an early enrichment of -elements followed by a subsequent enrichment of iron-peak, Type Ia supernovae products. In the absence of other modifying factors, this implies that /Fe can be used as a ’galactic clock’ for the duration of the star formation. (Thomas et al., 2003) and the Balmer index H.
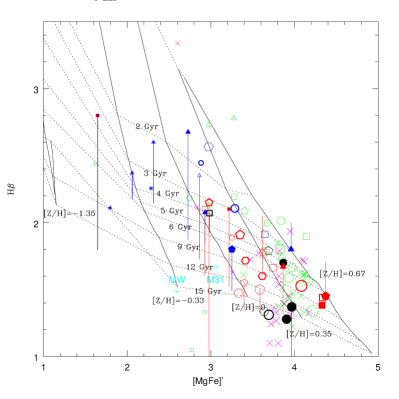
Several authors have used this technique to compare the index values with the predictions of SSP models. These comparisons show that bulges have a large range in SSP-equivalent ages from 2 to 13.5 Gyr (Peletier et al., 2007; Moorthy & Holtzman, 2006) and metallicities. They also report a correlation between both the SSP-equivalent age and metallicity and central . In general, they found that more luminous/massive bulges were older and more metal rich. They also inferred that more massive bulges have a larger ratio of -elements555What it is usually measured is the Mg abundance through the Mgb index. Other -elements, like Ca or Ti may follow different patterns (e.g. Conroy et al., 2014; Graves & Schiavon, 2008; Cenarro et al., 2004). with respect to Fe, which is usually interpreted as more massive bulges forming their stars on shorter timescales. The relations were similar to those found for elliptical galaxies (Bica, 1988; Jablonka et al., 1996; Idiart et al., 1996; Casuso et al., 1996; Goudfrooij et al., 1999; Trager et al., 1999; Thomas & Davies, 2006; Moorthy & Holtzman, 2006; Jablonka et al., 2007; Ganda et al., 2007). On the other hand, Proctor & Sansom (2002) and Prugniel et al. (2001) found that, contrary to what happens in elliptical galaxies, both Fe and Mg were correlated with in bulges, resulting in the lack of a tight correlation between Mg/Fe (a proxy for ) and . This result needs to be corroborated by other studies.
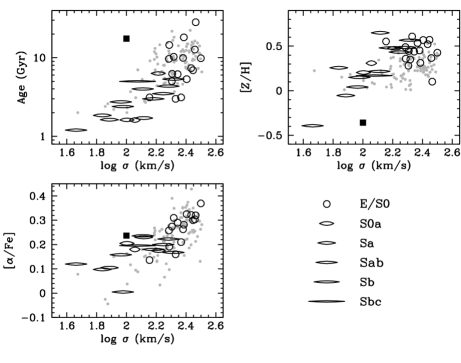
Similar to the results obtained with line-strength indices, the comparison of SSP-equivalent parameters of bulges and ellipticals reveal that both have very similar properties, at least in samples of bulges earlier than Sbc. Figure 3 illustrates the relation between the SSP-equivalent ages, metallicities, and , and the central for bulges, S0, and elliptical galaxies (Thomas & Davies, 2006). It can be seen that, at a given central , the stellar population parameters of bulges and elliptical galaxies are indistinguishable. These results support the idea that bulges (with morphological types earlier than Sbc) were formed with very little influence from the disk, in a process similar to the one that formed elliptical galaxies.
In samples that contained late-type galaxies (later than Sbc), both Prugniel et al. (2001) and Moorthy & Holtzman (2006, see also ) find three types of bulges in the comparison of line-strength indices and stellar population models: the old-metal rich (OMR), the young metal rich (YMR) – which are bulges with ages less than 3 Gyr and super-solar metallicities – and the metal poor (MP), with sub-solar metallicity. These classes seem to be sensitive to the Hubble type. All the early-type (S0-Sab) bulges are metal-rich. The red early-type bulges are in the OMR region while the blue early-types reside in the YMR region. Metal-poor bulges are all late-types, but late-type bulges are found in all three regions. A comparison of the SSP properties of late-type bulges and ellipticals galaxies at a similar , however, remains to be done and, therefore, as it was the case with the line-strength indices, it is not clear if late-type bulges are younger, for being late-type, or for having low .
2.3 Relation between stellar population and structural properties
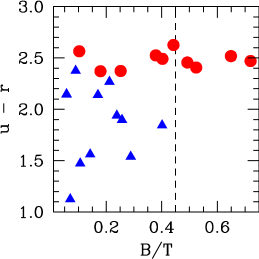
A more direct way to test the different proposed scenarios for bulge formation is to compare the stellar population properties of a sample of bulges with morphological or dynamical properties that distinguish them as classical, disky, and boxy/peanut. As we have seen in previous chapters (see Chapter 2.2), there are several observables used to separate bulges and pseudobulges and different authors have employed different properties to perform this task. Carollo et al. (2001) analyzed V, H, and J HST images of a sample of bulges with exponential (typical of disky and boxy/peanut bulges) and R1/4 luminosity profiles (typical of classical bulges), finding the former, on average, bluer than the latter (by 0.4 mag in ), which could be the consequence of a younger and/or of a lower metallicity stellar population. They also found, in agreement with the results of Peletier & Balcells (1996), that the colors of those bulges showing a R1/4 profile were red and very homogeneous, while for the exponential bulges the scatter was significantly larger666Note, however, that many of the exponential bulges were showing colors as red as the R1/4 bulges.. They interpreted these results as a delayed formation of the exponential bulges compared with those having an R1/4 profile, which formed their stars in the early Universe. Drory & Fisher (2007) used a different approach and separated classical and pseudobulges morphologically. Pseudobulges were those showing nuclear bars, nuclear spirals, and/or nuclear rings and classical bulges those featureless structures rounder than the outer disk. Separating the bulges in this way and comparing with their visual morphological types, they studied the location of bulges in the color-magnitude diagram, finding that Sc galaxies and later types do not contain classical bulges and are located almost entirely in the blue cloud in the color-magnitude diagram. Intermediate Sa-Sbc type galaxies, on the contrary, contain both classical and pseudobulges. While 87% of the galaxies with pseudobulges were in the blue cloud, all galaxies with classical bulges were in the red-sequence. These authors stress that the differences in colors are not due to a different contribution of bulge and disk to the total galaxy color as blue and red galaxies share a range in bulge-to-total ratio. This is shown in Fig. 4, where the global color of the galaxies is plotted as a function of the bulge-to-total (B/T) ratio. It can be seen that both bulges and pseudobulges coexist in the region of B/T values ranging from 0.05 to 0.45 and that, in this region, classical bulges are redder than pseudobulges. They also found that, in general, pseudobulges classified with the morphological features described above were more diffuse and had lower Sérsic indices than classical bulges.
Another way of separating classical bulges from pseudobulges was adopted by Gadotti (2009) who identified pseudobulges as those lying below the Kormendy relation (Kormendy, 1977) defined by elliptical galaxies. He established that pseudobulges defined this way were, in general, 0.2 mag bluer in the () color than the classical bulges. On the other hand, Fernández Lorenzo et al. (2014), who used the Sérsic index to differentiate between classical and pseudobulges, found the latter as red as the former at the same luminosity. Only in fainter pseudobulges they did measure bluer colors.
Again, colors are affected by the age-metallicity degeneracy and dust extinction and, in principle, more information may be obtained from the study of absorption lines and their comparison with stellar population models. Several works have also compared the line-strength indices of bulges with different structural characteristics (Williams et al., 2012; Gadotti, 2009). The first studied a sample of edge-on boxy/peanut bulges finding that they follow the same central index- relation as elliptical galaxies (see also Jablonka et al., 2007), although the sample was biased towards early-type galaxies (S0-Sb). On the other hand, Gadotti (2009) found a strong correlation between the D4000 index and the Sérsic index (), indicating younger populations777Actually the author did not compare the index with stellar population models and, therefore, a variation in metallicity is also possible. in galaxies with lower . On the contrary, for a sample of early-type galaxies, Vazdekis et al. (2004) did not find a correlation between and age, while they found a strong correlation between and Mg/Fe. The different behavior for bulges and ellipticals is very interesting, but more studies of this kind using larger samples are still needed to confirm or refute the trends. Note that the only study targeting specifically boxy/peanut bulges is that of Williams et al. (2012). The rest of studies cited above usually include both disky and boxy/peanut bulges in the same category, the ‘pseudobulge’ sample.
The current lack of consensus between studies may be due to different criteria to separate classical and pseudobulges. Some might include disky and boxy/peanut bulges in the same category, pseudobulge, without making any distinction between them. Furthermore, different distributions of the galaxy luminosities can also lead to discordant results. It is clear that low-luminosity, low-mass bulges are bluer than more massive and brighter ones, but it is not clear if, at the same luminosity, bulges with different structural characteristics share the same color.
2.4 Bulges as composite systems
Thanks to the 2-dimensional data of the SAURON survey (Bacon et al., 2001), Peletier et al. (2007) (see also Sil’chenko & Afanasiev, 2004) noticed that, when present, young stellar populations in their sample of early-type bulges were concentrated near the center, in disks or in annuli suggestive of resonance rings (Byrd et al., 1994). Peletier et al. (2007) realized that the studies comparing the line-strength indices of bulges and elliptical galaxies could be divided into two categories: those targeting inclined galaxies, which do not find any difference between the index- relation of bulges and ellipticals, and those sampling almost face-on galaxies, which find younger stellar populations in bulges compared with those of elliptical galaxies and a large scatter in the line-strength indices at a given . The differences are especially visible in galaxies with low . They argue that bulges are composite systems, with two or more types of bulges coexisting in the same galaxies. The classical bulge is composed mainly of an old and metal rich population and the disky and boxy/peanut bulge can be younger and contain more metal-poor stars (although it can also be old). The discrepant results obtained in samples of different inclinations can be explained, according to these authors, by the different contribution to the bulge light of different subcomponents (classical, disky, and boxy/peanut). If the young component is a disk, then it is concentrated in a plane and it would not be observed in edge-on galaxies. These young components, however, do contribute to the integrated light of less inclined samples (if they are limited to the central regions). The result is supported by the observation of central dips in the velocity dispersion maps in 50% of the galaxies of their sample.
The coexistence of 2 or more types of bulges (classical, disky, and boxy/peanut) in some galaxies has been pointed out by several authors (Athanassoula, 2005; Gadotti, 2009; Nowak et al., 2010; Kormendy & Barentine, 2010; Erwin, 2008) and is supported by theoretical studies (Obreja et al., 2013; Samland & Gerhard, 2003). Obreja et al. (2013) propose a picture were the centers of most early-type spirals contain multiple kinematic components: an old and slowly rotating elliptical-like component, and one or more disk-like, rotationally supported components which are typically young but can also be old.
This ‘two component model’ also explains the properties of our MW bulge. The MW is considered to have a boxy bulge, yet increased evidence of an old, -enriched stellar population that formed on a short time-scale has resulted in a two component model (e.g. Tsujimoto & Bekki, 2012). It has been shown that two stellar populations coexist in the Bulge separated in age and metallicity (McWilliam & Rich, 1994; Feltzing & Gilmore, 2000; van Loon et al., 2003; Groenewegen & Blommaert, 2005; Zoccali et al., 2006; Fulbright et al., 2007; Zoccali et al., 2008) and that the separation extends somewhat to kinematics (Zhao et al., 1994; Soto et al., 2007), even if age determinations through color-magnitude diagram shows that most bulge stars in the Galaxy are older than 10 Gyr (Ortolani et al., 1995; Feltzing & Gilmore, 2000; Zoccali et al., 2006; Clarkson et al., 2008).
The task of isolating the stellar population properties of the different subcomponents forming a bulge is difficult. Still, it has been tried by some authors. For example, Williams et al. (2011) study the stellar populations of two edge-on boxy/peanut shaped bulges. They place the slit along the major axis and observe with three offset in parallel positions. They found that NGC 1381 has a boxy bulge, with stellar rotation neither cylindrical (as would be expected for bars seen edge-on) nor strongly non-cylindrical and with a double hump on the rotation curve. The galaxy shows a metallicity gradient but no age gradient and a positive Fe. They explain the properties of these galaxies in an scenario where NGC 1381 has the three classes of bulges. The classical bulge formed their stars rapidly and explain the general trend in Fe as a function of height, as disk light (with its lower Fe) contributes less and less to the integrated spectrum. The boxy appearance is explained by the simultaneous presence of a bar (which appears boxy in projection), and the double hump of the rotation curve hints at the presence of a small disky pseudobulge (see also Sil’chenko et al., 2010).
3 The influence of bars in building up the bulge
It seems clear that some bulges have central disks (Peletier et al., 2007), often (but not always) with young stars, which is usually linked to disk gas inflow and central star formation caused by internal secular processes related with the presence of a bar (Friedli & Benz, 1995; Norman et al., 1996; Noguchi, 2000; Immeli et al., 2004). However, this central rotationally younger component does not necessarily form due to internal processes. Major and minor mergers and external accretion of gas may result in the formation of a disky bulge (e.g. Guedes et al., 2013; Querejeta et al., 2015). This idea may be supported by some observational studies. For example, Kannappan et al. (2004) found, in a sample of disky bulges selected to be blue and, therefore, with central young stars, that all of them showed signs of recent interactions.
Hydrodynamical cosmological simulations predict that both secular and external processes contribute to create disky pseudobulges with similar characteristics in both cases, rotationally supported and with a young and metal poor stellar population (Obreja et al., 2013; Guedes et al., 2013). Eliche-Moral et al. (2011) also analyze the effects of minor mergers on the inner part of disk galaxies, finding this process to be efficient in forming rotationally supported stellar inner components, i.e., disks, rings or spiral patterns (see also Domínguez-Tenreiro et al., 1998; Aguerri et al., 2001; Scannapieco et al., 2010).
A way to quantify the importance of secularly formed disky bulges is to compare properties of galaxies with and without bars. While it has been found that Hα emission is enhanced in early-type spirals with bars with respect to those early-type non-barred (e.g. Ho et al., 1997; Huang et al., 1996; Alonso-Herrero & Knapen, 2001; Jogee et al., 2005; Ellison et al., 2011), the evidence supporting the bulge building by bars from the ages of its stars has proven to be elusive. Several authors have tried the comparison using samples of face-on galaxies, where it is easy to morphologically identify the bar. The differences, however, have not been firmly established. Moorthy & Holtzman (2006) and Pérez & Sánchez-Blázquez (2011) found hints of lower ages and higher metallicities in barred galaxies compared to their counterparts in unbarred at a given 888Although the differences found by Moorthy & Holtzman (2006) in the H- relation between barred and non-barred galaxies disappear when is used instead of .. They also found higher Fe abundances in barred galaxies with central velocity dispersion 2.2 (km/s) 2.35, but the opposite for (km/s) . At fixed and , barred galaxies appear to have larger central values of MgFe999This index is defined as MgFe in Thomas et al. (2003). (which can be used as an indicator of metallicity independent of Fe, see above) than non-barred galaxies (or galaxies with elliptical shape bulges) of the same or . The differences, however, were not very significant in a statistical sense.
On the other hand, Jablonka et al. (2007) found no difference between the stellar population properties of edge-on barred and non-barred galaxies. However, it may be difficult to detect a bar in an edge-on galaxy. de Lorenzo-Cáceres et al. (2012) and de Lorenzo-Cáceres et al. (2013) analyzed the stellar populations in the center of double-barred early-type S0s and spirals finding some signs of gaseous flows and young stellar populations. This population was not very prominent though. Nevertheless, all the above studies were affected by poor number statistics.
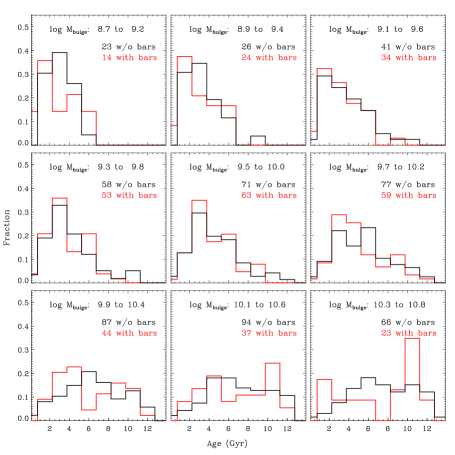
Coelho & Gadotti (2011) observed 575 face-on bulges in disk galaxies, of which 251 contain bars. They found that, for bulges with masses between 1010.1M⊙ and 1010.85M⊙, the distribution of ages in barred galaxies is bimodal with peaks at 4.7 and 10.4 Gyr. This bimodality is not seen in non-barred galaxies of a similar bulge mass range. The age distribution of barred and non-barred galaxies is, per contra, similar for bulges of masses lower than M⊙ (i.e., the differences are only seen in massive bulges). These authors did not find any difference in the metallicity distribution of barred and non-barred galaxies. These results are summarized in Fig. 5 where the distribution of ages for several mass intervals is shown for samples of barred and non-barred galaxies.
Therefore, it is still not clear if there are differences between the stellar populations of galaxies with and without bars. What seems clear though is that, if there are differences, they are only visible in massive, early-type galaxies, a result that is supported by other studies analyzing the molecular gas concentration (Sakamoto et al., 1999). This is often attributed to the fact that early-type galaxies host larger and stronger bars than late-type galaxies (e.g. Buta & Combes, 1996), although, as pointed out in Laurikainen et al. (2007) and Laurikainen et al. (2004), a longer bar does not implies a stronger bar and, in fact, in early-type galaxies the bar induced tangential forces are weaker because they are diluted by the more massive bulges101010Although the majority of authors does not distinguish different types of S0, Laurikainen et al. (2007) also show that early-type S0s have shorter bars than later type S0s, i.e., the trend of longer bars for early-type morphologies reverse in this morphological subclass..
This does not mean, necessarily, that bars are not efficient agents in building up bulges. It is still not clear if bars are long-lasting structures or not. If bars are not long-lasting structures but recurrent patterns (Bournaud & Combes, 2002) then the fact that we do not find differences between barred and non-barred galaxies would not necessarily imply that bars are not important for secular evolution but, simply, that non-barred galaxies could have been barred in the recent past. However, most numerical simulations show that, once formed, bars are robust structures (Shen & Sellwood, 2004; Athanassoula et al., 2005; Debattista et al., 2006; Berentzen et al., 2007; Villa-Vargas et al., 2010; Kraljic et al., 2012; Athanassoula et al., 2013). Furthermore, at least in massive disk galaxies, bars have the same stellar population properties of bulges (old, metal rich, and Fe-enhanced stellar populations; Sánchez-Blázquez et al. 2011; Pérez et al. 2009) which, in many cases, are very different from that of the disk (see Sect. 3). This result also supports (although it does not prove, see Sect. 3111111The stars in the bar can form in the disk long time ago, even if the bar have been recently formed.) the idea that bars formed long ago. The longevity of bars is also suggested in studies of the bar fraction evolution (e.g. Sheth & et al., 2008), which find a similar bar fraction at z0.8 to that seen at the present-day for galaxies with stellar masses M⊙. In addition, non-axisymmetric structures, such as nuclear spirals, can drive gaseous inflows (e.g. Kormendy & Fisher, 2005), which could dilute the differences between barred and non-barred galaxies.
3.1 Stellar population of bars
As the debate of the durability of bars is still open and its influence may be crucial for the formation of bulges, it is also important to study the stellar populations hosted by bars. Very few works, however, have dealt with this problem.
Gadotti & de Souza (2006) obtained the color and color gradients in the bar region of a sample of 18 barred galaxies. They interpreted the color differences as differences in stellar ages and conclude that younger bars were hosted by galaxies of later types (see also Gadotti, 2008). However, as we mentioned in Sect. 2, the effects of age-metallicity degeneracy and dust extinction are strongly degenerate in colors and, therefore, conclusions based on only colors remain uncertain. Pérez et al. (2007) and Pérez et al. (2009) performed an analysis of the stellar population of bars in early-type galaxies using line-strength indices. They found that the mean bar values of SSP-equivalent age, metallicity, and Fe, correlate with central in a similar way to that of bulges, pointing to an intimate evolution of both components. Galaxies with high central (170 kms-1) host bars with old stars while galaxies with lower central velocity dispersion show stars with a large dispersion in their ages.
These authors also analyzed the stellar population gradients along the bars and found three different behaviors: (1) bars with negative metallicity gradients. These bars have young/intermediate stellar populations (SSP-equivalent values 2 Gyr) and have amongst the lowest stellar velocity dispersions of the sample; (2) bars with no metallicity gradients. These galaxies have, however, positive age gradients and (3) bars with a mean old stellar population and positive metallicity gradients (more metal-rich at the bar ends).
The fact that bars are composed of old stellar populations does not mean that they formed long ago, as the bar might have formed recently out of old stars in the disk. One way to disentangle these two options is to compare the stellar populations of the disk and the bar at the same distances. In Sánchez-Blázquez et al. (2011), this comparison is made for two galaxies, finding that stars in the bar are older and more metal rich than those of the disk. Furthermore, the gradient in both parameters is much flatter in the bar. In general, they found that the stellar content of the bar is more similar to that of the bulge than to the disk. However, the sample of this study remains small and biased towards early-type bulges. Clearly, a larger study sampling larger samples of galaxies covering all morphological types is still needed.
4 Star formation histories
The majority of stellar population studies in bulges are based on the comparison of the observed colors or spectral properties with the predictions of SSP models. While the SSP assumption may not be a bad approximation for massive elliptical galaxies, it is most likely not a good one for spirals, which are believed to have a more extended star formation history (Kennicutt, 1993; James et al., 2008).
In cases were the star formation history has been more complicated than just a single burst, the interpretation of the results based on analyses of single-stellar population is difficult. Bulges with an intermediate SSP-equivalent age could have formed all their stars at intermediate epochs or almost all at very early times and a small fraction at recent epochs.
To avoid these difficulties, some authors have tried to analyse their data assuming more realistic star formation histories. There are several examples in the literature where the stellar population properties have been derived using a parametric approach (Ganda et al., 2007; MacArthur et al., 2004; Kauffmann & et al., 2003) where a predefined shape for the star formation history and chemical enrichment is assumed. In this case, some parameters are fixed while others are fitted by comparing the observations with the predictions of the models. Ganda et al. (2007) compared three line-strength indices with the predictions based on two burst, and on exponentially declining star formation histories. They obtained, respectively, the age, metallicity and mass fraction of the youngest burst, and the e-folding () time in the case of the exponentially declining star formation history. In the first case, they concluded that degeneracies in the parameter space prevented them from extracting useful conclusions. In the second case, they found that bulges with a larger central showed shorter e-folding times, more consistent with an instantaneous burst scenario. Low- galaxies have larger , indicating a more extended star formation history (see Fig. 6).

The problem with this approach is that the results depend strongly on the priors – i.e., the wrong answer can be obtained with the wrong assumptions about the star formation history. Furthermore, the use of only a few line-strength indices makes it difficult to break the existing degeneracies in the parameter space, such as the age of the burst versus its strength, or the -metallicity degeneracy.
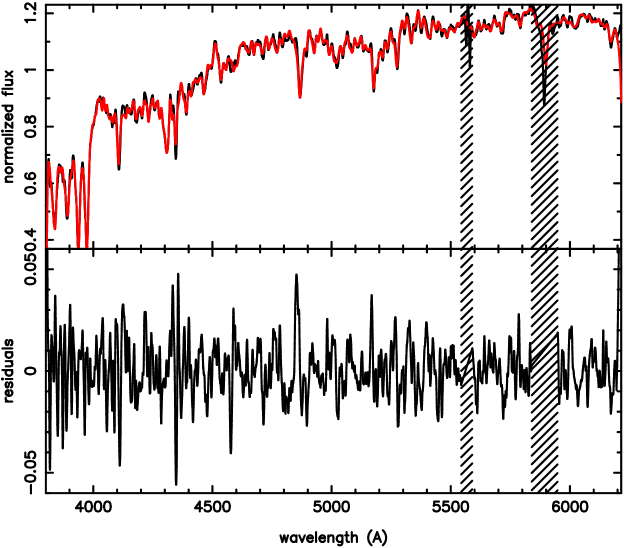
The availability of high-quality stellar libraries and associated stellar population models (e.g. Sánchez-Blázquez et al., 2006b; Vazdekis et al., 2010; Bruzual & Charlot, 2003; Conroy & van Dokkum, 2012) that predict, not only individual absorption line features but the whole spectral energy distribution, has allowed the development of new techniques that, fitting the whole spectrum, are able to obtain, not only SSP-equivalent ages and metallicities, but a more, in principle realistic, star formation history. Furthermore, by considering the information provided by the entire spectrum, the age and the metallicity are more easily separated (Sánchez-Blázquez et al., 2011). These techniques are non-parametric – i.e., no predefined shape for the star formation history is assumed. Codes that have been used to study the stellar population properties of galaxies include MOPED (Heavens et al., 2000); VESPA (Tojeiro et al., 2007); STECKMAP (Ocvirk et al., 2006b); STARLIGHT (Cid Fernandes et al., 2005); SEDFIT (Walcher et al., 2006) and ULySS (Koleva et al., 2009). Using these new tools, one can fit an observed spectrum in terms of a model built by a linear combination of a number of SSPs with different ages and metallicities. The kinematics can be calculated at the same time by convolving the model with a Gaussian line-of-sight velocity distribution. In some cases, dust can be modeled assuming a reddening law. Figure 7 shows an example of a fit to the integrated spectrum of NGC 628 using the code STECKMAP (Ocvirk et al., 2006b, a), together with the derived flux and mass fractions for stars of different ages and the age-metallicity relation (Sánchez-Blázquez et al., 2014).


The problem of inverting a spectrum to derive detailed star formation and chemical enrichment histories is ill-conditioned – i.e., small fluctuations in the data can produce strong variations in the final solution – and different codes try to overcome these issue with different methods. The accuracy of the recovered star formation history depends critically on the signal-to-noise of the input spectra and, depending on this value, one can recover more or less different stellar populations described by an age and a metallicity. However, with spectra of enough quality, the methods have shown that they can recover reliably both the age distribution and the age-metallicity relation (see, e.g. Cid Fernandes et al., 2005; Ocvirk et al., 2006b; Sánchez-Blázquez et al., 2011).
Robust quantities, even when derived from a spectrum with low signal-to-noise, are the mean values of age and metallicity (Cid Fernandes et al., 2005) that are usually weighted with the light (LW) or the mass (MW) of the stars. These are obtained as:
| (1) | |||
| (2) |
where represents the physical parameter (age or metallicity) and massi and fluxi are, respectively, the reconstructed mass and flux contributions of the stars in the -th age bin, as returned by the code. When present, young stars are very luminous in the optical and, therefore, contribute more to the light-weighted values. This means that the light-weighted values of age will be biased towards the youngest stellar components. The mass-weighted values will be less biased but they are also more uncertain, as the contribution to mass by low-mass faint stars can be very important.
It is interesting to make a comparison between the SSP-equivalent parameters and the averaged ones obtained from the full star formation history. This comparison was made by Trager & Somerville (2009). In their work, the authors derived stellar population parameters from synthetic spectra generated by a hierarchical galaxy formation model. Figure 8 shows the comparison of the SSP-equivalent ages and metallicities with the mean values weighted with both light (in the V-band) and mass. As can be seen, the SSP-equivalent ages are always lower than both the luminosity- and mass-weighted averages. In particular, SSP-equivalent ages reflect more closely the age of the last episode of star formation while luminosity-weighted means, although still biased towards the ages of the youngest components, are closer to the unweighted mean. On the other hand, SSP-equivalent metallicities and abundance ratios are less severely biased.
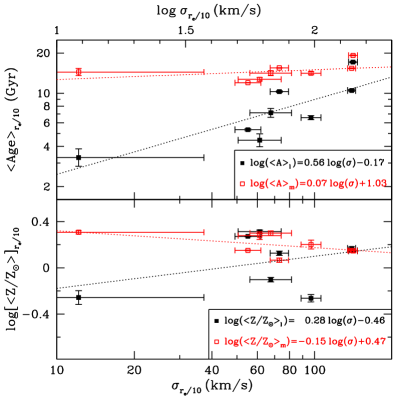
Some studies have used the non-parametric techniques to analyze the star formation histories of galaxy bulges (MacArthur et al., 2009; Sánchez-Blázquez et al., 2011; González Delgado & et al., 2014). The first conclusion from these studies is that the SSP is a very bad approximation for the star formation history of these objects. Furthermore, MacArthur et al. (2009) and Sánchez-Blázquez et al. (2011) found that in a mass-weighted context, all bulges in their sample were predominantly composed of old stars, independently of their central velocity dispersion. In fact, the previously reported trends of age with central velocity dispersion disappear when mass-weighted values of age are used instead of light weighted ones. This can be seen in Fig. 9, from MacArthur et al. (2009).
The result that bulges are dominated, in mass, by old stars applies to all types of bulges (early- and late-type, showing different Sérsic index, and with and without bars). However, this type of analysis has been performed on a very low number of galaxies. It would be desirable to extend this work to a complete sample of bulges covering a range of masses and morphological types. Ideally, one would like to quantify the mass contribution of the young component and correlate this with other properties of the bulges, such as the mass, the environment, the presence of bars, and the spiral arm morphology. This would allow one to study the importance of secular versus external mechanisms in building up the central bulges.
Recent works deriving the star formation history for large samples of spiral galaxies are those performed on data from the CALIFA survey (Pérez & et al., 2013; González Delgado & et al., 2014; Sánchez-Blázquez & et al., 2014). None of these studies has yet especially investigated the population in the bulge, but Pérez & et al. (2013) analyze the mass assembling history of the central parts of galaxies compared with the rest of the galaxy for galaxies of all morphological types binned in mass. They found that galaxies with stellar mass M⊙ have grown quickly their inner part, 5-9 Gyr ago, while lower mass galaxies formed their stars more slowly.
One caveat to all these studies performing full spectral fitting is that they use stellar population models with chemical abundance ratios scaled to solar (e.g. Bruzual & Charlot, 2003; Vazdekis et al., 2010). This implies that the models are tuned to the specific chemistry and star formation history of our MW. This is because the empirical spectral libraries are limited to those stars in the solar neighborhood.
While predictions of the strengths of Lick/IDS indices with variable abundance ratios have been made for SSPs of different ages and metallicities (Trager et al., 2000; Thomas et al., 2003; Proctor et al., 2004; Tantalo & Chiosi, 2004; Lee & Worthey, 2005; Annibali et al., 2007; Schiavon, 2007) using a semi-empirical approach, the calculation of the entire spectral energy distribution is more challenging. However, in the last few years, full spectrum fitting models have been extended to include variation in the elemental abundance patterns, using either theoretical stellar libraries or semi-empirical approaches (Coelho et al., 2007; Walcher et al., 2009; Conroy & van Dokkum, 2012). The first studies using full spectral fitting to derive chemical abundance ratios of different elements are starting to appear in the literature, all using samples of early-type galaxies (Conroy et al., 2014; Walcher et al., 2009). This is, however, a challenging task, due to the large number of parameters to fit and the possible degeneracies between them.
5 Spatially resolved stellar populations in bulges
Most stellar population studies in bulges have been done using the integrated properties inside a certain aperture. In case of spectroscopic studies, this aperture commonly encloses just the very central parts. However, if we want to have a full understanding of bulge formation, it is necessary to gain knowledge of the variations of the stellar populations with radius. These variations are intimately connected with the dynamical processes that led to the formation of these structures, the degree of dissipation, and the possible re-arrangement of material.
Mergers with gas dissipation or monolithic collapse scenarios predict steep metallicity gradients (Eggen et al., 1962; Larson, 1974; Arimoto & Yoshii, 1987) and strong gradients in Fe (Ferreras & Silk, 2002). The predictions for secularly formed bulges are more complicated. As they formed from redistribution of disk stars, the final metallicity gradient will depend on the original gradient in the disk and the scale-length of the final bulge and also on the disk heating (Moorthy & Holtzman, 2006). However, lower metallicity gradients are expected compared to those of the first scenario. Observationally, the Galactic bulge, which manifests many characteristics of a peanut-shaped bulge, has a clear vertical metallicity gradient, such that the more metal-rich part of the metallicity distribution thins out towards high latitudes (Minniti et al., 1995; Zoccali et al., 2008; Gonzalez et al., 2011). This result has long been taken as a signature for a classical bulge in the MW. However, recent results have shown that the stars that have been scattered furthest from the disk are the oldest stars and, consequently formed from the least metal-enriched fuel (Freeman, 2008; Martinez-Valpuesta & Gerhard, 2013). The buckling process may hence establish a negative minor-axis metallicity gradient (which is observed in the MW and NGC 4565 (Proctor et al., 2000).
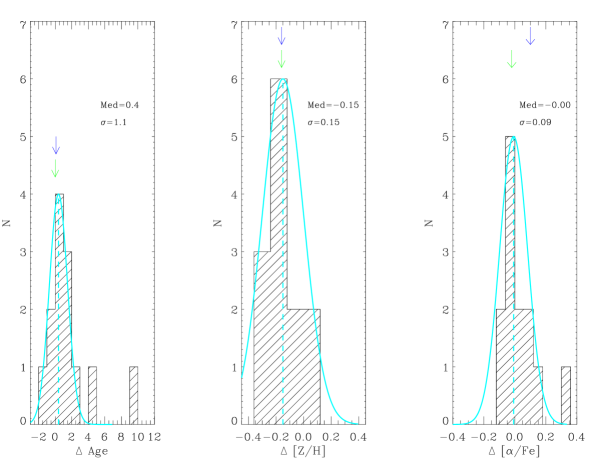
Several articles have studied the variation of the spectral features with radius in bulges (Moorthy & Holtzman, 2006; Jablonka et al., 2007; Morelli et al., 2008; Pérez & Sánchez-Blázquez, 2011; MacArthur et al., 2009; Sánchez-Blázquez et al., 2011; Ganda et al., 2007) and compared them with stellar population models to obtain either SSP-equivalent parameters or mean values, based on the recovery of the star formation history. These studies find that most bulges have SSP-equivalent or luminosity-weighted negative gradients in the metallicity, almost no gradients in age, and slightly positive or null Fe gradients. Metallicity gradients in the bulge regions are generally steeper than those in the disk region (Moorthy & Holtzman, 2006; Sánchez-Blázquez et al., 2011). Figure 10 shows the distribution of the SSP-equivalent gradients for a sample of bulges taken from the work of Morelli et al. (2008).
These values are similar to the ones found in elliptical galaxies, although the quantitative comparison is not that clear. Jablonka et al. (2007) and Morelli et al. (2008) do not find any difference in the magnitude of the bulge gradients and those of elliptical galaxies, while Williams et al. (2012), on the other hand, found that the gradients in boxy bulges are shallower than those in elliptical galaxies at a given .
Several studies have also looked for correlations between the gradients and other properties of the galaxies, such as the central , the luminosity or the mass, to check if they are related with the potential well of the galaxy, as the central values are. Goudfrooij et al. (1999) and Proctor et al. (2000) found that gradients were correlated with luminosity and central , respectively, although from very small samples, while Jablonka et al. (2007) found no such correlation. However, there seems to be a trend for which small bulges have lower gradients (see also Moorthy & Holtzman, 2006; González Delgado & et al., 2014). This, in principle, could be attributed to the fact that secularly formed bulges are more common in low mass galaxies.
The possible differences between the gradients of bulges with and without bars have also been explored in a few works, and none of them find any significant one (Moorthy & Holtzman, 2006; Jablonka et al., 2007; Pérez & Sánchez-Blázquez, 2011). However, Moorthy & Holtzman (2006) reported that when a positive age gradient was present, it was always in barred galaxies, which could indicate that these objects have more extended star formation in their centers due to bar-driven inflow of gas. This result agrees with that of Gadotti & dos Anjos (2001), who found a greater prevalence of null or positive color gradients in barred galaxies than in non-barred galaxies, which they interpret as an evidence for gradients being erased by bar-driven mixing. Nonetheless, this has not been confirmed in other studies (Jablonka et al., 2007). The reason for the discrepancies could be, once again, the orientation of the samples. The majority of authors agree that positive age gradients are normally the consequence of the the presence of central disks or nuclear rings with recent star formation (e.g. Morelli et al., 2008). As central disks and rings are likely more common in barred galaxies, this can explain the differences between barred and non-barred galaxies found by Moorthy & Holtzman (2006) and also the lack of differences reported in the edge-on sample of Jablonka et al. (2007), as these flattened central structures will not contribute to the observed light of the bulge in these orientations.
This interpretation of the age gradients as the consequence of the presence of central younger structure is supported by the fact that the mass-weighted age gradients are, in the majority of cases, much flatter than the luminosity-weighted or the SSP-equivalent ones, indicating the the majority of the stars in the bulge are old and share a common age, while a small fraction of stars concentrated in central structures are causing the observed radial trends (MacArthur et al., 2009; Sánchez-Blázquez et al., 2011; Sánchez-Blázquez & et al., 2014; González Delgado & et al., 2014).
Interestingly, Jablonka et al. (2007) find that the line-strength indices at 1 121212The radius that contains half of the total luminosity of the bulge. were very similar for all the galaxies, independent of their mass or morphological type, and the different gradients come from the differences in their central indices.
An issue in measuring the gradients of age, metallicity and Fe in bulges could be the contamination of their stellar population by the light coming from the underlying disk stellar component. This effect is not important in the galaxy center but it can have an enormous impact in the stellar population estimates of the external parts where the contribution from the disk to the total light is more important. Different authors have tried to quantify one way or the other this contamination from the disk to the bulge light (see Jablonka et al., 1996; Moorthy & Holtzman, 2006; Morelli et al., 2008) and it does not seem to be very important, but the number of tests is small and disk contamination is still an issue in the measurement of gradients. Studies of edge-on galaxies (Jablonka et al., 2007) do not have this problem although they have the drawback of being blind to flatter components in the center of the galaxy.
6 The bulge-disk connection
The age distribution of disks is of obvious importance for constraining scenarios of disk-bulge formation. Correlations between the disk and bulge colors have been found by several authors (Peletier & Balcells, 1996; de Jong, 1996; Bell & de Jong, 2000; Carollo et al., 2001; Gadotti & dos Anjos, 2001) which stands for both early and late type spirals. The similarity in color between inner disk and bulge has been interpreted as implying similar ages and metallicities for these two components and an implicit evolutionary connection (de Jong, 1996; Peletier & Balcells, 1996). However, using only colors one cannot directly transform the correlation in colors into correlations of age and/or metallicity.
A correlation between the line-strength index MgFe at one disk scale length and in the center was also found by Moorthy & Holtzman (2006). They interpret this as a correlation between the metallicity of bulge and disk as this index is more sensitive to variations of metallicity than age and it is almost insensitive to variations of Fe.
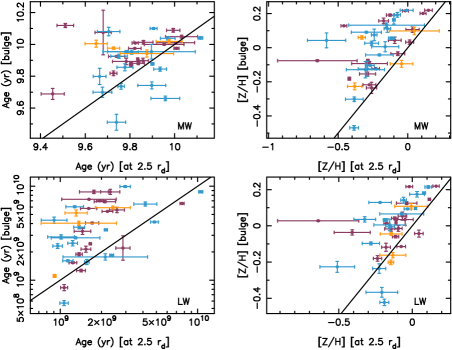
More recently Sánchez-Blázquez & et al. (2014) performed a full spectral fitting analysis of a sample of 62 nearly face-on spiral galaxies observed as a part of the IFS survey CALIFA (Sánchez & et al., 2012) and showed that the slope of the relation between the luminosity-weighted age and metallicity and central velocity dispersion is similar for the central parts of the bulges and for the disk at 2.4 scale-lengths, but the bulges show higher luminosity-weighted ages and metallicities. Figure 11 shows the comparison of the mean values of age and metallicity (both weighted with mass and light) in the center and at 2.5 scale-lengths of the disk. A Spearman rank order tests reflect that, while the metallicities of both components are correlated, the same does not happen with the ages.
Note that the correlation exists for all early and late-type spirals, spherical and pseudobulges, contrary to the connection between the radial sizes of bulges and disks, that only exists for pseudobulges (Fisher & Drory, 2008). Therefore either all bulges formed secularly and some had their bar destroyed or other physical processes are responsible for this correlation. Several authors have shown that the correlation between the disk and bulge sizes can exist in major and minor merger remnants. While minor mergers tend to preserve the original bulge-disk coupling of the main progenitor, major mergers are capable of rebuilding a bulge-disk coupling from the remnants after having destroyed the original structures of the progenitors (Querejeta et al., 2015, and references therein).
On the other hand, Morelli et al. (2012) rule out significant interplay between the bulge and disk components due to the similarity in the stellar population properties of bulges hosted in galaxies with very different disks (high- and low-surface brightness).
7 Summary
The study of stellar populations can provide the critical test needed to understand the basic mechanism driving bulge formation. However, a clear picture about the stellar population in bulges and their possible correlations with other parameters is still not obvious. We have collated the main results obtained from the study of colors and spectral characteristics and the comparison with stellar population models and can thus summarize them:
-
•
Bulges show a wide range of SSP-equivalent ages and metallicities. There is a trend for which more massive bulges have, on average, older stellar populations and higher values of metallicity and /Fe.
-
•
Bulges with high Sérsic index tend to be old and have high [/Fe] but it is not clear if this trend is due to the existing trend between mass and .
-
•
There are not strong differences in the stellar populations of bulges and elliptical galaxies at the same mass, but the details are of this comparison are still not clear and conclusions differ between studies.
-
•
Bulges are, in many cases, composite systems, with disky, boxy/peanut and classical bulges coexisting in the same galaxy. They usually host different stellar populations. Young stars, when present, are located in central disks and rings. These young components are not seen in edge-on samples which has lead studies differing in the orientation of the sample to obtain different results.
-
•
In general terms, there are not very clear differences in the stellar population properties of bulges with and without bars, neither in the central values nor in the variations with radius. If there are differences, those are only present in massive galaxies, and they show up as an excess of young populations when compared to unbarred galaxies.
-
•
When the mass-weighted mean values of age are considered, all bulges, independent of their mass, seem to be dominated by old stars. The trends between age, metallicity, and mass become much flatter and almost non-existent. This is true for bulges with a variety of structural parameters, such as different Sérsic indices or surface brightness profiles.
-
•
Bulges show mild, negative, metallicity gradients and almost null Fe and age gradients. The distribution of the slopes is similar to that found in elliptical galaxies. At present, there is no agreement about the possible correlation of these gradients and other parameters.
-
•
There is a correlation between the metallicity of the bulge and the disk but not between the ages.
8 Future prospects
Although considerable progress has been made in the field, there is still much to be done, in order to understand the star formation histories and chemical evolution in the bulges of spirals and S0 galaxies. The first thing we have to deal with is the fact that we cannot make a clean distinction between classical, disky, and boxy/peanut bulges, as many of them coexist in the same galaxy. We need to quantify the preponderance of each component and correlate this with other properties of the galaxies, like the mass, the environment, the presence of bars, type of spiral arms, etc. We need also to understand the physical mechanism that formed each components. For example, numerical simulations have shown that bulges with structural characteristics of pseudobulges can be formed, not only secularly, but also quickly, at high redshift, via a combination of non-axisymmetric disk instabilities and tidal interactions or mergers.
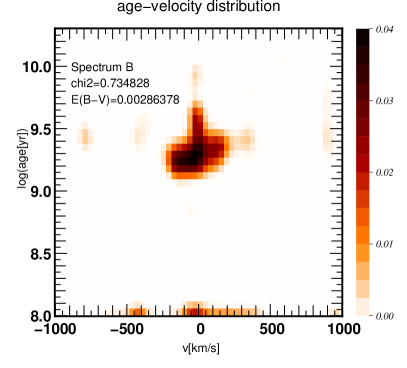
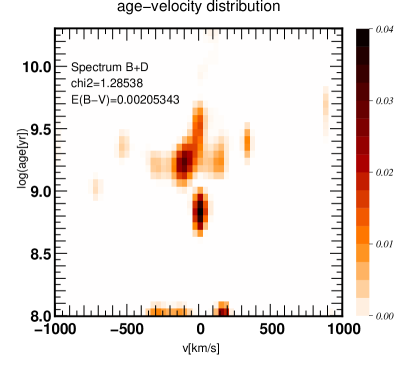
Most advances, therefore, will come from the use of new techniques to derive star formation histories that allow us to distinguish different episodes of star formation. The future is promising: Ocvirk et al. (2008) and Coccato et al. (2011) show the feasibility of separating different components, not only in terms of stellar populations, but also kinematically. This is illustrated in Fig. 12, from Ocvirk et al. (2008), where the age-velocity distribution for the bulge is shown in two positions (in the center and outside the bulge dominated region of the galaxy). In this work, the authors model the observed spectrum as a sum of 40 components with different ages but, contrary to the traditional assumption that all components share the same line-of-sight velocity distribution (LOSVD), each component was allowed to have its own non-parametric (not necessarily Gaussian) LOSVD. These authors reconstructed the age-velocity distribution of two bulge regions of the Sbc galaxy NGC 4030 and were able to separate two components, one with a relatively young stellar population (2 Gyr) and km/s and an even younger ( 500 Myr), and kinematically colder ( km/s). Its location (outside the bulge-dominated region of the galaxy), kinematics, and relatively young age suggest that this is a young internal disk. The null mean velocity of the structure is expected for the minor axis of a stellar disk. This study demonstrates the feasibility of separating and measuring the age and kinematics of superimposed galactic components from an integrated light spectrum. This type of analysis will be very useful in characterizing the properties of the different components in composite bulges and isolating the properties of their stellar populations.
Furthermore, we have mentioned throughout the chapter several results that need to be confirmed with larger samples. Spectroscopic studies of a large sample of bulges with different characteristics are clearly needed to advance in our understanding of bulge stellar populations. Ideally this sample will be observed with an integral field unit –to be able to separate morphologically the different subcomponents – and it will contain galaxies in different environments. Indeed, the influence of environment has not been studied thoroughly. Morelli et al. (2008) analyzed a sample of bulges in the Coma cluster but they did not compare their results with bulges in other environments. Peletier et al. (1999) did not find any difference in the colors of galaxies in different environments and concluded that this parameter does not have a strong influence in shaping the star formation in bulges. Nonetheless, a more comprehensive study remains to be done. A detailed study of the properties of bulges with environment might help us to distinguish between external and internal processes for the formation of bulges.
We expect that instruments that are already operating, such as MUSE (Bacon & et al., 2010), with superb spatial resolution, will help us to resolve central components, such as nuclear disks or bars. These data will allow the coupling of stellar population and kinematical properties with the morphological characteristics of the galaxies, improving our understanding of bulges in a way it has not been possible before.
Acknowledgements.
I would like to thank Brad Gibson, Jairo Mendez-Abreu, Pierre Ocvirk, Jesús Falcón-Barroso, Adriana de Lorenzo-Cáceres and also the anonymous referee for suggestions that improved this manuscript. I would also like to thank all the authors who have kindly provided me with figures from their publications.References
- Aguerri et al. (2001) Aguerri J. A. L., Balcells M., Peletier R. F., 2001, A& A, 367, 428
- Alonso-Herrero & Knapen (2001) Alonso-Herrero A., Knapen J. H., 2001, AJ, 122, 1350
- Annibali et al. (2007) Annibali F., Bressan A., Rampazzo R., Zeilinger W. W., Danese L., 2007, A& A, 463, 455
- Arimoto & Yoshii (1987) Arimoto N., Yoshii Y., 1987, A& A, 173, 23
- Athanassoula (2005) Athanassoula E., 2005, MNRAS, 358, 1477
- Athanassoula et al. (2005) Athanassoula E., Lambert J. C., Dehnen W., 2005, MNRAS, 363, 496
- Athanassoula et al. (2013) Athanassoula E., Machado R. E. G., Rodionov S. A., 2013, MNRAS, 429, 1949
- Bacon et al. (2001) Bacon R., Copin Y., Monnet G., Miller B. W., Allington-Smith J. R., Bureau M., Carollo C. M., Davies R. L., Emsellem E., Kuntschner H., Peletier R. F., Verolme E. K., de Zeeuw P. T., 2001, MNRAS, 326, 23
- Bacon & et al. (2010) Bacon R., et al., 2010, in Society of Photo-Optical Instrumentation Engineers (SPIE) Conference Series, Vol. 7735, Society of Photo-Optical Instrumentation Engineers (SPIE) Conference Series, p. 8
- Balcells & Peletier (1994) Balcells M., Peletier R. F., 1994, AJ, 107, 135
- Bell & de Jong (2000) Bell E. F., de Jong R. S., 2000, MNRAS, 312, 497
- Bender et al. (1993) Bender R., Burstein D., Faber S. M., 1993, Ap.J, 411, 153
- Berentzen et al. (2007) Berentzen I., Shlosman I., Martinez-Valpuesta I., Heller C. H., 2007, Ap.J, 666, 189
- Bica (1988) Bica E., 1988, A& A, 195, 76
- Blanc et al. (2013) Blanc G. A., Weinzirl T., Song M., Heiderman A., Gebhardt K., Jogee S., Evans II N. J., van den Bosch R. C. E., Luo R., Drory N., Fabricius M., Fisher D., Hao L., Kaplan K., Marinova I., Vutisalchavakul N., Yoachim P., 2013, AJ, 145, 138
- Bournaud & Combes (2002) Bournaud F., Combes F., 2002, A& A, 392, 83
- Bruzual & Charlot (2003) Bruzual G., Charlot S., 2003, MNRAS, 344, 1000
- Buta & Combes (1996) Buta R., Combes F., 1996, Fundamentals of Cosmic Physics, 17, 95
- Byrd et al. (1994) Byrd G., Rautiainen P., Salo H., Buta R., Crocher D. A., 1994, AJ, 108, 476
- Cappellari & et al. (2011) Cappellari M., et al., 2011, MNRAS, 416, 1680
- Carollo et al. (2001) Carollo C. M., Stiavelli M., de Zeeuw P. T., Seigar M., Dejonghe H., 2001, Ap.J, 546, 216
- Casuso et al. (1996) Casuso E., Vazdekis A., Peletier R. F., Beckman J. E., 1996, Ap.J, 458, 533
- Cenarro et al. (2004) Cenarro A. J., Sánchez-Blázquez P., Cardiel N., Gorgas J., 2004, Ap.J Letters, 614, L101
- Chiappini et al. (2002) Chiappini C., Pellegrini P. S., Rité C., Maia M. A. G., Ogando R., Ramos B., Schiavon R. P., Willmer C. N. A., da Costa L., Bernardi M., Alonso M. V., Wegner G., 2002, in Astronomical Society of the Pacific Conference Series, Vol. 253, Chemical Enrichment of Intracluster and Intergalactic Medium, Fusco-Femiano R., Matteucci F., eds., p. 321
- Cid Fernandes et al. (2005) Cid Fernandes R., Mateus A., Sodré L., Stasińska G., Gomes J. M., 2005, MNRAS, 358, 363
- Clarkson et al. (2008) Clarkson W., Sahu K., Anderson J., Smith T. E., Brown T. M., Rich R. M., Casertano S., Bond H. E., Livio M., Minniti D., Panagia N., Renzini A., Valenti J., Zoccali M., 2008, Ap.J, 684, 1110
- Coccato et al. (2011) Coccato L., Morelli L., Corsini E. M., Buson L., Pizzella A., Vergani D., Bertola F., 2011, MNRAS, 412, L113
- Coelho et al. (2007) Coelho P., Bruzual G., Charlot S., Weiss A., Barbuy B., Ferguson J. W., 2007, MNRAS, 382, 498
- Coelho & Gadotti (2011) Coelho P., Gadotti D. A., 2011, Ap.J Letters, 743, L13
- Conroy et al. (2014) Conroy C., Graves G. J., van Dokkum P. G., 2014, Ap.J, 780, 33
- Conroy & van Dokkum (2012) Conroy C., van Dokkum P. G., 2012, Ap.J, 760, 71
- de Jong (1996) de Jong R. S., 1996, A& A, 313, 377
- de Lorenzo-Cáceres et al. (2013) de Lorenzo-Cáceres A., Falcón-Barroso J., Vazdekis A., 2013, MNRAS, 431, 2397
- de Lorenzo-Cáceres et al. (2012) de Lorenzo-Cáceres A., Vazdekis A., Aguerri J. A. L., Corsini E. M., Debattista V. P., 2012, MNRAS, 420, 1092
- Debattista et al. (2006) Debattista V. P., Mayer L., Carollo C. M., Moore B., Wadsley J., Quinn T., 2006, Ap.J, 645, 209
- Domínguez-Tenreiro et al. (1998) Domínguez-Tenreiro R., Tissera P. B., Sáiz A., 1998, Ap.J Letters, 508, L123
- Drory & Fisher (2007) Drory N., Fisher D. B., 2007, Ap.J, 664, 640
- Eggen et al. (1962) Eggen O. J., Lynden-Bell D., Sandage A. R., 1962, Ap.J, 136, 748
- Eliche-Moral et al. (2011) Eliche-Moral M. C., González-García A. C., Balcells M., Aguerri J. A. L., Gallego J., Zamorano J., Prieto M., 2011, A& A, 533, A104
- Ellison et al. (2011) Ellison S. L., Nair P., Patton D. R., Scudder J. M., Mendel J. T., Simard L., 2011, MNRAS, 416, 2182
- Emsellem & et al. (2011) Emsellem E., et al., 2011, MNRAS, 414, 888
- Erwin (2008) Erwin P., 2008, in IAU Symposium, Vol. 245, IAU Symposium, Bureau M., Athanassoula E., Barbuy B., eds., pp. 113–116
- Falcón-Barroso et al. (2002) Falcón-Barroso J., Peletier R. F., Balcells M., 2002, MNRAS, 335, 741
- Feltzing & Gilmore (2000) Feltzing S., Gilmore G., 2000, A& A, 355, 949
- Fernández Lorenzo et al. (2014) Fernández Lorenzo M., Sulentic J., Verdes-Montenegro L., Blasco-Herrera J., Argudo-Fernández M., Garrido J., Ramírez-Moreta P., Ruiz J. E., Sánchez-Expósito S., Santander-Vela J. D., 2014, Ap.J Letters, 788, L39
- Ferreras & Silk (2002) Ferreras I., Silk J., 2002, MNRAS, 336, 1181
- Fisher et al. (1996) Fisher D., Franx M., Illingworth G., 1996, Ap.J, 459, 110
- Fisher & Drory (2008) Fisher D. B., Drory N., 2008, AJ, 136, 773
- Freeman (2008) Freeman K. C., 2008, in IAU Symposium, Vol. 245, IAU Symposium, Bureau M., Athanassoula E., Barbuy B., eds., pp. 3–10
- Friedli & Benz (1995) Friedli D., Benz W., 1995, A& A, 301, 649
- Fulbright et al. (2007) Fulbright J. P., McWilliam A., Rich R. M., 2007, Ap.J, 661, 1152
- Gadotti (2008) Gadotti D. A., 2008, MNRAS, 384, 420
- Gadotti (2009) —, 2009, MNRAS, 393, 1531
- Gadotti & de Souza (2006) Gadotti D. A., de Souza R. E., 2006, Ap.J Supplement, 163, 270
- Gadotti & dos Anjos (2001) Gadotti D. A., dos Anjos S., 2001, AJ, 122, 1298
- Ganda et al. (2009) Ganda K., Peletier R. F., Balcells M., Falcón-Barroso J., 2009, MNRAS, 395, 1669
- Ganda et al. (2007) Ganda K., Peletier R. F., McDermid R. M., Falcón-Barroso J., de Zeeuw P. T., Bacon R., Cappellari M., Davies R. L., Emsellem E., Krajnović D., Kuntschner H., Sarzi M., van de Ven G., 2007, MNRAS, 380, 506
- Gonzalez et al. (2011) Gonzalez O. A., Rejkuba M., Zoccali M., Valenti E., Minniti D., 2011, A& A, 534, A3
- González Delgado & et al. (2014) González Delgado R. M., et al., 2014, A& A, 562, A47
- Gorgas et al. (1993) Gorgas J., Faber S. M., Burstein D., Gonzalez J. J., Courteau S., Prosser C., 1993, Ap.J Supplement, 86, 153
- Goudfrooij et al. (1999) Goudfrooij P., Gorgas J., Jablonka P., 1999, Ap & SS, 269, 109
- Graves & Schiavon (2008) Graves G. J., Schiavon R. P., 2008, Ap.J Supplement, 177, 446
- Groenewegen & Blommaert (2005) Groenewegen M. A. T., Blommaert J. A. D. L., 2005, A& A, 443, 143
- Guedes et al. (2013) Guedes J., Mayer L., Carollo M., Madau P., 2013, Ap.J, 772, 36
- Heavens et al. (2000) Heavens A. F., Jimenez R., Lahav O., 2000, MNRAS, 317, 965
- Ho et al. (1997) Ho L. C., Filippenko A. V., Sargent W. L. W., 1997, Ap.J, 487, 591
- Huang et al. (1996) Huang J. H., Gu Q. S., Su H. J., Hawarden T. G., Liao X. H., Wu G. X., 1996, A& A, 313, 13
- Idiart et al. (1996) Idiart T. P., de Freitas Pacheco J. A., Costa R. D. D., 1996, AJ, 111, 1169
- Immeli et al. (2004) Immeli A., Samland M., Gerhard O., Westera P., 2004, A& A, 413, 547
- Jablonka et al. (2007) Jablonka P., Gorgas J., Goudfrooij P., 2007, A& A, 474, 763
- Jablonka et al. (1996) Jablonka P., Martin P., Arimoto N., 1996, AJ, 112, 1415
- James et al. (2008) James P. A., Prescott M., Baldry I. K., 2008, A& A, 484, 703
- Jogee et al. (2005) Jogee S., Scoville N., Kenney J. D. P., 2005, Ap.J, 630, 837
- Kannappan et al. (2004) Kannappan S. J., Jansen R. A., Barton E. J., 2004, AJ, 127, 1371
- Kauffmann & et al. (2003) Kauffmann G., et al., 2003, MNRAS, 341, 33
- Kennicutt (1993) Kennicutt Jr. R. C., 1993, in Astrophysics and Space Science Library, Vol. 188, The Environment and Evolution of Galaxies, Shull J. M., Thronson H. A., eds., p. 533
- Koleva et al. (2009) Koleva M., Prugniel P., Bouchard A., Wu Y., 2009, A& A, 501, 1269
- Kormendy (1977) Kormendy J., 1977, Ap.J, 218, 333
- Kormendy & Barentine (2010) Kormendy J., Barentine J. C., 2010, Ap.J Letters, 715, L176
- Kormendy et al. (2010) Kormendy J., Drory N., Bender R., Cornell M. E., 2010, Ap.J, 723, 54
- Kormendy & Fisher (2005) Kormendy J., Fisher D. B., 2005, in Revista Mexicana de Astronomia y Astrofisica Conference Series, Vol. 23, Revista Mexicana de Astronomia y Astrofisica Conference Series, Torres-Peimbert S., MacAlpine G., eds., pp. 101–108
- Kormendy & Kennicutt (2004) Kormendy J., Kennicutt Jr. R. C., 2004, ARA& A, 42, 603
- Kraljic et al. (2012) Kraljic K., Bournaud F., Martig M., 2012, Ap.J, 757, 60
- Larson (1974) Larson R. B., 1974, MNRAS, 166, 585
- Laurikainen et al. (2004) Laurikainen E., Salo H., Buta R., 2004, Ap.J, 607, 103
- Laurikainen et al. (2007) Laurikainen E., Salo H., Buta R., Knapen J. H., 2007, MNRAS, 381, 401
- Lee & Worthey (2005) Lee H.-c., Worthey G., 2005, Ap.J Supplement, 160, 176
- MacArthur (2005) MacArthur L. A., 2005, Ap.J, 623, 795
- MacArthur et al. (2004) MacArthur L. A., Courteau S., Bell E., Holtzman J. A., 2004, Ap.J Supplement, 152, 175
- MacArthur et al. (2009) MacArthur L. A., González J. J., Courteau S., 2009, MNRAS, 395, 28
- Martinez-Valpuesta & Gerhard (2013) Martinez-Valpuesta I., Gerhard O., 2013, Ap.J Letters, 766, L3
- McWilliam & Rich (1994) McWilliam A., Rich R. M., 1994, Ap.J Supplement, 91, 749
- Mehlert et al. (2003) Mehlert D., Thomas D., Saglia R. P., Bender R., Wegner G., 2003, A& A, 407, 423
- Minniti et al. (1995) Minniti D., Olszewski E. W., Liebert J., White S. D. M., Hill J. M., Irwin M. J., 1995, MNRAS, 277, 1293
- Moorthy & Holtzman (2006) Moorthy B. K., Holtzman J. A., 2006, MNRAS, 371, 583
- Morelli et al. (2012) Morelli L., Corsini E. M., Pizzella A., Dalla Bontà E., Coccato L., Méndez-Abreu J., Cesetti M., 2012, MNRAS, 423, 962
- Morelli et al. (2008) Morelli L., Pompei E., Pizzella A., Méndez-Abreu J., Corsini E. M., Coccato L., Saglia R. P., Sarzi M., Bertola F., 2008, MNRAS, 389, 341
- Noguchi (2000) Noguchi M., 2000, MNRAS, 312, 194
- Norman et al. (1996) Norman C. A., Sellwood J. A., Hasan H., 1996, Ap.J, 462, 114
- Nowak et al. (2010) Nowak N., Thomas J., Erwin P., Saglia R. P., Bender R., Davies R. I., 2010, MNRAS, 403, 646
- Obreja et al. (2013) Obreja A., Domínguez-Tenreiro R., Brook C., Martínez-Serrano F. J., Doménech-Moral M., Serna A., Mollá M., Stinson G., 2013, Ap.J, 763, 26
- Ocvirk et al. (2008) Ocvirk P., Peletier R., Lançon A., 2008, Astronomische Nachrichten, 329, 980
- Ocvirk et al. (2006a) Ocvirk P., Pichon C., Lançon A., Thiébaut E., 2006a, MNRAS, 365, 74
- Ocvirk et al. (2006b) —, 2006b, MNRAS, 365, 46
- Ortolani et al. (1995) Ortolani S., Renzini A., Gilmozzi R., Marconi G., Barbuy B., Bica E., Rich R. M., 1995, Nature, 377, 701
- Peletier & Balcells (1996) Peletier R. F., Balcells M., 1996, AJ, 111, 2238
- Peletier et al. (1999) Peletier R. F., Balcells M., Davies R. L., Andredakis Y., Vazdekis A., Burkert A., Prada F., 1999, MNRAS, 310, 703
- Peletier et al. (2007) Peletier R. F., Falcón-Barroso J., Bacon R., Cappellari M., Davies R. L., de Zeeuw P. T., Emsellem E., Ganda K., Krajnović D., Kuntschner H., McDermid R. M., Sarzi M., van de Ven G., 2007, MNRAS, 379, 445
- Pérez & et al. (2013) Pérez E., et al., 2013, Ap.J Letters, 764, L1
- Pérez & Sánchez-Blázquez (2011) Pérez I., Sánchez-Blázquez P., 2011, A& A, 529, A64
- Pérez et al. (2007) Pérez I., Sánchez-Blázquez P., Zurita A., 2007, A& A, 465, L9
- Pérez et al. (2009) —, 2009, A& A, 495, 775
- Proctor et al. (2004) Proctor R. N., Forbes D. A., Beasley M. A., 2004, MNRAS, 355, 1327
- Proctor & Sansom (2002) Proctor R. N., Sansom A. E., 2002, MNRAS, 333, 517
- Proctor et al. (2000) Proctor R. N., Sansom A. E., Reid I. N., 2000, MNRAS, 311, 37
- Prugniel et al. (2001) Prugniel P., Maubon G., Simien F., 2001, A& A, 366, 68
- Prugniel & Simien (1994) Prugniel P., Simien F., 1994, A& A, 282, L1
- Puzia et al. (2005) Puzia T. H., Perrett K. M., Bridges T. J., 2005, A& A, 434, 909
- Puzia et al. (2002) Puzia T. H., Saglia R. P., Kissler-Patig M., Maraston C., Greggio L., Renzini A., Ortolani S., 2002, A& A, 395, 45
- Querejeta et al. (2015) Querejeta M., Eliche-Moral M. C., Tapia T., Borlaff A., Rodríguez-Pérez C., Zamorano J., Gallego J., 2015, A& A, 573, A78
- Rosales-Ortega et al. (2010) Rosales-Ortega F. F., Kennicutt R. C., Sánchez S. F., Díaz A. I., Pasquali A., Johnson B. D., Hao C. N., 2010, MNRAS, 405, 735
- Sakamoto et al. (1999) Sakamoto K., Okumura S. K., Ishizuki S., Scoville N. Z., 1999, Ap.J, 525, 691
- Samland & Gerhard (2003) Samland M., Gerhard O. E., 2003, A& A, 399, 961
- Sánchez & et al. (2012) Sánchez S. F., et al., 2012, A& A, 538, A8
- Sánchez-Blázquez & et al. (2014) Sánchez-Blázquez P., et al., 2014, A& A, 570, A6
- Sánchez-Blázquez et al. (2006a) Sánchez-Blázquez P., Gorgas J., Cardiel N., González J. J., 2006a, A& A, 457, 787
- Sánchez-Blázquez et al. (2011) Sánchez-Blázquez P., Ocvirk P., Gibson B. K., Pérez I., Peletier R. F., 2011, MNRAS, 415, 709
- Sánchez-Blázquez et al. (2006b) Sánchez-Blázquez P., Peletier R. F., Jiménez-Vicente J., Cardiel N., Cenarro A. J., Falcón-Barroso J., Gorgas J., Selam S., Vazdekis A., 2006b, MNRAS, 371, 703
- Sánchez-Blázquez et al. (2014) Sánchez-Blázquez P., Rosales-Ortega F., Diaz A., Sánchez S. F., 2014, MNRAS, 437, 1534
- Sarzi et al. (2006) Sarzi M., Falcón-Barroso J., Davies R. L., Bacon R., Bureau M., Cappellari M., de Zeeuw P. T., Emsellem E., Fathi K., Krajnović D., Kuntschner H., McDermid R. M., Peletier R. F., 2006, MNRAS, 366, 1151
- Scannapieco et al. (2010) Scannapieco C., Gadotti D. A., Jonsson P., White S. D. M., 2010, MNRAS, 407, L41
- Schiavon (2007) Schiavon R. P., 2007, Ap.J Supplement, 171, 146
- Shen & Sellwood (2004) Shen J., Sellwood J. A., 2004, Ap.J, 604, 614
- Sheth & et al. (2008) Sheth K., et al., 2008, Ap.J, 675, 1141
- Sil’chenko & Afanasiev (2004) Sil’chenko O. K., Afanasiev V. L., 2004, AJ, 127, 2641
- Sil’chenko et al. (2010) Sil’chenko O. K., Moiseev A. V., Shulga A. P., 2010, AJ, 140, 1462
- Soto et al. (2007) Soto M., Rich R. M., Kuijken K., 2007, Ap.J Letters, 665, L31
- Tantalo & Chiosi (2004) Tantalo R., Chiosi C., 2004, MNRAS, 353, 917
- Terndrup et al. (1994) Terndrup D. M., Davies R. L., Frogel J. A., Depoy D. L., Wells L. A., 1994, Ap.J, 432, 518
- Thomas & Davies (2006) Thomas D., Davies R. L., 2006, MNRAS, 366, 510
- Thomas et al. (2003) Thomas D., Maraston C., Bender R., 2003, MNRAS, 339, 897
- Thomas et al. (2005) Thomas D., Maraston C., Bender R., Mendes de Oliveira C., 2005, Ap.J, 621, 673
- Tojeiro et al. (2007) Tojeiro R., Heavens A. F., Jimenez R., Panter B., 2007, MNRAS, 381, 1252
- Trager et al. (1999) Trager S. C., Dalcanton J. J., Weiner B. J., 1999, in The Formation of Galactic Bulges, Carollo C. M., Ferguson H. C., Wyse R. F. G., eds., p. 42
- Trager et al. (2000) Trager S. C., Faber S. M., Worthey G., González J. J., 2000, AJ, 120, 165
- Trager & Somerville (2009) Trager S. C., Somerville R. S., 2009, MNRAS, 395, 608
- Tsujimoto & Bekki (2012) Tsujimoto T., Bekki K., 2012, Ap.J, 747, 125
- van Loon et al. (2003) van Loon J. T., Gilmore G. F., Omont A., Blommaert J. A. D. L., Glass I. S., Messineo M., Schuller F., Schultheis M., Yamamura I., Zhao H. S., 2003, MNRAS, 338, 857
- Vazdekis (1999) Vazdekis A., 1999, Ap.J, 513, 224
- Vazdekis et al. (2010) Vazdekis A., Sánchez-Blázquez P., Falcón-Barroso J., Cenarro A. J., Beasley M. A., Cardiel N., Gorgas J., Peletier R. F., 2010, MNRAS, 404, 1639
- Vazdekis et al. (2004) Vazdekis A., Trujillo I., Yamada Y., 2004, Ap.J Letters, 601, L33
- Villa-Vargas et al. (2010) Villa-Vargas J., Shlosman I., Heller C., 2010, Ap.J, 719, 1470
- Walcher et al. (2006) Walcher C. J., Böker T., Charlot S., Ho L. C., Rix H.-W., Rossa J., Shields J. C., van der Marel R. P., 2006, Ap.J, 649, 692
- Walcher et al. (2009) Walcher C. J., Coelho P., Gallazzi A., Charlot S., 2009, MNRAS, 398, L44
- Williams et al. (2012) Williams M. J., Bureau M., Kuntschner H., 2012, MNRAS, 427, L99
- Williams et al. (2011) Williams M. J., Zamojski M. A., Bureau M., Kuntschner H., Merrifield M. R., de Zeeuw P. T., Kuijken K., 2011, MNRAS, 414, 2163
- Worthey (1994) Worthey G., 1994, Ap.J Supplement, 95, 107
- Worthey et al. (1994) Worthey G., Faber S. M., Gonzalez J. J., Burstein D., 1994, Ap.J Supplement, 94, 687
- Wyse et al. (1997) Wyse R. F. G., Gilmore G., Franx M., 1997, ARA& A, 35, 637
- Zhao et al. (1994) Zhao H., Spergel D. N., Rich R. M., 1994, AJ, 108, 2154
- Zoccali et al. (2008) Zoccali M., Hill V., Lecureur A., Barbuy B., Renzini A., Minniti D., Gómez A., Ortolani S., 2008, A& A, 486, 177
- Zoccali et al. (2006) Zoccali M., Lecureur A., Barbuy B., Hill V., Renzini A., Minniti D., Momany Y., Gómez A., Ortolani S., 2006, A& A, 457, L1