A simulation-based study of the neutron backgrounds for NaI dark matter experiments
Abstract
Among the direct search experiments for weakly interacting massive particle (WIMP) dark matter, the DAMA experiment observed an annual modulation signal interpreted as WIMP interactions with a significance of 9.2. Recently, Jonathan Davis claimed that the DAMA modulation may be interpreted on the basis of the neutron scattering events induced by the muons and neutrinos together. We tried to simulate the neutron backgrounds at the Gran Sasso and Yangyang laboratory with and without the polyethylene shielding to quantify the effects of the ambient neutrons on the direct detection experiments based on the crystals.
1 Introduction
Numerous astronomical observations have led to the conclusion that the majority of the matter in our universe is invisible, exotic, and nonrelativistic dark matter [1, 2]. However, it is still unknown what the dark matter is. Weakly interacting massive particles (WIMPs) are one of the most attractive dark matter particle candidates [3, 4]. The lightest supersymmetric particle (LSP) is a possible WIMP candidate theoretically hypothesized beyond the standard model of particle physics. There have been a number of experiments that directly search for WIMPs in our galaxy by looking for WIMP–nucleus scattering through nuclear recoil [5, 6].
To date, several experiments (e.g., DAMA [8, 9], CoGeNT [12, 13], CRESST [15], and CDMS [16]) have yielded signals that could be interpreted as being possibly due to WIMP interactions. Except for the DAMA experiment, the indications of WIMP-like signals are not significant at the <3 confidence level, and the same experimental groups or independent groups are planning to confirm these signals. However, the result from the DAMA experiment has attracted attention because the observation of an annual modulation of WIMP-like signals with a significance of 9.2 has been reported. This finding has spurred a continuing debate concerning the observation of WIMPs over the past 15 years. The WIMP–nucleon cross sections inferred from the DAMA modulation are in conflict with limits from other experiments that directly measure the nuclear recoil signals, such as XENON100 [17], LUX [18], and SuperCDMS [19]. However, it is possible to explain all these experimental results without conflict because of nontrivial systematic differences in detector responses [20, 21] and the commonly used astronomical model for the WIMP distribution [22].
Recently Jonathan Davis of Durham University has proposed a new model for the DAMA annual modulation, which is a sum of two annually modulating components with different phases. More specifically, the events are composed of neutrons, which are liberated in the material surrounding the detector by a combination of 8B solar neutrinos and atmospheric muons [7]. The DAMA group disagreed with Davis’s claim because the induced modulation amplitudes from neutrons induced by muons and by neutrinos are less than 9 cpd/kg/keV (2 cpd/kg/keV for neutrons produced in the lead shield) and less than 2 cpd/kg/keV, respectively from the simulation, and they are less than 0.1% of the modulation amplitude measured by DAMA/LIBRA [11]. Further, Barbeau et al criticized Davis’s claim because a seven order of magnitude discrepancy in the neutron contribution was required [14].
2 Method of simulation
To understand the neutron backgrounds for NaI dark matter experiments, we have performed simulations with the GEANT4 Toolkit [37]. The hadronic models of muon nucleus interaction and muon decay at rest were used in the GEANT4 simulation, version of 9.6.p02 (G4MuonVDNuclearModel and G4MuonMinusCaptureAtRest).
We have simulated the cosmic muons and the neutrons induced by simulating muons passing through the rock directly. We did not simulate the scintillation and light collection processes inside the crystals because it is not required for the conclusion derived in this study. Further, we did not simulate the environment neutrons underground because presumably these neutrons will not have annual modulation signals.
3 Analysis
3.1 Muon energy spectrum
Neutrons are produced primarily by the muons in the rock and materials in the detection system. These neutrons generate secondary neutrons via hadronic interactions in the materials. We simulated all the primary and secondary processes using GEANT4 simulation program starting with muons passing through the rock.
We used the muon energy spectrum provided by D. M. Mei and A. Hime [34], which is given by
| (1) |
where h is the rock slant depth in km.w.e and we used a set of parameters provided by Groom et al. for , b, and .
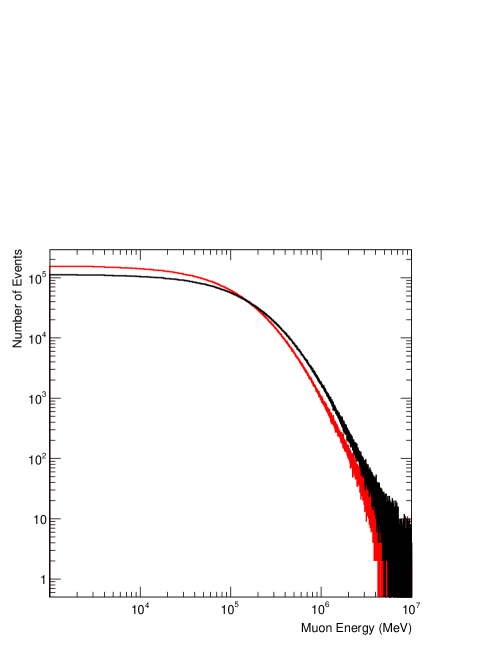
For two different depths at Gran Sasso and at Yangyang laboratory (Y2L) we assumed that h=3.1 km.w.e and h=1.8 km.w.e, respectively. Figure 1 shows muon energy spectra generated at Gran Sasso (black line) and at Y2L (red line). Muon average energies are 276 GeV and 201 GeV for Gran Sasso and Y2L, which are consistent with the measured values [34].
3.2 Schematic layout of simulation geometry
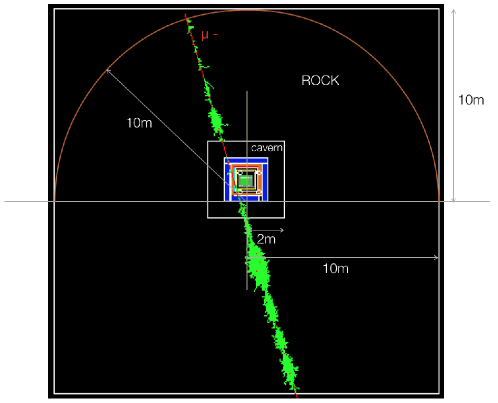
Inside the rock of a thickness of there is an air-filled cavern whose dimensions are . A hemisphere with a radius of 10 m is assumed and generated muons are incident onto the shielded detector with an angle randomly selected according to an angular distribution proportional to , as shown in Figure 2. The vertex of the muons is generated uniformly inside the square of 20 m20 m area at the surface of the hemisphere. The size of the square is determined to cover the whole volume of the rock for all the angles of the generated muons. Figure 1 shows the energy spectrum of generated muons at the hemisphere. The muon flux at Gran Sasso is considered as or and it is or at Y2L.
3.3 Neutron production at the boundary of rock and cavern
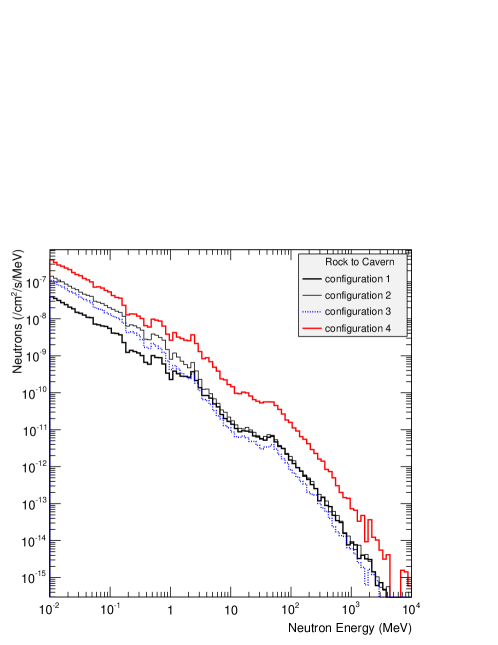
To validate the simulation for the neutron production we compared the neutron fluxes entering the cavern, which are produced in the rock. We also included neutrons scattered back from the rock wall as well as shielding materials surrounding the detector and reentering the cavern. Figure 3 shows the neutron energy spectra at the boundary between the rock and cavern, obtained from the simulation of muon propagation and interaction with materials in the rock. There are four different shielding configurations inside the cavern, denoted as 1, 2, 3, and 4, defined in section 3.4, therefore, we can see the effect of the neutrons reflected back from the wall and shielding materials inside the cavern. Most are dominant below 1 MeV and it depends on the outmost shield layer whether it is polyethylene (PE) or not.
According to the simulation results neutron fluxes are and , for energies above 1 MeV, under shielding configuration 1 at Gran Sasso and under configuration 4 at Y2L, respectively. It is in good agreement with GEANT4 results of version 6.2 [35] and close to the FLUKA result [36], , obtained from muon simulation in NaCl at Boulby.
3.4 Shielding configurations and shielding effects
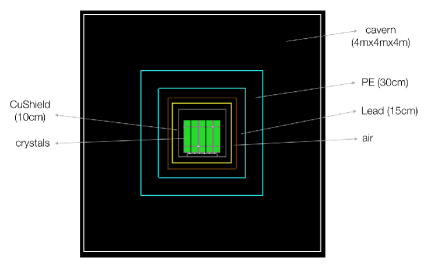
We assumed the NaI detectors used by DAMA/LIBRA, and therefore there are 55 segmented NaI crystals with dimensions of for a single crystal. The target NaI crystals are inside a 10 cm copper shield and it is additionally surrounded by lead and polyethylene (PE) shields.
To study the shielding effects, we set four different shielding configurations outside the copper shield:
-
1.
Lead (15 cm) + PE (30 cm) same as the DAMA setup
-
2.
PE (30 cm) + Lead (15 cm)
-
3.
Lead shield only (15 cm)
-
4.
PE (5 cm) + Lead (15 cm) + MD (30 cm) same as KIMS-NaI setup
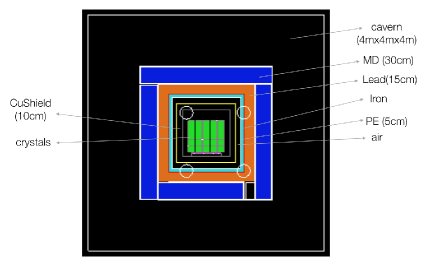
Shielding configuration 1 represents the DAMA setup at Gran Sasso depth, which uses 30 cm thick PE as the outmost shield layer. The order of lead and PE shield layers was switched for configuration 2. The shielding effect was also tested with a lead shield only (configuration 3). Figure 4 shows shielded detector geometries for KIMS-NaI (left) and DAMA (right) setups. For the KIMS-NaI setup (configuration 4), 5 cm thick PE was put inside a lead shield and MD outside the lead shield, which is a muon detector filled with mineral oil (liquid paraffin). We expect that 30 cm thick MD can also shield neutrons as much as the PE shield did in the configuration 1.
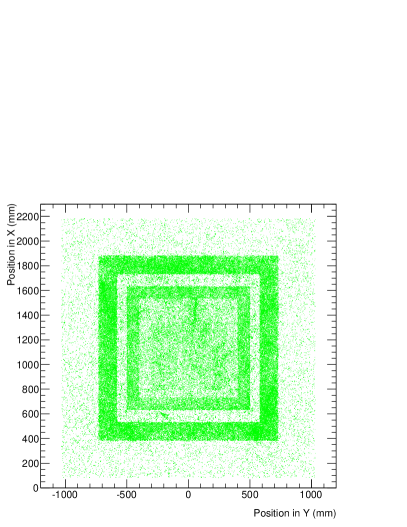
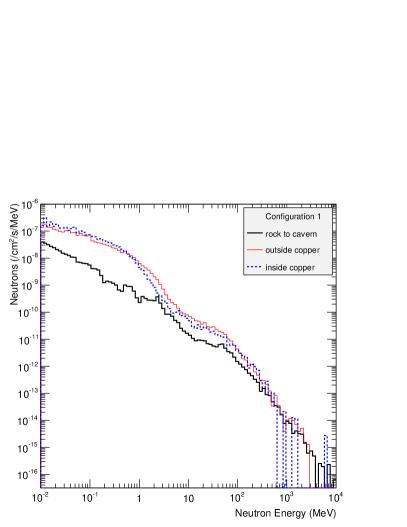
However, neutrons can also be produced by muon interaction with shielding materials and should be considered in configuring shield layers. Figure 5 (left) shows the primary vertex positions of neutrons in the x-y plane of the shielding configuration 1, and it is found to be dense in the lead and copper shields. The right side of Figure 5 shows neutron energy spectra at boundaries between different shield layers. We defined three different boundaries: rock/cavern (thick black line), outside copper shield (thin red line), and between copper and target crystals inside (dotted blue line). From the neutron spectra we found that the neutrons are built up in the lead and copper shields.
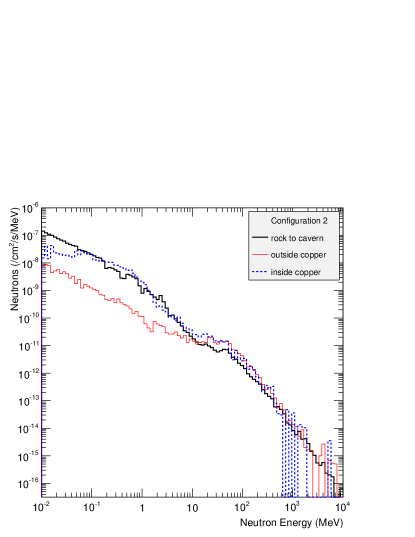
To quantify the effects of neutrons with and without PE inside the lead shield we tested neutron energy spectra at boundaries with configuration 2, in which we changed the order of shield layers of PE and lead, as explained earlier. As shown in Figure 6 neutrons below 10 MeV are reduced dramatically between PE and the copper shield. Therefore, it is more effective to shield neutrons below 10 MeV by putting the PE shield inside the lead.
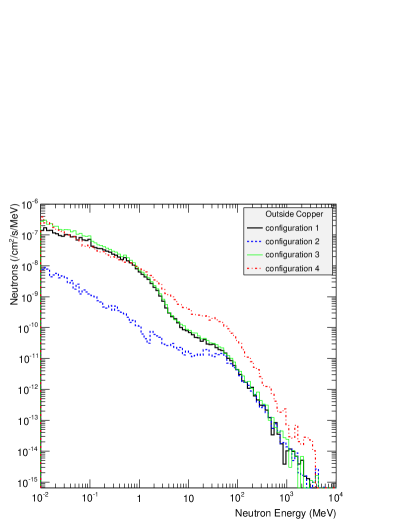
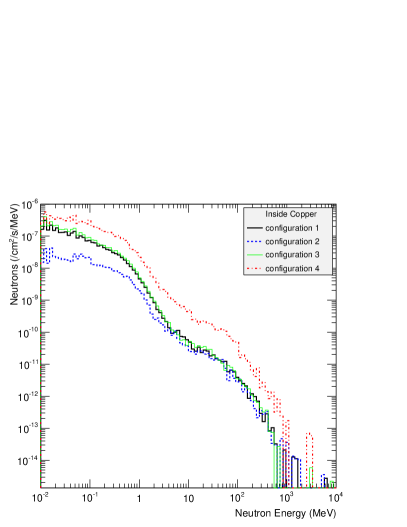
In addition, we tested the shielding effects with respect to shielding configurations by comparing neutron energy spectra from configurations 1, 2, 3, and 4 at two different boundaries. One boundary is outside the copper shield and another is inside the copper shield. Results at each boundary are shown in the left and the right of Figure 7. There is little difference between configuration 1 and 3 for neutrons below 0.1 MeV. If we consider the order of magnitude difference in muon fluxes at the depths of Gran Sasso and Y2L, the shielding effect with configuration 2 is very similar to the result with configuration 4, which used 5 cm thick PE inside the lead shield and 30 cm thick MD instead of PE in configuration 1. As shown in the left of Figure 7, even 5 cm thick PE inside the lead is effective to shield neutrons below 1 MeV. Accordingly, 30 cm thick PE inside the lead shield (configuration 2) is the most effective in shielding intermediate neutrons compared to other configurations.
3.5 Neutron detection in NaI crystals
From the simulation studies described in sections 3.3 and 3.4, we obtained the neutron flux at the boundaries of the shield layers and tested the shielding effect in each shielding material. We now consider the nuclear recoil event in NaI crystals due to neutron backgrounds.
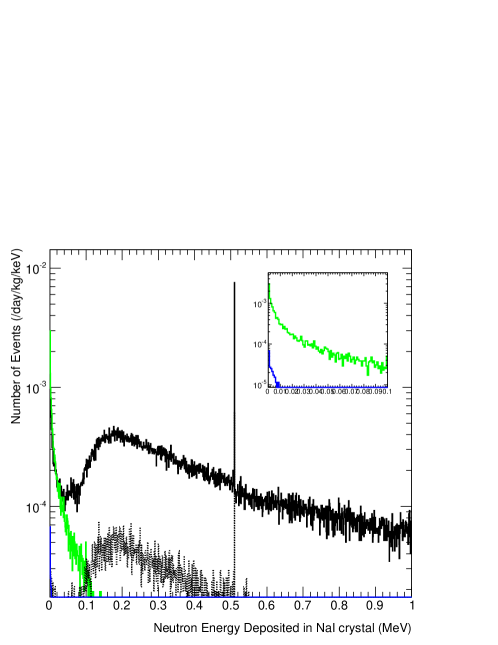
Because we have 55 segmented NaI crystals an event can deposit its energy in two or more crystals. Therefore, we call an event a single hit event when it deposits the energy in a single NaI crystal and a multiple hit event when it exhibits energy deposition in two or more NaI crystals. Figure 8 shows the spectra of energy deposited in NaI crystals, which include not only nuclear recoil but also electromagnetic energy deposition. The thick black line represents all events that deposited energy in the NaI crystal and the dotted black line represents single hit events. The green color represents energy deposited by all nuclear recoil events, and the blue color represents results for nuclear recoil single events only. The nuclear recoil events contribute only at the lowest energies. Figure 8 is obtained from the simulation with shielding configuration 1 at Gran Sasso, and for nuclear recoil single hit events it is much lower than the cpd level for energies below 100 keV (inset).
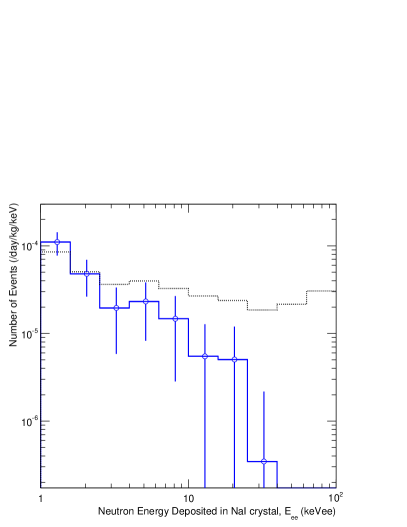
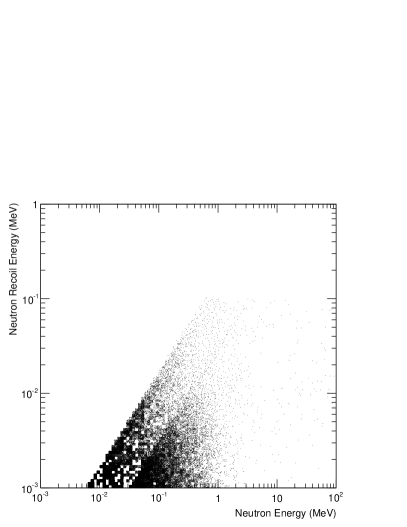
The left of Figure 9 shows the spectra of visible energy deposited by all single hit events (dotted black line), using configuration 1. The thick blue line represents results from nuclear recoil single hit events only. A nuclear recoil event yields a lower number of scintillation photons than an electron recoil events for the same energy deposition. Measurements of the quenching factors for Na and I recoils in NaI(Tl) crystals have been reported and are 25 and 10, respectively [38]. Therefore, we applied 0.25 and 0.1 as quenching factors for Na and I in the simulation. The right graph in Figure 9 depicts the relationship between nuclear recoil energy and neutron kinetic energy as a scatter plot, and the Na and I recoils are separated.
4 Results
Table 1 shows the summarized results for single hit event rates for the four shielding configurations. Single hit events include electromagnetic energy deposition as well as nuclear recoil energy deposition. The single hit event rates by the nuclear recoil event only are also obtained.
The nuclear recoil single hit event rates at Y2L and Gran Sasso are (4.591.05) and (8.691.45) dru, respectively, and all single hit events rates are on the order of and dru for configurations 4 and 1.
| Nuclear Recoil | |||
| Shielding | Single hit Events | Single hit Events | |
| Place | configuration | [/day/kg/keV] | [/day/kg/keV] |
| Energy [keVee] | Energy [keVee] | ||
| 2 - 10 | 2 - 10 | ||
| GS | 1 | (1.620.20) | (8.691.45) |
| GS | 2 | (6.521.25) | (1.930.68) |
| GS | 3 | (1.840.21) | (1.350.18) |
| Y2L | 4 | (1.210.17) | (4.591.05) |
5 Conclusion
As shown in Table 1, it is very unlikely that the neutrons are the main source for the DAMA annual modulation, which was reported as (0.01120.0012) cpd/kg/keV in the (2-6) keV energy interval of the modulation amplitude [10].
The DAMA group refuted Davis’s claim because the induced modulation amplitudes from neutrons induced by muons and by neutrinos are less than 9 cpd/kg/keV (2 cpd/kg/keV for neutrons produced in the lead shield) and less than 2 cpd/kg/keV, respectively from the simulation, and they are less than 0.1% of the modulation amplitude measured by DAMA/LIBRA [11].
6 References
References
- [1] E. Komatsu et al. (WMAP Collaboration), Astrophys. J. Suppl. 192 (2011) 18.
- [2] P. A. R. Ade et al. (Planck Collaboration), arXiv:1303.5076.
- [3] B. W. Lee and S. Weinberg, Phys. Rev. Lett. 39 (1977) 165.
- [4] G. Jungman, A. Kamionkowski, and K. Griest, Phys. Rep. 267 (1996) 195.
- [5] R. Gaitskell, Annu. Rev. Nucl. Part. Sci. 54 (2004) 315.
- [6] L. Baudis, Phys. Dark Univ. 1 (2012) 94.
- [7] Jonathan H. Davis, PRL 113, 081302 (2014)
- [8] R. Bernabei et al., Eur. Phys. J. C 56 (2008) 333.
- [9] R. Bernabei et al., Eur. Phys. J. C 67 (2010) 39.
- [10] R. Bernabei et al., Eur. Phys. J. C 73 (2013) 2648.
- [11] R. Bernabei et al., arXiv:1409.3516.
- [12] C. E. Aalseth et al. (CoGeNT Collaboration), Phys. Rev. Lett. 107 (2011) 141301.
- [13] C. E. Aalseth et al. (CoGeNT Collaboration), Phys. Rev. D 88 (2013) 012002.
- [14] P.S. Barbeau et al, arXiv:1409.3185.
- [15] G. Angloher et al., Eur. Phys. J. C 72 (2012) 1971.
- [16] R. Agnese et al. (CDMS Collaboration), Phys. Rev. Lett. 111 (2013) 251301.
- [17] E. Aprile et al. (XENON100 Collaboration), Phys. Rev. Lett. 109 (2012) 181301.
- [18] R. Agnese et al. (SuperCDMS Collaboration), Phys. Rev. Lett. 112 (2014) 041302.
- [19] D. S. Akerib et al. (LUX Collaboration), Phys Rev. Lett. 112 (2014) 091303.
- [20] G. Plante et al. , Phys Rev. C 84 (2011) 045805.
- [21] D. Barker and D. M. Mei, Astropart. Phys. 38 (2012) 1.
- [22] Y. Y. Mao, L. E. Strigari, and R. H. Wechsler, Phys. Rev. D 89 (2014) 063513.
- [23] J. Amare et al., Nucl. Instrum. Methods Phys. Res., Sect. A 742 (2014) 187.
- [24] J. Amare et al., arXiv:1404.3564.
- [25] Y. D. Kim et al., J. Korean. Phys. Soc. 40 (2002) 520; Y. D. Kim et al., Nucl. Instrum. Methods Phys. Res., Sect. A 552 (2005) 456.
- [26] T. Y. Kim et al., Nucl. Instrum. Methods Phys. Res., Sect. A 500 (2003) 337; H. S. Lee et al., Nucl. Instrum. Methods Phys. Res., Sect. A 571 (2007) 644.
- [27] H. S. Lee et al., (KIMS Collaboration), Phys. Rev. Lett. 99 (2007) 091301.
- [28] S. C. Kim et al., (KIMS Collaboration), Phys. Rev. Lett. 108 (2012) 181301.
- [29] J. J. Zhu et al., High Energ. Phys. Nucl. 29 (2005) 8.
- [30] R. Bernabei et al., JINST 7 (2012) P03009.
- [31] H. S. Lee et al. (KIMS Collaboration), Phys. Lett. B 633 (2006) 201.
- [32] R. Bernabei et al., Nucl. Instrum. Methods Phys. Res., Sect. A, 592 (2008) 297.
- [33] S. Agostinelli et al., Nucl. Instrumen. Methods Phys. Res., Sect. A 506 (2003) 250; J. Allison et al., IEEE Tran. Nucl. Sci. 53 (2006) 270.
- [34] D. M. Mei and A. Hime, Phys. Rev. D 73 (2006) 053004.
- [35] H.M. Araujo et al. Nucl. Instrum. Meth. A545 (2005) 398-411.
- [36] M.J. Carson et al. Astroparticle Phys. 21(6) (2004) 667.
- [37] S. Agostinelli et al., Nuclear Instruments and Methods A 506 (2003) 250-303.
- [38] S. K. Kim, H. J. Kim and Y. D. Kim, New Journal of Physics 12 (2010) 075003 (16pp)