Spiral Galaxies as Progenitors of Pseudobulge Hosting S0s
Abstract
We present observations of pseudobulges in S0 and spiral galaxies using imaging data taken with the Spitzer Infra-Red Array Camera. We have used 2-d bulge-disk-bar decomposition to determine structural parameters of 185 S0 galaxies and 31 nearby spiral galaxies. Using the Sérsic index and the position on the Kormendy diagram to classify their bulges as either classical or pseudo, we find that 25 S0s (14%) and 24 spirals (77%) host pseudoblges. The fraction of pseudobulges we find in spiral galaxies is consistent with previous results obtained with optical data and show that the evolution of a large fraction of spirals is governed by secular processes rather than by major mergers. We find that the bulge effective radius is correlated with the disk scale length for pseudobulges of S0s and spirals, as expected for secular formation of bulges from disk instabilities, though the disks in S0s are significantly smaller than those in spirals. We show that early-type pseudobulge hosting spirals can transform to pseudobulge hosting S0s by simple gas stripping. However, simple gas stripping mechanism is not sufficient to transform the late-type pseudobulge hosting spirals into pseudobulge hosting S0s.
keywords:
galaxies: spiral and lenticular - fundamental parameters galaxies: photometry - structure - bulges galaxies: formation - evolution1 Introduction
The Hubble tuning fork diagram (Hubble, 1936) provides a snapshot of the variety of morphologies found among galaxies at the present age. Despite decades of research, a number of questions remain unanswered concerning the processes responsible for shaping them. In the last decade, several studies have especially focussed on the central components of the late type galaxies. Originally, these central components, known as bulges, were considered as elliptical galaxies surrounded by a disk (Renzini, 1999) since they exhibited various signs of massive elliptical galaxies, namely an older stellar population largely devoid of dust, a dynamically hot, virialized system with a smooth structure and a close to light profile. But subseqent observations showed that bulges of many late-type galaxies exhibit almost opposite properties - younger populations, rotational support, an exponential light profile and the presence of structures generally found in disk viz. nuclear arms, spirals or bars. These bulges are referred to as pseudobulges in the literature. (See Kormendy & Kennicutt (2004) and references therein.)
These two types of bulges exhibit clear differences with respect to various other properties. For example, Drory & Fisher (2007) find that classical bulges are found exlusively in the red sequence; Carollo et al. (2001) find a difference in the mean optical-near-infrared color. Further, pseudobulges are known to obey a well known correlation between the bulge effective radius and the disk scale length (Courteau et al., 1996) while classical bulges do not or only weakly obey such a correlation (Fisher & Drory, 2008). Pseudobulges, when viewed using high resolution imaging instruments such as those available onboard Hubble Space Telescope, exhibit structures such as spirals, bars or rings. Fisher & Drory (2008) use the presence of sub-structures as a working definition of pseudobulges to show that most pseudobulges have a Sérsic index . Owing to these distinct characteristics of pseudobulges, they are believed to have formed through secular processes within the disk. This interpretation is further supported by the fact that pseudobulges do not follow several correlations otherwise obeyed by elliptical galaxies and classical bulges, between absolute magnitude, Sérsic index, effective radius and average surface brightness (Gadotti, 2009; Fisher & Drory, 2008, 2010). Pseudobulges may or may not have ongoing star formation in them (Fisher & Drory, 2010) but classical bulges in general do not show substantial amount of star formation. All these studies also find that the transition of properties from one bulge type to another is not sharp, possibly indicating the existence of bulges with a mixture of properties.
Various mechanisms have been proposed to explain the formation of pseudobulges. These bulges are believed to have formed through secular processes where presence of a structure breaking the axisymmetry of the disk drives gas infall leading to the enhancement of the central stellar density which appears as a bulge. (Athanassoula, 1992; Noguchi, 1999; Immeli et al., 2004; Debattista et al., 2006; Elmegreen et al., 2009). Studies such as Fisher & Drory (2010) establish that sufficient time may be available for secular evolution to grow bulges in many cases, but there still exist pseudobulges where secular processes alone cannot be responsible for observed bulge mass. To explain such pseudobulges, cosmological simulations by Okamoto (2013) and Guedes et al. (2013) offer an alternate mechanism where the pseudobulges are already present at earlier epochs as inner disks. Keselman & Nusser (2012) also showed that it is possible to form bulges that exhibit the photometric signatures of pseudobulges and that such components can form through major mergers of highly gas rich disk galaxies.
Among the disk galaxies, pseudobulges occur more frequently in late type spirals but recent studies (Vaghmare et al., 2013; Weinzirl et al., 2009; Fisher & Drory, 2008) have pointed out that they can be found in a good fraction of S0s and early type spirals as well. It is worthwhile therefore to study and search for any links between S0 and spiral galaxies hosting pseudobulges.
S0 galaxies are characterised by the presence of a central bulge and disk and the absence of spiral arms. S0 galaxies occupy an important position on Hubble’s tuning fork diagram (Hubble, 1936), where they are placed in between ellipticals and spirals implying that S0 galaxies have properties that are intermediate to these two classes. Barway et al. (2007, 2009) have presented evidence to support the view that the formation history of S0 galaxies can follow two very different routes. Which route is taken appears to depend primarily upon the luminosity of the galaxy, although the environment also plays a role. According to this view, the more luminous S0 galaxies have likely formed their stars at an early epoch through hierarchical clustering wherein they undergo a series of (minor) mergers or rapid collpase followed by star formation, as is believed to be the case with elliptical galaxies (Aguerri et al., 2005). On the other hand faint S0 galaxies have likely formed through secular processes. The faint S0s would have likely originated from spiral galaxies which, in the process of their interaction with dense environments, had their star formation quenched due to stripping of gas. These progenitor spirals could have formed their bulges through secular processes such as the induction of gas inflows and vigorous star formation by bars (Aragón-Salamanca et al., 2006; Bedregal et al., 2006; Barr et al., 2007). In the context of bulge dichotomy, this viewpoint suggests that the more luminous S0 galaxies contain classical bulges while the fainter ones contain pseudobulges (Kormendy & Kennicutt, 2004). Vaghmare et al. (2013) presented the first systematic study of pseudobulges in S0 galaxies with emphasis on signatures of their evolutionary processes on their progenitor disks. They found that pseudobulges in S0 galaxies indeed occur preferentially in the fainter luminosity class. They find that the discs of pseudobulge hosts possess on average a smaller scale length and have a fainter central surface brightness than their counterparts occurring in classical bulge hosting S0 galaxies.
In this paper, we have carried out a mid-infrared study of a large sample of S0 galaxies and compared them with a sample of spiral galaxies to investigate the possible origin of the pseudobulges in S0 galaxies and to search for connections between the two morphological types. Throughout this paper, we use the standard concordance cosmology with , and
2 Sample and Data Analysis
2.1 Description of the Samples
The present study is based on two samples - (i) a sample of 185 S0 galaxies used by Vaghmare et al. (2013) and (ii) a sample of 31 spiral galaxies being studied by the authors as a part of an independent multiwavelength study. These samples are described below.
The sample of S0 galaxies was constructed by Vaghmare et al. (2013) from a parent sample comprising 3657 galaxies classified as S0 (having Hubble stage between -3 and 0) in the RC3 catalogue (de Vaucouleurs et al., 1991). Of these 3657 galaxies, only 1031, those with total apparent -band magnitude were selected and cross-matched with data in the Spitzer Heritage Archive (SHA)111The Spitzer Heritage Archive is maintained by the Spitzer Science Centre and is a public interface to all archival data taken using the three instruments on board the Spitzer Space Telescope.( http://irsa.ipac.caltech.edu/applications/Spitzer/SHA). The authors chose to use the 3.6 imaging data taken using the Infrared Array Camera (IRAC) on board the Spitzer Space Telescope because of three major virtues namely - (i) that the light at this wavelength is relatively free from the effects of extinction due to dust, (ii) it better takes into account the contribution of the low mass stars which due to their presence in large numbers, are a true representation of the stellar mass of a galaxy and (iii) the observations are space-based and thus largely free from the problems that generally plague ground based infrared observations.
We crossmatched the magnitude limited parent sample with the data in the Spitzer Heritage Archive and found data for 247 galaxies. The data come from different observing proposals submitted by different investigators over the lifetime of the Spitzer mission. In most cases, the observations were targeted while in some cases, serendipitious. Not all imaging data for these 247 galaxies were of the desired quality and this study uses results based on a subset of 185 galaxies which has a median redshift of ∼0.005 with a standard deviation of 0.002. The highest redshift in our sample of S0s is 0.06. The study carried out by Vaghmare et al. (2013) using this sample demonstrated that disks of S0s with pseudobulges undergo transformation which the authors attribute to the secular processes responsible for constructing the bulge. In this study, the authors explore an alternate explanation to the lowered disk luminosity and scale length found in the case of S0s with pseudobulges. In this view, the pseudobulge hosting S0s could have been pseudobulge hosting spirals which underwent gas stripping to transform into S0s. To compare one view with the other, a comparison sample of spirals is needed.
As a part of an independent multiwavelength study of late-type galaxies, we had a sample of spiral galaxies which was constructed from the Nearby Galaxy Catalog (Tully & Fisher, 1988). From that we created quasi-volume-limited sample by taking all galaxies within 20Mpc with following filters: (1) close to face-on with inclination less than 35∘, to ensure minimum obscuration by the disk of the target galaxy, (2) Galactic latitude to avoid obscuration and contamination from our own Galaxy, and (3) no known starburst or AGN activity. We also avoided E and S0 galaxies brighter than as well galaxies with types later than Sdm. The final sample consists of 56 galaxies; this sample was used in Ghosh et al. (2008a,b), Ghosh (2009), and Mathur et al. (2010) to look for nuclear AGNs with X-ray observations. Among all these galaxies, imaging data was available for 35 galaxies all comprising of spirals, both early and late-type.
Among the galaxies which formed a part of this independent multiwavelength study of AGNs, there were four S0/a galaxies () which are already a part of the sample of 185 S0 galaxies. We have chosen to treat these galaxies as S0s and thus they have been removed from the sample of spiral galaxies. Thus, our total sample of spiral galaxies has 31 objects.
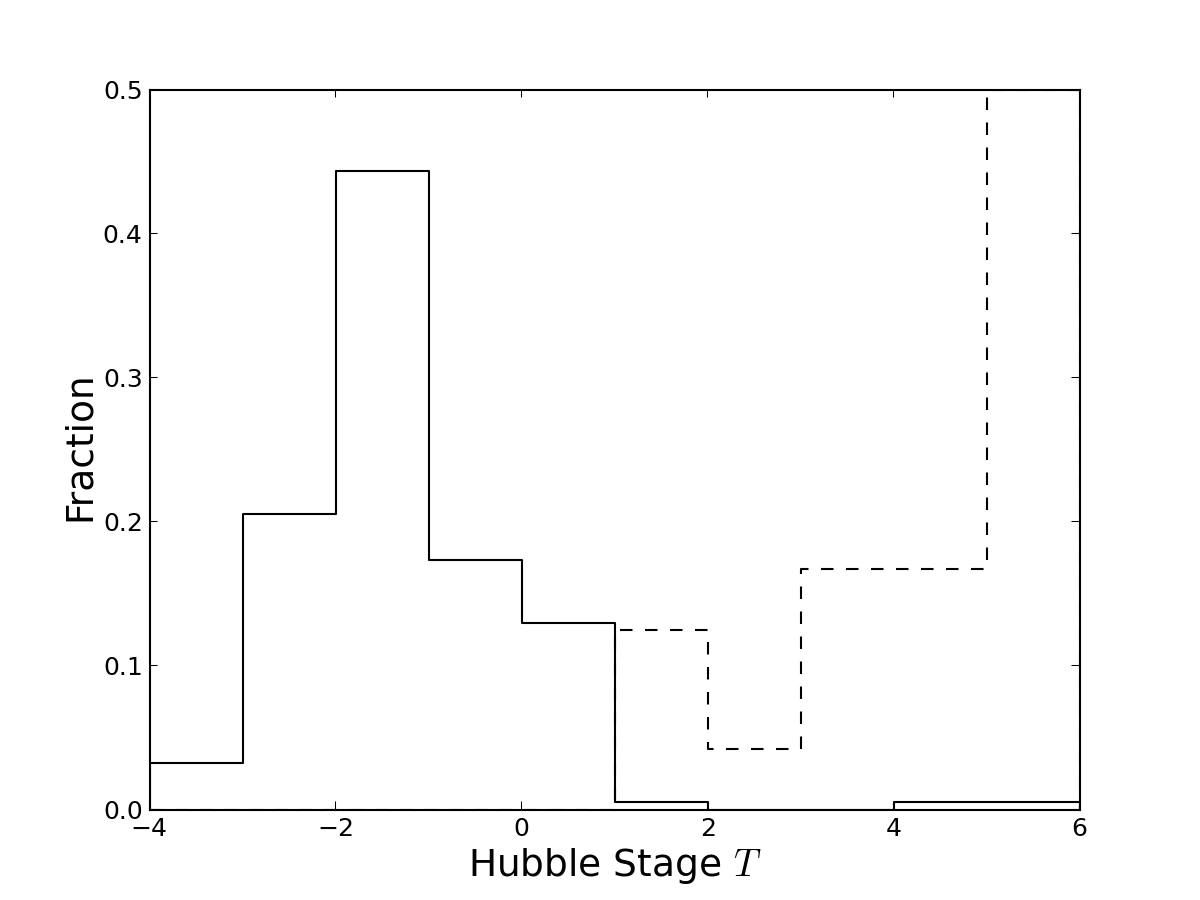
In Figure 1, we plot the distribution of the Hubble stage parameter for both the samples. As can be seen, our sample of 31 spiral galaxies has both early and late-type spiral galaxies i.e. they reasonably cover all the Hubble parameter range. The parameters values used in this figure have been obtained from the Hyperleda database222http://leda.univ-lyon1.fr and thus are not necessarily a reflection of the exact morphologies. However, they are sufficient for the purpose of a statistical comparison as in Figure 1. We have carried out visual inspection of all the galaxies to ensure that our sample of S0s does not contain any galaxies clearly containing spiral structure. The four galaxies found common to parent samples do show a hint of faint spiral structure in the deep Spitzer IRAC imaging data used in this study but we have chosen to treat them as transition objects and keep them in the sample of S0 galaxies as they were a part of the study done by Vaghmare et al. (2013).
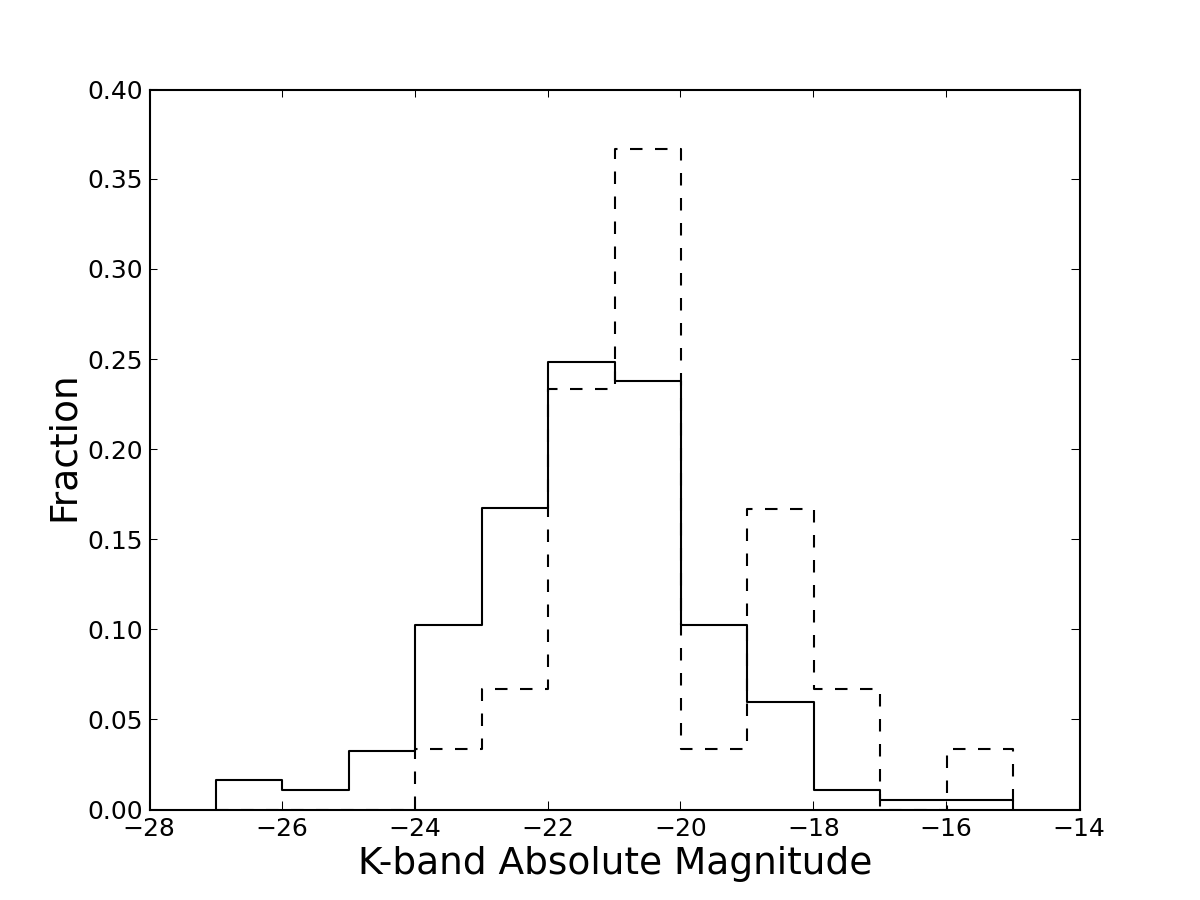
While the sample selection criteria of S0s and the comparison sample of spiral galaxies are different, we found reasonable similarity in the final properties of these samples which motivated us to compare the two. Shown in Figure 2 is the distribution of the -band absolute magnitude for both samples. The data used in plotting this distribution were derived from the 2MASS Extended Source Catalog. The integrated apparent magnitudes were converted into absolute magnitudes using redshift information obtained from the NASA Extragalactic Database (NED)333http://ned.ipac.caltech.edu/. Note that the 2MASS catalog uses the Vega system of magnitudes and thus these were converted to the AB system (Oke & Gunn, 1983) by adding 1.84 to the Vega magnitude as suggested by Muñoz-Mateos et al. (2009). Unless otherwise specified, we will use the AB magnitude system throughout the paper. The distributions indicate that both samples have similar near-IR luminosities and hence stellar mass. Further, as demonstrated in the subsequent sections, the final number of pseudobulges in the two samples are comparable. These properties motivate us to use the described sample of spiral galaxies as a comparison sample. We note that while neither of these samples is complete, they are representative of massive S0s and spirals in the nearby universe.
2.2 Data Analysis Techniques
| Name | Bulge | Bulge parameters | Disk parameters | Bar Parameters | B/T | Bar/T | |||||||
|---|---|---|---|---|---|---|---|---|---|---|---|---|---|
| Type | |||||||||||||
| ESO079-007 | -2.0 | PB | -18.73 | 23.25 | 0.87 | 0.53 | 21.23 | 1.72 | 0.00 | 0.00 | 0.00 | 0.04 | 0.00 |
| ESO085-030 | -0.4 | PB | -18.76 | 20.50 | 0.86 | 1.41 | 20.94 | 0.78 | 0.00 | 0.00 | 0.00 | 0.64 | 0.00 |
| ESO358-025 | -2.6 | PB | -19.04 | 20.42 | 0.73 | 0.74 | 21.72 | 1.59 | 0.00 | 0.00 | 0.00 | 0.41 | 0.00 |
| IC0051 | -2.0 | PB | -19.85 | 19.85 | 1.00 | 1.20 | 20.74 | 1.34 | 0.00 | 0.00 | 0.00 | 0.56 | 0.00 |
| IC2040 | -0.8 | PB | -18.70 | 20.58 | 0.98 | 0.83 | 22.26 | 1.44 | 0.00 | 0.00 | 0.00 | 0.68 | 0.00 |
| IC2085 | -1.2 | PB | -18.48 | 20.37 | 0.53 | 0.88 | 21.79 | 1.24 | 0.00 | 0.00 | 0.00 | 0.41 | 0.00 |
| NGC1510 | -1.8 | PB | -20.24 | 19.18 | 0.24 | 1.18 | 21.41 | 0.82 | 0.00 | 0.00 | 0.00 | 0.40 | 0.00 |
| NGC1522 | -2.3 | PB | -18.33 | 20.63 | 0.36 | 0.44 | 21.83 | 0.81 | 0.00 | 0.00 | 0.00 | 0.37 | 0.00 |
| NGC3413 | -2.0 | PB | -20.10 | 19.96 | 0.23 | 0.70 | 20.80 | 0.54 | 0.00 | 0.00 | 0.00 | 0.29 | 0.00 |
| NGC3773 | -1.7 | PB | -18.70 | 18.87 | 0.22 | 1.06 | 20.71 | 0.79 | 0.00 | 0.00 | 0.00 | 0.29 | 0.00 |
| NGC3870 | 0.6 | PB | -19.43 | 19.44 | 0.29 | 1.31 | 20.94 | 0.53 | 0.00 | 0.00 | 0.00 | 0.54 | 0.00 |
| NGC3990 | -2.1 | PB | -18.13 | 17.29 | 0.12 | 1.38 | 19.13 | 0.34 | 0.00 | 0.00 | 0.00 | 0.41 | 0.00 |
| NGC4336 | -0.6 | PB | -20.50 | 20.64 | 0.45 | 1.74 | 20.48 | 1.09 | 0.00 | 0.00 | 0.00 | 0.13 | 0.00 |
| NGC4460 | -2.0 | PB | -20.10 | 20.32 | 0.39 | 0.75 | 21.03 | 0.91 | 0.00 | 0.00 | 0.00 | 0.26 | 0.00 |
| NGC4544 | -2.0 | PB | -20.26 | 20.98 | 0.91 | 0.49 | 20.57 | 1.04 | 0.00 | 0.00 | 0.00 | 0.34 | 0.00 |
| NGC4880 | -1.9 | PB | -21.70 | 21.36 | 1.72 | 1.94 | 21.31 | 2.78 | 0.00 | 0.00 | 0.00 | 0.27 | 0.00 |
| NGC7371 | -1.6 | PB | -23.06 | 18.46 | 0.55 | 1.52 | 19.73 | 3.00 | 0.00 | 0.00 | 0.00 | 0.10 | 0.00 |
| NGC7709 | -1.9 | PB | -20.92 | 20.65 | 0.72 | 0.41 | 21.03 | 1.70 | 0.00 | 0.00 | 0.00 | 0.20 | 0.00 |
| IC0676 | -1.2 | PB | -20.02 | 20.62 | 1.14 | 1.13 | 20.89 | 1.71 | 14.07 | 0.05 | 0.29 | 0.30 | 0.16 |
| NGC1533 | 0.1 | PB | -18.79 | 16.73 | 0.22 | 0.95 | 19.77 | 1.58 | 12.94 | 0.50 | 0.89 | 0.22 | 0.07 |
| NGC3896 | -2.0 | PB | -21.33 | 21.54 | 0.53 | 0.66 | 22.77 | 1.65 | 16.65 | 0.01 | 0.34 | 0.23 | 0.05 |
| NGC4245 | -2.7 | PB | -20.34 | 17.32 | 0.24 | 1.23 | 20.28 | 1.58 | 12.86 | 0.35 | 1.66 | 0.22 | 0.14 |
| NGC4421 | -1.9 | PB | -21.15 | 17.35 | 0.24 | 1.74 | 20.59 | 3.03 | 13.12 | 0.64 | 1.77 | 0.10 | 0.15 |
| NGC4488 | -1.9 | PB | -19.45 | 19.59 | 0.36 | 1.36 | 24.09 | 5.48 | 12.58 | 0.75 | 2.50 | 0.12 | 0.43 |
| NGC5750 | -2.0 | PB | -21.62 | 17.84 | 0.32 | 0.98 | 19.94 | 2.56 | 13.64 | 0.20 | 2.23 | 0.09 | 0.09 |
Notes: Column 1 - The common name of a galaxy; Column 2 - Hubble stage parameter , Column 3 - Type of Bulge, CB=Classical Bulge and PB = Pseudo-bulge, Column 4 - K-band absolute magnitude (AB system), Column 5 - the average surface brightness of the bulge within its effective radius, in mag per arcsec2, Column 6 - bulge effective radius in kpc, Column 7 - the bulge Sérsic index, Column 8 - disk central brightness in mag per arcsec2, Column 9 - disk scale length in kpc, Column 10 - integrated apparent magnitude of the bar, Column 11 - Sérsic index of bar, Column 12 - Bar effective radius in kpc, Column 13 - Bulge-Total ratio, Column 14 - Bar-Total ratio.
| Name | Bulge | Bulge parameters | Disk parameters | Bar Parameters | B/T | Bar/T | |||||||
|---|---|---|---|---|---|---|---|---|---|---|---|---|---|
| Type | |||||||||||||
| IC5332 | 6.8 | PB | -21.30 | 21.54 | 0.62 | 1.39 | 21.48 | 2.62 | 0.00 | 0.00 | 0.00 | 0.05 | 0.00 |
| NGC1325A | 6.9 | PB | -17.74 | 20.98 | 0.24 | 0.97 | 21.25 | 1.86 | 0.00 | 0.00 | 0.00 | 0.02 | 0.00 |
| NGC3184 | 5.9 | CB | -22.41 | 19.49 | 0.33 | 2.93 | 20.73 | 3.17 | 0.00 | 0.00 | 0.00 | 0.03 | 0.00 |
| NGC3913 | 6.6 | CB | -19.88 | 21.70 | 1.19 | 2.46 | 22.89 | 2.20 | 0.00 | 0.00 | 0.00 | 0.47 | 0.00 |
| NGC3938 | 5.2 | PB | -22.51 | 18.97 | 0.32 | 1.11 | 19.76 | 1.84 | 0.00 | 0.00 | 0.00 | 0.06 | 0.00 |
| NGC4254 | 5.2 | CB | -25.77 | 20.72 | 10.06 | 3.44 | 19.89 | 6.27 | 0.00 | 0.00 | 0.00 | 0.55 | 0.00 |
| NGC4393 | 6.7 | PB | -16.44 | 23.60 | 2.66 | 1.39 | 24.63 | 7.67 | 0.00 | 0.00 | 0.00 | 0.24 | 0.00 |
| NGC4492 | 1.0 | CB | -22.91 | 19.09 | 0.81 | 4.45 | 20.43 | 2.63 | 0.00 | 0.00 | 0.00 | 0.25 | 0.00 |
| NGC4571 | 6.5 | PB | -19.93 | 20.72 | 0.23 | 1.37 | 20.69 | 0.98 | 0.00 | 0.00 | 0.00 | 0.05 | 0.00 |
| NGC4689 | 4.7 | PB | -23.86 | 19.67 | 0.66 | 1.13 | 20.34 | 4.06 | 0.00 | 0.00 | 0.00 | 0.05 | 0.00 |
| NGC5457 | 6.0 | PB | -22.17 | 19.03 | 0.29 | 1.86 | 20.31 | 1.70 | 0.00 | 0.00 | 0.00 | 0.08 | 0.00 |
| NGC628 | 5.2 | PB | -23.02 | 19.27 | 0.50 | 1.20 | 20.17 | 2.92 | 0.00 | 0.00 | 0.00 | 0.06 | 0.00 |
| IC5325 | 4.2 | PB | -23.30 | 20.63 | 3.46 | 0.73 | 20.45 | 1.11 | 15.24 | 1.38 | 0.33 | 0.88 | 0.02 |
| NGC1073 | 5.3 | PB | -22.21 | 21.59 | 0.57 | 0.69 | 21.81 | 5.61 | 13.52 | 1.10 | 2.37 | 0.01 | 0.07 |
| NGC1341 | 1.4 | PB | -22.31 | 21.45 | 1.94 | 0.82 | 19.76 | 1.23 | 13.79 | 0.50 | 0.94 | 0.27 | 0.22 |
| NGC1493 | 6.0 | PB | -22.09 | 19.88 | 0.11 | 1.18 | 20.72 | 2.31 | 14.78 | 0.86 | 1.08 | 0.00 | 0.04 |
| NGC1640 | 3.0 | PB | -22.91 | 17.95 | 0.36 | 1.50 | 20.41 | 2.49 | 13.05 | 0.44 | 2.45 | 0.14 | 0.19 |
| NGC1703 | 3.2 | PB | -22.87 | 18.59 | 0.29 | 0.84 | 20.47 | 2.86 | 14.34 | 0.05 | 2.30 | 0.05 | 0.05 |
| NGC255 | 4.1 | PB | -22.11 | 20.70 | 0.48 | 0.41 | 20.29 | 1.81 | 15.28 | 0.04 | 2.41 | 0.04 | 0.05 |
| NGC3344 | 4.0 | CB | -22.16 | 16.28 | 0.06 | 2.04 | 19.87 | 1.72 | 13.43 | 0.54 | 0.32 | 0.03 | 0.03 |
| NGC3887 | 3.9 | PB | -23.17 | 18.38 | 0.29 | 1.79 | 19.89 | 2.52 | 14.45 | 0.17 | 2.02 | 0.05 | 0.02 |
| NGC4136 | 5.2 | PB | -20.39 | 19.08 | 0.07 | 1.45 | 20.78 | 1.15 | 15.94 | 0.11 | 0.53 | 0.02 | 0.02 |
| NGC4314 | 1.0 | PB | -23.14 | 17.96 | 0.55 | 1.85 | 21.27 | 4.72 | 11.34 | 0.43 | 3.03 | 0.18 | 0.19 |
| NGC4394 | 3.0 | PB | -22.44 | 17.10 | 0.23 | 1.76 | 20.74 | 2.45 | 12.65 | 0.48 | 1.77 | 0.17 | 0.13 |
| NGC4411B | 6.3 | PB | -20.59 | 20.64 | 0.20 | 1.66 | 21.68 | 2.45 | 16.09 | 0.03 | 1.49 | 0.02 | 0.03 |
| NGC4688 | 6.0 | PB | -19.59 | 22.63 | 0.18 | 0.40 | 21.96 | 1.87 | 15.68 | 0.99 | 1.13 | 0.00 | 0.06 |
| NGC5068 | 6.0 | CB | -22.35 | 23.14 | 0.48 | 8.86 | 20.85 | 3.33 | 12.62 | 0.98 | 1.51 | 0.00 | 0.06 |
| NGC685 | 5.4 | PB | -22.27 | 21.55 | 0.70 | 0.86 | 21.33 | 4.49 | 15.06 | 0.04 | 1.87 | 0.02 | 0.02 |
| NGC7552 | 2.4 | CB | -24.28 | 15.10 | 0.31 | 0.34 | 19.91 | 2.98 | 11.46 | 0.31 | 3.84 | 0.38 | 0.22 |
| NGC991 | 5.0 | PB | -20.53 | 21.33 | 0.59 | 0.75 | 21.27 | 2.83 | 16.77 | 0.04 | 2.85 | 0.04 | 0.01 |
| UGC6930 | 6.6 | PB | -19.07 | 22.40 | 0.50 | 0.75 | 21.75 | 1.82 | 15.38 | 0.05 | 1.88 | 0.04 | 0.04 |
Notes: Column 1 - The common name of a galaxy; Column 2 - Hubble stage parameter , Column 3 - Type of Bulge, CB=Classical Bulge and PB = Pseudo-bulge, Column 4 - K-band absolute magnitude (AB system), Column 5 - the average surface brightness of the bulge within its effective radius, in mag per arcsec2, Column 6 - bulge effective radius in kpc, Column 7 - the bulge Sérsic index, Column 8 - disk central brightness in mag per arcsec2, Column 9 - disk scale length in kpc, Column 10 - integrated apparent magnitude of the bar, Column 11 - Sérsic index of bar, Column 12 - Bar effective radius in kpc, Column 13 - Bulge-Total ratio, Column 14 - Bar-Total ratio.
The SHA serves three types of data products - Level 0 or raw, Level 1 also known as Basic Calibrated Data (BCD) and Level 2 aka Post BCD. Typical observations of a galaxy using Spitzer involve multiple dithered exposures which are later coadded to form a mosaic. The individual dithered exposures are referred to as Level 1 data while the mosaic is referred to as Level 2 data. In our initial analysis using Level 2 data, we found certain features which looked clearly artificial, likely to be shortcomings in the way the mosaics were constructed as opposed to being real features. We therefore chose to download the Level 1 data and use the tool MOPEX (MOsaicking and Point source EXtraction) provided by the Spitzer Science Centre to construct the Level 2 images. MOPEX takes into account optical distortions, performs image projection and outlier rejection to produce the final coadded image. We found that the default settings of MOPEX were sufficient for our purposes.
In order to derive the structural parameters of the galaxies, we employed the technique of two-dimensional decomposition of galaxy light using the program GALFIT (Peng et al., 2002). The program GALFIT is versatile in terms of the number and variety of components that can be fitted and uses the fast Marquardt-Levenberg algorithm to minimise the and find the optimal parameters for selected models. GALFIT requires an input image, a configuration file containing a description of the model to be fitted, a mask image and the information of the Point Spread Function (PSF). In order to construct the mask images, we used the modified segmentation images created using SExtractor (Bertin & Arnouts, 1996). The PSF can be determined using a variety of techniques. One can select bright field stars in the field and co-add them or one can use utilities such as those available in the Image Reduction and Analysis Facility (IRAF) to fit a suitable function to the PSF, such as a Moffat profile. However, the Full Width at Half Maximum of the PSF in case of IRAC images is between 1-2 pixels. Thus the use of such techniques is not possible. We therefore used the instrumental PSF provided by the Spitzer Science Centre. As the process of coadding the mosaics leads to a broadening of the PSF, we convolved the instrumental PSF with a Gaussian whose parameters were determined using neighboring bright field stars. The process of finding the suitable Gaussian was done separately for each image.
An initial fit for the surface brightness propfiles of all galaxies was obtained by fitting for their bulge and disk components of the galaxies. The bulge was modelled using the Sérsic profile (Sersic, 1968) given by the following equation,
| (1) | |||||
where and are the distances from the centre of the galaxy along the major and minor axis respectively while represents the ellipticity of the bulge. The parameter is a function of , which can be written as (Capaccioli, 1989). here, is the Sérsic index of the bulge which is also an indicator of the concentration of light, is the effective radius of the bulge which is also known as the half-light radius as it contains half the total integrated light in the bulge. is the central intesnity of the bulge.
The disk was modelled using an exponential function which has scale length () and central intensity () as the main free parameters.
| (2) |
All the parameters including galaxy centre and sky background were left free. In particular, the sky background was independently measured and in a few cases where the best-fit value did not agree with the independent measurement, the fit was rerun with the sky background held fixed to the determined value. In cases where the residual image obtained by subtracting the PSF convolved model image from the observed image revealed a bar, a second run of fitting was performed with an additional Sérsic included to account for the bar. The inclusion of a bar allows the bulge parameters to be free of the systematics introduced by an unaccounted bar as demonstrated in studies by Gadotti (2008) and Laurikainen et al. (2005). The Sérsic profile describing the bar can be identified as that which has a relatively low axis ratio () as well as Sérsic index . ().
A key limitation of the 2-d decomposition technique is that it cannot be meaningfully employed in situations where the morphologies of the galaxies are disturbed as a result of an ongoing merger or a strong tidal encounter. Further, the specific algorithm employed by GALFIT requires a reasonable signal-to-noise ratio (SNR). Thus galaxies whose images had poor SNR, those with disturbed morphology and a few other galaxies for which meaningful solutions could not be found were removed from the final sample. We have a final sample of 185 S0s of which 63 (34%) are barred and 31 spiral galaxies of which 19 (61.2%) are barred. We have not tried modelling the spiral arms as our primary interest is in determination of the bulge and disk parameters.
A note on the reliability of decomposition for galaxies with small angular sizes: Gadotti (2008) have shown that the bulge properties can be recovered reliability if the bulge effective radius is not lesser than 80% of the Half Width at Half Maximum (HWHM) of the PSF. In the case of S0 galaxies, galaxies have a bulge with effective radius between 80% and 100% the HWHM of the PSF while no bulges fall below the 80% mark. For these 15 galaxies, we have carefully inspected the decomposition results and have ensured that parameters derived are reasonable. Further, none of these galaxies are a part of the pseudobulge subset and thus one can safely ignore possible biases being introduced in comparison of pseudobulge properties, due to seeing effects.
In the present paper, our primary focus is on the pseudobulges found in the S0s and spiral galaxies. A detailed discussion on classical bulges in S0 galaxies will be presented in Vaghmare et al. (2015, in preparation). The structural parameters of the pseudobulge hosts in S0 galaxies are provided in Table 1 while those of the 31 spiral galaxies are presented in the Table 2.
3 Classification of Bulges
3.1 A Brief Review of Classification Methods
Pseudobulges can be identified based on the presence of substructures typically found in disks, such as nuclear spiral arms, rings or bars (Carollo et al., 1998). Fisher & Drory (2008) used high resolution imaging data from the Hubble Space Telescope and classified bulges into classical and pseudo, based on the presence of nuclear structure. They found that the bulges exhibit a bimodal distribution of Sérsic (Sersic, 1968) indices with most bulges having being pseudobulges and those having being classical. Several studies thus have used the Sérsic index to classify bulges (Okamoto, 2013; Fisher & Drory, 2010; Vaghmare et al., 2013).
Various other criteria can be used to distinguish between classical and pseudobulges (see Kormendy & Kennicutt (2004) for a detailed review). Some of these criteria are (a) a boxy shaped bulge (detectable in the case of an edge-on galaxy), (b) kinematics dominated by rotation (determined by measuring the ratio of rotational velocity and velocity dispersion i.e. ), (c) deviation from the Faber-Jackson relation towards lower velocity dispersion and (d) a dominant presence of Population 1 stars (but without any sign of a recent merger).
Any criterion leads to practical difficulties when applied to a broad sample. Kinematic information can be obtained only using spectroscopic data and collection of these for large number of objects is expensive. Another method is to detect nuclear structure, but this requires high resolution images taken at very low seeing, as provided by Hubble Space Telescope (Fisher & Drory, 2008). But Fisher & Drory (2008) found, after classifying bulges using such a method that a division line of can be used to classify bulges with those being pseudobulges. However, a key problem in using the Sérsic index alone to classify bulges is that error bars on it can be quite large (Vaghmare et al., 2013; Gadotti, 2008).
An alternate classification scheme proposed by Gadotti (2009) which tries to address the problem associated with using Sérsic index alone is to classify bulges based on their position on the Kormendy diagram (Kormendy, 1977) which is a plot between the logarithm of the effective radius of the bulge and its average surface brightness within the effective radius. It is one of the projections of the fundamental plane (Djorgovski & Davis, 1987; Dressler et al., 1987) of elliptical galaxies and also bulges of early type disk galaxies (Ravikumar et al., 2006). Bulges evolving from disks are not expected to obey the tight correlation found in case of elliptical galaxies. Gadotti (2009) classifies those bulges lying more than below the best-fit line to the elliptical galaxies on this diagram as pseudobulges, where is the root-mean-square scatter in the correlation for ellipticals. Gadotti (2009) does not use the Sérsic index in classifying bulges but demonstrates that it is possible for pseudobulges to exist, as classified by them, with (Gadotti, 2009; Mathur et al., 2012; Orban de Xivry et al., 2011).
3.2 Identifying Bulges in Our Samples
In various studies carried out in literature, any bulge that has evolved through secular processes is regarded as a pseudobulge. As shown by various studies highlighted in the previous subsection, this is equivalent to calling pseudobulges as those that satisfy various observational crtieria discussed in the prior section. More the criteria used for bulge classifcation, the more secure the result will be, so we chose to classify bulges as pseudobulges if they had and were also more than below the best-fit line to ellipticals on the Kormendy diagram. This classification scheme selects fewer pseudobulges but as argued in Vaghmare et al. (2013), is more secure. (Refer to Table 3 for a comparison of pseudobulge statistics obtained using different criteria.) It was not possible to use the presence of nuclear structure or kinematics for bulge classification as the required data for the same were not uniformly available for our samples.
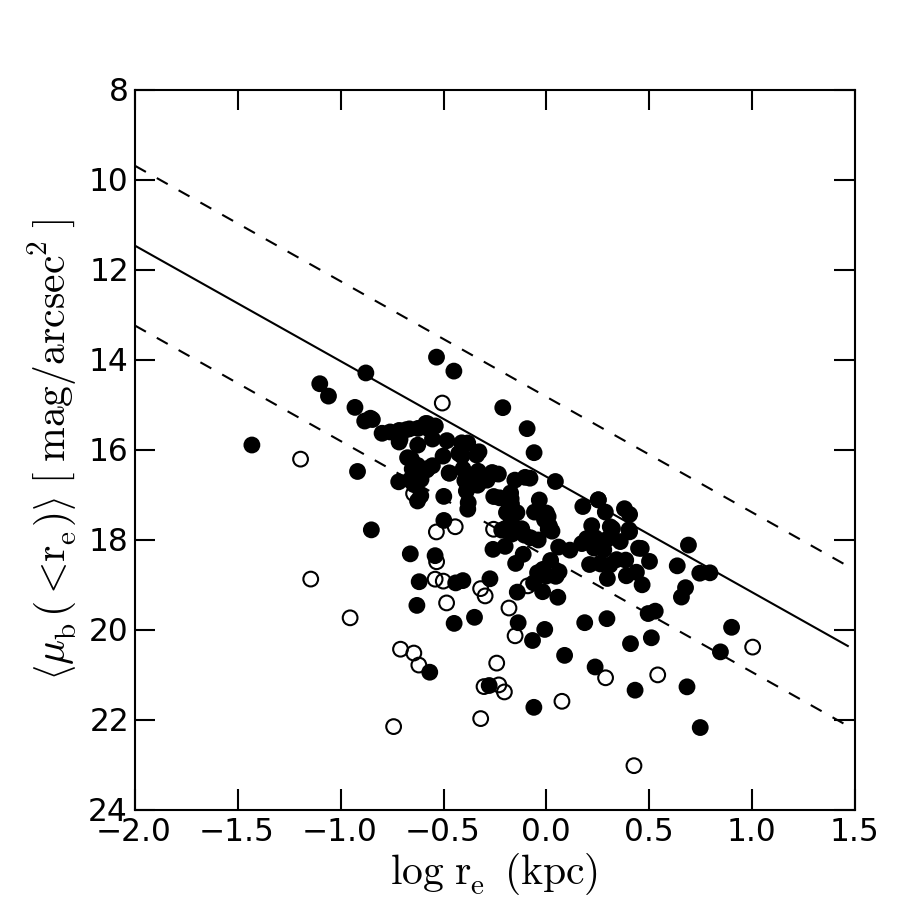
To determine the best-fit line to the ellipticals, we used the decomposition data from a study by Khosroshahi et al. (2000) of Coma cluster ellipticals done in the K-band. The magnitudes reported in this study were first transformed to the 3.6 band of Spitzer IRAC using the relation (Toloba et al., 2012; Falcón-Barroso et al., 2011) and then to the AB magnitude system by adding 1.84 following Muñoz-Mateos et al. (2009). The best-fit line is shown in Figure 3 but for clarity, the points representing elliptical galaxies have been left out. Also shown on this plot are the bulges of S0 galaxies (filled circles) and those of spiral galaxies (empty circles). One notices an offset between bulges of S0s and the best-fit line to the ellipticals, which is consistent with the findings of Barway et al. (2009). The bulges of spiral galaxies exhibit a greater offset, which is consistent with studies such as Ravikumar et al. (2006); Laurikainen et al. (2010).
Among 185 S0 galaxies, 25 are classified as pseudobulge hosts using the above criterion. For the same data set, in Vaghmare et al. (2013) we had reported 27 galaxies as pseudobulge hosts. During the course of further study, we updated the structural parameters and found that two of these were no longer classified as pseudobulges. This change in number of pseudobulges does not affect the essential findings of Vaghmare et al. (2013). In case of spiral galaxies, we find 24 of 31 to be pseudobulges. In Table 3, we summarize the distribution of the bulge types in the two samples as found using various criteria, for comparison. For the remainder of the study, we use the bulge classification based on both Sérsic index and the Kormendy relation to identify bulge type.
| Criterion Used | Bulges | S0’s | Spirals |
|---|---|---|---|
| Kormendy only | Classical | 137 | 2 |
| Pseudo | 48 | 29 | |
| Sérsic only | Classical | 111 | 6 |
| Pseudo | 74 | 29 | |
| Both | Classical | 160 | 7 |
| Pseudo | 25 | 24 |
4 Results
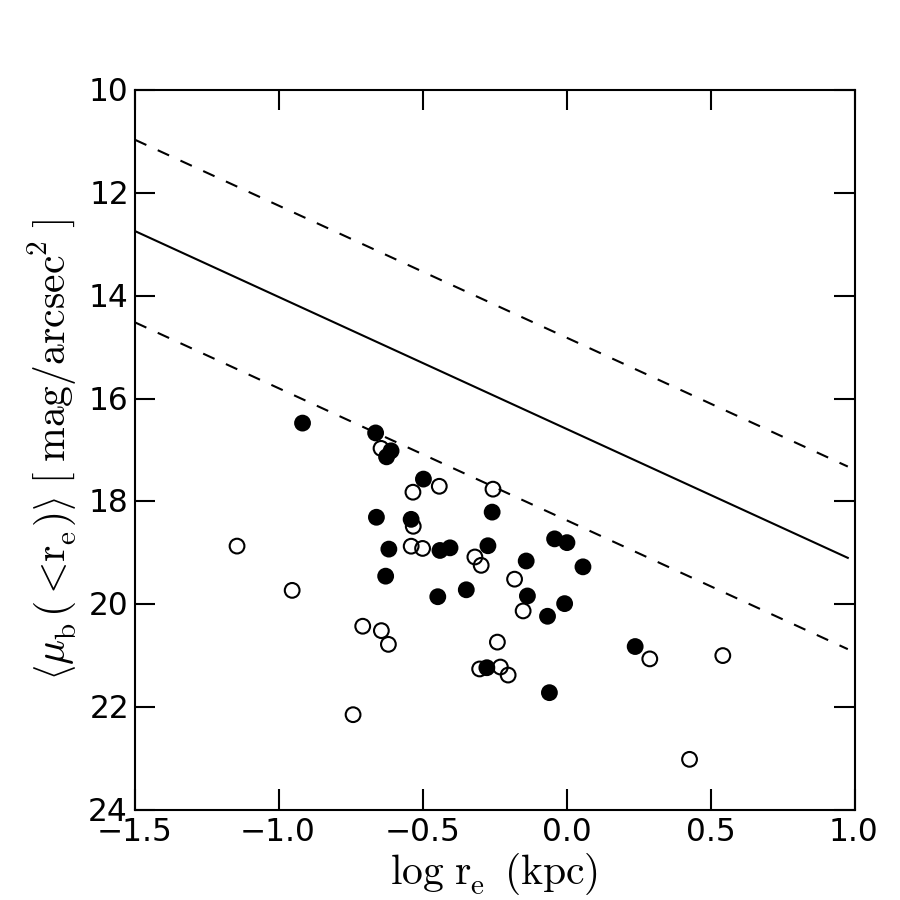
Our primary motivation in this study is to try and systematically compare the pseudobulges in S0s with those in spirals and find clues to the origin of pseudobulges. In Figure 4, we replot the Kormendy diagram showing only the pseudobulges of both samples. This plot reveals an interesting feature. Along the effective radius axis, one does not find any appreciable difference in distribution between the pseudobulges of the two morphological classes. Along the average brightness axis though, one finds that pseudobulges of spiral galaxies tend to be fainter on average. The difference in the mean surface brightness is with a significance of more than 95% as determined using a t-test.
An often discussed correlation in the context of the secular evolution scenario of the galaxy is that between the bulge effective radius and the disk scale length (Courteau et al., 1996). Khosroshahi et al. (2000) have also studied this correlation for different types of disk galaxies. Models or simulations where the bulge forms via a major merger and the disk forms later via gas accretion do not predict a strong correlation between these parameters. However, such a correlation is expected in a scenario where the disks form first and internal processes then build up the bulge by rearranging disk material. Barway et al. (2007) found that bright S0s show a weak anticorrelation while the fainter S0s show a strong positive correlation between and . The authors concluded that fainter S0s likely evolve through secular processes. Vaghmare et al. (2013) also plotted against for all S0s and found that pseudobulge hosts possess a lower scale length than their counterparts hosting classical bulges.
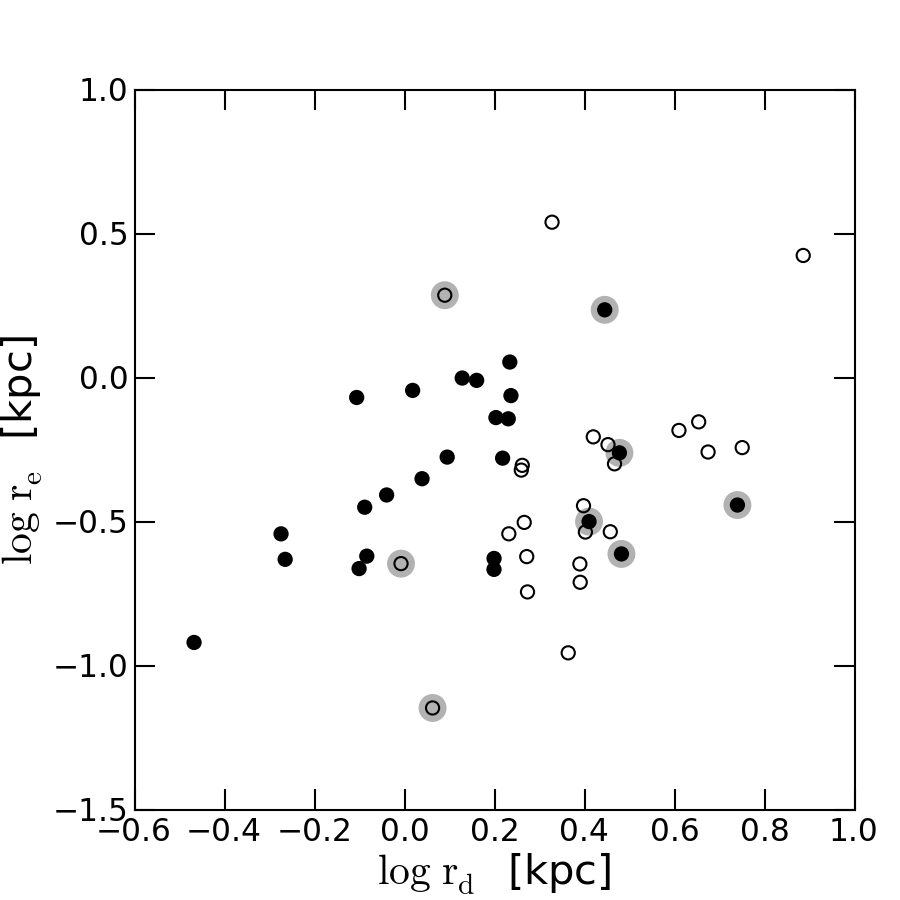
In Figure 5, we have plotted this diagram for the pseudobulges of both our samples. The pseudobulges in both the samples show a correlation albeit with an offset. For a given , one sees that on average the disk scale length in the case of S0s is smaller than in case of the spiral galaxies. The mean disk scale length for S0 galaxies is 1.6 kpc while for spirals it is 2.8 kpc. The significance level of this difference is more than 99.9%.
It is seen that there are outliers on either side i.e. there are S0s which possess a scale length typical of spirals and vice versa. We now comment on these outliers, which for convenience, have been shaded in grey in Figure 5. The same outliers have also been marked in Figures 6 and 7. The five S0 galaxies found “amidst” the spiral galaxies on the diagram are NGC 4488, NGC 4421, NGC 7371, NGC4880 and NGC 5750. Of these NGC 4488 and NGC 4421 are classified as S0/a galaxies with and are known to reside in the Virgo cluster. NGC 7371 and NGC 5750 are also classified as S0/a galaxies, with NGC 5750 known to be a part of a rich group environment while reliable environment information for NGC 7371 is not available. Together, these four objects are the same objects in our sample which were initially found to be common to the sample of S0s and spirals but were chosen to be kept as a part of sample of S0s, as descirbed in Section 2. The other remaining galaxy is NGC 4880 which is classified as . Its SDSS color composite image suggests that this galaxy may have had a spiral structure which is now nearly lost. All these five objects can be thought of as having started as spirals which are now in transition and may eventually acquire the morphology of a typical S0 galaxy.
The three spiral galaxies NGC 1341, NGC 4571 and NGC 4136 lying “amidst” S0s in the diagram, also share an interesting commonality. NGC 1341 is an SAab galaxy residing in the Fornax cluster, NGC 4571 is an SAd galaxy in the Virgo cluster and NGC 4136 is an SAc galaxy, known to be a member of a group. Apart from being in rich environments, these three galaxies are observed to have anaemic spiral arms and have been speculated to be transition objects between S0s and spirals (van den Bergh, 1976; Kormendy & Bender, 2012).
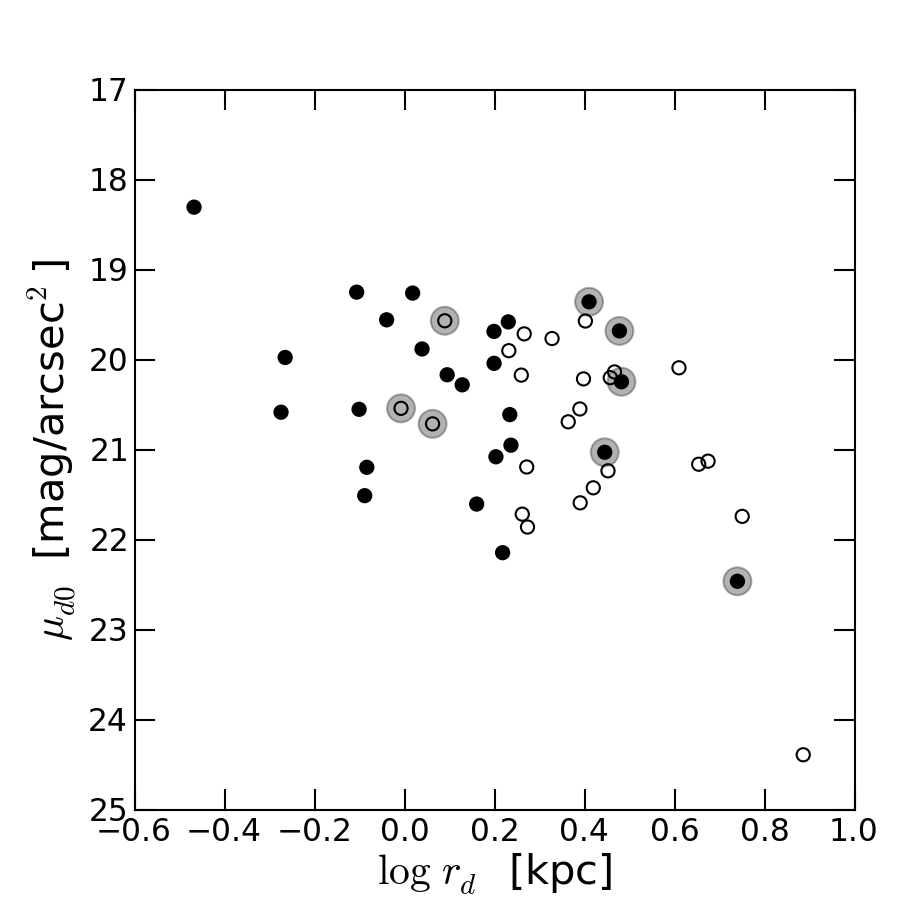
Another correlation of interest is that between the disk central brightness and its scale length, also explored in Vaghmare et al. (2013), who compared the classical bulge hosts with pseudobulge hosts and found that for a given disk scale length, pseudobulge hosts had a lower central surface brightness. In Figure 6 we plot the same diagram for the pseudobulge hosts of the two samples. As was the case with Figure 5, a trend is seen only along the disk scale length axis while no trend is found on the disk central brightness axis. In other words, the disk central brightness is the same on average for disks in both populations. The difference is largely seen in scale lengths.
5 Discussion
We have presented what we believe is the first systematic comparison between S0s and spiral galaxies hosting pseudobulges. In the previous section, we have compared these two populations and found that the disk scale length of S0s is lower on average than that of spirals, for a given bulge effective radius. We further find that there is no significant difference between these two populations with respect to disk central brightness. A difference is seen in average surface brightness within . In this section, we discuss these results and try to explain them in the context of various formation scenarios of both pseudobulges and S0 galaxies.
Before we discuss the results, we consider an important question concerning the robustness of the results. While the samples have a similar K-band luminosity (and hence mass) range and represent well the galaxies in the nearby universe, the sample of S0s has no cut-off on inclination while the sample of spirals does have such a cut-off. One is thus led to question whether this can explain the difference in scale lengths of disks of pseudobulge hosts, which is the major result of the current study. We could not find literature aimed at deriving inclination corrections to scale lengths at 3.6 micron wavelength. So, we used the corrections for K-band used by Laurikainen et al. (2010) which in turn are based on studies by Graham & Worley (2008) and Driver et al. (2008) and have ensured that the differences in scalelengths cannot be explained as projection a effect as the corrections are too small relative to the difference found. The mean correction in the disk scale length is dex and as can be discerned from the Figure 5, is not sufficient enough to account for the observed differences in the disk scale lengths. The differences in corrections for 3.6 micron and K-band (2.2 micron) are expected to be fairly small. We note that the parameters listed in the tables and those used for plotting are not corrected for inclination effects. Even bulge parameters are subject to projection effects, however determing these is difficult. An example of such a study is the one carried out by Pastrav et al. (2013).
5.1 Pseudobulge Fraction in Spiral Galaxies
In the present study, we have used a sample of 31 spiral galaxies and using both the Sérsic index and the position on the Kormendy diagram as classification crtieria, we classify 24 of these as pseudobulge hosts. This fraction (77%) is consistent with that found by Weinzirl et al. (2009), for example, who use optical imaging while we use mid-infrared imaging. Lorenzo et al. (2014) used a sample of 189 isolated galaxies and found that that 94% of the bulges in their sample are pseudobulges. A major reason for such a high fraction is due to their adopted criterion - they classify all bulges with as pseudobulges, while we use a more conservative classifcation scheme. We have discussed in Section 3.1 the possible misclassification of bulges and pseudobulges if the value of is used as the sole criterion. Fisher & Drory (2011) find that classical bulges only account for 12% of the total population of disk galaxies with the rest being pseudobulges or galaxies with very low B/T ratios. This high fraction in turn implies that a large number of spiral galaxies have likely not experienced evolution driven by external influences and that their evolution is largely secular, with possibly some aid provided by minor mergers. As pointed out by studies such as the one by Fisher & Drory (2011), this poses a challenge to the currently accepted paradigm of galaxy formation where most galaxies form through hierarchical clustering, through series of merger events.
5.2 Lowered Scale Length - Role of Gas Stripping
A common explanation invoked to explain the formation of S0 galaxies is that they form as a result of spirals losing their spiral arms due to gas stripping. The density-morphology relation (Dressler, 1980) has often been interpreted as evidence for this. However, Burstein et al. (2005) carefully measured total K-band absolute magnitudes of a sample containing both S0s and spirals (both early- and late-type) and found that S0s are more but not less luminous than spirals. This, according to the authors, rules out gas stripping as a viable mechanism as a difference of magnitudes, with S0s being fainter, is expected. We computed the difference in the mean total magnitude for two populations of pseudobulge hosts and found that pseudobulge hosting S0s are indeed brighter by magnitudes. But if we divide our pseudobulge hosting spirals into early-type (, 12 galaxies) and late-type(, 19 galaxies), we find that pseudobulge hosting S0s are fainter by magnitude than pseudobulge hosting early-type spirals while brighter by magnitude than pseudobulge hosting late-type spirals. Thus pseudobulge hosting early-type spirals transforming to pseudobulge hosting S0s via gas stripping cannot be ruled out based on the arguments of Burstein et al. (2005). (A caveat in this calculation is of course the overall low number of objects involved.)
Thus we see that we should not treat spiral galaxies as a single population; early-type and late-type spirals have different properties and the PB hosting early type spirals may in fact transform into PB hosting S0s via gas stripping. It is also the case that we should not treat all the S0s as a single population; they have different properties depending on luminosities as shown by Barway et al. (2007, 2009) and on the bulge-type found in them, as shown by Vaghmare et al. (2013).
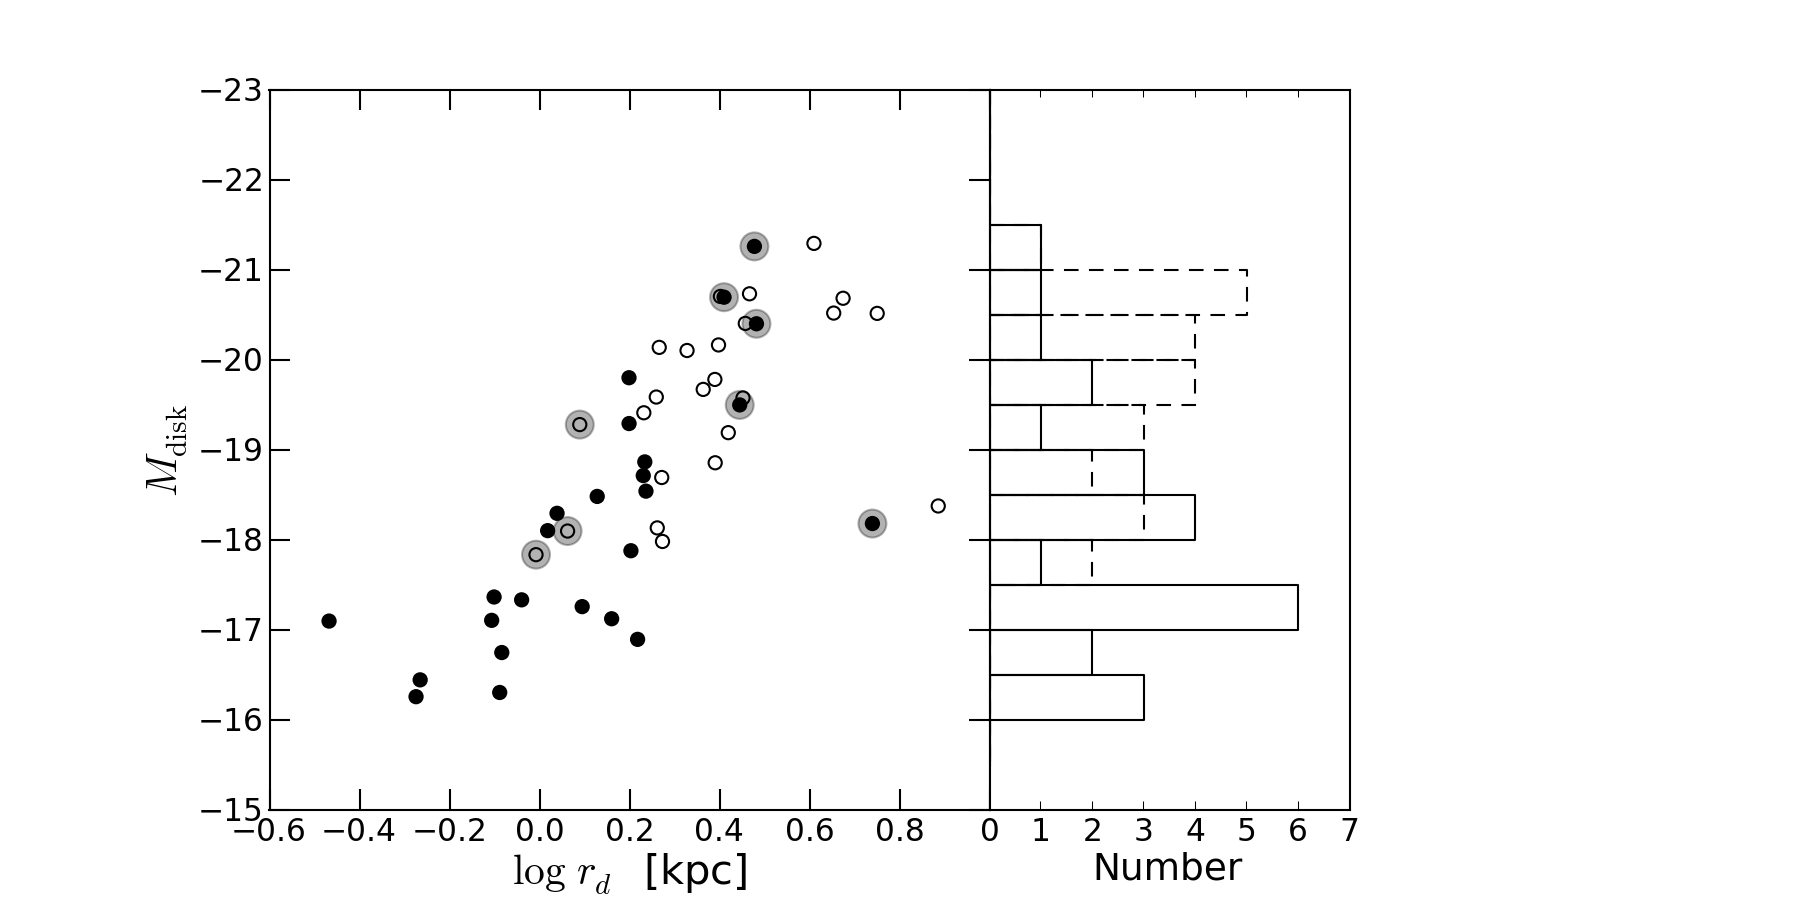
The disk scale length is a free parameter of an exponential function which is used for describing the light distribution in a disk. The total flux received from a disk with central surface brightness and a disk scale length is given by , where is the central intensity of the disk corresponding to . Thus a lowered scale length as in the case of S0s would imply a lowered disk luminosity if remains the same. This relation between disk luminosity and scale length can be checked easily using Figure 7, which shows a plot of the disk absolute magnitude against disk scale length. Unlike previous plots involving disk scale length where trends were found only along the disk scale length axis, this plot shows trends along the disk absolute magnitude as well. Disks of pseudobulge hosting S0s tend to be less luminous than the disks in pseudobulge hosting spirals. The mean disk absolute magnitudes for pseudobulge hosting S0s and pseudobulge hosting spirals are and respectively. This difference of mangitudes is significant at a level better than 99.9%. This is expected in a scenario where S0s have spirals as their progenitors which undergo gas stripping to acquire a morphology resembling S0s.
We have shown that early-type pseudobulge hosting spirals cannot be ruled out as progenitors of pseudobulge hosting S0s in the gas stripping scenario. We have also compared disk absolute magnitudes to lend further support. Let us now consider the bulge absolute magnitudes to try and answer the question whether gas stripping alone is sufficient enough to bring about the transformation from early-type pseudobulge hosting spirals to S0s. If gas stripping is the only process at work, then one should not, for example, notice an increase in bulge luminosity. The mean bulge absolute magnitudes for pseudobulge hosts in S0s and spirals are respectively -17.16 and -16.45. If we treat the spirals separately as early- and late-type, the mean values are -18.19 and -15.41 respectively. So, pseudobulges of S0s are fainter than those of early-type spirals but brighter than those of late-type spirals.
If early-type spirals hosting pseudobulges undergo gas stripping, subsequent growth in the pseudobulge is also hindered - the lower luminosity of pseudobulges in S0s compared to those in early-type, is consistent with this. So, no additional process seems to be necessary to bring about this transformation. In the case of pseudobulge hosting late-type spirals though, this is not the case i.e. the S0 pseudobulges are more luminous. It is thus not possible for gas stripping alone to transform pseudobulge hosting late-type spirals into S0s unless an external process, such as a minor merger or an accretion of a nearby dwarf builds up the bulge luminosity. In general, it seems more viable for early-type pseudobulge hosting spirals to be the progenitors of pseudobulge hosting S0s.
5.3 Dynamical Formation Scenarios
By dynamical formation scenarios, we refer to any mechanisms for forming pseudobulge hosting galaxies which are other than (a) internal secular evolution and (b) evolution caused due to environmental effects such as gas stripping. One such formation scenario, as described in Guedes et al. (2013) and Okamoto (2013), is that pseudobulges formed as inner disks at through a series of star bursts and evolved to their present day forms. However, it is difficult to verify whether such a formation mechanism is viable for pseudobulges in our sample mainly because there are no specific signatures predicted by these simulations. If any such simulations predict, say, a low disk luminosity, one may be able to comment on whether pseudobulges have formed in this manner.
Another possible dynamical evolution scenario is that a pseudobulge of lower than typical observed mass forms via secular processes and its eventual bulge growth is caused through minor mergers, as demonstrated in Eliche-Moral et al. (2012), who suggest that dry minor mergers can cause growth in the overall pseudobulge mass without really affecting scaling relations such as the correlation, provided such a correlation already exists. This opens the possibility for late type spirals to evolve into S0s too but that will still require some process to enable the removal of the spiral arms.
6 Summary
We have presented a comparison of pseudobulges in S0 and spiral galaxies using structural parameters derived from 2-d decomposition of mid-infrared images taken at 3.6m by Spitzer IRAC. We find that among spiral galaxies, 77% of the bulges are classified as pseudobulges. As pointed out by various studies, the presence of such a large fraction poses problems to our current picture of galaxy formation. However, our primary result is that the disk scale length of pseudobulge hosting S0s is significantly smaller on average than that of their spiral counterparts. This can be explained as a lowered disk luminosity which in turn implies that S0s have evolved from spiral progenitors. We also argue that early type spirals are more likely to be the progenitors based on total luminosity arguments. We speculate that if late type spirals hosting pseudobulges have to evolve into S0s, a mechanism other than gas stripping of spirals is needed.
We have also investigated the effect of environment on pseudobulges in the two samples. But we did not find any significant trends in the properties of the pseudobulges as a function of the various structural parameters. The study is made more difficult because of the low number statistics one deals with when the sample is sub-divided based on whether it is in a field or group/cluster environment. We are currently in the process of planning a study to investigate pseudobulge hosting properties as a function of the environment using a sample containing pseudobulges occuring in a variety of environments.
ACKNOWLEDGEMENTS
We would like to thank the anonymous referee whose comments helped improve the content and presentation of the manuscript. KV acknowledges Council of Scientific and Industrial Research (CSIR), India for financial support. SB would like to acknowledge a bilateral grant under the Indo-South Africa Science and Technology Cooperation (UID-76354) funded by Departments of Science and Technology (DST) of the Indian and South African Governments. This paper is based upon work supported financially by the National Research Foundation (NRF), South Africa. Any opinions, findings and conclusions or recommendations expressed in this paper are those of the authors and therefore the NRF does not accept any liability in regard thereto. SM acknowledges hospitality at IUCAA during her visit, where initial plans of this project were made. We thank Yogesh Wadadekar and Kanak Saha for discussions.
This work is based in part on observations made with the Spitzer Space Telescope, which is operated by the Jet Propulsion Laboratory, California Institute of Technology under a contract with NASA. This research has made use of the NASA/IPAC Extragalactic Database (NED) which is operated by the Jet Propulsion Laboratory, California Institute of Technology, under contract with the National Aeronautics and Space Administration. We acknowledge the usage of the HyperLeda database (http://leda.univ-lyon1.fr). The research also makes extensive use of iPython, an interactive Python based scientific computing environment (Pérez & Granger, 2007) and Astropy, a community-developed core Python package for Astronomy Astropy Collaboration et al. (2013).
References
- Aguerri et al. (2005) Aguerri J. A. L., Iglesias-Páramo J., Vílchez J. M., Muñoz-Tuñón C., Sánchez-Janssen R., 2005, AJ, 130, 475
- Aragón-Salamanca et al. (2006) Aragón-Salamanca A., Bedregal A. G., Merrifield M. R., 2006, A&A, 458, 101
- Astropy Collaboration et al. (2013) Astropy Collaboration, Robitaille T. P., Tollerud E. J., Greenfield P., Droettboom M., Bray E., Aldcroft T., Davis M., Ginsburg A., Price-Whelan A. M., Kerzendorf W. E., Conley A., Crighton N., Barbary K., Muna D., Ferguson H., Grollier F., Parikh M. M., Nair P. H., Unther H. M., Deil C., Woillez J., Conseil S., Kramer R., Turner J. E. H., Singer L., Fox R., Weaver B. A., Zabalza V., Edwards Z. I., Azalee Bostroem K., Burke D. J., Casey A. R., Crawford S. M., Dencheva N., Ely J., Jenness T., Labrie K., Lim P. L., Pierfederici F., Pontzen A., Ptak A., Refsdal B., Servillat M., Streicher O., 2013, A&A, 558, A33
- Athanassoula (1992) Athanassoula E., 1992, MNRAS, 259, 345
- Barr et al. (2007) Barr J. M., Bedregal A. G., Aragón-Salamanca A., Merrifield M. R., Bamford S. P., 2007, A&A, 470, 173
- Barway et al. (2007) Barway S., Kembhavi A., Wadadekar Y., Ravikumar C. D., Mayya Y. D., 2007, ApJ, 661, L37
- Barway et al. (2009) Barway S., Wadadekar Y., Kembhavi A. K., Mayya Y. D., 2009, MNRAS, 394, 1991
- Bedregal et al. (2006) Bedregal A. G., Aragón-Salamanca A., Merrifield M. R., 2006, MNRAS, 373, 1125
- Bertin & Arnouts (1996) Bertin E., Arnouts S., 1996, A&AS, 117, 393
- Burstein et al. (2005) Burstein D., Ho L. C., Huchra J. P., Macri L. M., 2005, ApJ, 621, 246
- Capaccioli (1989) Capaccioli M., 1989, in World of Galaxies (Le Monde des Galaxies), Corwin Jr. H. G., Bottinelli L., eds., pp. 208–227
- Carollo et al. (2001) Carollo C. M., Stiavelli M., de Zeeuw P. T., Seigar M., Dejonghe H., 2001, ApJ, 546, 216
- Carollo et al. (1998) Carollo C. M., Stiavelli M., Mack J., 1998, AJ, 116, 68
- Courteau et al. (1996) Courteau S., de Jong R. S., Broeils A. H., 1996, ApJ, 457, L73
- de Vaucouleurs et al. (1991) de Vaucouleurs G., de Vaucouleurs A., Corwin Jr. H. G., Buta R. J., Paturel G., Fouqué P., 1991, Third Reference Catalogue of Bright Galaxies. Volume I: Explanations and references. Volume II: Data for galaxies between 0h and 12h. Volume III: Data for galaxies between 12h and 24h.
- Debattista et al. (2006) Debattista V. P., Mayer L., Carollo C. M., Moore B., Wadsley J., Quinn T., 2006, ApJ, 645, 209
- Djorgovski & Davis (1987) Djorgovski S., Davis M., 1987, ApJ, 313, 59
- Dressler (1980) Dressler A., 1980, ApJ, 236, 351
- Dressler et al. (1987) Dressler A., Lynden-Bell D., Burstein D., Davies R. L., Faber S. M., Terlevich R., Wegner G., 1987, Astrophysical Journal, 313, 42
- Driver et al. (2008) Driver S. P., Popescu C. C., Tuffs R. J., Graham A. W., Liske J., Baldry I., 2008, ApJ, 678, L101
- Drory & Fisher (2007) Drory N., Fisher D. B., 2007, ApJ, 664, 640
- Eliche-Moral et al. (2012) Eliche-Moral M. C., González-García A. C., Aguerri J. A. L., Gallego J., Zamorano J., Balcells M., Prieto M., 2012, A&A, 547, A48
- Elmegreen et al. (2009) Elmegreen B. G., Elmegreen D. M., Fernandez M. X., Lemonias J. J., 2009, ApJ, 692, 12
- Falcón-Barroso et al. (2011) Falcón-Barroso J., van de Ven G., Peletier R. F., Bureau M., Jeong H., Bacon R., Cappellari M., Davies R. L., de Zeeuw P. T., Emsellem E., Krajnović D., Kuntschner H., McDermid R. M., Sarzi M., Shapiro K. L., van den Bosch R. C. E., van der Wolk G., Weijmans A., Yi S., 2011, MNRAS, 417, 1787
- Fisher & Drory (2008) Fisher D. B., Drory N., 2008, AJ, 136, 773
- Fisher & Drory (2010) —, 2010, ApJ, 716, 942
- Fisher & Drory (2011) —, 2011, ApJ, 733, L47
- Gadotti (2008) Gadotti D. A., 2008, MNRAS, 384, 420
- Gadotti (2009) —, 2009, MNRAS, 393, 1531
- Graham & Worley (2008) Graham A. W., Worley C. C., 2008, MNRAS, 388, 1708
- Guedes et al. (2013) Guedes J., Mayer L., Carollo M., Madau P., 2013, ApJ, 772, 36
- Hubble (1936) Hubble E. P., 1936, Realm of the Nebulae
- Immeli et al. (2004) Immeli A., Samland M., Gerhard O., Westera P., 2004, A&A, 413, 547
- Keselman & Nusser (2012) Keselman J. A., Nusser A., 2012, MNRAS, 424, 1232
- Khosroshahi et al. (2000) Khosroshahi H. G., Wadadekar Y., Kembhavi A., 2000, ApJ, 533, 162
- Kormendy (1977) Kormendy J., 1977, ApJ, 218, 333
- Kormendy & Bender (2012) Kormendy J., Bender R., 2012, ApJS, 198, 2
- Kormendy & Kennicutt (2004) Kormendy J., Kennicutt Jr. R. C., 2004, Ann. Rev. Astron. Astrophys. , 42, 603
- Laurikainen et al. (2005) Laurikainen E., Salo H., Buta R., 2005, MNRAS, 362, 1319
- Laurikainen et al. (2010) Laurikainen E., Salo H., Buta R., Knapen J. H., Comerón S., 2010, MNRAS, 405, 1089
- Lorenzo et al. (2014) Lorenzo M. F., Sulentic J., Verdes-Montenegro L., Blasco-Herrera J., Argudo-Fernández M., Garrido J., Ramírez-Moreta P., Ruiz J. E., Sánchez-Expósito S., Santander-Vela J. D., 2014, The Astrophysical Journal Letters, 788, L39
- Mathur et al. (2012) Mathur S., Fields D., Peterson B. M., Grupe D., 2012, ApJ, 754, 146
- Muñoz-Mateos et al. (2009) Muñoz-Mateos J. C., Gil de Paz A., Zamorano J., Boissier S., Dale D. A., Pérez-González P. G., Gallego J., Madore B. F., Bendo G., Boselli A., Buat V., Calzetti D., Moustakas J., Kennicutt Jr. R. C., 2009, ApJ, 703, 1569
- Noguchi (1999) Noguchi M., 1999, ApJ, 514, 77
- Okamoto (2013) Okamoto T., 2013, MNRAS, 428, 718
- Oke & Gunn (1983) Oke J. B., Gunn J. E., 1983, ApJ, 266, 713
- Orban de Xivry et al. (2011) Orban de Xivry G., Davies R., Schartmann M., Komossa S., Marconi A., Hicks E., Engel H., Tacconi L., 2011, MNRAS, 417, 2721
- Pastrav et al. (2013) Pastrav B. A., Popescu C. C., Tuffs R. J., Sansom A. E., 2013, A&A, 557, A137
- Peng et al. (2002) Peng C. Y., Ho L. C., Impey C. D., Rix H.-W., 2002, AJ, 124, 266
- Pérez & Granger (2007) Pérez F., Granger B. E., 2007, Computing in Science and Engineering, 9, 21
- Ravikumar et al. (2006) Ravikumar C. D., Barway S., Kembhavi A., Mobasher B., Kuriakose V. C., 2006, A&A, 446, 827
- Renzini (1999) Renzini A., 1999, in The Formation of Galactic Bulges, Carollo C. M., Ferguson H. C., Wyse R. F. G., eds., p. 9
- Sersic (1968) Sersic J. L., 1968, Atlas de galaxias australes
- Toloba et al. (2012) Toloba E., Boselli A., Peletier R. F., Falcón-Barroso J., van de Ven G., Gorgas J., 2012, A&A, 548, A78
- Tully & Fisher (1988) Tully R. B., Fisher J. R., 1988, Catalog of Nearby Galaxies
- Vaghmare et al. (2013) Vaghmare K., Barway S., Kembhavi A., 2013, ApJ, 767, L33
- van den Bergh (1976) van den Bergh S., 1976, ApJ, 206, 883
- Weinzirl et al. (2009) Weinzirl T., Jogee S., Khochfar S., Burkert A., Kormendy J., 2009, ApJ, 696, 411