A new era of sub-millimeter GRB afterglow follow-ups with the Greenland Telescope
Abstract
A planned rapid submillimeter (submm) Gamma Ray Burst (GRBs) follow-up observations conducted using the Greenland Telescope (GLT) is presented. The GLT is a 12-m submm telescope to be located at the top of the Greenland ice sheet, where the high-altitude and dry weather porvides excellent conditions for observations at submm wavelengths. With its combination of wavelength window and rapid responding system, the GLT will explore new insights on GRBs. Summarizing the current achievements of submm GRB follow-ups, we identify the following three scientific goals regarding GRBs: (1) systematic detection of bright submm emissions originating from reverse shock (RS) in the early afterglow phase, (2) characterization of forward shock and RS emissions by capturing their peak flux and frequencies and performing continuous monitoring, and (3) detections of GRBs as a result of the explosion of first-generation stars result of GRBs at a high redshift through systematic rapid follow ups. The light curves and spectra calculated by available theoretical models clearly show that the GLT could play a crucial role in these studies.
Subject headings:
gamma-ray burst: general1. Introduction
Gamma-ray Bursts (GRBs) are among the most powerful explosions in the universe and are observationally characterized according to intense short flashes mainly in high-energy band (so-called “prompt emission”), and long-lasting afterglows observed in X-ray to radio bands. Both types of radiation are sometimes extremely bright and can be observed using small- and middle-aperture optical and near-infrared telescopes (e.g., Tanvir et al., 2009; Bloom et al., 2009). Because of their intense luminosity, the highest-redshift() in the reionization epoch () have been observed and have a high possibility for discovery even at (Bloom et al., 2009). Although there are various diversities (long/short duration of prompt -ray radiation, X-ray flares associated with X-ray afterglows, and complex temporal evolutions of afterglows), optical afterglow and host galaxy observations indicate that the majority of long-duration GRBs occur as a result of the death of massive stars (e.g., Stanek et al., 2003). Thus GRBs are unique and powerful means of observing explosions first generation stars (population III, POP-III). Understanding the diversity of the astrophysical entities that cause GRBs is the subject of ongoing study and represents one of the most prominent inquiries in modern astrophysics.
Using GRBs to investigate the high- universe requires an understanding of their radiation mechanisms. Confirming the existence of reverse shocks (RS) and ascertaining their typical occurrence conditions are critical. The GRB afterglow is believed to involve a relativistically expanding fireball (e.g., Meszaros & Rees, 1997). The Interstellar Medium (ISM) influences the fireball shell after it has accumulated, and considerable energy is transferred from the shell to the ISM. The energy transfer is caused by two shocks: a forward shock (FS) propagating into the ISM, and an RS propagating into the shell. Millimeter/Submillimeter (mm/submm) observations are the key element in understanding the emission mechanism of GRB afterglows. They provide “clean” measurements of source intensity and are unaffected by scintillation and extinction. Hence, studies on submm properties of the afterglow are likely to enrich the understanding of GRB physics.
In this paper, we review the status and achievements of submm afterglow observations in §2. In §3, we introduce the Greenland Telescope (GLT) project and its advantages for GRB follow-up observations. We also expect the GRB follow-ups in the era of GLT in §4. On the basis of these advantages, we establish three science goals by introducing expected light curves and spectra with the expected sensitivity limit of GLT in §5. Finally, we summarize this paper in §6.
2. Status and Achievements of Sub-millimeter Afterglow Follow-Ups
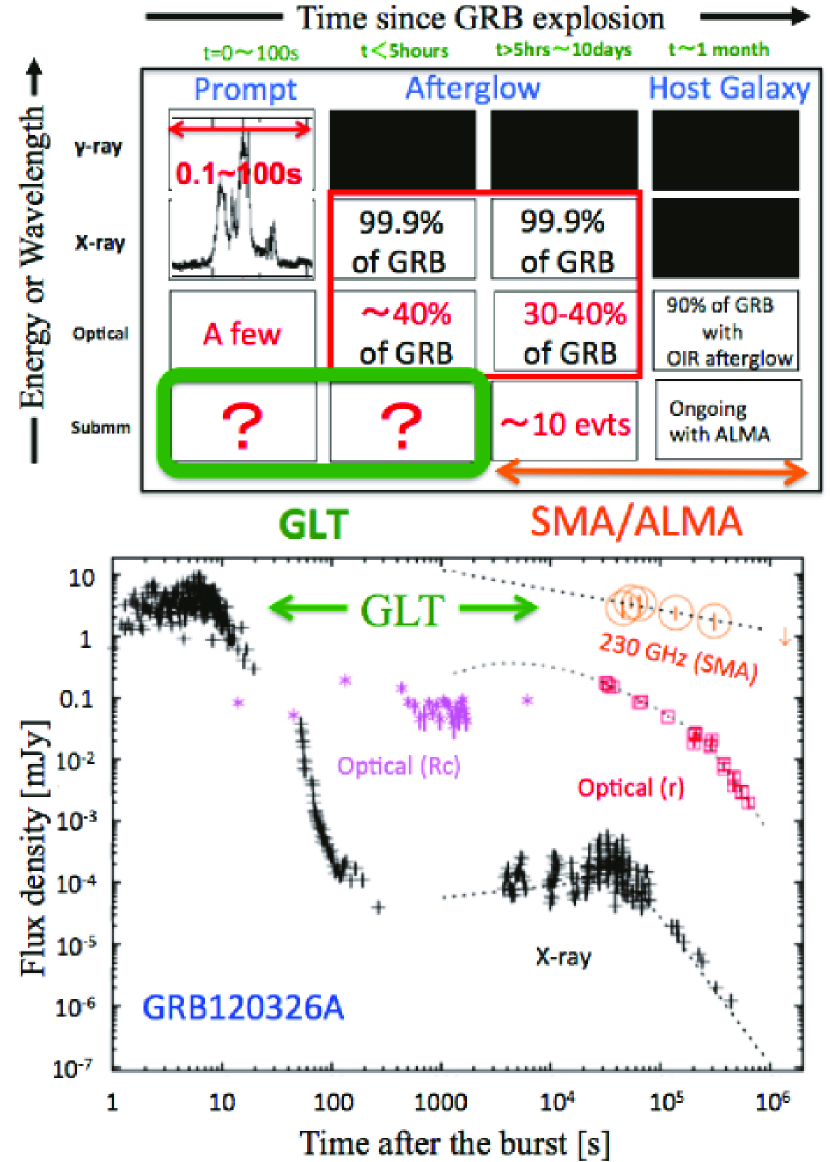
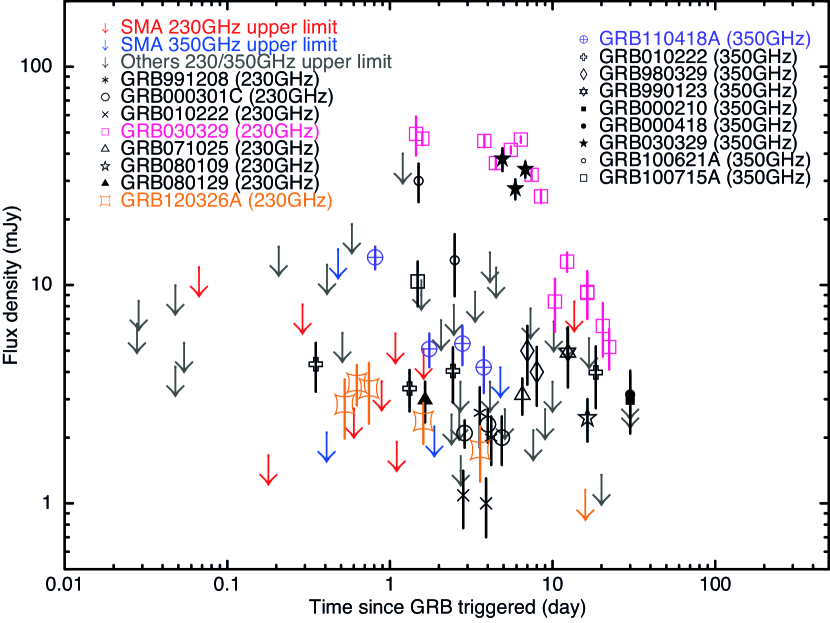
Numbers of dedeicated follow-up instruments of GRBs and afterglows have been developed in -ray, X-ray (Gehrels et al., 2004), optical, and near-infrared (e.g. Steele, 2001; Akerlof et al., 2003; Vestrand et al., 2002; Burd et al., 2005; Klotz et al., 2009; Ferrero et al., 2010; Urata et al., 2011). Afterglow observations in X-ray and optical have been adequately covered from very early phase including some fractions of -ray prompt phase (e.g. Akerlof et al., 1999; Vestrand et al., 2005, 2006; Racusin et al., 2008). In addition, more than 300 afterglow observations have been made at the cm wavelengths mainly using the Very Large Array (e.g. Chandra & Frail, 2012). However, submm has lagged behind X-ray and optical. Fig. 1 shows a schematic summary of achievements in GRB observations according to wavelength and time range. It is obvious that prompt afterglow observations are lacking at submm wavelengths. The numbers of submm-detected events have been limited as summarized in Fig. 1 and 2. Fig. 2 shows all of afterglow observations in submm bands (230 and 345 GHz) including upper limits. There have been only seven detections and three well-monitored events (GRB030329, GRB100418A and GRB120326A) in the submm bands. Unlike X-ray and optical observations, afterglow monitoring in the submm band covers only the late phase of GRBs and misses their brightening phases. However, several of these observations, in conjunction with intensive X-ray and optical monitoring, as in the GRB 120326A case (Urata et al., 2014), have addressed crucial physical properties of afterglow. Hence, submm afterglow observations are crucial for understanding the nature of GRBs. In the following, we briefly summarize three well-monitored submm afterglow cases.
GRB030329: Because of the low redshift () origin and bright optical afterglow ( mag at 0.1 days), numerous follow-up observations were conducted at various wavelengths (e.g. Stanek et al., 2003; Smith et al., 2003; Tiengo et al., 2003; Klose et al., 2004; Kosugi et al., 2004; Urata et al., 2004; Tiengo et al., 2004; Kuno et al., 2004; Šimon et al., 2004; Frail et al., 2005; Kohno et al., 2005; Smith et al., 2005; Gorosabel et al., 2005; van der Horst et al., 2008). The 250-GHz monitoring follow ups were performed by the MAMBO-2 bolometer array on the IRAM 30-m telescope (Sheth et al., 2003) and the IRAM Plateau de Bure Interferometer (PdBI) (Resmi et al., 2005). The monitoring observation were conducted from 1.4 to 22.3 days after the burst. The light curve after 8 days exhibited a simple power-law decay with a decay index of (Sheth et al., 2003). The value was consistent with that determined for the optical decay after 0.5 days and incidated a common physical effect (Price et al., 2003). These monitoring observations supported the two-component jet model, in which a narrow-angle jet is responsible for the high-energy emission and early optical afterglow; the radio afterglow emission is powered by the wide-angle jet (Berger et al., 2003; Sheth et al., 2003).
GRB100418A: The Sub-millimeter Array (SMA; Ho et al., 2004) was used to observe the submm afterglow from 16 hrs after the burst. Continuous monitoring proceeded until 5 days after the burst, at which point it became undetectable (de Ugarte Postigo et al., 2012). As shown in Fig. 2, the submm light curve exhibited a significant fading (equivalent decay power-law index of ) between 1 and 2 days and then exhibited a plateau phase until 4 days. The X-ray and optical light curves showed a late bump peak at s (Marshall et al., 2011).
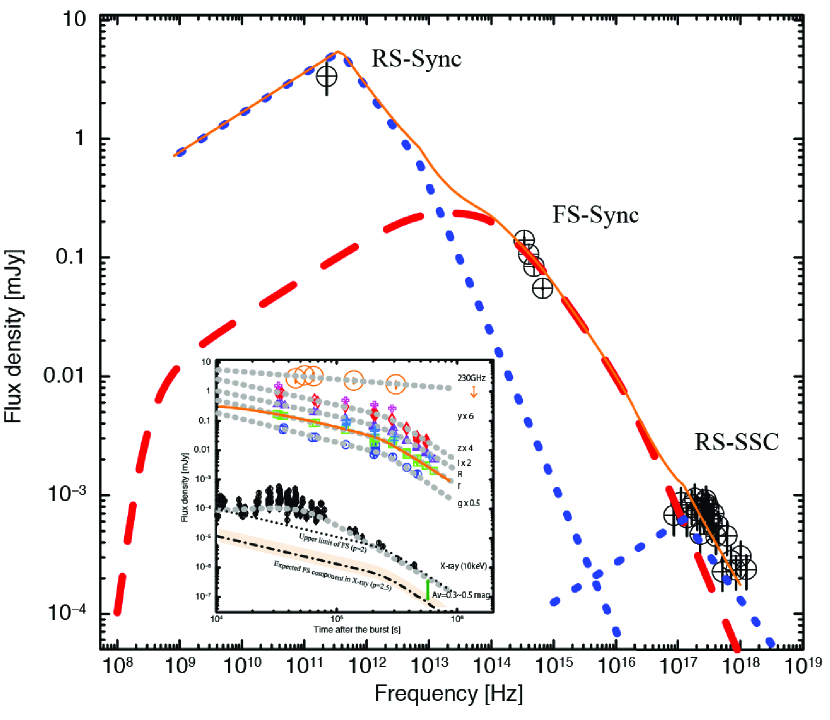
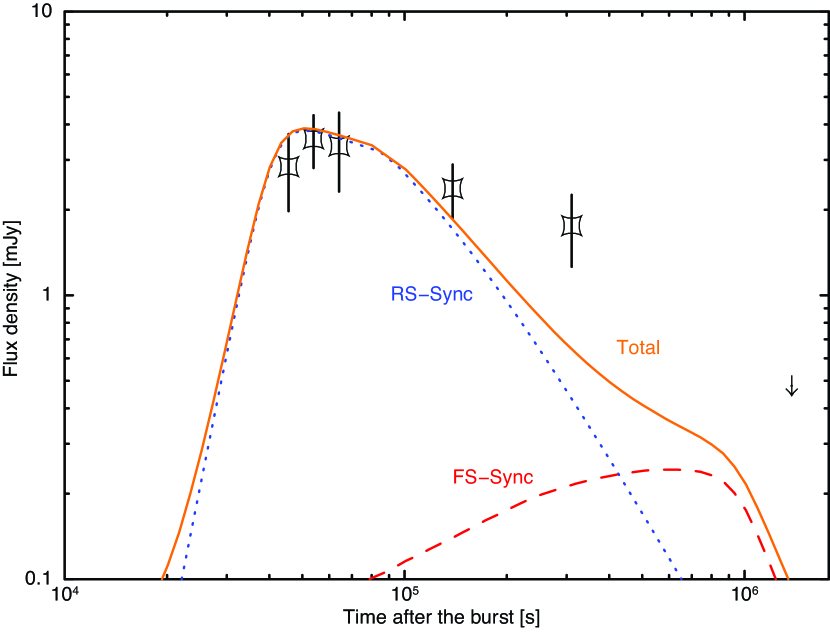
GRB120326A: The SMA observation provided the fastest detection to date among seven submm afterglows at 230 GHz (Fig. 2). In addition, comprehensive monitoring in the X-ray and optical bands were also performed. These observations revealed that the temporal evolution and spectral properties in the optical bands were consistent with the standard FS synchrotron with jet collimation (). Furthermore, the X-ray and submm behavior indicated different radiation processes from the optical afterglow as shown in Fig. 3. Introducing synchrotron self-inverse Compton radiation from RS is a possible solution that is supported by the detection and slow decay of the afterglow in the submm band. As shown in Fig. 4, the light curve exhibited the slow temporal evolution () between and ; this evolution is consistent with the expected decay index of the RS with the condition (Urata et al., 2014). Here, and are the observing frequency and the characteristic synchrotron frequency of the RS. and Because half of the events exhibit similar X-ray and optical properties (e.g., Panaitescu et al., 2006; Huang et al., 2007; Urata et al., 2007) as the current event , GRB 120326A constitutes a benchmark requiring additional rapid follow ups conducted using submm instruments such as the SMA and the Atacama Large Millimeter/submm Array (ALMA).
To enhance afterglow studies, submm monitoring observations from an early phase are required. Although rapid follow-ups have been performed using with the SMA, as in the GRB130427A case (begining 1.6 h after the burst), these follow ups have been still limited; specifically, we have failed to detect the GRB130427A afterglow with a insufficient sensitivity (10 mJy) for detecting the RS component (Laskar et al., 2013; Perley et al., 2014; van der Horst et al., 2014) caused by poor weather conditions. The onging SMA programs have also been suffering from the poor weather conditions of the Mauna Kea site. The condition of the Mauna Kea site for the SMA and the James Clerk Maxwell Telescope (JCMT) is inferior for submm observations comparing with other sites such as the ALMA site. Five out of 13 observations with SMA (averaged responding time is 11.3 hr) were made under the poor or marginal weather conditions. Hence, weather condition for submm bands is one of the crucial points for the time critical observations. As demonstrated through JCMT observations (Smith et al., 2012a, b, c, d, 2013a, 2013b), rapid follow-ups can be managed by using existing submm telescopes with suitable follow-up programs and observation system. The typical delay time of JCMT is hrs scale (average of 59 min with 6 GRB observations). Therefore, the succession of the JCMT rapid response system is also desired in the future. In addition, the constructions of dedicated submm telescopes based on these experiences at the better observing site is required to conduct systematic rapid and dense continuous follow-ups (sometimes coordinated with several submm telescopes at the different longitude for covering light curve within a day).
3. Greenland Telescope
The GLT is a state-of-the-art 12-m submm telescope to be located in the Summit Station in Greenland. The aims of the project are establishing a new submm very long baseline interferometer (VLBI) station for the first imaging of shadow of supermassive black holes in M87 (Inoue et al., 2014), and exploring a new terahertz frequency window (Hirashita et al., 2015) and time-domain astronomy in submm (e.g. this paper). The expected first light of the GLT will be made in 2017/18.
3.1. Site of the Greenland Telescope
The Summit Station is located on top of the Greenland ice cap, at 72.5∘ N and 38.5∘ W (north of the Arctic Circle) at a 3,200-m altitude. The temperature is extremely low, especially in winter, when the temperature reaches between 40∘C and 60 ∘C (a lowest temperature of 72∘C has been recorded). Because of the combination of low temperature and high altitude, considerably low opacity is expected. In 2011, a tipping radiometer at 225 GHz was deployed to Greenland to monitor the sky and weather conditions at the Summit Station, and measured opacities from October 2011 to March 2014. The best and the most frequent opacities at 225 GHz were 0.021 and 0.04, respectively (Inoue et al., 2014). The weather conditions are compatible with those at the ALMA site and significantly better than those of the Manna Kea site (Martin-Cocher et al., 2014). These low opacity and weather conditions are the advantage of the GLT in managing submm and time critical observations including GRB follow-ups with higher sensitivity (or short exposure cycle).
3.2. Planned instruments and expected sensitivities
The GLT will be initially equipped with VLBI receivers at 86, 230, and 345 GHz. Whether large single-dish receivers as second-generation instruments (e.g., submm hetrodyne arrays, a THz HEB array, and bolometric spectrometer array) will be installed depends on the scientific merits of the instruments and is still under discussion. For GRB observations, three frequency bands of the VLBI receivers are appropriate and therefore, the first-generation receivers can be used for afterglow observations. The current expected sensitivities of VLBI receivers are 36 and 88 mJy with 1 s integration at 230 and 345 GHz, respectively (Grimes et al., 2014). These are at least two times better than those of SMA and JCMT. We note that minimum integration time would be less than 0.5 s, since duty cycle for positional switch will be 2 Hz. Longer integration will be achieved as the accumulation of the short integrated data points. Hence, the GLT with the receivers will provide sufficient sensitivities to detect GRB counterparts at the 230 GHz band with shorter exposures (e.g., 3 limit of 48.3 mJy with 5s, 10.8 mJy with 100 s, 3.6 mJy with 15 min and 1.8 mJy with 1 h ). This shorter exposure cycle is one of advanteges to charcterized temporal evolutions of submm afterglows. The field-of-view (FOV) of the receivers will be 25” and 16” at 230 and 345 GHz, respectively. These relatively narrow FOV require a tiling observation for covering entire error region determined by hard X-ray instruments (e.g. Swift/BAT) or accurate position determination with X-ray afterglows.
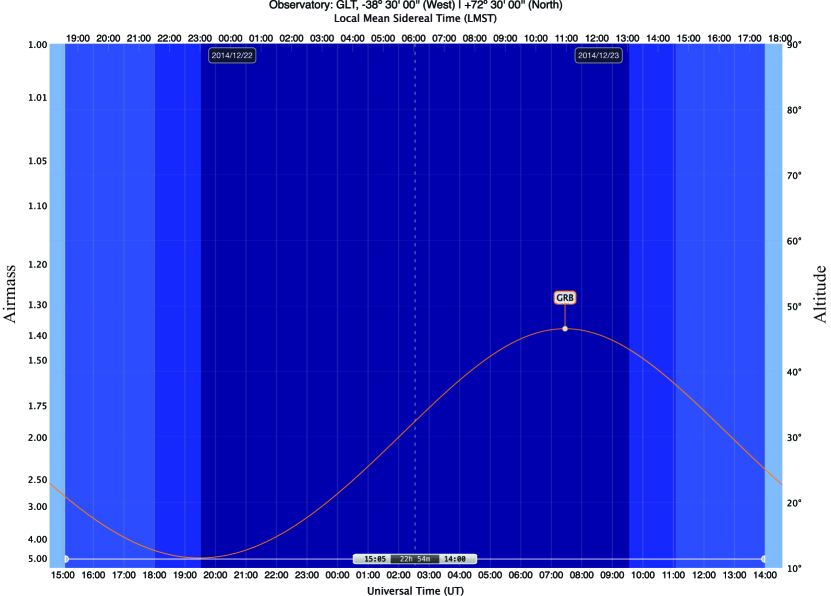
We are also planning to install semi-automated responding system for the GRB alerts to manage the rapid GRB follow-ups with secure procedures at the extreme site. We enjoyed the prototype system at the Kiso observatory Urata et al. (2004). The pointing will be started using the position determined by -ray instruments and additional adjustment will be made responding to the position of X-ray afterglows. By combination use of this system and site advantages including visitility for targets as shown in Fig. 5, we will be able to perform nearly real time follow-ups for GRBs whose declinations are higher than 30 deg. A nearly video mode of continuous monitoring will be managed in the first one day.
4. Expected GRB follow-up observations in the GLT era
To achieve successful observations, rapid follow ups using the GLT will be coordinated through Swift and the planned Space-based Multiband Astronomical Variable Objects Monitor (SVOM)(Godet et al., 2012). One of the obstacles to performing rapid follow ups of Swift-detected GRBs is the poor visibility from ground-based instruments. Although Swift has enabled detecting between 100 and 150 events per year, only GRBs per year are observable from the major astronomical observation sites (e.g., Mauna Kea, Chile) without any delay from their -ray triggers, because of visibility problems that occur when using ground-based instruments and the random pointing strategy associated with Swift observations. According to statistical data in 10 years of Swift observations, 10 to 12 events per year could be observed from the early phase of the afterglow by using currently existing telescopes within a hour delay by maintaining a proper exposure time ( h). The current fraction of total Swift/BAT pointing time to around antisun directions (sun hour angle from 9 to 15 h) is limited to 30-40% (Sakamoto & Gehrels, 2009). The ideal location of the GLT will enable solving this problem. As shown in Fig. 5, GRBs located at a declination higher than 29 deg will always exhibit an elevation angle higher than 12 deg over days. Hence, in winter, the GLT will be able to begin rapid GRB follow ups without any delay caused by unfavorable visibility and perform continuous submm monitoring over days. In addition, these observation conditions are advantageous for observing GRB afterglows that exhibit a rich diversity in various time ranges. In summer, the 86 GHz receiver will be used when weather conditions is unsuitable for observations at 230 and 345 GHz.
SVOM (2020) will be a timely mission for conducting rapid GLT observations. The GRB detectors will observe antisun directions that enable ground-based instruments to begin follow ups and continuous long-term monitoring of markedly early cases immediately after receiving GRB alerts. The GRB detection rate of SVOM will be 80 events per year, providing 10 to 20 events per year for rapid GLT follow ups. In a typical GRB case, X-ray afterglows will be observed immediately through a SVOM X-ray telescope (MXT) (Götz et al., 2014), with the same strategy of X-ray observations of Swift. This provides a position accuracy of the counterpart of 2-3”, which is sufficient to cover the position with the FOV of the GLT.
An additional crucial advantage of SVOM follow ups is the capability of detecting of X-ray flashes (XRFs) and X-ray-rich GRBs (XRRs) (Sakamoto et al., 2005) and determining the prompt spectral peak energy . Because of the slightly higher energy range of Swift/BAT (15-150 keV), sample collections of XRFs and related rapid follow-ups have been entirely terminated. The estimation of the Swift-detected GRBs (mainly XRRs and classical GRBs) has been provided by joint spectrum fittings of Swift/BAT and Suzaku/WAM (Yamaoka et al., 2009). Although spectral parameters of prompt emissions are adequately constrained by these joint fittings (e.g. Starling et al., 2008; Krimm et al., 2009; Sugita et al., 2009; Urata et al., 2009, 2012), the number of events is limited. This has caused a stagnation of the study of GRBs with prompt characterization. Because two of the prompt-emission-observing instruments onboard SVOM, ECLAIRs (Godet et al., 2014), and the Gamma Ray Monitor (GRM) (Dong et al., 2010) will cover the energy bands 4-150 keV and 30-5000 keV, respectively, the for most of SVOM-detected GRBs would be determined. In addition, numerous XRRs and XRFs would be detected with the estimation through ECLIAS and GRM. According to the HETE-2 observations (Sakamoto et al., 2005), the numbers of XRFs, XRRs, and GRBs were 16, 19, and 10, respectively. The numbers of softer events (XRFs/XRRs) was considerably higher than that of classical GRBs. Because the lower-energy coverage of HETE-2 (2-400 keV) (Shirasaki et al., 2003) was similar to that of SVOM, a high volume of XRF and XRR samples with measurements can be generated. This is likely to enhance the study of the origins of XRRs and XRFs by enabling the determination of their physical parameters. Hence, the GLT will be able to facilitate characterizing prompt and late-phase submm afterglows of all three types of bursts for the first time, providing crucial insights into the nature of XRFs and XRRs.
5. Expected Science Cases
On the basis of the summary of submm afterglow observations and the GLT project, we established the following three scientific goals.
5.1. Systematic detection of bright submm emissions
It is believed that RSs generate short bright optical flashes (e.g., Akerlof et al., 1999) and/or intense radio afterglows (e.g., Kulkarni et al., 1999). According to the standard relativistic fireball model, RSs are expected to radiate emissions in the long wavelength bands (optical, infrared, and radio) by executing a synchrotron process in a particularly early afterglow phase (e.g., Kobayashi, 2000).
Detecting this brief RS emission and measuring its magnitude would lead to constraints on several crucial parameters of the GRB ejecta, such as its initial Lorentz factor and magnetization (Zhang et al., 2003). Although RS emission has been detected in the optical wavelength in several GRBs, early optical observations for most GRBs have yielded no evidence of RS emission. The nondetection of RSs in optical bands could be an indicator of a magnetically dominated outflow. Another possible reason for the nondetection is that the typical RS synchrotron frequency is markedly below the optical band (e.g., Melandri et al., 2010). Searching for RS emissions in the submm wavelength would test these possibilities. The comparison of early optical and submm temporal evolution would enable studying the composition of the GRB ejecta. If an RS component were regularly detected in GRBs of which the early optical light curve shows no evidence of RS emission, we would be able to claim that GRB ejecta are baryonic in nature. The detection of RS emissions in the submm band of most GRB would support the possibility that GRBs are baryonic flow.
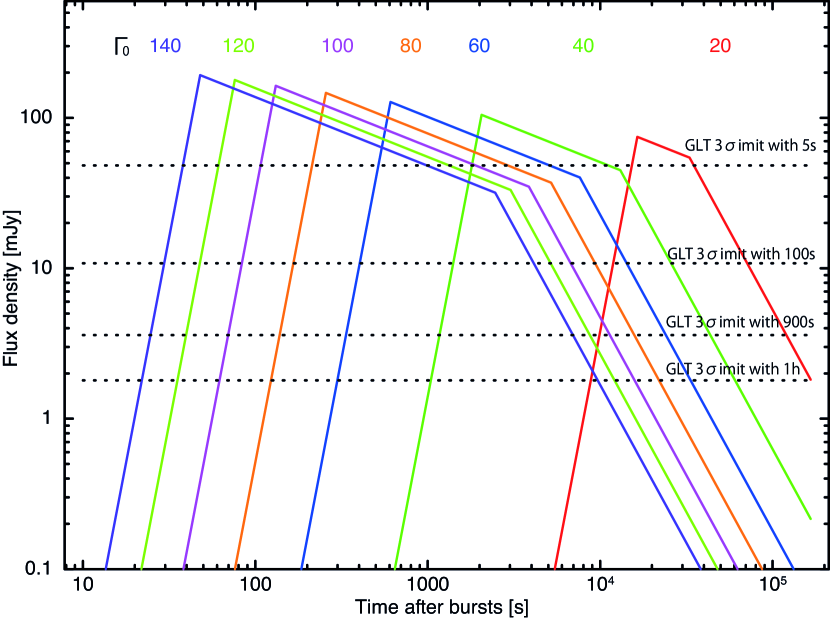
One of the critical problems is that there has been no systematic submm observational study in the early afterglow phase of GRBs. As shown in Fig. 1, the number of events that have been observed earlier than 1 day after bursts has remained 16 for some time. The expected RS light curve for classical GRBs is fainter than 1 mJy at 1 day after bursts and therefore undetectable using currently existing submm telescopes, expect for ALMA. Fig. 6 shows the expected RS light curves based on Kobayashi (2000), and Kobayashi et al. (2007) with various magnetic energy densities of RS and an initial Lorentz factor in comparison with the GLT sensitivity limit. In most of the cases shown in Fig. 6, the RS component faded away before s ( day). Hence, to detect and characterize RS components, rapid ( min scale) and continuous dense monitoring within 1 day is required. Although some of successful RS observations were made by SMA, CARMA, VLA, and others with their open use framework (e.g. Urata et al., 2014; Laskar et al., 2013; Perley et al., 2014; van der Horst et al., 2014), dedicated radio telescopes are strongly desired to make the systematic investigation. In addition, dense monitoring with the same wavelength are required to characterize the RS components. Because sparse monitoring even though rapid detection is included failed to decode RS and FS components (e.g. Veres et al., 2014). Therefore, the use of the GLT would initiate the era systematic the submm follow-ups.
In Fig. 6, cases of low initial Lorentz factors (20, 40) are provided showing XRRs and XRFs that are expected to be detected using the planned GRB satellite SVOM. The origin of the XRFs is not known. However, there are two major models, namely (1) the failed GRBs or dirty fireball model (e.g. Huang et al., 2002) and (2) the off-axis jet model (Yamazaki et al., 2002). According to the dirty fireball model, low-inital-Lorentz-factor () GRBs produce a lower spectral peak energy in the prompt phase because of dependence, and it is therefore natural to attribute this energy to XRRs and XRFs. The low Lorentz factors substantially delay the RS peak (Fig. 6 bottom). For the latter model, it is assumed that the viewing angle is considerably larger than the collimation angle of the jet, and the high ratio of X-ray to -ray fluence is caused by a relativistic beaming factor when a GRB is observed through off-axis direction. The key observable feature is the achromatic brightening optical afterglow light curves, of which the peak time depends on the viewing angle (Nakar & Piran, 2003; Urata et al., 2015). Hence, identifying a delayed RS peak through rapid GLT monitoring and the prompt spectral characterization of SVOM will confirm and identify the orgin of XRFs and XRRs.

5.2. Characterization of forward and reverse shock emissions
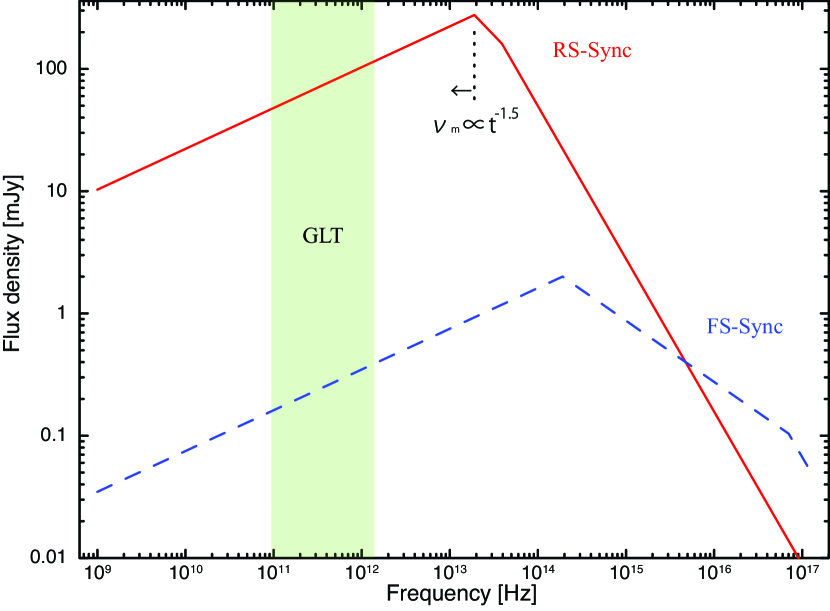
The spectral characteristics of FS and RS synchrotron emissions are related as follows: , and (e.g., Zhang et al., 2003), where (=) and (=) denote the mass and magnetization ratio parameters, respectively. Here, , , and are the Lorentz factor at the deceleration time, the fractions of magnetic energy of RS, and FS, respectively. RS emission is typically expected to be considerably brighter ( times) than FS emission as shown in Fig. 7. Therefore, the emission from RSs is sensitive to the properties of the fireball, and the broadband spectrum and light curve evolutions of FS/RS can provide critical clues to understanding GRBs.
Regarding FSs, afterglows can be described by synchrotron emissions from a decelerating relativistic shell that collides with an external medium. According to the FS synchrotron model, both the spectrum and light curve consist of several power-law segments with related indices (e.g., Sari et al., 1999; Gao et al., 2013). The broadband spectrum is characterized according to the synchrotron peak frequency and the peak spectrum flux density . The peak spectrum flux is expected to occur at low frequencies (from X-ray to radio) over time (from minutes to several weeks) as . The peak spectrum flux density is predicted to remain constant in the cirucumburst model, whereas it decreases as in the wind model. Therefore, determining the characterizing frequencies and peak fluxes by using temporal and spectrum observations provides direct evidence of the FS/RS shock synchrotron model and typical (or average) physical conditions of a fireball.
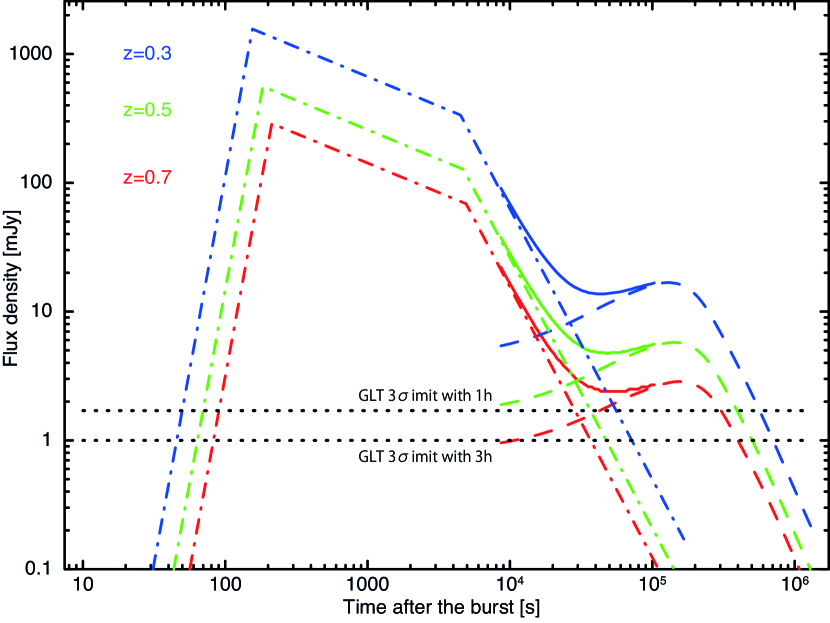
Snapshots of the broadband spectrum and continuous monitoring of light curves in the submm bands are essential to characterizing the radiation of afterglow by decoding each component. Fig. 8 shows the expected light curve in the 230 GHz band at , 0.5, and 0.7. We fix the rest of parameters as explosion energy erg, circumburst number density 1 , the electron spectral index , the electron energy density , and the magnetic energy density of FS . The brightening caused by the passing of the synchrotron peak frequency can be detected to determine the FS component in light curves. The GLT has also enought sensitivities to detect FS component for nearby () events and the monitoring determin their . The expected passing through time across the 230 GHz band is several s (Fig. 8). Therefore, the submm band is suitable for decoding both RS and FS components. Some of closure relations for FS and RS (Gao et al., 2013) will also constrain components even if the light curve or spectrum observations are sparsely performed. For X-ray and OIR cases, the expected timescale is between several minutes and h after the burst. In this time range, detecting the peak frequency directly is difficult because several additional components (e.g., long-lasting prompt emission, X-ray flares etc) characterize this phase. For the MIR case, observations fully rely on the satellite-based instruments. In this case, timely follow ups are difficult because of operation confinement and limitation of number of resources. Furthermore, the slow temporal evolution in the radio band makes difficult to obtain simultaneous optical and X-ray segments. This creates uncertainty regarding whether we observe the same synchrotron components or not. Hence, the GLT will provide unique results for nearby events () by facilitating the continuous monitoring.
Optical monitoring combined with the GLT will be required. As we describe above, RS components will be caught by submm observations. For characterizing FS components, multicolor optical monitoring is suitable because the temporal evolution and spectrum of optical afterglow around 1 day after bursts are well consistent with the expectation of the FS model. Fig. 3 shows one of the most appropriate examples of the earliest submm afterglow detection procedures performed using the SMA and related optical monitoring (Urata et al., 2014). Because of the rapid submm monitoring, the FS and RS components were separated. Conducting multifrequency monitoring by using the GLT requires rapid optical follow ups, which will be conducted using our own optical network EAFON (Huang et al., 2005; Lee et al., 2010; Urata et al., 2003) and other ground-based optical telescopes, as numerous observations have been conducted.
5.3. Discovering of first-star explosions by using GRBs
The findings regarding a high-redshift GRB at (Tanvir et al., 2009) indicated the possibility of using GRBs to probe the processes and environments of star formation as far back in time as the earliest cosmic epochs. Numerous theoretical models (e.g., de Souza et al., 2011; Nagakura et al., 2012; Nakauchi et al., 2012) show that some POP-III stars generate GRBs as an end product. Hence, detecting the signals of high-z GRBs has been a recent prominent objective in modern astrophysics.
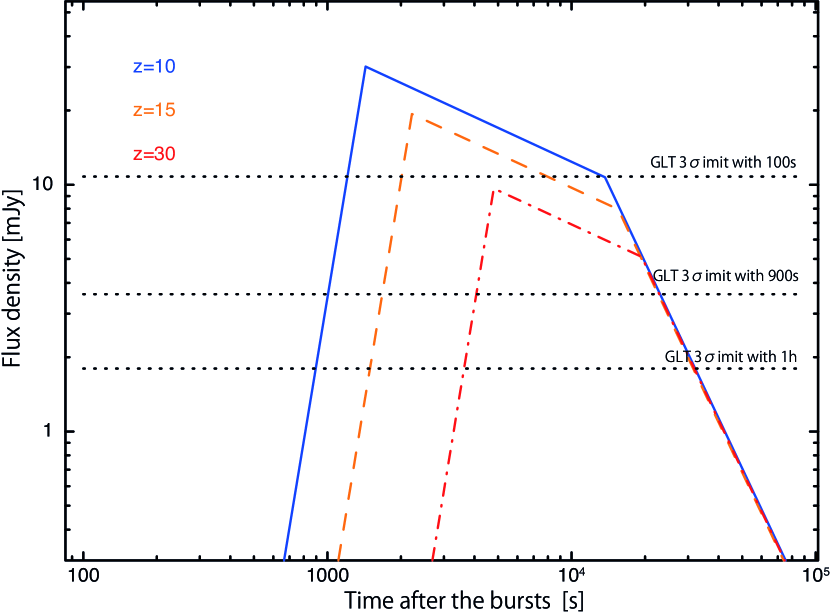
One of the prospective methods of identifying POP-III GRBs is to detect RS components in the submm bands. Unlike OIR observations, submm observations provide clean measurments of the source intensity, unaffected by extinction. Because of the intense luminosity of the RSs, it is expected that the radiation from high-z GRBs () can be observed if the GLT is used with the rapid response system. Inoue et al. (2007) showed the RS component of POP-III GRBs at and 30 in the 300 GHz band is substantially brighter than 1 mJy, and these bright RS components will be detectable by using the GLT. In addition, we simulated the expected RS light curves at , 15, and 30 based on Kobayashi (2000) and Kobayashi et al. (2007). For this calculation, we assumed because the progenitor stars might be considerably more massive than nearby events (e.g., de Souza et al., 2011). Other physical parameters are fixed as , , , , and . As shown in Fig. 9, the GLT has great potential to detect the high- GRBs even those at =30 with the rapid responding, shorter exposure cycle, and continuous dense monitoring. These initial detections of the GLT in the early phase will provide the opportunity to conduct additional follow-ups using 30-m-class telescopes such as the TMT. Because these large telescopes typically enable conducting follow ups for a limited number of events, the target selections of the GLT observations will be critical.
The event rate of high- GRBs, which may be connected to the star-formation rate in the early universe, is not known. Wanderman & Piran (2010) estimated that the event rate of high- (7) GRBs might be events per year per steradian on the basis of limited 100 Swift-detected long GRBs with known redshift and measured peak flux. Their estimation showed that Swift/BAT exhibited substantially high redshift fractions ( at z7), whereas Swift and related follow ups detected only a few events. Hence, uncertainty exist regarding the number of higher- events that Swift has detected; thus, the frequency of such events is not thoroughly understood because appopriate follow-ups in long wavelength (e.g., IR, submm) have not been conducted. Actually, GRB candidate (Cucchiara et al., 2011) was also detected through Swift. Therefore, a continuous effort is required in this field of research, despite a success rate that is typically low. In addition, Wanderman & Piran (2010) expected that SVOM will detect 0.1-7 events per year at . To detect these events, rapid follow-up coordination with submm instruments will be crucial, because it is impossible to identify higher- candidates within hours from bursts with limited observational information. Therefore, the installing a rapid responding system in the GLT will enable us to perform high- GRB observations.
6. Summary
We briefly summarized the current achievements of submm follow-up observations of GRBs. Although submm afterglow observations are critical to understanding the nature of GRBs (e.g., GRB030329 and GRB120326A), the number of successful observations has been limited. This is because lack of dedicated submm telescopes has made it difficult to perform rapid follow-up.
Furthermore, we introduced the single dish mode of GLT. The development is ongoing and the expected first light of the GLT will be made in 2017/18. The first light instrument will be the VLBI receivers at 86, 230, and 345 GHz. The expected sensitivities of the receivers are 36 and 88 mJy in 1 s integration at 230 and 345 GHz, respectively. The GLT enables rapid and continuous submm monitoring of GRB submm counterparts in the prompt phase.
According to the aforementioned situations and expected capabilities of the GLT, we established the following three key scientific goals regarding GRB studies; (1) systematic detection of bright submm emissions originating from RS in the early afterglow phase by conducting rapid follow ups, (2) characterization of FS and RS emissions by capturing their peak flux and frequencies through continuous monitoring, and (3) detection of the first star explosions as a result of GRBs at a high redshift through systematic rapid follow-ups.
Detecting RS emissions and monitoring light curves in the submm band could lead to constraints on several crucial parameters of the GRB ejecta, such as the initial Lorentz factor and magnetization. We calculated the expected RS light curves by using various initial Lorentz factors and the magnetic energy densities of RS , and showed that these light curves could be characterized through rapid follow ups of the GLT. Determining the origins of XRRs and XRFs will also be a major focus of the GLT together with the SVOM mission.
In addition to characterizing RS components, the GLT will be able to detect FS components of nearby (0.7) GRBs. Because the spectral characteristics of the FS and RS synchrotron emissions are related, characterizing both FS and RS components provides critical insights into GRBs. We generated an expected submm light curve at , 0.5, and 0.7 and showed that the GLT can separate RS and FS components through long-term and continuous monitoring, because RS and FS components dominate earlier than s and later than s, respectively.
These two RS science topics will enhance the GRB studies as the probe of a high- universe. Because of the existence of RS and its extreme luminosity, it is expected that the radiation from high-z GRB () can be observed if the GLT is used with a rapid (hour scale) response system. We simulated the expected RS light curves at , 15, and 30. These light curves showed that the GLT has sufficient sensitivity to detect and characterize these events. The future SVOM mission may provide the capability to detect GRBs at ; the establishment of close coordination using longer-wavelength (e.g., infrared, submm) instruments will be crucial. Because the rapid identification of counterparts at long wavelengths is crucial for conducting additional further follow ups using 30-m-class telescopes such as the TMT will be used. Therefore, the GLT could play a crucial role in detecting high- GRBs.
References
- Akerlof et al. (1999) Akerlof, C., Balsano, R., Barthelmy, S., et al. 1999, Nature, 398, 400
- Akerlof et al. (2003) Akerlof, C. W., Kehoe, R. L., McKay, T. A., et al. 2003, PASP, 115, 132
- Berger et al. (2003) Berger, E., Kulkarni, S. R., Pooley, G., et al. 2003, Nature, 426, 154
- Bloom et al. (2009) Bloom, J. S., Perley, D. A., Li, W., et al. 2009, ApJ, 691, 723
- Burd et al. (2005) Burd, A., Cwiok, M., Czyrkowski, H., et al. 2005, New Astronomy, 10, 409
- Chandra & Frail (2012) Chandra, P., & Frail, D. A. 2012, ApJ, 746, 156
- Cucchiara et al. (2011) Cucchiara, A., Levan, A. J., Fox, D. B., et al. 2011, ApJ, 736, 7
- de Souza et al. (2011) de Souza, R. S., Yoshida, N., & Ioka, K. 2011, A&A, 533, AA32
- de Ugarte Postigo et al. (2012) de Ugarte Postigo, A., Lundgren, A., Martín, S., et al. 2012, A&A, 538, A44
- Dong et al. (2010) Dong, Y., Wu, B., Li, Y., Zhang, Y., & Zhang, S. 2010, Science China Physics, Mechanics, and Astronomy, 53, 40
- Ferrero et al. (2010) Ferrero, A., Hanlon, L., Felletti, R., et al. 2010, Advances in Astronomy, 2010,
- Frail et al. (2005) Frail, D. A., Soderberg, A. M., Kulkarni, S. R., et al. 2005, ApJ, 619, 994
- Gao et al. (2013) Gao, H., Lei, W.-H., Zou, Y.-C., Wu, X.-F., & Zhang, B. 2013, New A Rev., 57, 141
- Gehrels et al. (2004) Gehrels, N., Chincarini, G., Giommi, P., et al. 2004, ApJ, 611, 1005
- Godet et al. (2012) Godet, O., Paul, J., Wei, J. Y., et al. 2012, Proc. SPIE, 8443, 84431O
- Godet et al. (2014) Godet, O., Nasser, G., Atteia, J.-., et al. 2014, Proc. SPIE, 9144, 914424
- Gorosabel et al. (2005) Gorosabel, J., Pérez-Ramírez, D., Sollerman, J., et al. 2005, A&A, 444, 711
- Grimes et al. (2014) Grimes, P. K., Asada, K., Blundell, R., et al. 2014, Proc. SPIE, 9153, 91531V
- Götz et al. (2014) Götz, D., Osborne, J., Cordier, B., et al. 2014, Proc. SPIE, 9144, 914423
- Hirashita et al. (2015) Hirashita, H et al. 2015 PASP in prep.
- Ho et al. (2004) Ho, P. T. P., Moran, J. M., & Lo, K. Y. 2004, ApJ, 616, L1
- Huang et al. (2002) Huang, Y. F., Dai, Z. G., & Lu, T. 2002, MNRAS, 332, 735
- Huang et al. (2005) Huang, K. Y., Urata, Y., Filippenko, A. V., et al. 2005, ApJ, 628, L93
- Huang et al. (2007) Huang, K. Y., Urata, Y., Kuo, P. H., et al. 2007, ApJ, 654, L25
- Inoue et al. (2007) Inoue, S., Omukai, K., & Ciardi, B. 2007, MNRAS, 380, 1715
- Inoue et al. (2014) Inoue, M., Algaba-Marcos, J. C., Asada, K., et al. 2014, Radio Science, 49, 564
- Klose et al. (2004) Klose, S., Palazzi, E., Masetti, N., et al. 2004, A&A, 420, 899
- Klotz et al. (2009) Klotz, A., Boër, M., Atteia, J. L., & Gendre, B. 2009, AJ, 137, 4100
- Kobayashi et al. (2007) Kobayashi, S., Zhang, B., Mészáros, P., & Burrows, D. 2007, ApJ, 655, 391
- Kobayashi (2000) Kobayashi, S. 2000, ApJ, 545, 807
- Kohno et al. (2005) Kohno, K., Tosaki, T., Okuda, T., et al. 2005, PASJ, 57, 147
- Kosugi et al. (2004) Kosugi, G., Mizumoto, Y., Kawai, N., et al. 2004, PASJ, 56, 61
- Krimm et al. (2009) Krimm, H. A., Yamaoka, K., Sugita, S., et al. 2009, ApJ, 704, 1405
- Kulkarni et al. (1999) Kulkarni, S. R., Frail, D. A., Sari, R., et al. 1999, ApJ, 522, L97
- Kuno et al. (2004) Kuno, N., Sato, N., Nakanishi, H., et al. 2004, PASJ, 56, L1
- Laskar et al. (2013) Laskar, T., Berger, E., Zauderer, B. A., et al. 2013, ApJ, 776, 119
- Lee et al. (2010) Lee, I., Im, M., & Urata, Y. 2010, Journal of Korean Astronomical Society, 43, 95
- Marshall et al. (2011) Marshall, F. E., Antonelli, L. A., Burrows, D. N., et al. 2011, ApJ, 727, 132
- Martin-Cocher et al. (2014) Martin-Cocher, P. L., Asada, K., Matsushita, S., et al. 2014, Proc. SPIE, 9147, 91473N
- Melandri et al. (2010) Melandri, A., Kobayashi, S., Mundell, C. G., et al. 2010, ApJ, 723, 1331
- Meszaros & Rees (1997) Meszaros, P., & Rees, M. J. 1997, ApJ, 476, 232
- Nagakura et al. (2012) Nagakura, H., Suwa, Y., & Ioka, K. 2012, ApJ, 754, 85
- Nakar & Piran (2003) Nakar, E., & Piran, T. 2003, New A, 8, 141
- Nakauchi et al. (2012) Nakauchi, D., Suwa, Y., Sakamoto, T., Kashiyama, K., & Nakamura, T. 2012, ApJ, 759, 128
- Panaitescu et al. (2006) Panaitescu, A., Mészáros, P., Burrows, D., et al. 2006, MNRAS, 369, 2059
- Perley et al. (2014) Perley, D. A., Cenko, S. B., Corsi, A., et al. 2014, ApJ, 781, 37
- Price et al. (2003) Price, P. A., Fox, D. W., Kulkarni, S. R., et al. 2003, Nature, 423, 844
- Racusin et al. (2008) Racusin, J. L., Karpov, S. V., Sokolowski, M., et al. 2008, Nature, 455, 183
- Resmi et al. (2005) Resmi, L., Ishwara-Chandra, C. H., Castro-Tirado, A. J., et al. 2005, A&A, 440, 477
- Sakamoto & Gehrels (2009) Sakamoto, T., & Gehrels, N., 2009 “Swift mission conference: Celebrating 5 years
- Sakamoto et al. (2005) Sakamoto, T., Lamb, D. Q., Kawai, N., et al. 2005, ApJ, 629, 311
- Sari et al. (1999) Sari, R., Piran, T., & Halpern, J. P. 1999, ApJ, 519, L17
- Sheth et al. (2003) Sheth, K., Frail, D. A., White, S., et al. 2003, ApJ, 595, L33
- Shirasaki et al. (2003) Shirasaki, Y., Kawai, N., Yoshida, A., et al. 2003, PASJ, 55, 1033
- Šimon et al. (2004) Šimon, V., Hudec, R., & Pizzichini, G. 2004, A&A, 427, 901
- Smith et al. (2003) Smith, D. A., Rykoff, E. S., Akerlof, C. W., et al. 2003, ApJ, 596, L151
- Smith et al. (2005) Smith, I. A., Tilanus, R. P. J., Tanvir, N., et al. 2005, A&A, 439, 981
- Smith et al. (2012a) Smith, I. A., Tilanus, R. P. J., Tanvir, N. R., & Frail, D. A. 2012, GRB Coordinates Network, 13233, 1
- Smith et al. (2012b) Smith, I. A., Tilanus, R. P. J., Tanvir, N. R., & Frail, D. A. 2012, GRB Coordinates Network, 13259, 1
- Smith et al. (2012c) Smith, I. A., Tilanus, R. P. J., Tanvir, N. R., & Frail, D. A. 2012, GRB Coordinates Network, 13519, 1
- Smith et al. (2012d) Smith, I. A., Tilanus, R. P. J., Tanvir, N. R., & Frail, D. A. 2012, GRB Coordinates Network, 13554, 1
- Smith et al. (2013a) Smith, I. A., Tilanus, R. P. J., Tanvir, N. R., & Frail, D. A. 2013, GRB Coordinates Network, 14281, 1
- Smith et al. (2013b) Smith, I. A., Tilanus, R. P. J., Tanvir, N. R., & Frail, D. A. 2013, GRB Coordinates Network, 15174, 1
- Stanek et al. (2003) Stanek, K. Z., Matheson, T., Garnavich, P. M., et al. 2003, ApJ, 591, L17
- Starling et al. (2008) Starling, R. L. C., O’Brien, P. T., Willingale, R., et al. 2008, MNRAS, 384, 504
- Steele (2001) Steele, I. A. 2001, New A Rev., 45, 45
- Sugita et al. (2009) Sugita, S., Yamaoka, K., Ohno, M., et al. 2009, PASJ, 61, 521
- Tanvir et al. (2009) Tanvir, N. R., Fox, D. B., Levan, A. J., et al. 2009, Nature, 461, 1254
- Tiengo et al. (2003) Tiengo, A., Mereghetti, S., Ghisellini, G., et al. 2003, A&A, 409, 983
- Tiengo et al. (2004) Tiengo, A., Mereghetti, S., Ghisellini, G., Tavecchio, F., & Ghirlanda, G. 2004, A&A, 423, 861
- Urata et al. (2003) Urata, Y., et al. 2003, ApJ, 595, L21
- Urata et al. (2004) Urata, Y., Miyata, T., Nishiura, S., et al. 2004, ApJ, 601, L17
- Urata et al. (2007) Urata, Y., et al. 2007, ApJ, 668, L95
- Urata et al. (2009) Urata, Y., et al. 2009, ApJ, 706, L183
- Urata et al. (2011) Urata, Y., Tashiro, M. S., Tamagawa, T., et al. 2011, PASJ, 63, 137
- Urata et al. (2012) Urata, Y., Huang, K., Yamaoka, K., Tsai, P. P., & Tashiro, M. S. 2012, ApJ, 748, L4
- Urata et al. (2014) Urata, Y., Huang, K., Takahashi, S., et al. 2014, ApJ, 789, 146
- Urata et al. (2015) Urata, Y., Huang, K., Yamazaki, R., Sakamoto, T. 2015, ApJ submitted
- van Eerten et al. (2012) van Eerten, H., van der Horst, A., & MacFadyen, A. 2012, ApJ, 749, 44
- van der Horst et al. (2008) van der Horst, A. J., Kamble, A., Resmi, L., et al. 2008, A&A, 480, 35
- van der Horst et al. (2014) van der Horst, A. J., Paragi, Z., de Bruyn, A. G., et al. 2014, MNRAS, 444, 3151
- Veres et al. (2014) Veres, P., Corsi, A., Frail, D. A., Cenko, S. B., & Perley, D. A. 2014, arXiv:1411.7368
- Vestrand et al. (2002) Vestrand, W. T., Borozdin, K. N., Brumby, S. P. et al. 2002, SPIE, 4845, 126
- Vestrand et al. (2005) Vestrand, W. T.,Wozniak, P. R., Wren, J. A., et al. 2005, Nature, 435, 178
- Vestrand et al. (2006) Vestrand, W. T., Wren, J. A., Wozniak, P. R., et al. 2006, Nature, 442, 172
- Wanderman & Piran (2010) Wanderman, D., & Piran, T. 2010, MNRAS, 406, 1944
- Yamaoka et al. (2009) Yamaoka, K.., et al. 2009, PASJ, 61, S35
- Yamazaki et al. (2002) Yamazaki, R., Ioka, K., & Nakamura, T. 2002, ApJ, 571, L31
- Zhang et al. (2003) Zhang, B., Kobayashi, S., & Mészáros, P. 2003, ApJ, 595, 950