Characterization of low-mass, wide-separation substellar companions to stars in Upper Scorpius: near-infrared photometry and spectroscopy
Abstract
We present new 0.9–2.45 m spectroscopy (), and , , , , photometry, obtained at Gemini North, of three low-mass brown dwarf companions on wide orbits around young stars of the Upper Scorpius OB association: HIP 78530 B, [PGZ2001] J161031.9–191305 B, and GSC 06214-00210 B. We use these data to assess the companions’ spectral type, temperature, surface gravity and mass, as well as the ability of the BT-SETTL and Drift-Phoenix atmosphere models to reproduce the spectral features of young substellar objects. For completeness, we also analyze the archival spectroscopy and photometry of the Upper Scorpius planetary mass companion 1RXS J160929.1–210524 b. Based on a comparison with model spectra we find that the companions, in the above order, have effective temperatures of 2700100 K, 2500200 K, 2300100 K and 1700100 K. These temperatures are consistent with our inferred spectral types, respectively M7 , M9 , M9 , and L4 , obtained from spectral indices and comparisons with templates. From bolometric luminosities estimated from atmosphere model spectra adjusted to our photometry, and using evolution models at 5–10 Myr, we estimate masses of 21–25 , 28–70 , 14–17 , and 7–12 , respectively. [PGZ2001] J161031.9–191305 B appears significantly over-luminous for its inferred temperature, which explains its higher mass estimate. Synthetic spectra based on the BT-Settl and Drift-Phoenix atmosphere models generally offer a good fit to our observed spectra, although our analysis has highlighted a few problems. For example, the best fits in the individual near-infrared bands occur at different model temperatures. Also, temperature estimates based on a comparison of the broadband magnitudes and colors of the companions to synthetic magnitudes from the models are systematically lower than the temperature estimates based on a comparison with synthetic spectra.
Subject headings:
brown dwarfs — infrared: planetary systems — stars: imaging — stars: individual (HIP 78530, [PGZ2001] J161031.9–191305, GSC 06214–00210, 1RXS J160929.1–210524) — stars: low-mass1. INTRODUCTION
Since the first confirmed detection of a brown dwarf in 1995 (Oppenheimer et al., 1995), a substantial effort has been made on characterizing substellar objects. Up to now, almost 2000 isolated brown dwarfs have been discovered, and we are beginning to better understand their formation and evolution. Nevertheless, the modeling of their cool atmospheres, bearing several molecules and dust clouds, is a great challenge for modern astrophysics. Several low-mass substellar companions ( 30 ) have been discovered recently on wide orbits ( 80 AU) around stars, see for example Neuhäuser & Schmidt (2012) and references therein. The age and distance of these companions can be inferred from their primary star, while their large separation permits their direct observation without the hampering glare of their primary star; their characterization is thus particularly interesting for testing low temperature atmosphere and evolution models. At young ages these companions are even more interesting as this is where an empirical verification of the theoretical models is most needed (Allard et al., 2012). Furthermore, these young companions are potentially (more massive) analogs to the young giant planets recently imaged (Marois et al., 2008; Lafrenière et al., 2008; Lagrange et al., 2010; Carson et al., 2013; Kuzuhara et al., 2013; Rameau et al., 2013), and thus can serve as workbenches in support of the more difficult direct imaging studies of exoplanets.
In this paper we present and analyze new near-infrared photometric and spectroscopic observations of a sample of three wide substellar companions to young stars in the Upper Scorpius OB (USco) formation region: the 16 companion at a separation of 320 AU around the K7 star GSC 06214-00210 (hereafter G06214; Ireland et al. 2011), the 23 companion at 740 AU from the B9 star HIP 78530 (Lafrenière et al., 2011), and the 34 companion at 885 AU from the K7 star [PGZ2001] J161031.9–191305 (hereafter J1610–1913; Kraus et al. 2008). The primary of J1610–1913 is itself a tight binary (Aab, separation of 0145 or 20 AU, Kraus et al., 2008), in which the companion (Ab) is roughly at the stellar/substellar boundary. We also apply the same analysis, using existing data, to the 8 companion at 330 AU around the K7 star 1RXS J160929.1–210524 (hereafter J1609–2105) that was first identified in Lafrenière et al. (2008) and further analyzed in Lafrenière et al. (2010). USco is located at a distance of pc (de Zeeuw et al., 1999; Preibisch & Zinnecker, 1999) and the average age in the region is estimated at 5 Myr, with a very small scatter ( Myr) (De Geus, 1992; Preibisch et al., 2002). It is thus reasonable to consider a common age for the systems in our sample, meaning that on a comparative basis, the companions should not be affected by the age-mass degeneracy inherent to substellar objects. The initial age estimate of 5 Myr for USco was recently revised to 112 Myr by Pecaut et al. (2012), based on isochrone fitting. This new age seems to be consistent with the results of Song et al. (2012), given recent the revision of the age of the Beta Pictoris moving group proposed by Binks & Jeffries (2013). Still, the exact age of USco is still the subject of debate, and is beyond the scope of this paper, so in our work below we present results assuming both estimates.
The four companions studied in this paper have all been studied to various degrees in earlier publications. The near-infrared photometry and spectroscopy of HIP 78530 B was analyzed in Lafrenière et al. (2011). Bailey et al. (2013) studied HIP 78530 B, G06214 B, and J1609–2105 b using 3–5 m photometry. Bowler et al. (2011) presented 1.1–1.8 m spectroscopy of G06214 B, adding to the photometry from Ireland et al. (2011). The latter study also independently confirmed the common proper motion of J1609–2105 b. J1610–1913 B was observed in the band by Kraus et al. (2008), who made its discovery. Recently, Aller et al. (2013) presented a low resolution () 0.8–2.5 m spectrum and - and -band photometric measurements of J1610–1913 B. In this paper, in addition to carrying out a homogeneous analysis of the four companions, with a focus on a comparison of their spectra with those of atmosphere models, we also present new data. We present the first photometric measurements in , and of J1610–1913 B. For HIP 78530 B, the -band photometry and the 0.90–1.15 m spectrum have never been published before. The spectrum of G06214 B in the band is also presented for the first time, along with the part of the band between 1.00 m and 1.18 m, where the VO band and the Na I and the two first K I lines are found. We also present the first -band photometric measurement for G06214 B.
2. OBSERVATIONS AND DATA REDUCTION
| Target | Date | Mode | Total Integration Time Per Filter (s) | ||||
|---|---|---|---|---|---|---|---|
| , ) | |||||||
| HIP 78530 | 2011-03-30 | Imaging | (25, 50), | (30, 30) | |||
| J1610–1913 | 2011-04-19 | Imaging | (175, -), | (75, -), | (50, -), | (45, 50) | |
| G06214 | 2011-04-19 | Imaging | (40, 50), | (30, 50), | (50, -), | (60, -) | |
| J1610–1913 | 2011-06-20 | Spectro | – (600, -) | ||||
| G06214 | 2011-06-23 | Spectro | – (2880, -) | ||||
| HIP 78530 | 2011-07-03 | Spectro | – (1350, -) | ||||
| HIP 78530 | 2011-08-16 | Imaging | (288, -) | ||||
| J1610–1913 | 2011-08-16 | Imaging | (90, -) | ||||
2.1. Imaging
The imaging observations were performed at the Gemini North telescope in semester 2011A (program GN-2011A-Q-60) using the NIRI camera in combination with the ALTAIR adaptive optic (AO) system (Herriot et al., 2000). The primary stars themselves were used for wavefront sensing and the ALTAIR field lens was used to reduce the effects of anisoplanatism and achieve better image quality at separations of a few arc seconds. The camera was used, resulting in a pixel scale of and a field of view of .111As given on the instrument web page at http://www.gemini.edu/sciops/instruments/niri/imaging/pixel-scales-and-fov. The Cassegrain rotator was turned off during the observations, to match the setup used for earlier observations of the same stars, and thus the field of view orientation changed slowly during the sequences. For HIP 78530, we took observations with the filter, to complement similar observations made previously in , and and initially reported in Lafrenière et al. (2011). We also obtained observations of HIP 78530 in the narrowband filter (2.0975 m) for astrometric follow up as observations at three earlier epochs had already been obtained in this filter. For GSC 06214 and J1610–1913, we took images with the , , , and filters. The observation log is presented in table 1.
For all targets we used a pattern of five dither positions consisting of the centre and corners of a square of on one side. For most observations, the primary is too bright to get a good signal from the companion without saturating the detector. To obtain deeper images allowing more precise photometry of the companions, we thus obtained, at each dither position, a set comprising unsaturated images consisting of multiple co-additions of short integrations in fast, high read-noise mode, followed by one saturated image consisting of one long integration in slow, low read-noise mode. The saturated images can be readily registered to the unsaturated images and easily corrected in the saturated part using the properly scaled unsaturated images.
We also observed HIP 78530 and J1610–1913 in , still with the camera but without the use of AO. We observed the faint photometric standard star FS 140 (Leggett et al., 2003) shortly after the targets to calibrate the photometric measurements. For these observations, we used a pattern of five nod pairs with a separation of 8″, each pair being displaced from the preceding one by 2″. At each position we obtained 12 co-additions with an integration time of 0.75 s each, ensuring that the primary star was never saturated. This sequence was repeated three times for HIP 78530, with a pattern rotation of between each sequence. For J1610–1913, the sequence was executed only once.
We reduced the data using custom IDL routines. For the images obtained in the high read-noise mode, a striped noise pattern was often present and we removed it by proper median filtering. For the images taken in , , , and , we constructed a sky frame by taking the median of the images at all dither positions, after masking out the sources in each one. For the images in , we built the sky frame as the mean of the two images obtained at the preceding and following dither positions (also after masking out the sources). After subtraction of the sky frame, we divided the images by a normalized flat field, and we corrected the geometric distortion of the images using the prescription given on the instrument webpage.222The distortion is given by , where , is the uncorrected distance from the field centre in pixels, and is the corrected distance from the centre in pixels. From http://www.gemini.edu/sciops/instruments/niri/imaging/pixel-scales-and-fov. The reduced images at each dither position were then registered to place the primary star at their centre, de-rotated to a common field orientation, and their median was taken. The saturated region of the long-exposure images were finally replaced by the properly scaled unsaturated images. For improved consistency among all of our targets, we reprocessed the archival -, - and -band data for HIP 78530 B (Lafrenière et al., 2011).
2.2. Spectroscopy
The spectroscopy observations were made at the Gemini North telescope in the same program as the imaging, using the GNIRS spectrograph (Elias et al., 2006) in cross-dispersed (XD) spectroscopy mode with a -wide slit, the 10 lines mm-1 grating and the long blue camera with its LXD prism, resulting in a coverage from 0.885 m to 2.425 m, see observation log in table 1. The ALTAIR AO system was also used to improve the spatial resolution and image quality, and thus greatly reduce the contamination from the bright nearby primary at the position of the companion. Given the wide slit used, the spectral resolving power achieved is determined by the width of the AO-corrected point-spread function (PSF) ( 140–190 mas) and varied between 900 and 1300 depending on target and wavelength. We obtained three exposures of 100 to 360 s integration, depending on the source, at each of two nod positions along the slit (for sky subtraction). We observed the A0 telluric standard star HD 151787 (Houk & Smith-Moore, 1988) immediately after each target to determine and correct for the effect of the atmospheric and instrumental transmissions. Observatory standard calibration data (flat field, arc lamps) were obtained with each observation.
We reduced the data using custom IDL routines. First, we subtracted the exposures taken at two different nods in the slit to remove the majority of the background signal, resulting in parallel positive and negative signal traces. We then divided the frames by a normalized flat field, using a different lamp in the band than for the rest of the spectrum for saturation considerations. A few frames also presented a noise pattern of stripes that was removed by carefully applying 1D iterative median filtering for each quadrant separately. We then rectified the traces of each order using cubic interpolation. We next corrected a slight spectral shearing by rectifying atmospheric lines that were apparent on the frames before subtracting the two nod positions. With AO, the shape of the PSF is wavelength dependent. We thus fitted the trace independently for each spectral pixel along the spectrum. We fitted an analytic trace consisting of the sum of a Gaussian profile for its core and a Moffat profile for the wings. While fitting for the trace, we simultaneously fitted (and removed) the potential contribution from the primary star and any residual background signal. The contamination from the primary depends on the contrast and separation of the companion and is most important for G06214 B, with only 2 ″ separation. The flux from each nod position, cleaned from contamination and residual background signal, was extracted separately using the fitted trace as weight; the flux from the two positions were then summed together. The wavelengths were calibrated using an Ar arc lamp exposure and the different orders of the spectrum were combined by adjusting their overlapping sections. Then, we divided the target spectra by the total transmission function. The latter was determined from the spectrum of the telluric standard. Namely, the continuum of the standard star spectrum was modelled by a black body function and removed, while its hydrogen absorption lines were fitted by a Voigt profile over the appropriate wavelength ranges, and then divided out. The median of all individual spectra was taken as the final spectrum and their dispersion was used to estimate the uncertainties. Based on the achieved PSF FWHM, the effective resolving power in the band for the different spectra were for HIP 78530 B, for G06214 B and for J1610–1913 B.
3. ANALYSIS AND RESULTS
3.1. Photometry and astrometry
For each system, the position of the primary and companion was measured by fitting an elongated 2D gaussian function to their PSF. For saturated PSFs, the position from the preceding unsaturated frame was used. The flux ratio between the companion and primary was calculated using aperture photometry, with an aperture radius set to the radius at which the radial intensity profile of the companion falls below the background noise level. The contribution of the primary star flux inside the photometry aperture of the companion was estimated, and removed, in the following manner. First, an azimuthally symmetric median radial intensity profile of the central star was calculated and subtracted from the image. Then a similar profile was calculated for the companion in the residual image, and this profile was subtracted from the original image. This process was then repeated once to ensure that the radial profile of the primary was not biased by the companion. The flux measurement for the companion was performed on the original image to which we subtracted the modelled flux of the primary star, while the measurement for the primary was made on the original image minus the modelled flux of the companion. These measurements were performed on the combined images as well as on the individually reduced frames. The uncertainties on the separation, position angle and photometry of the companions were determined from the scatter of measurements from individual frames. The pixel scale, pixel, was taken from the instrument manual and the direction towards North was taken from the image headers. By comparing our 2011 measurements with measurements of the same systems made at earlier epochs, we noticed that our position angle values were systematically off by , based on previous measurements on 3 targets; we thus corrected our measurements for this systematic offset and included it in the position angle errors. The flux ratios between the primaries and companions are given in table 2, along with their angular separations and position angles.
| HIP 78530 B | J1610–1913 Ab | J1610–1913 B | G06214 B | |
|---|---|---|---|---|
| Angular separation (″) | ||||
| Position angle (deg)aaCorrected for a offset. | ||||
| (mag) | ||||
| (mag) | bbRemeasured from observations of Lafrenière et al. (2011). | |||
| (mag) | bbRemeasured from observations of Lafrenière et al. (2011). | |||
| (mag) | bbRemeasured from observations of Lafrenière et al. (2011). | |||
| (mag) | ||||
| (mag) | ccFrom Ireland et al. (2011). |
| Value | ||
|---|---|---|
| Parameter | Primary | Companion |
| (mag) | aaExtrapolated from a template spectrum (Pickles, 1998) scaled to the measured flux in other bands, see text for detail. | |
| (mag) | bbFrom 2MASS PSC (Skrutskie et al., 2006), converted to the MKO system with the equations in Carpenter (2001). | |
| (mag) | bbFrom 2MASS PSC (Skrutskie et al., 2006), converted to the MKO system with the equations in Carpenter (2001). | |
| (mag) | bbFrom 2MASS PSC (Skrutskie et al., 2006), converted to the MKO system with the equations in Carpenter (2001). | |
| (mag) | ||
| (mag)ccDereddened colors, see text for detail. | ||
| (mag)ccDereddened colors, see text for detail. | ||
| (mag)ccDereddened colors, see text for detail. | ||
| Spectral type | B9VddFrom Houk & Smith-Moore (1988). | M7 |
| (K) | 10 500eeFrom Lafrenière et al. (2011) and references therein. | 2700 |
| Distance (pc) | ffFrom van Leeuwen (2007). | |
| Projected separation (AU) | ||
| Mass () [5 Myr] | 2.5eeFrom Lafrenière et al. (2011) and references therein. | |
| Mass () [10 Myr] | 2.5eeFrom Lafrenière et al. (2011) and references therein. | |
| Value | |||
|---|---|---|---|
| Parameter | Primary | Secondary | Tertiary |
| (mag) | aaExtrapolated from a template spectrum (Pickles, 1998) scaled to the measured flux in other bands, see text for detail. | ||
| (mag) | bbResolved MKO photometry based on our measured contrast and unresolved 2MASS PSC photometry (Skrutskie et al., 2006), table 2, using the system conversion equations in Carpenter (2001). | ||
| (mag) | bbResolved MKO photometry based on our measured contrast and unresolved 2MASS PSC photometry (Skrutskie et al., 2006), table 2, using the system conversion equations in Carpenter (2001). | ||
| (mag) | bbResolved MKO photometry based on our measured contrast and unresolved 2MASS PSC photometry (Skrutskie et al., 2006), table 2, using the system conversion equations in Carpenter (2001). | ||
| (mag) | |||
| (mag) ccDereddened colors, see text for detail. | |||
| (mag) ccDereddened colors, see text for detail. | |||
| (mag) ccDereddened colors, see text for detail. | |||
| Spectral type | K7 ddFrom Preibisch et al. (2001). | M4 | M9 |
| (K) | 4000 | 3200 | 2500 |
| Distance (pc) | eeMean distance of USco from de Zeeuw et al. (1999), with uncertainties discussed in Ireland et al. (2011). | ||
| Proj. sep. (AU) | |||
| Mass () [5 Myr] | 0.77 ffFrom Kraus et al. (2008). | ||
| Mass () [10 Myr] | 0.77 ffFrom Kraus et al. (2008). | ||
| Value | ||
|---|---|---|
| Parameter | Primary | Companion |
| (mag) | aaExtrapolated from a template spectrum (Pickles, 1998) scaled to the measured flux in other bands, see text for detail. | |
| (mag) | bbFrom 2MASS PSC (Skrutskie et al., 2006), converted in MKO with equations in Carpenter (2001). | |
| (mag) | bbFrom 2MASS PSC (Skrutskie et al., 2006), converted in MKO with equations in Carpenter (2001). | |
| (mag) | bbFrom 2MASS PSC (Skrutskie et al., 2006), converted in MKO with equations in Carpenter (2001). | |
| (mag) | ||
| (mag)ccDereddened colors, see text for detail. | ||
| (mag)ccDereddened colors, see text for detail. | ||
| (mag)ccDereddened colors, see text for detail. | ||
| Spectral type | K7ddFrom Bowler et al. (2011). | M9 |
| (K) | ddFrom Bowler et al. (2011). | 2300 |
| Distance (pc) | eeMean distance of USco from de Zeeuw et al. (1999), with uncertainties discussed in Ireland et al. (2011). | |
| Projected separation (AU) | ||
| ddFrom Bowler et al. (2011). | ||
| Mass () [5 Myr] | ddFrom Bowler et al. (2011). | |
| Mass () [10 Myr] | ddFrom Bowler et al. (2011). | |
| Value | ||
|---|---|---|
| Parameter | Primary | Companion |
| (mag) | aaFrom 2MASS PSC (Skrutskie et al., 2006), converted to the MKO system with the equations in Carpenter (2001). | bbBased on the contrasts given in Lafrenière et al. (2008). |
| (mag) | aaFrom 2MASS PSC (Skrutskie et al., 2006), converted to the MKO system with the equations in Carpenter (2001). | bbBased on the contrasts given in Lafrenière et al. (2008). |
| (mag) | aaFrom 2MASS PSC (Skrutskie et al., 2006), converted to the MKO system with the equations in Carpenter (2001). | bbBased on the contrasts given in Lafrenière et al. (2008). |
| (mag)ccFrom Lafrenière et al. (2008). | ||
| (mag) | ||
| (mag) | ||
| (mag) | ||
| Spectral type | K7 VccFrom Lafrenière et al. (2008). | L4 |
| (K) | ccFrom Lafrenière et al. (2008). | |
| Distance (pc) | ddMean distance of USco from de Zeeuw et al. (1999), with uncertainties discussed in Ireland et al. (2011). | |
| Projected separation (AU) | ||
| ccFrom Lafrenière et al. (2008). | ||
| Mass () [5 Myr] | ccFrom Lafrenière et al. (2008). | |
| Mass () [10 Myr] | ccFrom Lafrenière et al. (2008). | |
The companion apparent magnitudes were computed from the measured contrast ratios in combination with the , and magnitudes of the primaries taken from 2MASS (Skrutskie et al., 2006). For the J1610–1913 system, the photometric measurements from 2MASS did not resolve the tight binary. We thus corrected the photometry of the primary according to our measured contrast for the tight binary. The 2MASS magnitudes were converted to the MKO system using the transformation equations from the online supplements333http://www.astro.caltech.edu/$∼$jmc/2mass/v3/transformations/. of Carpenter (2001). The -band magnitudes of the primaries were estimated from template spectra of the appropriate spectral type taken from the Pickles Atlas stellar spectral flux library444http://www.stsci.edu/hst/observatory/cdbs/pickles_atlas.html. (Pickles, 1998). Using the MKO filter profiles and zero points from Tokunaga & Vacca (2005) and online supplements555http://irtfweb.ifa.hawaii.edu/IRrefdata/iwafdv.html., the atlas spectra were scaled to fit our measured fluxes in the bands, and then integrated over the filter to get the synthetic -band flux, and thus the -band magnitude of the star. For the band, we measured the magnitudes of the primaries and companions directly from our images, using our observations of the faint photometric standard star FS 140 (Leggett et al., 2003) for calibration, as mentioned earlier. Tables 3, 4, 5, and 6 present the resulting photometry and colors for each system. The colors in these tables and in Figure 3, along with the spectra presented below, have been corrected for interstellar extinction using the -band absorption coefficients from Cardelli et al. (1989) and the ratio from Cox (2000), assuming . Carpenter et al. (2009) published extinction values of for HIP 78530, for J1610–1913 and , for J1609–2105. For G06214, Bailey et al. (2013) found that its extinction is consistent with , which we adopted. We also took the extinction into account when measuring the -band photometry using the procedure described above, by fitting extinction-corrected fluxes to the template spectra, calculating the synthetic -band magnitude, and then applying the proper correction to our measurement.
The new data for HIP 78530 B were used to further assess the common proper motion of this companion with its primary, as some doubts about its physical association were raised by Bailey et al. (2013), who mentioned that it could possibly be an early-M background star. At epoch 2011.2422, we measure a separation and position angle of and , respectively, which are consistent with the values of and measured by Lafrenière et al. (2011) for epoch 2008.3940. Over that time, the separation and position angle of a (stationary) background star would have decreased by and , respectively. Thus our new measurements indicate with increased significance ( 10) that the companion is co-moving with the primary. Moreover, the new spectrum we have acquired is inconsistent with the companion being an early-M background star (see Sections 3.2 and 4.1).
3.2. Spectroscopy
The newly obtained spectra of HIP 78530 B, G06214 B, and J1610–1913 B are shown in Figure 1. The spectrum of J1609–2105 b from Lafrenière et al. (2010) is also shown. The average per pixel signal-to-noise (S/N) ratios of our three spectra over the whole spectral range are 130 for J1610–1913 B, 60 for HIP 78530 B and 30 for G06214 B. The lower S/N of the latter is due to its lower brightness, combined with a relatively more important contamination from the primary. The spectra display the typical morphologies of young late-M dwarfs, with prominent water absorption bands. The spectra of the four objects also show a smooth gradation in all three spectral bands. From top (HIP 78530 B) to bottom (J1609–2105 b) in the figure, the -band spectrum shows increasingly deeper VO and FeH absorption bands. Furthermore, the slopes of the blue side of both the and bands become increasingly more pronounced, owing to stronger absorption by water vapor.
We used the method of K. Cruz et al. (in preparation; see Cruz & Núñez 2007) to assign spectral types to the objects presented here. The method consists of a band-per-band visual comparison with field, intermediate-gravity and very low-gravity spectroscopic templates that were constructed from a median combination of several spectra that were assigned the same spectral type and gravity class in the NIR. We verified that the classifications of Lodieu et al. (2007) and Allers & Liu (2013a), based on the H2O index from Allers et al. (2007) and the H2O-1, H2O-2 and FeH indices from Slesnick et al. (2004), generally agreed within one subtype (see Table 7). To summarize, we obtained spectral types of M7 , M9 , M9 , and L4 for HIP 78530 B, J1610–1913, G06214 B, and J1609–2105 b, respectively.
| Object | SpT | SpT (index) | |||
|---|---|---|---|---|---|
| Visual | H2OaaBT-S: BT-Settl, D-P:Drift-Phoenix | H2O-1bbRespectively the scores for FeH (highest of FeHZ and FeHJ), VOZ, alkali line (rounded mean of Na I and K I line scores, see Table 8), and -cont. | H2O-2bbRespectively the scores for FeH (highest of FeHZ and FeHJ), VOZ, alkali line (rounded mean of Na I and K I line scores, see Table 8), and -cont. | FeHbbRespectively the scores for FeH (highest of FeHZ and FeHJ), VOZ, alkali line (rounded mean of Na I and K I line scores, see Table 8), and -cont. | |
| HIP 78530 B | M7 | M7.4 0.5 | M8.9 1.2 | M7.5 0.5 | M6.5 1.5 |
| J1610–1913 B | M9 | M8.4 0.4 | M9.5 1.1 | M8.6 0.5 | M8.3 1.5 |
| G06214 B | M9 | M9.8 0.6 | L0.2 1.2 | M9.5 0.6 | M9.8 1.5 |
| J1609–2105 b | L4 | L2.9 1.0 | L2.6 1.2 | ||
| Object | SpT | EW (Å) [Gravity ScoreaaBT-S: BT-Settl, D-P:Drift-Phoenix] | |||
|---|---|---|---|---|---|
| Na I 1.138 m | K I 1.169 m | K I 1.177 m | K I 1.253 m | ||
| HIP 78530 B | M7 | 7.5 0.9 [ 1 ] | 1.2 0.8 [ 2 ] | 2.5 0.7 [ 2 ] | 2.2 0.6 [ 1 ] |
| J1610–1913 B | M9 | 5.2 0.6 [ 2 ] | 0.6 0.3 [ 2 ] | 1.0 0.3 [ 2 ] | 0.9 0.1 [ 2 ] |
| G06214 B | M9 | 8.7 1.2 [ 1 ] | 2.5 1.5 [ 2 ] | 5.1 1.3 [ 1 ] | 1.6 1.2 [ 2 ] |
| J1609–2105 b | L4 | [ n ] | [ n ] | [ n ] | [ n ] |
| Object | SpT | Index Values [Gravity ScoreaaBT-S: BT-Settl, D-P:Drift-Phoenix] | Gravity | |||||
|---|---|---|---|---|---|---|---|---|
| FeHZ | FeHJ | VOZ | -cont | ScorebbRespectively the scores for FeH (highest of FeHZ and FeHJ), VOZ, alkali line (rounded mean of Na I and K I line scores, see Table 8), and -cont. | Class | Visual | ||
| HIP 78530 B | M7 | 1.062 0.001 [ 1 ] | [ n ] | 1.072 0.002 [ n ] | 0.987 0.002 [ 1 ] | 1n21 | int-g | |
| J1610–1913 B | M9 | 1.053 0.001 [ 2 ] | 1.053 0.008 [ 2 ] | 1.115 0.002 [ n ] | 1.019 0.001 [ 2 ] | 2n22 | vl-g | |
| G06214 B | M9 | 1.136 0.005 [ 1 ] | 1.09 0.03 [ 2 ] | 1.232 0.005 [ n ] | 1.017 0.001 [ 2 ] | 2n22 | vl-g | |
| J1609–2105 b | L4 | [ n ] | 1.04 0.13 [ 2 ] | [ n ] | [ n ] | 2nnn | vl-g | |
We also applied the gravity classification scheme of Allers & Liu (2013a) for moderate-resolution spectra, which is based on the strength of the FeH, VOz, and Hcont spectral indices and the equivalent width of Na I and K I lines in the band at 1.138, 1.169, 1.177 and 1.253 m. A score of 0 is given to objects having a value within 1 from the mean value of the field dwarf sequence, a score of 1 or 2 designates intermediate and very low-gravity objects, respectively, where the dividing criterion is established to roughly separate objects with optical gravity classification of and , and the score is replaced by the symbol “n” when the spectrum does not cover the spectral range of the index or when the index is not appropriate for the spectral type of the object. Table 8 presents the equivalent widths and their respective gravity score for each alkali line. Under the scheme of Allers & Liu (2013a), these four equivalent width scores account for one fourth of the final gravity score, as for the two FeH indices. The spectral indices and the final gravity class (field, intermediate, or very low gravity) are presented in Table 9. For HIP 78530 B, we obtain a score of 1n21 for the FeH, VOz, Alkali lines and -cont indices, respectively, which classifies it as an intermediate-gravity object. J1610–1913 B and G06214 B are classified as very low-gravity objects, with both a scores of 2n22, respectively. Finally, J1609–2105 b is also classified as very low gravity, but with some reserve considering its score of 2nnn, the spectral range and low S/N preventing us from using all indices but FeHJ. The index-based gravity classes of all objects agree with our visual classification. The index-based FLD-G, INT-G, and VL-G classes defined by Allers & Liu (2013a) were constructed to correspond to the , and classes introduced by Kirkpatrick (2005) and Kirkpatrick et al. (2006), and that we used for our visual classification. We use the latter denomination throughout this work for simplicity.
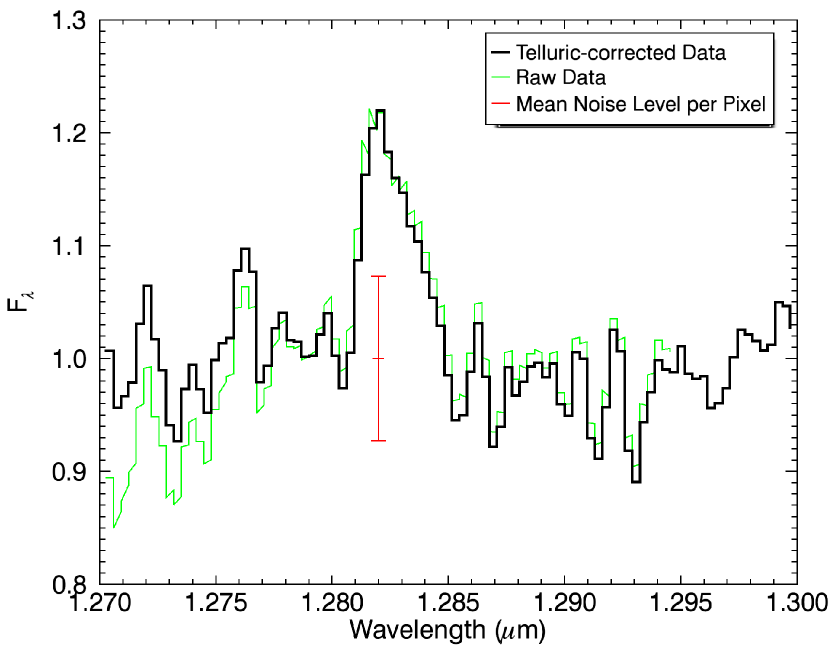
The Paschen- line at 1.282 m is detected in emission in the spectrum of G06214 B (see Figure 2). This emission line was previously observed and discussed in Bowler et al. (2011). Bowler et al. conclude that this emission is a sign of accretion or outflow, revealing the presence of a circumplanetary disk. The presence of a disk is consistent with the excess () observed by Ireland et al. (2011). Bowler et al. reported an equivalent width of Å, which is significantly higher than the value that we measure here Å). This might be a sign that the accretion or outflow is variable. We verified that this feature is present in our raw spectrum (Figure 2), rather that an artifact that could have been introduced by an improper correction of the Paschen- line in our A0 telluric standard star. The Brackett- line at 2.166 m is also present in emission in our spectrum of G06214 B (EW Å), providing further evidence for the presence of accretion or outflow.
4. COMPARISON WITH ATMOSPHERE MODELS
In the following sections, we compare the spectra of the wide companions in USco to the synthetic spectra from the BT-Settl (Allard et al., 2011) and the Drift-Phoenix (Helling et al., 2008; Witte et al., 2009, 2011) models. Synthetic spectra with ranging from 1500 K to 3500 K, ranging from 2.5 to 6.0, and solar metallicity were considered for the analysis and were binned to the same spectral resolution as our observed spectra. A first fit was performed by minimizing the goodness-of-fit statistic () described in Cushing et al. (2008). The minimization was performed 10 000 times, each time with a Gaussian distribution of random noise, corresponding to the uncertainties of our measured fluxes, added to our data in each resolution element. The fraction of the Monte Carlo simulations () in which the synthetic spectrum was identified as the best fitting model is then considered to evaluate the precision of the determination of and . The fit is evaluated for the whole spectrum at once, but also for each band separately. The best fits found through this method are summarized in Table 10. In addition, the same sets of synthetic spectra were visually compared with our observations. The use of solar metallicity models for USco is reasonable in light of the results of Mohanty et al. (2004), in particular see their section 4.3.3. We have nevertheless included BT-Settl models at higher metallicity () and verified that our main conclusions about the companions’ properties remained valid.
| Band | ModelaaBT-S: BT-Settl, D-P:Drift-Phoenix | HIP 78530 B | J1610–1913 B | G06214 B | J1609–2105 b | ||||||||
|---|---|---|---|---|---|---|---|---|---|---|---|---|---|
| BT-S | 2800 | 3.5 | 0.93 | 2600 | 3.5 | 1.00 | 2500bbThe VO band was omitted from the fit. | 3.5bbThe VO band was omitted from the fit. | 0.94 | 1600 | 3.5 | 1.00 | |
| D-P | 2900 | 5.0 | 1.00 | 2700 | 4.5 | 1.00 | 2500 | 5.0 | 0.83 | 1600 | 3.0 | 1.00 | |
| BT-S | 2900 | 4.5 | 0.61 | 2700 | 3.5 | 1.00 | 2600 | 3.5 | 0.50 | 1600 | 4.0 | 1.00 | |
| D-P | 2900 | 4.5 | 1.00 | 2600 | 3.5 | 1.00 | 2600ccThere is also a local minimum at 1700 K but this model is clearly not appropriate for other bands, we have thus restricted the range of temperatures for the fit to K. | 3.0ccThere is also a local minimum at 1700 K but this model is clearly not appropriate for other bands, we have thus restricted the range of temperatures for the fit to K. | 0.69 | 1800 | 3.0 | 1.00 | |
| BT-S | 2600 | 2.5 | 0.88 | 2700 | 3.5 | 1.00 | 2600 | 2.5 | 0.94 | 1700 | 4.0 | 1.00 | |
| D-P | 2800 | 4.5 | 0.67 | 2600 | 4.0 | 0.78 | 2300 | 3.0 | 1.00 | 1800 | 3.5 | 1.00 | |
| BT-S | 2600 | 3.0 | 1.00 | 2400 | 3.0 | 1.00 | 2100bbThe VO band was omitted from the fit. | 3.0 | 1.00 | 1600 | 3.5 | 1.00 | |
| D-P | 2600 | 3.5 | 1.00 | 2300 | 3.0 | 1.00 | 2100 | 3.0 | 1.00 | 1600 | 3.0 | 1.00 | |
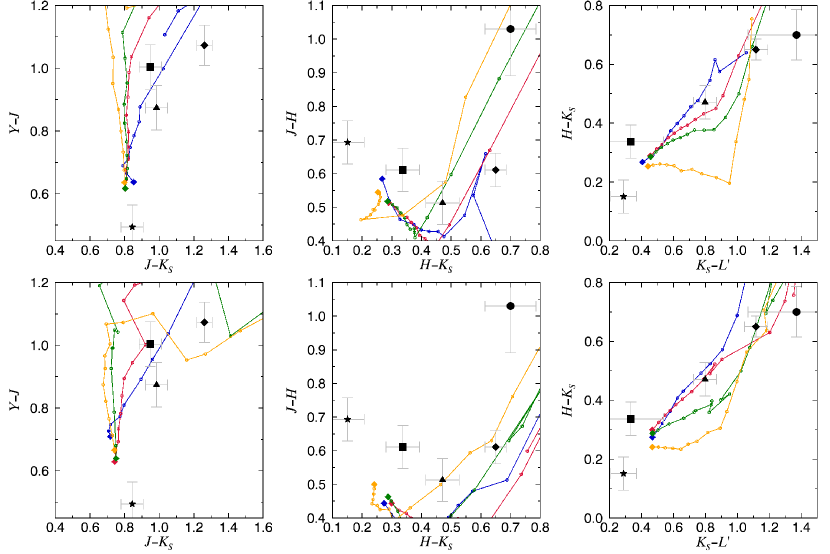
We also compare our photometric measurements to synthetic magnitudes calculated from the two sets of synthetic spectra. To compute the synthetic magnitudes, we used the filter profiles666http://irtfweb.ifa.hawaii.edu/~nsfcam/filters.html and the magnitude zero points from Tokunaga & Vacca (2005) and online supplements777http://irtfweb.ifa.hawaii.edu/IRrefdata/iwafdv.html. We compared the synthetic and observed magnitudes and determined the best-fit model by minimizing the over the bands. In Figure 3, we also compare the observed and model colors. As visible on the figure, the measured colors of the companions agree reasonably well with the colors expected from the models. In particular, the companions colors seem to roughly reproduce the shapes of the model curves. The only noteworthy discrepancy is a systematic offset of up to 0.1 mag in . The relative positions of the colors of the companions in the different color-color diagrams, when compared to the model curves, readily indicate the relative temperatures of the companions. From the two rightmost columns of the figure, we get, respectively from the hottest to the coldest, HIP 78530 B, J1610–1913 B, G06214 B and J1609–2105 b. This ordering is consistent with the spectral types presented above. In almost all panels of Figure 3, we can also see that the colors of the companions are closer to the models of low surface gravity, as expected for young objects. The only panel where this is not the case is vs , although it seems that this problem would disappear if the 0.1 mag systematic offset in mentioned earlier could be resolved.
The temperature estimates based on all of these analyses, along with comments on the agreement with the models, are discussed in Sections 4.1, 4.2, 4.3, and 4.4 for each object separately.
4.1. HIP 78530 B
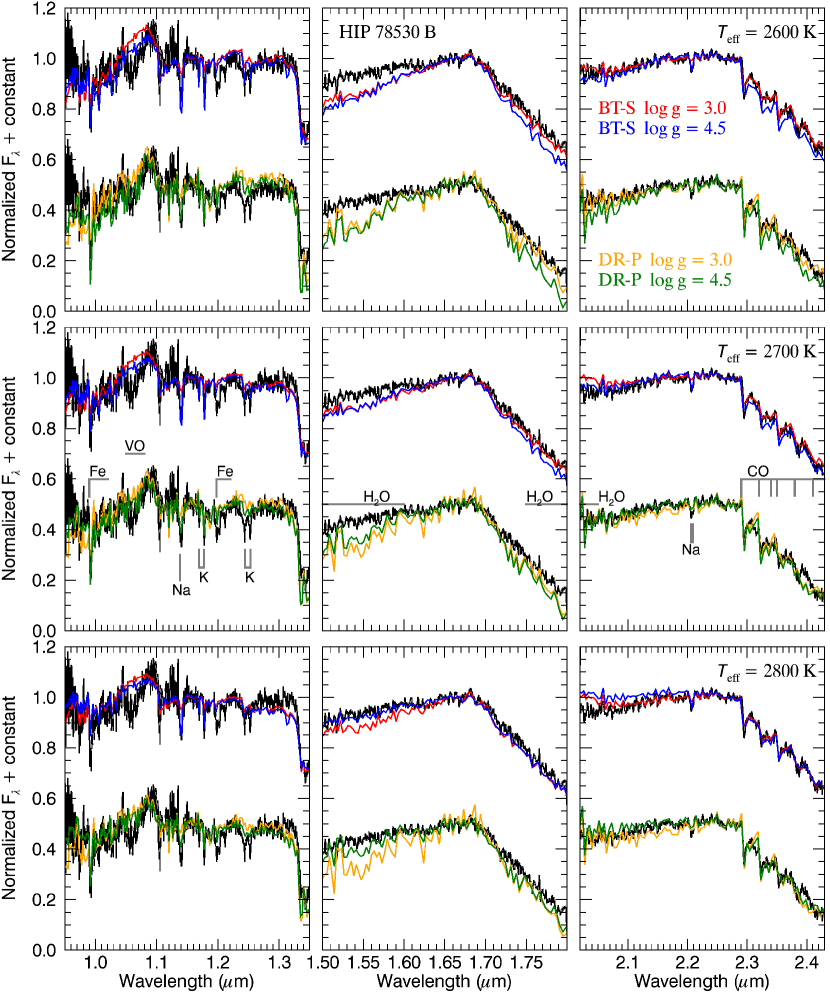
Figure 4 compares the observed spectrum of HIP 78530 B to synthetic spectra selected from the grid of BT-Settl and Drift-Phoenix models. For the BT-Settl models, the shape of both the and bands are better fitted by the 2600–2700 K models, at a low gravity () to match the CO lines depths, but the band is then too triangular. An effective temperature of 2800 K is needed to get the right slopes in band. The Drift-Phoenix models at 2600 K and low gravity are able to better reproduce the features in the band, particularly the VO band at 1.06 m. At higher temperatures (2800 K), this feature is not deep enough in the models. The band is well fitted in the 2600–2800 K temperature range, with a marginally better fit at 2600 K. For the band, a temperature even higher than 2800 K is needed to correctly fit the shape of the pseudo-continuum with the Drift-Phoenix models. Using the goodness-of-fit statistics (Table 10), the best fits for the individual bands are for 2600–2900 K, in good agreement with the above estimates, while it is 2600 K for the fit to the entire spectrum. As for the broadband photometry only, the best fit is achieved with of 2300–2700 K and . Considering all of these elements, we assign a temperature of K to HIP 78530 B.
The best fits discussed above occur for models at low surface gravity, in agreement with the young age of the region and with the values of gravity-sensitive spectral indices found earlier. In particular, the spectral indices for the FeH molecular bands at 0.998 m and 1.200 m are significantly weaker than those of field dwarfs, a sign of low surface gravity. As mentioned previously, the VO band at 1.06 m is gravity-sensitive. Systematically, the Drift-Phoenix models provide a much better fit of this feature than the BT-Settl model, although they do not significantly discriminate the surface gravity parameter. The depth of the CO molecular bands in the red part of the band does require a low gravity to be well fitted. The gravity-sensitive Na I doublet at 2.206 and 2.209 Å is clearly visible in the data, but a of 4.5 is not high enough for the models to reproduce its depth. The models are thus under predicting the depth on the Na feature.
Based on the photometry of HIP 78530 B, Bailey et al. (2013) estimated a temperature of 3300K–3400 K and a spectral type of M3, raising the possibility that the companion was instead a background star. While this higher temperature estimate could be consistent with the color of the companion, according to models, it would not be appropriate for the other colors (see Figure 3). Also, this estimate is inconsistent with our observed spectrum and the spectrum from Lafrenière et al. (2011). In addition, our observations show signs of low gravity, common proper motion (see 3.1), and a spectral type of M7. For all of these reasons, we rule out the possibility that this is a background star.
4.2. [PGZ2001] J161031.9-191305 B and Ab
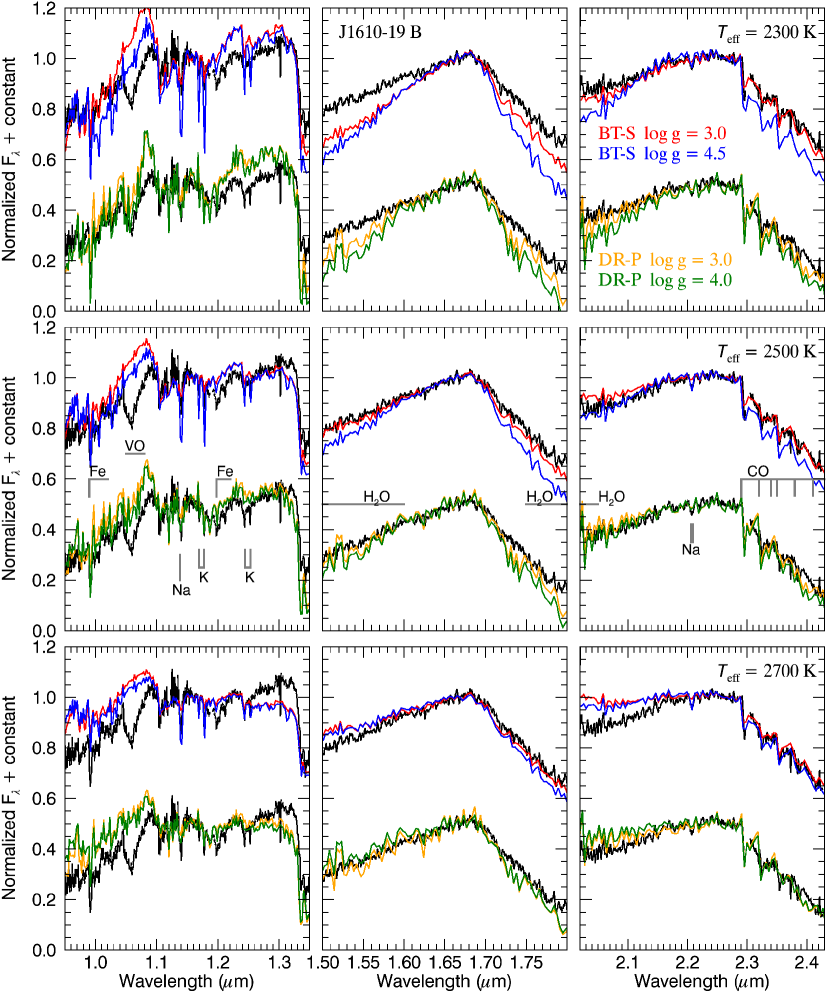
A comparison of the spectrum of J1610–1913 B with various model spectra is shown in Figure 5. The band is best fitted by the BT-Settl model at 2300 K, at low surface gravity (), and by the Drift-Phoenix model at 2500 K, for either surface gravities shown. Hotter models (2700 K) fail to match the blue side of this band. In the band, the best fit occurs for temperatures of 2500–2700 K, with a notably better fit at low surface gravity for 2700 K. In the band, the best fit of the pseudo-continuum as well as the depth of the water band at 1.33 m seems to take place at 2500 K, for either surface gravities shown, although the VO band at 1.06 m is not quite deep enough at this temperature in the models. The depth of the VO feature is best matched by the 2300 K Drift-Phoenix models, for either surface gravities, but then the fit is not as good in the other parts of the band. Again, the BT-Settl models fail to reproduce the VO band at any temperature or gravity. The best fits for the individual bands using the goodness-of-fit method (Table 10) are found for temperatures of 2600–2700 K, and the fit to the entire spectrum indicates a temperature of 2300–2400 K. All of these best fits occur for a equal to or less than 4.5. For the fit of the broadband magnitudes, after proper correction for extinction as mentioned previously, we get a temperature of 2300 K with a of 3.0 for both models; this is close to the simultaneous model fit result. Considering all of these values, we assign an effective temperature of K to J1610–1913 B. The spectral and the broadband photometry fits both favour a very low surface gravity for this object, in good agreement with the values of the FeH index and alkali lines equivalent widths calculated earlier.
We have not observed the closer-in companion (Ab) in the J1610–1913 system using spectroscopy, as getting a contamination-free spectrum of this object with a source 3 mag brighter at a separation of only 0.2 ″ is too challenging for the instrumental setup we used. Nevertheless, we have photometric measurements from our imaging and we can compare those with the models to assess its effective temperature. With the photometric points obtained, the best fit to the synthetic magnitudes would indicate an effective temperature of K with a of 3.5.
4.3. GSC 06214-00210 B
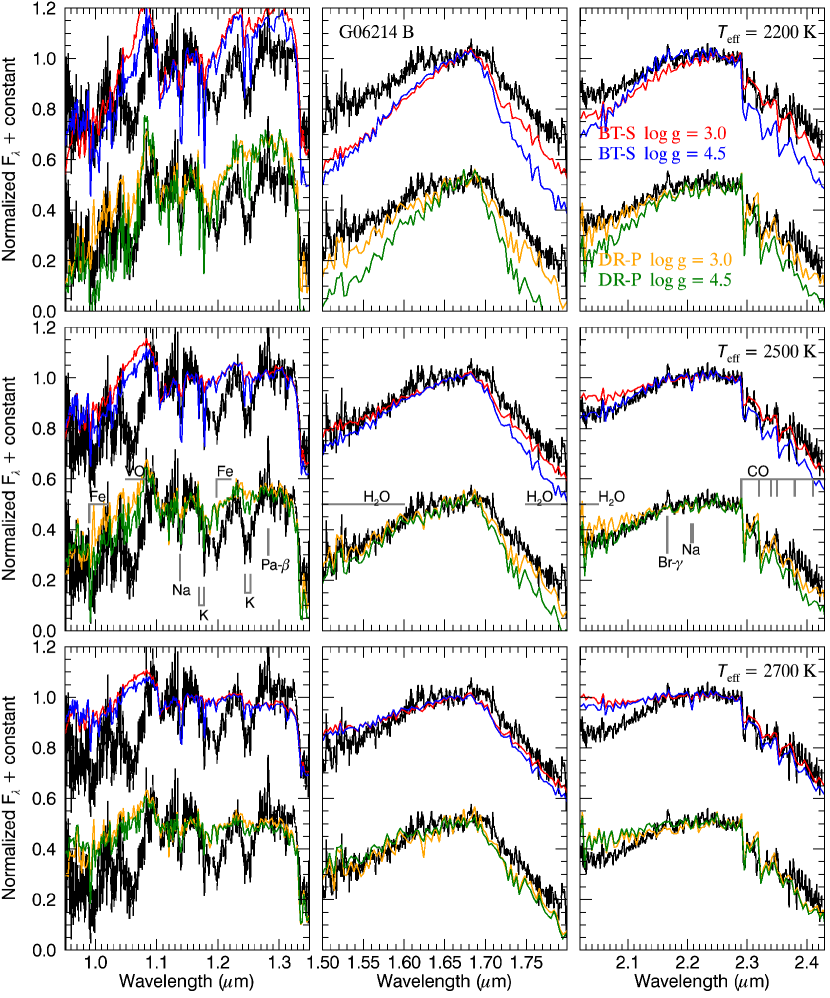
Figure 6 shows our GNIRS spectrum of G06214 B compared with a selection of models from the BT-Settl and Drift-Phoenix models. The band is best reproduced by models at 2200 K and low for both BT-Settl and Drift-Phoenix. For the bands, models of 2500–2700 K provide reasonable fits, with little effects from surface gravity. In the band, the VO and FeH (1.2 m) bands are better matched by the models at 2200 K, with Drift-Phoenix providing a much better fit than BT-Settl. The most important difference is the deeper water absorption band at 1.33 m for the models, as compared with the observations. The goodness-of-fit evaluation (Table 10) indicates temperatures of 2300–2600 K when applied to individual bands, and 2100 K when applied globally. The colors of this companion and the corresponding photometric magnitudes are in excellent agreement with the models for a temperature of 2200 K and very low . We assign a temperature of K to G06214 B.
Visually, the models with of 3.0 or less are in better agreement with the observed spectrum, especially in the band. The same result is obtained for the fit of the spectrum and the broad band fluxes. Also for this object, the depth of the gravity-sensitive K I doublet at 1.244 and 1.252 m in the models is insufficient to agree with the observations, even if properly degraded to the resolution of the observations.
4.4. 1RXS J160929.1–210524 b
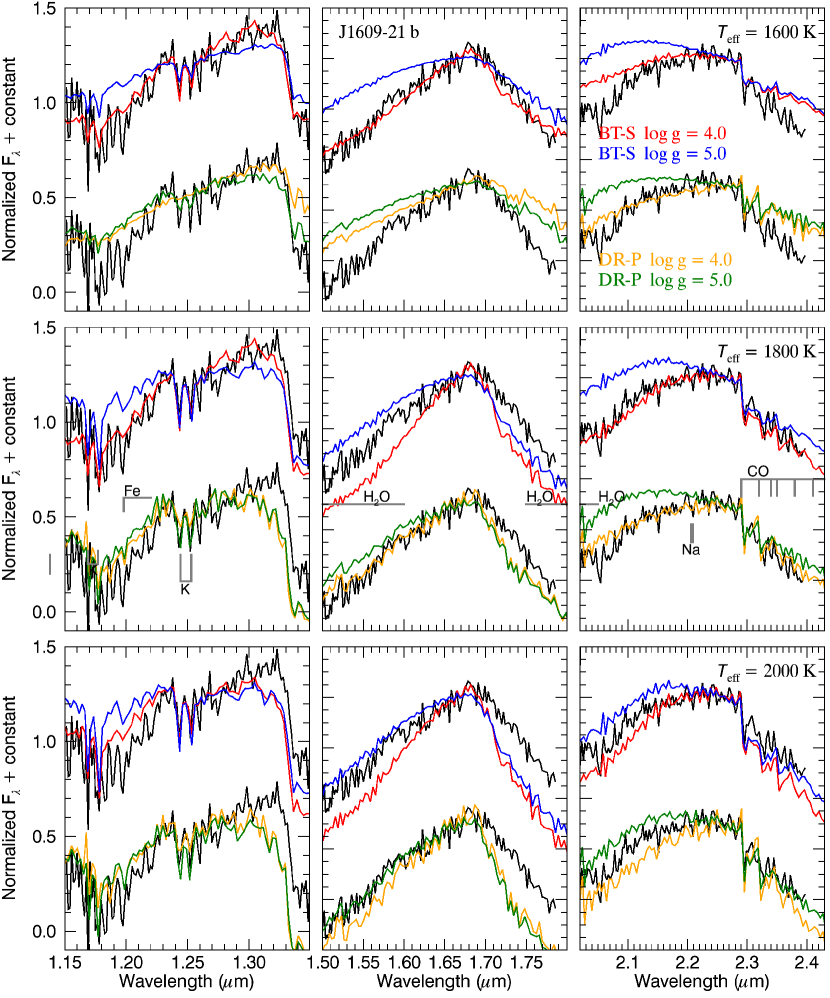
Figure 7 presents the NIFS band (Lafrenière et al., 2010) and NIRI and bands (Lafrenière et al., 2008) spectrum of J1609–2105 b in comparison to synthetic spectra with ranging from 1600 K to 2000 K, from both the BT-Settl and the Drift-Phoenix models. The lower-gravity () Drift-Phoenix model at 1800 K gives the overall best fit, although the red side of the band is a bit too low and the slope on the red side of the band is a bit too steep. The 1800 K BT-Settl model does not provide as good a fit as the 1800 K Drift-Phoenix model, particularly in the band where it is too peaked compared with the observed spectrum. At lower temperatures (=1600 K), both models clearly fail to reproduce the observations in all bands. At higher temperatures (=1800 K), the fits are not too bad for both models, although the water absorption band in is too strong in the models and the red side of the band is too steep. The goodness-of-fit evaluations (Table 10), both band-by-band and over the whole spectrum, generally agree on a temperature of 1600–1800 K and a of . Only the and bands fit a higher temperature of 1800 K with the Drift-Phoenix models. As for the broad band magnitudes, they yield a best-fit temperature of 1700 K for BT-Settl and 1800 K for Drift-Phoenix, in both cases with a of 3.0. We thus assign a temperature of K to J1609–2105 b. The spectral indices calculated earlier classified this object as having a very low gravity; this is in good agreement with the best fits with the models obtained here. However here again, the gravity-sensitive potassium lines in are not deep enough for the Drift-Phoenix model at lower gravity.
4.5. Mass estimates
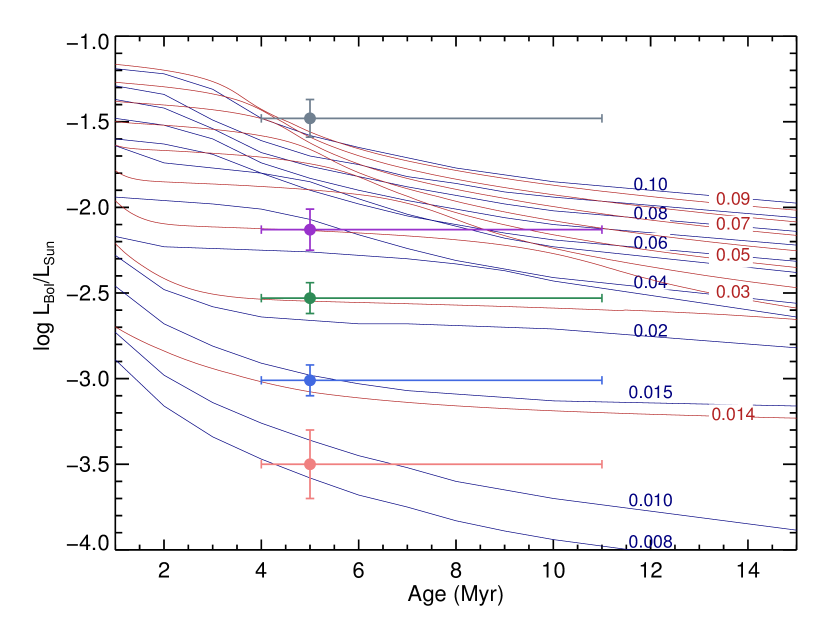
We have estimated the masses of the companions using two different approaches, comparing either their estimated bolometric luminosities or their estimated effective temperatures to the predictions of evolution models. We have used two sets of evolution models, the models from Burrows et al. (1997) and the models from Allard et al. (2013), the latter being based on the CIFIST2011 BT-Settl atmosphere models and the AMES-Cond isochrones (Baraffe et al., 2003). For the effective temperatures, we simply used the estimates presented in the previous section. For each object, a synthetic bolometric luminosity was computed for every synthetic spectrum within the range of plausible temperature and gravity determined previously. This was done by first scaling the model spectrum to the observed flux level, by minimizing the between the synthetic magnitudes of the model spectrum and the ones we observed, and then by integrating the entire model spectrum and converting the total flux to luminosity using the mean USco distance of 145 pc (de Zeeuw et al., 1999) and 14 pc uncertainty (as discussed in Ireland et al. 2011). The error on luminosity is chosen to be large enough to include all the temperatures and gravity ranges described above and encompass results from both atmosphere models. The resulting luminosities are included in Tables 3, 4, 5, and 6; see also Figure 8 for a comparison of these luminosities with the prediction of evolution models.
Estimating the masses based on the calculated luminosities and an age of 5 Myr, we obtain for J1609–2105 b, for G06214 B, for J1610–1913 B, for HIP 78530 B, and for J1610 Ab. For an age of 10 Myr, the corresponding masses are respectively, , , , , and . The impact of the revised older age proposed by Pecaut et al. (2012) is relatively small for the three lowest mass objects, G06214 B and HIP78530 B being in a relatively stable deuterium burning phase. The impact for J1610–1913 Ab and B would be more important.
With the objects ordered according to increasing effective temperature, as above, it is obvious that something is off for J1610–1913 B. Namely, its luminosity is much higher than expected. Indeed, J1610–1913 B has an estimated temperature of 2500 K, cooler than HIP 78530 B at 2700 K, but its luminosity () comes out significantly brighter than that of HIP 78530 B (). A possible reason for this discrepancy is that the true (unknown) distance of J1610–1913 B differs largely from the mean distance of USco members. If its true distance were toward the closer side of the association, at 115 pc, rather than the assumed distance of pc, then its luminosity would be closer to . Another possibility is that the wide companion is itself an unresolved equal-mass binary. That would bring its intrinsic luminosity down by a factor of 2, to . Both effects combined would be more than enough to solve the problem. Other possibilities could include an unusually large radius, for example. Aller et al. (2013) also observed and reported the J1610–1913 B over-luminosity problem, and concluded that J1610–1913 B does not look coeval with its host star. They also concluded the same for the five companions they observed in USco. In our study, however, we observed an over-luminosity only for J1610–1913 B, the other companions luminosities being consistent with the 5–10 Myr isochrones in a luminosity–effective temperature diagram. If the luminosity problem mentioned above for this companion were to be resolved, the difference between its mass determined at 5 and 10 Myr would be largely reduced.
On the other hand, the masses can be estimated directly from the evolution models by using the temperatures evaluated from the model atmosphere fits presented above. Specifically, we can find the masses for which the evolution models predict these temperatures. With this method, for an age of 5 Myr we obtain for J1609–2105 b, for G06214 B, for J1610–1913 B, for HIP 78530 B, and for J1610 Ab. For an age of 10 Myr, the corresponding masses are respectively, , , , , and . The errors encompass temperatures estimates from both sets of atmosphere models considered here. The masses of J1609–2105 b and G06214 B are approximately the same when evaluated from luminosity or temperature, and they agree well with the estimates made by Lafrenière et al. (2010) and Ireland et al. (2011) respectively. The mass of J1610–1913 B is significantly lower when estimated using only its temperature, as was expected from the above comments. The difference between the two estimates exceeds the quoted uncertainties, probably indicating that there is a real problem with the brightness of this object. For HIP 78530 B, this result is significantly higher than the previous value, but it comes with a large uncertainty and the two values can be reconciled. The mass of the close binary J1610–1913 Ab seems to be in the stellar regime using both methods.
5. DISCUSSION AND CONCLUDING REMARKS
Our homogeneous comparison between the observed spectra of young substellar companions in USco and synthetic spectra from the BT-Settl and Drift-Phoenix models has revealed some interesting and systematic trends. First, the models do not succeed in reproducing the details of the spectra across the 1–2.4 m range simultaneously. As noted by Cushing et al. (2008) in the case of early L-type dwarfs in the field, the best fit in the individual bands typically occur for models of different temperatures. At the temperatures providing the best fits in the and bands, the synthetic spectra have significantly steeper slopes in than the observed spectra, both at the blue and red ends. An even more evident feature that is not reproduced by the models is the VO band in . The VO absorption band at 1.06 m is only reproduced by the Drift-Phoenixs models, and generally only at a temperature slightly lower than the temperature leading to the best fit in other parts of the band. The BT-Settl models simply fail to reproduce this VO feature at any reasonable range of and . Similar conclusions about the VO feature and the fit of the band for the BT-Settl models were reported by Allers & Liu (2013b). The alkali K I and Na I lines in the observed spectra are systematically stronger than in the models. Note however that we have not carefully investigated the effect of metallicity on these features. The excellent agreement of the spectra of free floating BD in Upper Scorpius with our spectra (see Figure 1) provides yet another argument that the above trends are common features of young BDs and point to a real shortcoming of the models.
Also, the best temperature estimates obtained by matching the broadband magnitudes and colors of the objects to synthetic magnitudes from the models are systematically lower, by 200 K on average, than the temperatures obtained from band-by-band comparisons of the spectra with models. This is also the case for the spectral fit applied globally (simultaneously across the near-infrared range), as it too is affected by the broad band colors.
Beyond their use for testing atmosphere and evolution models, the wide low-mass substellar companions studied here are of high interest for the study of planet and star formation. In principle, such low mass companions could form like stars, through the collapse and fragmentation of a pre-stellar core, or as planets within a circumstellar disk, but their combination of low mass and wide separation poses a challenge to both processes. A formation in-situ within the circumstellar disk of the primary would require an unusually large disk, but a formation within a disk closer to the primary followed by outward migration (from dynamical interactions) would be possible. The low-mass substellar companions studied here have a mass representing only 0.75–4% of the mass of their primaries. If these companions actually formed like stars, then it would imply that the fragmentation process can produce objects having only about 1% of the mass of the primary star. In any case, further observations of these systems using high-contrast imaging techniques and radial velocity to search for additional companions would be useful to help understand their origin. For example, if they formed within a disk and were ejected outward, then a more massive object would likely reside in the system at a much smaller separation.
References
- Allard et al. (2011) Allard, F., Homeier, D., & Freytag, B. 2011, in ASP Conf. Ser. 448, 16th Cambridge Workshop on Cool Stars, Stellar Systems, and the Sun, ed. C. Johns-Krull, M. K. Browning, & A. A. West (San Francisco, CA: ASP), 91
- Allard et al. (2013) Allard, F., Homeier, D., Freytag, B., Schaffenberger, W., & Rajpurohit, A. S. 2013, Memorie della Societa Astronomica Italiana, 24, 128
- Allard et al. (2012) Allard, F., Homeier, D., Freytag, B., & Sharp, C. M. 2012, EAS Publications Series, 57, 3
- Aller et al. (2013) Aller, K. M., Kraus, A. L., Liu, M. C., et al. 2013, The Astrophysical Journal, 773, 63
- Allers & Liu (2013a) Allers, K. N., & Liu, M. C. 2013a, The Astrophysical Journal, 772, 79
- Allers & Liu (2013b) —. 2013b, MmSAI, 84, 1089
- Allers et al. (2007) Allers, K. N., Jaffe, D. T., Luhman, K. L., et al. 2007, The Astrophysical Journal, 657, 511
- Bailey et al. (2013) Bailey, V., Hinz, P. M., Currie, T., et al. 2013, The Astrophysical Journal, 767, 31
- Baraffe et al. (2003) Baraffe, I., Chabrier, G., Barman, T. S., Allard, F., & Hauschildt, P. H. 2003, Astronomy and Astrophysics, 402, 701
- Binks & Jeffries (2013) Binks, A. S., & Jeffries, R. D. 2013, Monthly Notices of the Royal Astronomical Society: Letters, -1, L192
- Bowler et al. (2011) Bowler, B. P., Liu, M. C., Kraus, A. L., Mann, A. W., & Ireland, M. J. 2011, The Astrophysical Journal, 743, 148
- Burrows et al. (1997) Burrows, A., Marley, M., Hubbard, W. B., et al. 1997, The Astrophysical Journal Supplement, 491, 856
- Cardelli et al. (1989) Cardelli, J. A., Clayton, G. C., & Mathis, J. S. 1989, The Astrophysical Journal, 345, 245
- Carpenter (2001) Carpenter, J. M. 2001, The Astronomical Journal, 121, 2851
- Carpenter et al. (2009) Carpenter, J. M., Mamajek, E. E., Hillenbrand, L. A., & Meyer, M. R. 2009, The Astrophysical Journal, 705, 1646
- Carson et al. (2013) Carson, J., Thalmann, C., Janson, M., et al. 2013, The Astrophysical Journal, 763, L32
- Cox (2000) Cox, A. N. 2000, Allen’s Astrophysical Quantities, 4th edn. (New York: Springer)
- Cruz & Núñez (2007) Cruz, K. K., & Núñez, A. 2007, in Cool Stars, Department of Astrophysics, American Museum of Natural History, Central Park West at 79th Street, New York, NY 10034, USA ; Department of Physics & Astronomy, Hunter College, 695 Park Avenue, New York, NY 10065, USA, Barcelona
- Cushing et al. (2008) Cushing, M. C., Marley, M. S., Saumon, D., et al. 2008, The Astrophysical Journal, 678, 1372
- Cutri et al. (2003) Cutri, R. M., Skrutskie, M. F., van Dyk, S., et al. 2003, VizieR On-line Data Catalog: II/246. Originally published in: University of Massachusetts and Infrared Processing and Analysis Center, 2246
- Skrutskie et al. (2006) Skrutskie, M. F., Cutri, R. M., Stiening, R., et al. 2006, AJ, 131, 1163
- De Geus (1992) De Geus, E. J. 1992, Astronomy and Astrophysics, 262, 258
- de Zeeuw et al. (1999) de Zeeuw, P. T., Hoogerwerf, R., de Bruijne, J. H. J., Brown, A. G. A., & Blaauw, A. 1999, The Astronomical Journal, 117, 354
- Elias et al. (2006) Elias, J. H., Joyce, R. R., Liang, M., et al. 2006, in Astronomical Telescopes and Instrumentation, ed. I. S. McLean & M. Iye (SPIE), 62694C
- Helling et al. (2008) Helling, C., Dehn, M., Woitke, P., & Hauschildt, P. H. 2008, The Astrophysical Journal, 675, L105
- Herriot et al. (2000) Herriot, G., Morris, S., Anthony, A., et al. 2000, Proceedings of the Society of Photo-Optical Instrumentation Engineers (SPIE), 4007, 115
- Houk & Smith-Moore (1988) Houk, N., & Smith-Moore, M. 1988, Michigan Catalogue of Two-dimensional Spectral Types for the HD Stars. Vol. 4 (Ann Arbor, MI: Univ. of Michigan)
- Ireland et al. (2011) Ireland, M. J., Kraus, A., Martinache, F., Law, N., & Hillenbrand, L. A. 2011, The Astrophysical Journal, 726, 113
- Kirkpatrick (2005) Kirkpatrick, J. D. 2005, Annu. Rev. Astro. Astrophys., 43, 195
- Kirkpatrick et al. (2006) Kirkpatrick, J. D., Barman, T. S., Burgasser, A. J., et al. 2006, ApJ, 639, 1120
- Kraus et al. (2008) Kraus, A. L., Ireland, M. J., Martinache, F., & Lloyd, J. P. 2008, The Astrophysical Journal Supplement, 679, 762
- Kuzuhara et al. (2013) Kuzuhara, M., Tamura, M., Kudo, T., et al. 2013, The Astrophysical Journal, 774, 11
- Lafrenière et al. (2011) Lafrenière, D., Jayawardhana, R., Janson, M., et al. 2011, The Astrophysical Journal, 730, 42
- Lafrenière et al. (2008) Lafrenière, D., Jayawardhana, R., & van Kerkwijk, M. H. 2008, The Astrophysical Journal, 689, L153
- Lafrenière et al. (2010) —. 2010, The Astrophysical Journal, 719, 497
- Lagrange et al. (2010) Lagrange, A. M., Bonnefoy, M., Chauvin, G., et al. 2010, Science, 329, 57
- Leggett et al. (2003) Leggett, S. K., Hawarden, T. G., Currie, M. J., et al. 2003, Monthly Notices of the Royal Astronomical Society, 345, 144
- Lodieu et al. (2007) Lodieu, N., Hambly, N. C., Jameson, R. F., & Hodgkin, S. T. 2007, Monthly Notices of the Royal Astronomical Society, 383, 1385
- Marois et al. (2008) Marois, C., Macintosh, B., Barman, T., et al. 2008, Science, 322, 1348
- Mohanty et al. (2004) Mohanty, S., Basri, G., Jayawardhana, R., et al. 2004, ApJ, 609, 854
- Neuhäuser & Schmidt (2012) Neuhäuser, R., & Schmidt, T. O. B. 2012, arXiv, 1201, 3537
- Oppenheimer et al. (1995) Oppenheimer, B. R., Kulkarni, S. R., Matthews, K., & Nakajima, T. 1995, Science, 270, 1478
- Pecaut et al. (2012) Pecaut, M. J., Mamajek, E. E., & Bubar, E. J. 2012, The Astrophysical Journal, 746, 154
- Pickles (1998) Pickles, A. J. 1998, The Publications of the Astronomical Society of the Pacific, 110, 863
- Preibisch et al. (2002) Preibisch, T., Brown, A. G. A., Bridges, T., Guenther, E., & Zinnecker, H. 2002, The Astronomical Journal, 124, 404
- Preibisch et al. (2001) Preibisch, T., Guenther, E., & Zinnecker, H. 2001, The Astronomical Journal, 121, 1040
- Preibisch & Zinnecker (1999) Preibisch, T., & Zinnecker, H. 1999, The Astronomical Journal, 117, 2381
- Rameau et al. (2013) Rameau, J., Chauvin, G., Lagrange, A. M., et al. 2013, The Astrophysical Journal, 772, L15
- Reggiani & Meyer (2011) Reggiani, M. M., & Meyer, M. R. 2011, The Astrophysical Journal, 738, 60
- Slesnick et al. (2004) Slesnick, C. L., Hillenbrand, L. A., & Carpenter, J. M. 2004, The Astrophysical Journal, 1610, 1045
- Song et al. (2012) Song, I., Zuckerman, B., & Bessell, M. S. 2012, The Astronomical Journal, 144, 8
- Tokunaga & Vacca (2005) Tokunaga, A. T., & Vacca, W. D. 2005, The Publications of the Astronomical Society of the Pacific, 117, 1459
- van Leeuwen (2007) van Leeuwen, F. 2007, Astronomy and Astrophysics, 474, 653
- Witte et al. (2011) Witte, S., Helling, C., Barman, T., Heidrich, N., & Hauschildt, P. H. 2011, Astronomy and Astrophysics, 529, 44
- Witte et al. (2009) Witte, S., Helling, C., & Hauschildt, P. H. 2009, Astronomy and Astrophysics, 506, 1367