Weak Emission Line Quasars in the Context of a Modified Baldwin Effect
Abstract
We investigate the relationship between the rest-frame equivalent width (EW) of the C IV broad-emission line, monochromatic luminosity at rest-frame 5100 Å, and the H-based Eddington ratio in a sample of 99 ordinary quasars across the widest possible ranges of redshift () and bolometric luminosity ( erg s-1). We find that EW(C IV) is primarily anti-correlated with the Eddington ratio, a relation we refer to as a modified Baldwin effect (MBE), an extension of the result previously obtained for quasars at . Based on the MBE, weak emission line quasars (WLQs), typically showing EW(C IV)10 Å, are expected to have extremely high Eddington ratios. By selecting all WLQs with archival H and C IV spectroscopic data, nine sources in total, we find that their H-based Eddington ratios are typical of ordinary quasars with similar redshifts and luminosities. Four of these WLQs can be accommodated by the MBE, but the other five deviate significantly from this relation, at the level, by exhibiting C IV lines much weaker than predicted from their H-based Eddington ratios. Assuming the supermassive black-hole masses in all quasars can be determined reliably using the single-epoch H-method, our results indicate that EW(C IV) cannot depend solely on the Eddington ratio. We briefly discuss a strategy for further investigation into the roles that basic physical properties play in controlling the relative strengths of broad-emission lines in quasars.
Subject headings:
galaxies: active – galaxies: nuclei – quasars: emission lines – quasars: general1. INTRODUCTION
The classical ‘Baldwin effect’ is an anti-correlation between the rest-frame equivalent width (EW) of a broad-emission line region (BELR) line and quasar luminosity, first observed for the C IV line (Baldwin, 1977). This anti-correlation is stronger and steeper for BELR lines with higher ionization potentials (; Dietrich et al., 2002), but it involves substantial scatter, hampering its use as a cosmological probe (Osmer & Shields, 1999). Considerable effort has been invested in attempts to minimize this scatter, using partial-correlation and principal-component analyses involving emission-line as well as broad-band spectroscopic data (e.g., Wilkes et al., 1999; Shang et al., 2003), but the exact cause of the Baldwin effect remains elusive. A dependence on the shape of the continuum-source spectral energy distribution (SED; Zheng & Malkan, 1993), cosmic evolution (Green et al., 2001), or the supermassive black-hole mass (; Xu et al., 2008) being the primary physical driver for the EW-luminosity anti-correlation are among the explanations proposed for this effect. It had also been speculated that the Baldwin effect depends largely on the normalized accretion rate, in terms of the Eddington ratio, , where is the bolometric luminosity and is the Eddington luminosity (e.g., Brotherton & Francis, 1999; Wills et al., 1999; Bachev et al., 2004).
Using the empirical BELR size-luminosity relation (Kaspi et al., 2005; Bentz et al., 2009) and assuming the BELR gas is virialized, takes a general expression of the form ; the Eddington ratio can therefore be expressed as , where and FWHM typically correspond to the monochromatic luminosity at rest-frame 5100 Å and the full width at half maximum intensity of the broad H111Attempts to determine from high-ionization BELR lines, such as C iv, may yield unreliable results, since the line profiles are complicated by a non-virial (i.e., ‘wind’) component (e.g., Baskin & Laor, 2005; Richards et al., 2011; Shen & Liu, 2012; Trakhtenbrot & Netzer, 2012). line, respectively (see also, e.g., Laor, 1998).
Utilizing optical spectroscopic data for a sample of 81 quasars with erg s-1 at from Boroson & Green (1992), and for which high-quality archival UV spectroscopic data were available, Baskin & Laor (2004, hereafter BL04) found a significant anti-correlation between EW(C IV) and H-based ; they did not find a significant correlation between EW(C IV) and monochromatic luminosity at rest-frame 3000 Å. BL04 argued that most of the scatter in the classical Baldwin effect is produced by a range of at a given , driven by a range in FWHM(H). This scatter is minimized considerably when a combination of FWHM(H) and luminosity, i.e., the Eddington ratio, is employed, thus strengthening the anti-correlation with EW(C IV). BL04 claimed that the classical Baldwin effect is only a secondary effect since, typically, more luminous quasars also have higher Eddington ratios. Dong et al. (2009) report a similar result for the EW of the Mg II doublet using Mg II-based determinations for a sample of 2092 active galactic nuclei at , suggesting that the Baldwin effect is governed by .
In this work, we extend the BL04 analysis by including quasars with erg s-1 at that have H spectral information from near-infrared (NIR) spectroscopy as well as C IV information from optical spectroscopy in order to test whether the EW(C IV)- anti-correlation, hereafter the modified Baldwin effect (MBE), remains strong across the widest possible ranges of redshift, luminosity, and . In particular, the extension of this relationship to higher redshifts and luminosities is required in order to test the hypothesis that the extreme weakness of the C IV lines in weak emission line quasars (WLQs), that typically have EW(C IV) Å (e.g., Fan et al. 1999, Diamond-Stanic et al. 2009), is due to extremely high accretion rates in these sources (see, e.g., Leighly et al. 2007a; Shemmer et al. 2009, 2010). In Section 2 we describe the properties and spectroscopic measurements of our quasar sample, including WLQs, and in Section 3 we present the results of a correlation analysis involving EW(C IV), monochromatic luminosity, and . In Section 4 we discuss the implications of our results for quasars in general and for WLQs in particular, and in Section 5 we summarize our main conclusions. Throughout this paper, wavelengths, frequencies, and EWs are given in the rest-frame of each source. Complete source names are given in Tables and Figures and abbreviated names are given throughout the text. Luminosity distances were computed using the standard cosmological model ( km s-1 Mpc-1; e.g., Spergel et al., 2007).
2. Sample Selection and Data Analysis
Our high-redshift quasar sample is drawn from the Shemmer et al. (2004, hereafter S04) and Netzer et al. (2007, hereafter N07) studies involving high-quality NIR spectra of 29 and 15 sources, respectively, covering the H spectral region in the range. We exclude six radio-loud quasars (RLQs) from S04,222S04 have, erroneously, identified [HB89] 2132014 as a RLQ, instead of [HB89] 2126158. They also identified [HB89] 0329385 and UM 645 as RLQs; however, as we mention below, these two sources have and are thus considered radio-intermediate quasars. [HB89] 0123257, [HB89] 0504030, [HB89] 2126158, TON 618, UM 632, and [HB89] 2254024, as sources having radio-loudness values of (where is the ratio between the flux densities at 5 GHz and 4400 Å; Kellermann et al. 1989), based on the NRAO VLA Sky Survey (NVSS; Condon et al. 1998) for the first three of these sources and the Faint Images of the Radio Sky at Twenty Centimeters (FIRST) survey (Becker et al. 1995) for the latter three. We also exclude [HB89] 1246057 (from S04) and SDSS J21030600 (from N07) as broad-absorption line (BAL) quasars, based on Osmer & Smith (1977) and Gibson et al. (2009), respectively. The exclusion of RLQs and BAL quasars is intended to minimize potential effects of continuum boosting (see below; e.g., Meusinger & Balafkan, 2014) and absorption biases (e.g., BL04), respectively, that may result in systematic underestimations of EW(C IV).
Relevant properties of our final sample of 36 ‘ordinary’ quasars (i.e., type 1 quasars that are not radio loud and that do not have BALs) at high redshift, hereafter the HIZ sample, are given in Table 2. We also note in Table 2 that nine of the HIZ sources are identified as BAL quasars in Trump et al. (2006) but not in the more recent BAL quasar catalog of Gibson et al. (2009); we consider these sources as non-BAL quasars and they are retained in our sample. For each source in the HIZ sample, we obtain the systemic redshift (), Å, and best-fit FWHM(H) values from Tables 1 and 2 of S04 and from Table 2 of N07. We derive the value for each source following Equation (2) of Shemmer et al. (2010),
| (1) |
and using Equation (21) of Marconi et al. (2004) to compute , the luminosity-dependent bolometric correction to Å, which is in the range for our sources.
Thirty of the HIZ sources have rest-frame UV spectra in electronic form that are publicly available; 23 spectra have been obtained from the Sloan Digital Sky Survey (SDSS; York et al. 2000) and seven spectra have been obtained from the Two-Degree Field quasar redshift survey (2QZ; Croom et al. 2004); the spectral response of each 2QZ spectrum has been determined as described in S04. For each spectrum, we fitted the Å Å spectral region around the C IV line using a linear continuum and two Gaussian profiles, describing the entire profile of the C IV line. The two Gaussian profiles are used for least-squares fitting purposes only and thus are not intended to represent two physically distinct emission regions. The linear continuum was determined based on average flux densities obtained in 10 Å-wide intervals centered on Å and Å. The EW of the C IV line in each source has been computed using the sum of the fluxes in each best-fit Gaussian profile and the best-fit linear continuum underlying the emission line. The errors on EW(C IV) were estimated by repeating the fitting procedure but, for each spectrum, the two steepest continua were considered, based on the value of the flux density in each of the two continuum intervals, i.e., fitting between and .
For the six HIZ sources that lack publicly available spectra, we obtained the EW(C IV) values from the literature. The EW(C IV) values for all of the HIZ sources are given in Table 2. For the 23 sources from our HIZ sample that have SDSS spectra and for which we have measured EW(C IV) values, such values (not shown in Table 2) can also be obtained from the spectral measurements of Shen et al. (2011). For 17 of these sources, the EW(C IV) values from Shen et al. (2011) agree with our measurements, within the errors. The spectra of six sources for which the discrepancies between our measurements and the Shen et al. (2011) values are % have, on average, lower signal-to-noise ratios than the spectra of the 17 sources in which such discrepancies are . Replacing our EW(C IV) measurements with the corresponding Shen et al. (2011) values for these six sources does not alter significantly any of our subsequent results.
| Quasar | Å | FWHM(H) | EW(C iv) | Optical Ref.aaSource of rest-frame optical data, including , Å, and FWHM(H). | EW(C iv) Ref.ddUnless stated otherwise, the EW(C iv) value adopted for analysis in this work is obtained from the first reference for each source. | ||
|---|---|---|---|---|---|---|---|
| (erg s-1) | (km s-1) | (Å) | |||||
| (1) | (2) | (3) | (4) | (5) | (6) | (7) | (8) |
| 2QZ J001221.1283630 | 2.339 | 46.26 | 1915 | 2.82 | 32.3 | 1 | 2 |
| 2QZ J002830.4281706 | 2.401 | 46.58 | 4833 | 0.63 | 39.8 | 1 | 2 |
| UM 667 | 3.132 | 46.28 | 3135 | 1.08 | 27.82.8 | 1 | 3 |
| LBQS 01090213 | 2.349 | 46.80 | 5781 | 0.56 | 1 | 4 | |
| 2QZ J023805.8274337 | 2.471 | 46.57 | 3437 | 1.22 | 25.8 | 1 | 2 |
| SDSS J024933.42083454.4bbIdentified as a BAL quasar in Trump et al. (2006) but not in Gibson et al. (2009). | 2.491 | 46.38 | 5230 | 0.43 | 51.40.2 | 1 | 2, 5 |
| SDSS J025438.37002132.8bbIdentified as a BAL quasar in Trump et al. (2006) but not in Gibson et al. (2009). | 2.456 | 45.85 | 4164 | 0.38 | 66.6 | 6 | 2, 5 |
| [HB89] 0329385 | 2.435 | 46.71 | 7035 | 0.34 | 42.46.4ccThe EW(C iv) value is the average of the two values given in the references; error bar is taken as one half the difference between the two values. | 1 | 7, 8 |
| SDSS J083630.55062044.8 | 3.397 | 45.53 | 3950 | 0.30 | 14.9 | 6 | 2, 5 |
| SDSS J095141.33013259.5bbIdentified as a BAL quasar in Trump et al. (2006) but not in Gibson et al. (2009). | 2.411 | 45.55 | 4297 | 0.26 | 87.8 | 6 | 2, 5 |
| SDSS J100428.43001825.6 | 3.046 | 46.44 | 3442 | 1.06 | 45.4 | 1 | 2, 5 |
| SDSS J100710.70042119.1 | 2.363 | 45.17 | 5516 | 0.11 | 55.0 | 6 | 2, 5 |
| SDSS J101257.52025933.2bbIdentified as a BAL quasar in Trump et al. (2006) but not in Gibson et al. (2009). | 2.434 | 45.73 | 3892 | 0.39 | 34.9 | 6 | 2, 5 |
| SDSS J105511.99020751.9 | 3.391 | 45.70 | 5424 | 0.19 | 49.9 | 6 | 2, 5 |
| SDSS J113838.26020607.2 | 3.352 | 45.79 | 4562 | 0.30 | 26.1 | 6 | 2, 5 |
| SDSS J115111.20034048.3bbIdentified as a BAL quasar in Trump et al. (2006) but not in Gibson et al. (2009). | 2.337 | 45.58 | 5146 | 0.19 | 47.2 | 6 | 2, 5 |
| SDSS J115304.62035951.5 | 3.426 | 46.04 | 5521 | 0.27 | 12.8 | 6 | 2, 5 |
| SDSS J115935.64042420.0 | 3.451 | 45.92 | 5557 | 0.23 | 45.3 | 6 | 2, 5 |
| SDSS J125034.41010510.5bbIdentified as a BAL quasar in Trump et al. (2006) but not in Gibson et al. (2009). | 2.397 | 45.41 | 5149 | 0.16 | 72.30.2 | 6 | 2, 5 |
| [HB89] 1318113 | 2.306 | 46.89 | 4150 | 1.19 | 32.06.4 | 1 | 8 |
| [HB89] 1346036 | 2.370 | 46.88 | 5110 | 0.78 | 19.81.2ccThe EW(C iv) value is the average of the two values given in the references; error bar is taken as one half the difference between the two values. | 1 | 7, 8 |
| SDSS J135445.66002050.2 | 2.531 | 46.49 | 2627 | 1.92 | 21.1 | 1 | 2, 5 |
| UM 629 | 2.460 | 46.56 | 2621 | 2.08 | 36.0 | 1 | 2, 5 |
| UM 642bbIdentified as a BAL quasar in Trump et al. (2006) but not in Gibson et al. (2009). | 2.361 | 46.29 | 3925 | 0.69 | 27.8 | 1 | 2, 5 |
| UM 645 | 2.257 | 46.31 | 3966 | 0.69 | 39.6 | 1 | 2, 5 |
| SBS 1425606bbIdentified as a BAL quasar in Trump et al. (2006) but not in Gibson et al. (2009). | 3.202 | 47.38 | 3144 | 3.55 | 44.7 | 1 | 2, 5 |
| SDSS J144245.66024250.1 | 2.356 | 46.03 | 3661 | 0.60 | 53.7 | 6 | 2, 5 |
| SDSS J153725.36014650.3 | 3.452 | 45.98 | 3656 | 0.57 | 34.5 | 6 | 2, 5 |
| SDSS J170102.18612301.0bbIdentified as a BAL quasar in Trump et al. (2006) but not in Gibson et al. (2009). | 2.301 | 46.34 | 5760 | 0.34 | 18.7 | 1 | 2, 5 |
| SDSS J173352.22540030.5 | 3.428 | 47.00 | 3078 | 2.44 | 22.1 | 1 | 2, 5 |
| SDSS J210258.22002023.4 | 3.328 | 45.79 | 7198 | 0.12 | 42.6 | 6 | 2, 5 |
| [HB89] 2132014 | 3.199 | 45.77 | 2505 | 0.98 | 36.43.6 | 1 | 9 |
| 2QZ J221814.4300306 | 2.389 | 46.54 | 2986 | 1.57 | 47.4 | 1 | 2 |
| 2QZ J222006.7280324 | 2.414 | 47.22 | 5238 | 1.07 | 20.71.5 | 1 | 2 |
| 2QZ J231456.8280102 | 2.400 | 46.31 | 3459 | 0.91 | 73.2 | 1 | 2 |
| 2QZ J234510.3293155 | 2.382 | 46.32 | 3908 | 0.72 | 47.6 | 1 | 2 |
We complement the HIZ sample with a subset of 63 ordinary quasars from BL04, following the exclusion of five BAL quasars, PG 0043039, PG 2112059 (Jannuzi et al., 1998), PG 1001054 (Brandt et al., 2000), PG 1411442 (Malkan et al., 1987), and PG 1416121 (Turnshek & Grillmair, 1986), as well as 13 RLQs (with ), PG 0003158, PG 0007106, PG 1048090, PG 1100772, PG 1103006, PG 1226023, PG 1302102, PG 1512370, PG 1545210, PG 1704608, PG 2209184, PG 2251113, and PG 2308098 (Boroson & Green, 1992). For each of the 63 BL04 sources, we obtain the redshift and FWHM(H) information from Table 1 and Table 2 of Boroson & Green (1992), respectively, and EW(C IV) values are obtained from Table 1 of BL04. The Å values for the BL04 sources, given in Table 1 of BL04, are converted to Å values, assuming an optical continuum of the form (e.g., Vanden Berk et al., 2001) and correcting the luminosity distances based on our adopted cosmological parameters (see Section 1). The Eddington ratios of the BL04 sources are determined using Equation 1.
| Quasar | Å | FWHM(H) | EW(C iv) | Optical Ref.aaSource of rest-frame optical data, including , Å, and FWHM(H). | EW(C iv) Ref.bbThe EW(C iv) value adopted for analysis in this work is obtained from the first reference for each source. | ||
|---|---|---|---|---|---|---|---|
| (erg s-1) | (km s-1) | (Å) | |||||
| (1) | (2) | (3) | (4) | (5) | (6) | (7) | (8) |
| SDSS J083650.86142539.0 | 1.749 | 45.93 | 2880 | 0.87 | 1 | 1, 2 | |
| SDSS J094533.98100950.1 | 1.683 | 46.17 | 4278 | 0.51 | 1 | 1, 2 | |
| SDSS J114153.34021924.3 | 3.55 | 46.55 | 5900 | 0.41 | 3 | 4 | |
| SDSS J123743.08630144.9 | 3.49 | 46.35 | 5200 | 0.42 | 3 | 4, 2 | |
| SDSS J141141.96140233.9 | 1.754 | 45.64 | 3966 | 0.34 | 1 | 1, 2 | |
| SDSS J141730.92073320.7 | 1.716 | 45.91 | 2784 | 0.92 | 1 | 1, 2 | |
| SDSS J144741.76020339.1 | 1.430 | 45.56 | 1923 | 1.33 | 1 | 1 | |
| SDSS J152156.48520238.5 | 2.238 | 47.14 | 5750 | 0.81 | 5 | 5, 2 | |
| PHL 1811 | 0.192 | 45.56 | 1943 | 1.30 | 6.6 | 6 | 6 |
In order to test the hypothesis that WLQs are quasars with extremely high Eddington ratios (e.g., Shemmer et al. 2009, 2010), we select all the WLQs for which accurate H properties (such as FWHM and EW) are available from the literature. For the purpose of this work, we consider all optically-selected type 1 quasars that i) have radio-loudness values of , ii) do not show BAL troughs in their rest-frame UV spectra, and iii) have EW(C IV)10 Å as WLQs. The third criterion follows from the fact that Å marks the threshold on the low end of lognormal fits to distributions of EW(C IV) values for quasars at ; i.e., of quasars at this redshift range have EW(C IV) Å (e.g., Diamond-Stanic et al. 2009; Wu et al. 2011, 2012; Plotkin et al. 2015).333There is tentative evidence that the fraction of WLQs is considerably larger than 0.15% of the entire quasar population at (see, e.g., Fan et al. 2006; Bañados et al. 2014). We caution that these selection criteria likely result in a heterogenous group of quasars, and we do not expect, a priori, a common origin for the weakness of the C IV BELR line in all such sources. Our WLQ sample of nine sources includes SDSS J08361425, SDSS J14111402, SDSS J14170733, SDSS J14470203 (Plotkin et al. 2010, 2015), SDSS J09451009 (Hryniewicz et al. 2010; Plotkin et al. 2015), SDSS J11410219, SDSS J12376301 (Diamond-Stanic et al., 2009; Shemmer et al., 2010), SDSS J15215202 (Just et al., 2007; Wu et al., 2011), and PHL 1811 (Leighly et al. 2007a, 2007b). Table 2 presents the , Å, FWHM(H), (determined using Equation 1), and EW(C IV) values for our WLQ sample. For five SDSS sources from the WLQ sample, the EW(C IV) values from either Diamond-Stanic et al. (2009) or Plotkin et al. (2015) are consistent, within the errors, with the values obtained from Shen et al. (2011); Shen et al. (2011) do not provide EW(C IV) measurements for SDSS J11410219 and SDSS J14470203. For SDSS J15215202, Shen et al. (2011) give EW(C IV)=, which is a factor of smaller than the value reported in Wu et al. (2011); see Table 2.
Finally, we note that our adoption of as the radio-loudness threshold, instead of the conventional (and more conservative) threshold of (e.g., Kellermann et al. 1989), is intended to exclude only sources that are more representative of the RLQ population (Ivezić et al., 2002), for which the potential effects of continuum boosting are expected to be more pronounced. Our HIZ, BL04, and WLQ samples include four sources ([HB89] 0329385, UM 645, SDSS J17335400, and SDSS J21020020), three sources (PG 1211143, PG 1309355, and PG 1425267), and one source (SDSS J11410219), respectively, with .
3. Results
We plot EW(C IV) versus Å and for the BL04 and HIZ samples in Fig. 1, and present the respective Spearman-rank correlation coefficients () and chance probabilities () in Table 3. Our results for the BL04 sample indicate that EW(C IV) and are significantly anti-correlated (i.e., ), whereas no significant correlation is observed between EW(C IV) and Å, consistent with the BL04 finding. For the HIZ sample, there is no significant correlation between EW(C IV) and either or Å. The lack of an EW(C IV)- Å anti-correlation in our HIZ sample, as might have been expected from the classical Baldwin effect, may be due to obtaining C IV and Å from two different and non-contemporaneous spectra for each source, as well as including different sources for C IV data with different measurement techniques (see Table 2). We do find, however, a significant anti-correlation between EW(C IV) and Å for the HIZ sources, consistent with the Baldwin (1977) result. When the BL04 and HIZ samples are combined, both Å and are significantly anti-correlated with EW(C IV), although the anti-correlation with is substantially stronger and it is stronger than the EW(C IV)- anti-correlation for the BL04 sample alone ( drops from to ), thus bolstering the BL04 results. We also note that, when replacing either Å or by source redshift, the above correlations with EW(C IV) weaken considerably. These results indicate that the MBE is more pronounced at lower luminosities and thus lower redshifts, where several low-luminosity sources with relatively high Eddington ratios are observed (Fig. 1). At high redshift, it is difficult to obtain high-quality spectral information for low-luminosity quasars. This practical limitation results in a strong dependence between and , and thus relatively high- sources have narrow ranges of both and , which may also explain why we do not detect a significant EW(C IV)- anti-correlation for the HIZ sample alone. In fact, the BL04 sample spans the 0.011 range, while the HIZ sample spans only the 0.11 range.
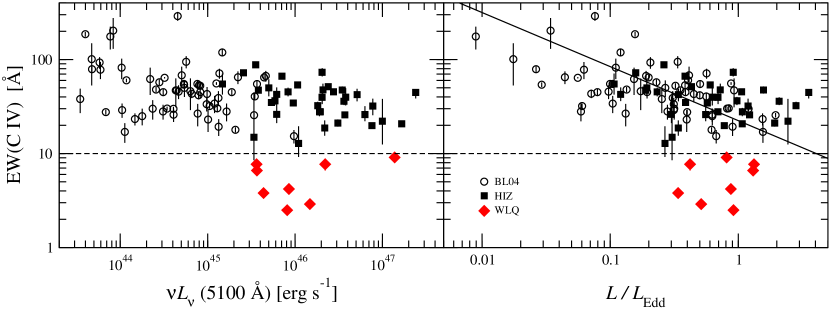
Fig. 1 also shows that WLQs, not included in any of the correlations, appear as outliers in these relations. To quantify the deviation of WLQs from the EW(C IV)- anti-correlation, we fitted a linear model to the [EW(C IV)] and () values of sources from the combined BL04 and HIZ samples. A standard minimization, weighted by the errors on [EW(C IV)], yielded an unsatisfactory fit (with ), indicating that either a linear model does not provide the best fit, the error bars on [EW(C IV)] are underestimated, or that additional scatter in the data must be taken into account. Assuming a linear model with , we find an additional scatter in the [EW(C IV)] values of dex (see, e.g., Tremaine et al., 2002; Kaspi et al., 2005); this scatter is much larger than the typical measurement errors on [EW(C IV)]. One likely source for this scatter stems from the fact that the C IV and H spectral information are obtained from different datasets and are non-contemporaneous. But as we discuss in Section 4, additional physical parameters may also contribute to this scatter. We account for this potential intrinsic scatter by using the bivariate correlated errors and scatter method (BCES; Akritas & Bershady, 1996) for performing the linear regression. Since a derivation of the Eddington ratio involves a typical uncertainty of dex, we assign to all the () values of the BL04 and HIZ samples homoscedastic errors of 0.3 dex (cf. Section 3.2.2 of Shemmer et al., 2008). The BCES Bisector best-fit relation for the BL04 and HIZ samples,
| (2) |
is plotted in the right panel of Fig. 1. We cross-checked the above BCES Bisector relation against the results from a linear-regression analysis using the maximum-likelihood estimate method of Kelly (2007). This method results in a flatter slope (-0.410.08) and a roughly similar intercept (1.440.04), but the slope is highly sensitive to the uncertainties assumed on () in the sense that the best-fit relation steepens as the errors increase beyond 0.3 dex. We adopt the more conservative BCES Bisector relation since, as shown below, this provides more stringent constraints on the WLQ sample.
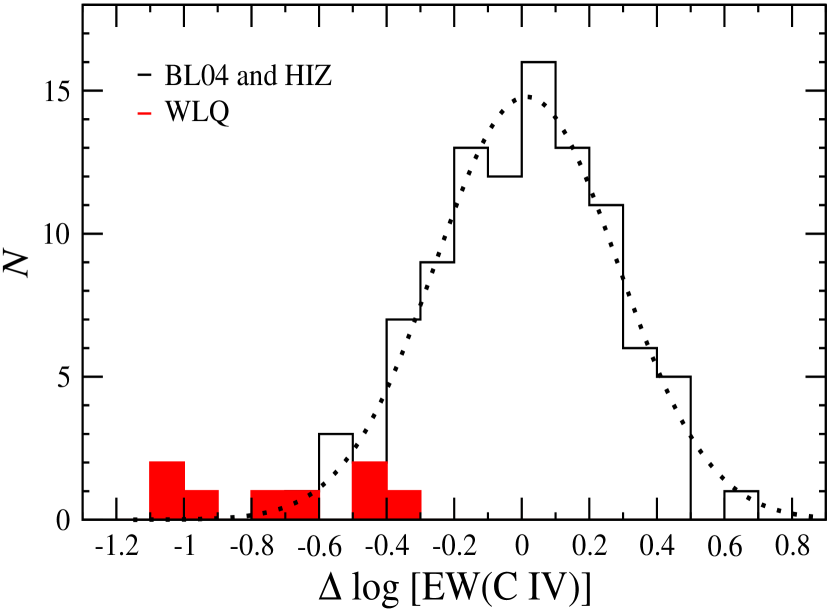
In Fig. 2 we plot a distribution of the differences between the observed [EW(C IV)] values and those predicted from the values of the sources, based on Equation 2. The distribution of these residuals, [EW(C IV)], for the BL04 and HIZ samples is roughly symmetric with zero mean and extreme values of dex. The best-fit Gaussian model to this distribution gives dex and dex. All sources from the WLQ sample lie at below the mean of this Gaussian distribution and five of these lie at (Fig. 2). The three WLQs with the largest (less negative) residuals ( [EW(C IV)] dex), PHL 1811, SDSS J15215202, and SDSS J14470203, overlap with the residuals of the combined BL04 and HIZ samples (although SDSS J15215202 will lie below the threshold if we adopt the Shen et al. 2011 EW measurement); we discuss these sources further in Section 4.
4. Discussion
In this work, we expanded the BL04 parameter space by including sources having the highest possible redshifts and luminosities, for which high-quality spectral information for C IV and H is available, in order to test whether the relative strength of C IV depends primarily on . We find that, for ordinary quasars across the 1043 Å1047 erg s-1 and 0.011 ranges, the scatter in the Baldwin effect is minimized when replaces monochromatic luminosity, thus extending the EW(C IV)- anti-correlation from BL04, i.e., the MBE, by almost two orders of magnitude in luminosity. However, we also find no significant correlations between EW(C IV) and either Å or when only high-redshift and high-luminosity sources are considered; this is mainly a consequence of additional scatter introduced by using diverse data sets and the strong dependence between Å and at high redshift. We also investigate how WLQs fit into this picture and whether they have exceptionally high Eddington ratios. We find that, in general, the H-based Eddington ratios of WLQs are within the norm when compared to ordinary quasars with similar redshifts and luminosities (see, e.g., Tables 2 and 2), and that most WLQs deviate considerably from the EW(C IV)- anti-correlation, suggesting that the MBE may not be applicable to all quasars. If the strong deviation of these WLQs is due to selection effects, then low- sources with EW(C IV) Å Å are required in order to cause the necessary steepening in the MBE for accommodating additional WLQs. It will be interesting to see whether the emerging population of high-EW(C IV) quasars at high redshift would produce such an effect (e.g., Ross et al., 2014).
The fact that most WLQs do not follow the MBE may, instead, bring into question the reliability of determining values in WLQs and perhaps in ordinary quasars as well. Our linear regression analysis already indicates a trend of a steeper best-fit EW(C IV)- relation as the assumed uncertainties on increase. Such a steepening may accommodate some, but perhaps not all, WLQs in the MBE. The standard, single-epoch H-method for obtaining and , briefly outlined in Section 1 and given in Equation 1, respectively, is likely too simplistic, and may involve uncertainties much larger than 0.3 dex (as we assume in Section 3) as well as systematic uncertainties. One such systematic uncertainty may be a consequence of orientation bias (see, e.g., Shen & Ho, 2014). In this scenario, sources viewed close to pole-on exhibit narrower BELR lines, and thus their actual () values should be higher (lower). If WLQs suffer from orientation bias, then their Eddington ratios should be even smaller than those in Table 2, resulting in a larger deviation from the MBE. Orientation bias is, therefore, an unlikely explanation for this deviation. A different method of determining Eddington ratios in WLQs is required to test whether these ratios are considerably larger than the respective H-based values. The hard-X-ray photon index () is one such indicator that can be used for cross-checking with H-based values (e.g., Shemmer et al., 2008). To this end, such a comparison has been made for two WLQs, PHL 1811 and SDSS J11410219; for both sources the X-ray-based value is consistent with the H-based value (see, Leighly et al. 2007b and Shemmer et al. 2010, respectively). Based on Equation 2, WLQs are expected to have 4, which would render extremely steep hard-X-ray spectra with (Shemmer et al., 2008). X-ray spectroscopy of a statistically meaningful sample of WLQs may therefore provide a robust test of the hypothesis that WLQs are sources with extremely high Eddington ratios.
| Correlation | Sample | |||
|---|---|---|---|---|
| EW(C iv)- (5100 Å) | BL04 | 63 | ||
| EW(C iv)- | BL04 | 63 | ||
| EW(C iv)- (5100 Å) | HIZ | 36 | ||
| EW(C iv)- | HIZ | 36 | ||
| EW(C iv)- (5100 Å) | BL04 and HIZ | 99 | ||
| EW(C iv)- | BL04 and HIZ | 99 |
Note. — The last three columns represent the number of sources in each correlation, the Spearman-rank correlation coefficient, and the chance probability, respectively.
Alternatively, WLQs may be pointing to the fact that additional physical properties may play a role in determining the relative strength of the C IV line. From a chronological perspective, the classical Baldwin effect (Baldwin, 1977), observed for high-redshift quasars (for practical reasons), included substantial scatter which, as we explain in Section 3, could not have been effectively minimized by replacing the luminosity with the Eddington ratio. Mainly low-luminosity sources with high Eddington ratios, e.g., narrow-line Seyfert 1 galaxies (NLS1s), led BL04 to conclude that is the primary physical parameter governing the relative strength of C IV. NLS1s deviate considerably from the classical Baldwin effect, but are accommodated by the MBE. In this work, we show that most of our WLQs deviate considerably from the MBE (and from the classical Baldwin effect), revealing that the relative strength of C IV may not depend solely on for all quasars. In this respect, WLQs are analogous to NLS1s by calling for more scrutiny into the parameters controlling BELR line strengths in quasars.
BL04 explored additional observables that may further reduce the scatter in the MBE. For example, they found that the combination of and the EW of the [O III] narrow emission line provided the strongest anti-correlation with EW(C IV). Only one of our WLQs, SDSS J14470203, has [O III] emission lines tentatively detected; the spectra of the other four WLQs from Plotkin et al. (2015) do not cover the [O III] lines. Our other four WLQs, SDSS J11410219, SDSS J12376301, SDSS J15215202, and PHL 1811 (as well as about a quarter of the sources from the HIZ sample; see Netzer et al. 2004; N07) have tight upper limits on EW([O III]). While this may be consistent with the general trend of weaker C IV lines in sources with weaker [O III] emission (see BL04 and references therein), the limited [O III] statistics prevent us from testing whether this observable can explain part or all of the WLQ deviation. We note, however, that the relative strength of [O III] as well as other observables studied by BL04 may all be governed primarily by the Eddington ratio.
Additional parameters that may affect the relative strength of the C IV line can be split broadly into properties of the i) SED, and ii) BELR. A high Eddington ratio results in a softer, UV-peaked SED, and this may naturally explain relatively weak C IV lines due to the paucity of highly ionizing photons; this model has been suggested for explaining the unusual properties of PHL 1811 (e.g., Leighly et al. 2007a). It is interesting to note that PHL 1811, its high-redshift ‘analog’, SDSS J15215202 (Wu et al., 2011), as well as SDSS J14470203 which Plotkin et al. (2015) consider a ‘borderline’ WLQ (or, an extreme ‘wind-dominated’ quasar), appear to follow the MBE (within ; see Section 3). These sources may be different than the rest of the WLQs in our sample in the sense that the Eddington ratio alone may explain their weak C IV lines.444Although this does not necessarily imply that these three sources belong to a single quasar subclass. In particular, they differ in their X-ray properties; SDSS J14470203 and SDSS J15215202 exhibit an effective power-law photon index () of and , respectively, in the observed-frame keV band, indicating significant intrinsic absorption at least in the latter source (Luo et al., 2015), and PHL 1811 exhibits in the observed-frame 0.3-5 keV band with no detectable intrinsic absorption (Leighly et al. 2007b). Alternatively, the difference between PHL 1811-like sources and the other, more extreme WLQs may be related to SED shielding (or modification) and orientation effects (Wu et al., 2011). We emphasize that the EW(C IV) Å criterion we adopt for WLQs is statistically driven and it depends on the particular quasar sample under consideration (see Section 2). It is more instructive, perhaps, to use a physically-motivated definition for WLQs as being clear outliers from the MBE, deviating by more than from this relation on the low-EW end; i.e., sources having [EW(C IV)], based on this work. Given this definition, only five sources in our sample (i.e., further excluding SDSS J12376301 with [EW(C IV)]) can be considered as WLQs, i.e., sources for which the H-based value may not fully explain their C IV line weakness. Finally, we note that a ‘cold’ accretion disk, due to high values, has also been offered to explain the weak C IV lines in WLQs (Laor & Davis, 2011); detailed UV spectroscopy of WLQs is required to test the predictions of this model.
A variety of BELR physical properties can also affect the relative strength of the C IV line, such as the BELR geometry, covering factor, density, and metallicity. Extremely weak C IV lines, such as those observed in WLQs with [EW(C IV)], may be attributed to a deficiency of gas in the BELR (i.e., an ‘anemic’ BELR; Shemmer et al., 2010), or to an early evolutionary stage in the quasar’s duty cycle where the BELR just started to form (e.g., Hryniewicz et al., 2010). A more rigorous investigation of the parameters controlling the relative strengths of BELR lines in quasars, which is beyond the scope of this work, should include a comprehensive analysis of spectral information for low- and high-ionization BELR lines as well as the SED shape, in conjunction with photoionization modeling, for a quasar sample much larger than studied herein. Most importantly, the relative strengths of high-ionization BELR lines, such as C IV with eV, should be investigated jointly with the relative strengths of low-ionization BELR lines, such as H with eV or Mg II with eV. For example, correlations involving ratios of the relative strengths of these lines, such as EW(C IV)/EW(H), as well as the X-ray-to-optical SED should be investigated in more detail (e.g., BL04; Wu et al. 2011, 2012; Plotkin et al. 2015). Furthermore, it is necessary to decompose the BELR lines into ‘disk’ and ‘wind’ (or outflow) components, in particular for C IV (e.g., Richards et al., 2011), in order to check whether the EW of each component of the line profile is correlated with a fundamental physical property, such as . Detailed line-profile measurements, yielding emission-line blueshifts and line asymmetries, should provide additional insights (e.g., Richards et al., 2011).
5. Conclusions
We utilize a sample of 99 ordinary quasars across wide ranges of luminosity and redshift to show that the relative strength of the broad C IV line is primarily anti-correlated with the H-based Eddington ratio, i.e., a MBE, thus confirming and extending previous work limited to nearby, low-luminosity sources. We also find that all nine WLQs with available H and C IV information in the archive have typical H-based values in contrast with the extremely high values expected from the MBE. While the EWs of the C IV lines in four of these WLQs are consistent with the MBE, the other five WLQs deviate significantly from this relation by exhibiting EWs much smaller than predicted from their H-based values. In case the single-epoch H-method can provide a reliable determination of in all quasars, then our results indicate that EW(C IV) cannot depend solely on . While a comprehensive investigation into the nature of the MBE is beyond the scope of this study, we outline additional spectroscopic work required to determine the roles that basic quasar physical properties play in controlling the relative strengths of broad-emission lines in quasars.
References
- Akritas & Bershady (1996) Akritas, M. G., & Bershady, M. A. 1996, ApJ, 470, 706
- Bachev et al. (2004) Bachev, R., Marziani, P., Sulentic, J. W., et al. 2004, ApJ, 617, 171
- Baldwin (1977) Baldwin, J. A. 1977, ApJ, 214, 679
- Bañados et al. (2014) Bañados, E., Venemans, B. P., Morganson, E., et al. 2014, AJ, 148, 14
- Baskin & Laor (2004) Baskin, A., & Laor, A. 2004, MNRAS, 350, L31
- Baskin & Laor (2005) Baskin, A., & Laor, A. 2005, MNRAS, 356, 1029
- Becker et al. (1995) Becker, R. H., White, R. L., & Helfand, D. J. 1995, ApJ, 450, 559
- Bentz et al. (2009) Bentz, M. C., Peterson, B. M., Netzer, H., Pogge, R. W., & Vestergaard, M. 2009, ApJ, 697, 160
- Boroson & Green (1992) Boroson, T. A., & Green, R. F. 1992, ApJS, 80, 109
- Brandt et al. (2000) Brandt, W. N., Laor, A., & Wills, B. J. 2000, ApJ, 528, 637
- Brotherton & Francis (1999) Brotherton, M. S., & Francis, P. J. 1999, Quasars and Cosmology, 162, 395
- Condon et al. (1998) Condon, J. J., Cotton, W. D., Greisen, E. W., et al. 1998, AJ, 115, 1693
- Croom et al. (2004) Croom, S. M., Smith, R. J., Boyle, B. J., et al. 2004, MNRAS, 349, 1397
- Diamond-Stanic et al. (2009) Diamond-Stanic, A. M., Fan, X., Brandt, W. N., et al. 2009, ApJ, 699, 782
- Dietrich et al. (2002) Dietrich, M., Hamann, F., Shields, J. C., et al. 2002, ApJ, 581, 912
- Dong et al. (2009) Dong, X.-B., Wang, T.-G., Wang, J.-G., et al. 2009, ApJ, 703, L1
- Espey et al. (1989) Espey, B. R., Carswell, R. F., Bailey, J. A., Smith, M. G., & Ward, M. J. 1989, ApJ, 342, 666
- Fan et al. (1999) Fan, X., Strauss, M. A., Gunn, J. E., et al. 1999, ApJ, 526, L57
- Fan et al. (2006) Fan, X., Strauss, M. A., Richards, G. T., et al. 2006, AJ, 131, 1203
- Forster et al. (2001) Forster, K., Green, P. J., Aldcroft, T. L., et al. 2001, ApJS, 134, 35
- Gibson et al. (2009) Gibson, R. R., Jiang, L., Brandt, W. N., et al. 2009, ApJ, 692, 758
- Green et al. (2001) Green, P. J., Forster, K., & Kuraszkiewicz, J. 2001, ApJ, 556, 727
- Hryniewicz et al. (2010) Hryniewicz, K., Czerny, B., Nikołajuk, M., & Kuraszkiewicz, J. 2010, MNRAS, 404, 2028
- Ivezić et al. (2002) Ivezić, Ž., Menou, K., Knapp, G. R., et al. 2002, AJ, 124, 2364
- Jannuzi et al. (1998) Jannuzi, B. T., Bahcall, J. N., Bergeron, J., et al. 1998, ApJS, 118, 1
- Just et al. (2007) Just, D. W., Brandt, W. N., Shemmer, O., et al. 2007, ApJ, 665, 1004
- Kaspi et al. (2005) Kaspi, S., Maoz, D., Netzer, H., et al. 2005, ApJ, 629, 61
- Kellermann et al. (1989) Kellermann, K. I., Sramek, R., Schmidt, M., Shaffer, D. B., & Green, R. 1989, AJ, 98, 1195
- Kelly (2007) Kelly, B. C. 2007, ApJ, 665, 1489
- Laor (1998) Laor, A. 1998, ApJ, 505, L83
- Laor & Davis (2011) Laor, A., & Davis, S. W. 2011, MNRAS, 417, 681
- Leighly et al. (2007) Leighly, K. M., Halpern, J. P., Jenkins, E. B., & Casebeer, D. 2007a, ApJS, 173, 1
- Leighly et al. (2007) Leighly, K. M., Halpern, J. P., Jenkins, E. B., et al. 2007b, ApJ, 663, 103
- Luo et al. (2015) Luo, B., et al. 2015, ApJ, in press, arXiv:1503.02085
- Malkan et al. (1987) Malkan, M. A., Green, R. F., & Hutchings, J. B. 1987, ApJ, 322, 729
- Marconi et al. (2004) Marconi, A., Risaliti, G., Gilli, R., et al. 2004, MNRAS, 351, 169
- Meusinger & Balafkan (2014) Meusinger, H., & Balafkan, N. 2014, A&A, 568, AA114
- Netzer et al. (2004) Netzer, H., Shemmer, O., Maiolino, R., et al. 2004, ApJ, 614, 558
- Netzer et al. (2007) Netzer, H., Lira, P., Trakhtenbrot, B., Shemmer, O., & Cury, I. 2007, ApJ, 671, 1256
- Osmer & Smith (1977) Osmer, P. S., & Smith, M. G. 1977, ApJ, 213, 607
- Osmer & Shields (1999) Osmer, P. S., & Shields, J. C. 1999, Quasars and Cosmology, 162, 235
- Plotkin et al. (2010) Plotkin, R. M., Anderson, S. F., Brandt, W. N., et al. 2010, AJ, 139, 390
- Plotkin et al. (2015) Plotkin, R. M., Shemmer, O., Trakhtenbrot, B., et al. 2015, ApJ, in press
- Richards et al. (2011) Richards, G. T., Kruczek, N. E., Gallagher, S. C., et al. 2011, AJ, 141, 167
- Ross et al. (2014) Ross, N. P., Hamann, F., Zakamska, N. L., et al. 2014, arXiv:1405.1047
- Schneider et al. (1991) Schneider, D. P., Schmidt, M., & Gunn, J. E. 1991, AJ, 101, 2004
- Shang et al. (2003) Shang, Z., Wills, B. J., Robinson, E. L., et al. 2003, ApJ, 586, 52
- Shemmer et al. (2004) Shemmer, O., Netzer, H., Maiolino, R., et al. 2004, ApJ, 614, 547
- Shemmer et al. (2008) Shemmer, O., Brandt, W. N., Netzer, H., Maiolino, R., & Kaspi, S. 2008, ApJ, 682, 81
- Shemmer et al. (2009) Shemmer, O., Brandt, W. N., Anderson, S. F., et al. 2009, ApJ, 696, 580
- Shemmer et al. (2010) Shemmer, O., Trakhtenbrot, B., Anderson, S. F., et al. 2010, ApJ, 722, L152
- Shen et al. (2011) Shen, Y., Richards, G. T., Strauss, M. A., et al. 2011, ApJS, 194, 45
- Shen & Liu (2012) Shen, Y., & Liu, X. 2012, ApJ, 753, 125
- Shen & Ho (2014) Shen, Y., & Ho, L. C. 2014, Nature, 513, 210
- Spergel et al. (2007) Spergel, D. N., Bean, R., Doré, O., et al. 2007, ApJS, 170, 377
- Trakhtenbrot & Netzer (2012) Trakhtenbrot, B., & Netzer, H. 2012, MNRAS, 427, 3081
- Tremaine et al. (2002) Tremaine, S., Gebhardt, K., Bender, R., et al. 2002, ApJ, 574, 740
- Trump et al. (2006) Trump, J. R., Hall, P. B., Reichard, T. A., et al. 2006, ApJS, 165, 1
- Turnshek & Grillmair (1986) Turnshek, D. A., & Grillmair, C. J. 1986, ApJ, 310, L1
- Vanden Berk et al. (2001) Vanden Berk, D. E., Richards, G. T., Bauer, A., et al. 2001, AJ, 122, 549
- Wilkes et al. (1999) Wilkes, B. J., Kuraszkiewicz, J., Green, P. J., Mathur, S., & McDowell, J. C. 1999, ApJ, 513, 76
- Wills et al. (1993) Wills, B. J., Brotherton, M. S., Fang, D., Steidel, C. C., & Sargent, W. L. W. 1993, ApJ, 415, 563
- Wills et al. (1999) Wills, B. J., Laor, A., Brotherton, M. S., et al. 1999, ApJ, 515, L53
- Wu et al. (2011) Wu, J., Brandt, W. N., Hall, P. B., et al. 2011, ApJ, 736, 28
- Wu et al. (2012) Wu, J., Brandt, W. N., Anderson, S. F., et al. 2012, ApJ, 747, 10
- Xu et al. (2008) Xu, Y., Bian, W.-H., Yuan, Q.-R., & Huang, K.-L. 2008, MNRAS, 389, 1703
- York et al. (2000) York, D. G., Adelman, J., Anderson, J. E., Jr., et al. 2000, AJ, 120, 1579
- Zheng & Malkan (1993) Zheng, W., & Malkan, M. A. 1993, ApJ, 415, 517