The Swift UVOT serendipitous source catalogue
Abstract:
We present the first Swift Ultraviolet/Optical Telescope Serendipitous Source Catalogue (UVOTSSC). The catalogue was compiled from 23 059 Swift datasets taken within the first five years of observations with the Swift UVOT. A purpose-built processing pipeline, based around the standard Swift processing tools, was employed. The catalogue contains positions, photometry in three UV and three optical bands, morphological information and data quality flags. In total, the catalogue contains 6 200 016 unique sources of which more than 2 million have multiple observations in the catalogue.
1 Introduction
The Swift Ultraviolet/Optical Telescope UVOT [1] is a 30 cm modified Ritchey-Chretien telescope mounted on the instrument platform of the NASA Swift Gamma-Ray Burst space observatory [2]. It has many characteristics in common with the XMM-Newton Optical Monitor (XMM-OM) [3], on which its design was based. A filter wheel provides a selection of lenticular filters for imaging and two grisms for low-resolution spectroscopy. A microchannel-plate intensified CCD (MIC) [4] is used as the detector. A key characteristic of this detector is an extremely low dark current. The UVOT is therefore usually background-limited by the zodiacal light [5]. The UVOT has a 17 arcmin 17 arcmin field of view, so its images routinely contain many more sources than the target of the Swift observation. The point spread function has a FWHM of around 2.5 arcsec in the UV [6]. The combination of the large field of view, sensitivity in the UV, small PSF and low background mean that the UVOT is a capable survey instrument.
Swift’s observing programme is diverse, from chasing gamma-ray bursts and other transients [7], to pointed observations of all kinds of astronomical sources. During this observing programme the UVOT has accumulated a large body of images, sampling a wide range of Galactic and extragalactic sky; see Fig. 1. Since early in the mission, a ‘filter of the day’ has been chosen for UVOT exposures where there is not a strong scientific constraint on the UVOT filter. In order to maximise the serendipitous science return from UVOT, the filter of the day is continuously cycled through the u and UV filters.
The UVOT Serendipitous Source Catalogue (UVOTSSC) is the first catalogue of sources detected by UVOT through its six lenticular filters, imaging in V, B, U, UVW1, UVM2 and UVW2 bands. It is the result of a 5 year long project led by MSSL, on behalf of the UVOT team, to produce a uniform product in terms of astrometry, photometry and morphological information from the first 5 years of UVOT observations. It provides an easy route for astronomers to obtain UVOT-derived source parameters without having to reduce or analyse UVOT data, and a large statistical dataset for the systematic investigation of the UV sky.

2 Data processing and construction of the catalogue
To construct the catalogue, the UVOT data were processed through a purpose-built pipeline, based on the Swift UVOT ftools available in heasoft111http://heasarc.gsfc.nasa.gov/docs/software/ftools. The pipeline is constructed as a sequence of processing engines, which advance the data through each intermediate stage of catalogue construction. The UVOT processing scheme is shown in Fig.2. The data are processed by Swift observation dataset, each of which has a unique 11-digit identifier, known as OBSID. Each OBSID is processed separately to an OBSID-specific source list. In the final stage of the catalogue construction, the individual source lists are brought together.

The vast majority of UVOT observations between 2005 and 2010 inclusive were used as the input data for the catalogue. Very short exposures and exposures taken when the Swift star-trackers were not locked were not used for the catalogue.
The first engine creates raw images from data that were taken in event mode, localises bad pixels (task uvotbadpix) and removes the modulo-8 pattern caused by the on-board centroiding algorithm (task uvotmodmap). The remainder of the first engine deals with image artefacts (readout streaks, scattered light features, etc.), creating a map of these artefacts for use later in the processing. The task uvotflagqual identifies possible image artefacts and sets quality flags in the pixels of the quality map which accompanies the main image through the further processing steps and which is used at the final stage of processing for passing quality flags to those sources whose coordinates coincide with the flagged pixels in the quality map. An example of the quality map containing a readout streak, diffraction spikes and some other image artefacts is shown in Fig.3.


The second engine rotates the images with the purpose of aligning them along the celestial coordinate axes (task swiftxform). Then the second engine corrects for the possible shifts of the image coordinates with respect to the sky coordinates by using reference stars from the USNO-B1 catalogue (task uvotskycorr). At the end of this processing stage, the task uvotexpmap generates exposure maps corresponding to the sky-rotated and aspect-corrected images.
The third engine stacks, for each OBSID, the different exposures for each filter, as well as the corresponding exposure and quality maps (task uvotimsum) and generates a large-scale sensitivity map needed for accurate photometry (task uvotskylss).
The fourth engine calculates the background maps for each stacked image and detects sources which have count rates that exceed a threshold above the background (task uvotdetect; see Section 3). The task uvotdetect used for the catalogue processing was modified with respect to the standard task in the heasoft package in order to deal with most of the problematic images that could be found in the UVOT archive, without manual intervention on the parameters of the task. The final stage of the processing involves the task uvotflagqual that extracts the image quality flags from the quality maps produced by the first engine. These flags are introduced into the source lists for each observation. Finally, when all the UVOT data have been processed through the four engines, the source lists are concatenated to form the source catalogue and cross-correlated to identify sources which have been observed in more than one observation.
3 Source detection and measurement process
For each Swift observation dataset (identified by a unique OBSID number) and for each filter, all images are processed and then stacked to achieve maximum sensitivity prior to source detection. Thus within each OBSID one image per filter is searched for sources.
The source detection and measurement is carried out within a modified version of the task uvotdetect, which is based around sextractor [8]. Within uvotdetect a background map is constructed, either using the standard sextractor algorithm which sigma-clips the image until convergence, or for low-count images using a uvotdetect-specific algorithm based around Poisson statistics. Sources are then detected by blurring with the standard sextractor pyramidal function before searching for groups of 8 or more connected pixels which are brighter than the background by more than 1.5 sigma.
Source countrates and magnitudes are calculated as corrected isophotal magnitudes in sextractor terminology [8]. Only detections with a signal to noise ratio are retained after the source detection passes. Quality flags are then propagated from the quality maps to the source lists. Within each OBSID, the source lists are then merged to form a single source list per observation, one row per source, which contains the photometric, morphological and quality information from all the UVOT filters used in that OBSID. From this list, any sources which do not have a signal to noise ratio in at least one filter are removed.
4 Catalogue structure
The UVOT source catalogue is presented in the form of FITS files with two table extensions, the first table (called SOURCES) containing the source parameters, and the second table (SUMMARY) containing information about the observations used for producing the source catalogue. The catalogue has deliberately been given a similar structure to the XMM-SUSS catalogue compiled from XMM-OM images [9], given the similarity in the character of the data contained within the two catalogues.
Since the images from different observations (OBSIDs) generate separate source lists that are concatenated in the final stage of catalogue production, the same source could be detected in several different observations. Such sources have multiple entries in the final catalogue SOURCES table, but each entry has the same unique source identification number, so the number of entries in the final source list table is larger than the total number of sources in the catalogue.
The first column (IAUNAME) of the SOURCES table gives the IAU source name in the form SWIFTUVOT JHHMMSS.S+DDMMSS, where HHMMSS.S stands for right ascension coordinates, and DDMMSS for declination coordinates. The second column (N_SUMMARY) contains a number which links the SOURCES and SUMMARY tables with each other, that is, for each source it gives the row in the SUMMARY table corresponding to the observation in which the source was detected. The third column (OBSID) contains the observation number within the Swift archive in which the source was detected. The fourth column (NFILT) gives the number of UVOT filters through which the source was observed. The next four columns contain the equatorial coordinates and position uncertainties for the source. The next six columns (filter SRCDIST), where filter corresponds to the UVOT filter names, give the distance to the nearest neighbouring source detected in the corresponding filters. This is useful to assess whether the source parameters are likely to have been affected by the proximity of (and confusion with) other sources. The next column (NOBSID) reports the number of Swift observations in which the source has been detected. The next 30 columns report the photometric properties of the source in each of the filters through which it has been observed: signal to noise ratios, magnitudes in the AB and Vega systems together with the associated uncertainties, flux estimates and the corresponding uncertainties. The next 24 columns contain morphological information by filter: major and minor axis sizes, position angles and whether the source is considered extended. The final six columns provide quality flags, broken down by filter.
5 Quality flags
| Bit | Value | Quality issue |
|---|---|---|
| 0 | 1 | Cosmetic defects (bad pixels) within the source region. |
| 1 | 2 | Source lies on or near a bright read-out streak |
| 2 | 4 | Source lies on or near a smoke ring |
| 3 | 8 | Source lies on or near a diffraction spike |
| 4 | 16 | Source is bright with coI-loss-induced mod-8 noise |
| 5 | 32 | Source lies within a ‘halo ring’ of enhanced background |
| 6 | 64 | Source lies close to a bright object |
| 7 | 128 | Source lies close to a large change in the exposure map |
| 8 | 256 | Point source lies over an extended source |
An important part of the catalogue processing is the recording of any issues that may affect the quality of the catalogue data so that the user can make an informed decision as to how reliable those data are. In the UVOTSSC pipeline this information is encapsulated in the form of quality flags which are propagated from the first processing engine to the final catalogue, on a source by source, filter by filter basis. These quality flags are stored as an eight-bit integer number, with each bit corresponding to one of the quality flags. Any bits which are set (i.e. non-zero) indicate a potential quality issue. Table 1 lists the quality flags, the values of the bits that they represent and a brief description of each flag.

Some of the quality flags are generic, while some are particular to the UVOT and its sister instrument, the XMM-OM, and will be described briefly here. The CCD that forms the last stage of the UVOT MIC detector is a frame-transfer device, and photons which arrive while the frame is being transferred to the frame store will be displaced in the vertical direction [10]. Bright stars thus give rise to vertical streaks of displaced photons which can be seen in UVOT images. These streaks are referred to as read-out streaks. Occasionally, uvotdetect detects spurious sources associated with the read-out streaks, and very faint sources close to the read-out streaks may have their photometry affected by the presence of the streaks.
The UVOT is a photon counting instrument, and is linear in the asymptotic limit of faint sources. However, when the count rate from an object is an appreciable fraction of the frame rate (90.6 frames s-1 in normal, full-frame operation), more than one photon may arrive within the same frame, and will only be counted as a single photon, resulting in a non-linearity of the detector. This is called coincidence loss [11] and is analogous to pile-up in X-ray CCDs. A correction for coincidence loss is applied in the calculation of the photometry, but for sources with large coincidence loss the image becomes distorted with a modulo-8 pattern relating to the event-centroiding that can not be corrected. In particular, sources develop a dark ring around a bright core. Morphological information is compromised for such sources.
Smoke rings and halo rings are associated with bright sources, and are produced by internal reflections within the detector window. Smoke rings are compact (30 arcsec diameter), out-of-focus images of the source displaced radially from the in-focus image, while the optical path responsible for the halo rings produces much larger (4.5 arcminute diameter) features. Smoke rings may give rise to spurious sources and may contaminate the photometry of nearby sources. Halo rings, with their larger scales, produce an enhanced and sometimes spatially variable background, and so will affect the photometry of faint sources. Fig. 4 shows examples of a read-out streak, coincidence-loss induced distortion, a halo ring and a smoke ring around a bright source with diffraction spikes visible.
6 Properties of the catalogue
| Period of observations | 2005–2010 |
|---|---|
| Total observations | 23 059 |
| Total sources | 6 200 016 |
| Repeated observations | 2 027 265 |
| Total entries | 13 860 569 |
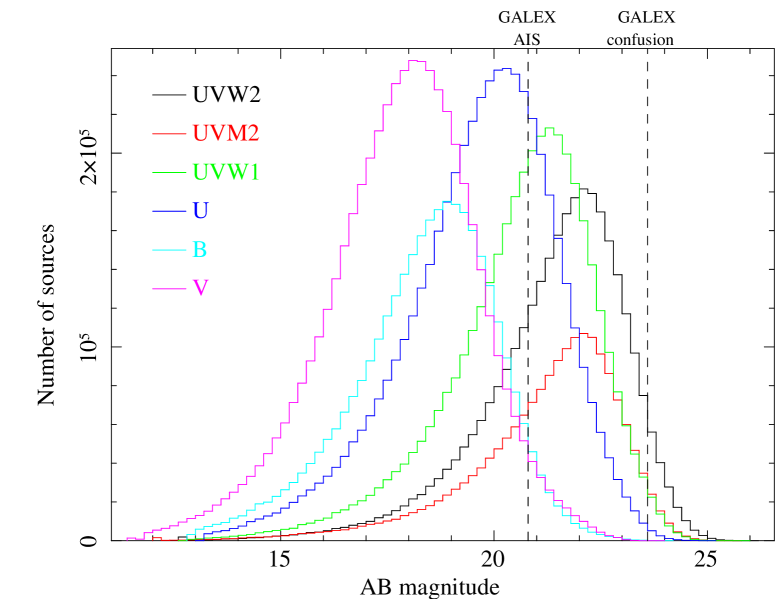
Some simple statistics about the catalogue as a whole are summarised in Table 2. Statistics on the UVOTSSC, broken down by filter, are provided in Table 3, and the distribution of source magnitudes in the six filters is shown in Fig. 5. The bright end limit of the catalogue corresponds to the limit at which coincidence loss can no longer be corrected [10]. The catalogue typically reaches fainter magnitudes in the UV filters than the optical filters, and the majority of the UV sources are fainter than the GALEX All-Sky Imaging Survey limit [12]. A significant minority of UVOTSSC sources are fainter than the GALEX confusion limit [13]. The UVOTSSC is a factor 2 larger than the second release of the XMM-SUSS [9], reaches about 1.4 magnitudes deeper than the second release of the XMM-SUSS in the UVM2 filter, and 2 magnitudes deeper in UVW2.
| V | B | U | UVW1 | UVM2 | UVW2 | |
|---|---|---|---|---|---|---|
| Total detections | 5 087 552 | 3 329 392 | 4 931 791 | 3 832 449 | 1 799 025 | 3 110 521 |
| Mean AB magnitude | 17.81 | 18.37 | 19.65 | 20.62 | 21.16 | 21.38 |
| Mean magnitude error | 0.08 | 0.09 | 0.09 | 0.10 | 0.13 | 0.11 |
| Brightest AB magnitude | 11.40 | 12.83 | 13.18 | 12.80 | 12.06 | 12.63 |
| Faintest AB magnitude | 23.82 | 24.18 | 25.09 | 25.86 | 25.70 | 26.00 |
6.1 Astrometry
UVOT astrometry is tied to the USNO-B1 catalogue during the data processing. The absolute astrometric accuracy of UVOT-derived positions is better than 0.5 arcsec [6], but for the faintest sources the statistical uncertainty on position is comparable to the systematic uncertainty, and for large extended sources the uncertainties can be larger. Within the catalogue, 98 per cent of the sources have statistical uncertainties on their position of less than 0.5 arcsec.
6.2 Photometry
The photometric calibration of UVOT is described in [5], with updates in [6] and [14]. Within the catalogue, the photometric accuracy has a strong dependence on source magnitude, but also depends on exposure time (which has a wide range) and background. The distribution of photometric uncertainty is shown against magnitude for the six photometric bands in Fig. 6.

7 Accessing the catalogue
The UVOTSSC can be downloaded from the MSSL Swift UVOT web pages222http://www.ucl.ac.uk/mssl/astro/space_missions/swift/uvotssc. It has also been delivered to the Mikulski Archive for Space Telescopes (MAST)333http://archive.stsci.edu where it will be available soon. In due course, the UVOTSSC will also be available through the Virtual Observatory.
8 Conclusions
We have constructed a catalogue of objects detected in Swift UVOT images. The catalogue was constructed via a purpose-built processing pipeline based around the standard UVOT ftools. The UVOTSSC contains 6 200 016 unique sources detected with the Swift UVOT within the first 5 years of Swift operations. For each source, astrometry, morphology and photometry in up to six UV and optical bands is provided, together with information about the quality of the data. Now that the machinery is in place to process the catalogue, we intend to add the second five years of UVOT observations for the next release. The catalogue offers a large statistical sample to explore the properties of Galactic and extragalactic UV source populations, and a convenient means for astronomers to obtain UVOT-derived information about sources of interest without having to reduce UVOT data.
References
- [1] Roming P.W.A., et al., 2005, Space Sci. Rev., 120, 95
- [2] Gehrels N., et al., 2004, ApJ, 611, 1005
- [3] Mason K.O., et al., 2001, A&A, 365, L36
- [4] Fordham J. L. A., Bone D. A., Read P. D., Norton T. J., Charles P. A., Carter D., Cannon R. D., Pickles A. J., 1989, MNRAS, 237, 513
- [5] Poole T.S., et al., 2008, MNRAS, 383, 627
- [6] Breeveld A.A., et al., 2010, MNRAS, 406, 1687
- [7] Gehrels N., Cannizzo J.K., 2014, arXiv:1502.03064
- [8] Bertin E., Arnouts S., 1996, A&A Supp. 317, 393
- [9] Page M.J., et al., 2012, MNRAS, 416, 2792
- [10] Page M.J., et al., 2013, MNRAS, 436, 1684
- [11] Fordham J.L.A., Moorhead C.F. & Galbraith R.F., 2000, MNRAS, 312, 83
- [12] Morrissey P., et al., 2007, ApJS, 173, 682.
- [13] Xu C.K., et al., 2005, ApJ, 619, L11
- [14] Breeveld A.A., Landsman W., Holland S.T., Roming P., Kuin N.P.M., Page M.J., 2011, AIP Conference Proceedings, 1358, 373