Vol.0 (200x) No.0, 000–000
page1
11institutetext: Physics Department, Yuxi Normal University, Yuxi 653100, China22institutetext: Shandong Provincial Key Laboratory of Optical Astronomy and Solar-Terrestrial Environment, Institute of Space Sciences, Shandong University,Weihai, 264209, China; jiangyg@sdu.edu.cn
33institutetext: Physics Department, Yunan Normal University, Kunming 650092, China
\vs\noReceived ********; accepted ********
The Broad Band Spectral Energy Distributions of SDSS Blazars
Abstract
We compiled the radio, optical, and X-ray data of blazars from the Sloan Digital Sky Survey (SDSS) database, and presented the distribution of luminosities and broad band spectral indices. The distribution of luminosities shows that the averaged luminosity of flat-spectral radio quasars (FSRQs) is larger than that of BL Lacs objects. On the other hand, the broad band spectral energy distribution reveals that FSRQs and low energy peaked BL Lac objects (LBLs) objects have similar spectral properties, but high energy peaked BL Lac objects (HBLs) have a distinct spectral property. This may be due to that different subclasses of blazars have different intrinsic environments and are at different cooling levels. Even so, a unified scheme also is revealed from the color-color diagram, which hints that there are similar physical processes operating in all objects under a range of intrinsic physical conditions or beaming parameter.
keywords:
Galaxies: active; BL Lacertae objects:general; Galaxies: fundamental parameters; Quasars: general1 Introduction
Blazars are a subset of active galactic nuclei (AGNs) with strong emission at all wavelengths. They are the brightest and most variable high energy sources among AGNs, and have continuous spectral energy distributions (SEDs). The continuum emission in balzars is thought to be from a relativistic jet oriented close to the observer and emanating from the vicinity of a black hole Ster08,Ghis86. The SEDs of blazars are characterized by a universal two-bump structure: one in the IR to UV band, another in the MeV-GeV band. The synchrotron radiation in a relativistic beamed jet is responsible for the lower-energy peak, while the high-energy -ray emission is produced by the inverse Compton mechanism (Sambruna et al., 1996). Generally, blazars can be divided into two subclasses, the BL Lacertae (BL Lacs) object and the flat spectrum radio quasars (FSRQs). The main difference between these two classes is their emission lines: BL Lacs objects are characterized by the lack of strong emission lines (equivalent width 5, while FSRQs have strong broad emission lines with the similar strength of normal quasars (Scarpa & Falomo, 1997).
Based on the synchrotron emission peak energy frequency, BL Lacs objects can be divided into ”High energy peaked BL Lacs” (HBLs) and ”Low energy peaked BL Lacs” (LBLs) (Padovani & Giommi, 1995; Giommi et al., 1995). Mei et al. (2002) and Ma et al. (2007) found that the two subclasses of BL Lacs objects can be distinguished by the peak frequencies : HBLs have , while LBLs have . In addition, Padovani & Giommi (1995) found that LBLs and HBLs can also be divided by using the ratio of X-ray flux at 1 keV (in units of ) to 5 GHz radio flux density (in units of Janskys). The criterion is , corresponding to the broad band spectral index (from radio 5 GHz to X-ray 1 keV) . HBLs have the broad band spectral index of , and LBLs have the spectral index of (Giommi et al., 1995; Ma et al., 2007; Mei et al., 2002; Urry & Padovani, 1995). For two different subclasses of BL Lacs objects, the SEDs have been investigated by a number of authors (e.g., Bao et al., 2008; Chen et al., 2006; Padovani & Giommi, 1995; Giommi et al., 1990; Nieppola et al., 2006). Padovani & Giommi (1995) and Giommi et al. (1990) found that two subclasses occupy different regions on the - plane. Padovani & Giommi (1995) also found there exist the correlations between the minimum soft X-ray flux and the radio flux, and also the correlations between radio and optical fluxes for the subsample of HBLs, but not for that of LBLs. Nieppola et al. (2006) found that there is a negative correlation between the luminosity and the synchrotron peak frequency at radio and optical band, whereas the correlation turns slightly positive in X-ray (Nieppola et al., 2006). Fan et al. (2012) and Lyu et al. (2014) found that HBLs have different properties from LBLs. Yan et al. (2014) found that the one-zone synchrotron self-Compton (SSC) model can successfully fit the SEDs of HBLs, but fails to explain the SEDs of LBLs. In addition, Bao et al. (2008) found that two subclasses of BL Lacs objects are unified.
BL Lacs objects and FSRQs are grouped together under the denomination of blazars, which eliminates the somewhat ambiguous issue of strength of the emission lines as a classification criterion. However, there are some differences in the individual emission properties among different blazar subclasses. The relationship among different kinds of balzars can promote our perception of the fundamental properties of blazars. Therefore, it is imperative to investigate the connection among FSRQs, LBLs, and HBLs.
The relationship between of BL Lacs objects and FSRQs has been discussed by a number of authors (e.g., Comastri et al., 1997; Fossati et al., 1998; Ghisellini et al., 1998, 2009; Li et al., 2010; Sambruna et al., 1996; Xie et al., 2001, 2003, 2004, 2006, 2007, 2008; Zheng et al., 2007), who assembled the SED of many radio, X-ray, and -ray selected blazars. Fossati et al. (1998) studied the SEDs of a combined blazar sample, and found that the SEDs properties of these subclasses present a remarkable continuity and a systematic trend as a function of source luminosity, which suggests that the parameter describing the blazar continua is likely to be the source luminosity. Based on the first Fermi sample, Ghisellini et al. (2009) found that FSRQs and BL Lacs objects occupy separate regions, and obey a spectral sequence. However, Antón & Browne (2005) found that there are selection effects for the ”blazars sequence” reported by Fossati et al. (1998) and Ghisellini et al. (1998). Some literatures show that HBLs have different properties from FSRQs, but LBLs are similar to FSRQs (e.g. Chen et al., 2013; Fan et al., 2012; Li et al., 2010; Lyu et al., 2014). However, Li et al. (2010) and Chen et al. (2013) also found that their whole sample suggest the unified scheme of blazars. Comastri et al. (1997) discovered that there is a significant anticorrelation between X-ray and -ray spectral indices, and also between the broadband spectral indices and of BL Lacs objects and FSRQs. The correlation between the broadband spectral indices obtained by Comastri et al. (1997) implied that there is a different shape in overall energy distributions from radio to -ray energies between BL Lacs objects and FSRQs. Sambruna et al. (1996) and Xie et al. (2003) found that three kinds of blazars have different SEDs, but follow a continuous spectral sequence.
In this paper, we will study the distributions of luminosities and the radio-optical-X-ray SEDs of SDSS blazars, and connections among LBLs, HBLs, and FSRQs. A detailed explanation of the sample is given in Sec. 2. The distributions of luminosity are presented in Sec. 3. The broad band spectral energy distribution is given in Sec. 4. In Sec 5, discussions and conclusions are presented.
2 The Sample of SDSS Blazars
The Sloan Digital Sky Survey (SDSS) is one of the most ambitious and influential surveys in the history of astronomy. Plotkin et al. (2008) have drawn a large sample of 501 BL Lacs objects candidates from the combination of SDSS Data Release 5 (SDSS DR5) optical spectroscopy, and the Faint Images of the Radio Sky at Twenty-Centimeters (FIRST) radio survey. Plotkin et al. (2010) have presented a sample of 723 optically selected BL Lac candidates from the SDSS Data Release 7 (SDSS DR7) spectroscopic database. Based on the large radio (the NRAO VLA Sky Survey, ATCA catalogue of compact PMN sources), ROSAT All Sky Survey (RASS), the SDSS Data Release 4 (SDSS DR4) and 2dF survey data, Turriziani et al. (2007) presented a Radio-Optical-X-ray catalog built at ASDC (ROXA) including 816 objects, among which 510 are confirmed blazars. In addition, Chen et al. (2009) have also presented a sample including 118 Non-thermal jet-dominated FSRQs from SDSS Data Release 3 (SDSS DR3), X-ray quasar sample with FIRST and GB6 radio catalogues. Based on the sample of Plotkin et al. (2008, 2010), Turriziani et al. (2007) and Chen et al. (2009), we compiled a large sample of 606 blazars, including 292 FSRQs and 314 BL Lacs. All the objects of the sample have matches in RASS and measured redshifts. In our sample, the three-band luminosities (, , and ) and the broad-band spectral indices , , and were given by the literatrues (Chen et al., 2009; Plotkin et al., 2008, 2010; Turriziani et al., 2007). The luminosities , , and are the specific luminosities (per unit frequency) at 5GHz, 5000, and 1keV, respectively. is the two-point spectral indices between 5 GHz and 5000, is the two-point spectral indices between 5 GHz and 1 keV, and is the two-point spectral indices between 5000 and 1 keV.
As discussed in section 1, BL Lacs objects can be divided into HBLs and LBLs, based on the radio-X-ray spectral index between 5 GHz and 1 keV. According to literatures (Giommi et al., 1995; Ma et al., 2007; Mei et al., 2002; Plotkin et al., 2008; Urry & Padovani, 1995), most BL Lacs objects with are HBLs, and most BL Lacs objects with are LBLs. Therefore, for investigating the relation among different blazar subclasses, we adopt as a rough value to divise HBLs and LBLs for the SDSS BL Lacs objects (Giommi et al., 1995; Ma et al., 2007; Mei et al., 2002; Urry & Padovani, 1995). Based on this criterion, there are 270 HBLs and 44 LBLs in our sample.
3 Distributions of luminosity of blazars
Fossati et al. (1998) studied the SEDs of a combined blazar sample, and found that the source luminosity is the characteristic parameter describing the blazar continua. On the basis of the first Fermi sample, Ghisellini et al. (2009) have found BL Lacs objects are harder and less luminous than FSRQs. Ghisellini et al. (1998) found that HBLs are sources with the lowest intrinsic power and the weakest external radiation field, LBLs are intrinsically more powerful than HBLs, and FSRQs represent the most powerful blazars.
Thus, we computed the distributions of radio (at 5GHz), optical (at 5000) and X-ray (at 1 keV) luminosities for three subclasses of blazars. Figure 1-3 give the distribution of luminositices for three kinds of blazars, and all the luminositices are K-corrected to the source rest frame (Chen et al., 2009; Plotkin et al., 2008, 2010; Turriziani et al., 2007). The distributions of radio, optical and X-ray luminosities are plotted in Figure 1, 2, and 3, respectively.
From Figure 1, one can find that FSRQs have larger radio luminosities than BL Lacs objects, while the radio luminosities of LBLs are more powerful than that of HBLs. This suggests that the radio luminosities of the three kinds of blazars, from FSRQs to LBLs to HBLs, are decreasing, which is consistent with the argument reported by Ghisellini et al. (1998). In Figure 2, we can note that the optical luminosities of FSRQs are larger than that of BL Lacs objects, while HBLs have similar optical luminosities to that of LBLs. Correspondingly, the X-ray luminosities of HBLs are systematically lower than FSRQs, but larger than LBLs (see Figure 3).
The distributions presented in Figure 1, 2, and 3 show that the luminosity is an important parameter to distinguish FSRQs and BL Lacs objects. A tendency of luminosities from FSRQs to BL Lacs objects is revealed from the distributions of luminosities. The distributions of luminosities for three kinds of blazars presented from Figure 1-3 are consistent with the results reported by Fossati et al. (1998) and Ghisellini et al. (1998). On the other hand, one can note that all the distributions are continuous in properties between HBLs and LBLs, and as well as between FSRQs and BL Lacs objects, which is in good agreement with the previous arguments about the continuum of blazars (Fossati et al., 1998; Ghisellini et al., 1998; Xie et al., 2003; Comastri et al., 1997; Sambruna et al., 1996).


4 Broad band spectral energy distribution of blazars
Searching the connection among different blazar subclasses is very significant, because it can substantially promote our understanding about the fundamental nature of blazars. The relationship among different blazars has been discussed in literatures with a unified scheme and a spectral sequence for blazars (Fossati et al., 1998; Ghisellini et al., 1998; Sambruna et al., 1996; Xie et al., 2003). For investigating the relationship among different subclasses of blazars, we will analyze the relationship among the HBLs, LBLs, and FSRQs on the basis of the broad band spectral index , , and .
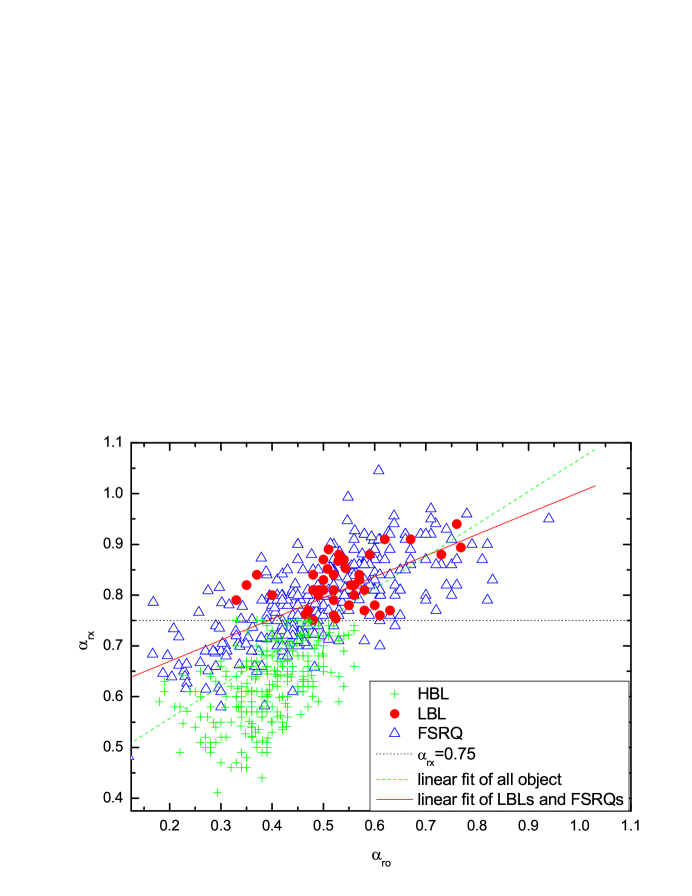
4.1 Diagram of versus
Here, we investigated the relationship between the broad band spectral indices and for the whole sample. The plot is shown in Figure 4. Figure 4 shows that there is a good correlation between and for the whole sample. A linear regression analysis equation for all sample is written as
| (1) |
with a correlation coefficient , and a chance probability . Moreover, we also studied the relationship between and for the FSRQs and LBLs sample. We obtained
| (2) |
with a correlation coefficient , and a chance probability . The correlation analysis suggests that there is a linear correlation between and for the whole sample, and as well as for the FSRQs+LBLs sample. This provides evidence for the unified scheme reported by Fossati et al. (1998) and Ghisellini et al. (1998).
In addition, Figure 4 shows that the majority of FSRQs and LBLs mix together, which suggests that they have similar spectral properties. However, Figure 4 also reveals that the distribution of HBLs in versus diagram is different from that of FSRQs and LBLs. This indicates that HBLs have different spectral properties from FSRQs and LBLs. The results are consistent with the reported results of Xie et al. (2003), who found that HBLs and LBLs locate in different regions in the plane, but LBLs and FSRQs occupy the same region in plane. In addition, our results also agree with that reported by Fan et al. (2012) and Lyu et al. (2014).
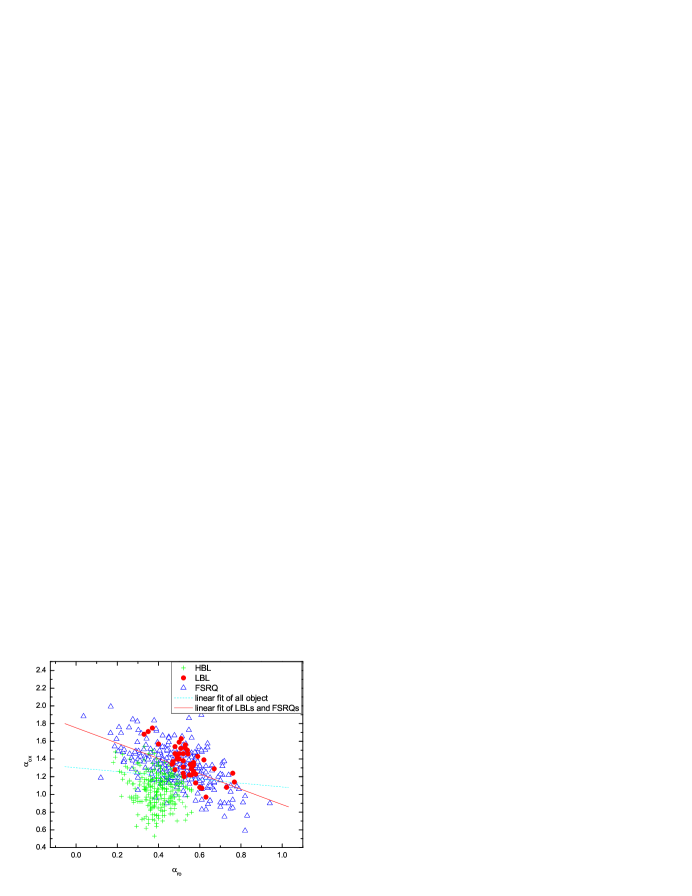
4.2 Diagram of versus
In Figure 5, versus is plotted for our SDSS blazar sample. We can find that the distribution of three kinds of blazars revealed from Figure 5 is similar to that of Figure 4. For the whole sample, Figure 5 shows a significant correlation between and , and the linear regression analysis yields
| (3) |
with a correlation coefficient and a chance probability . Moreover, Figure 5 shows that there is a weak correlation between and for the FSRQs and LBLs sample, and the linear regression analysis equation is
| (4) |
with a correlation coefficient and a chance probability . In Figure 5, one can note that the majority of FSRQs and LBLs also occupy the same region, but HBLs occupy a separate distinct region, which is also consistent with previous results.
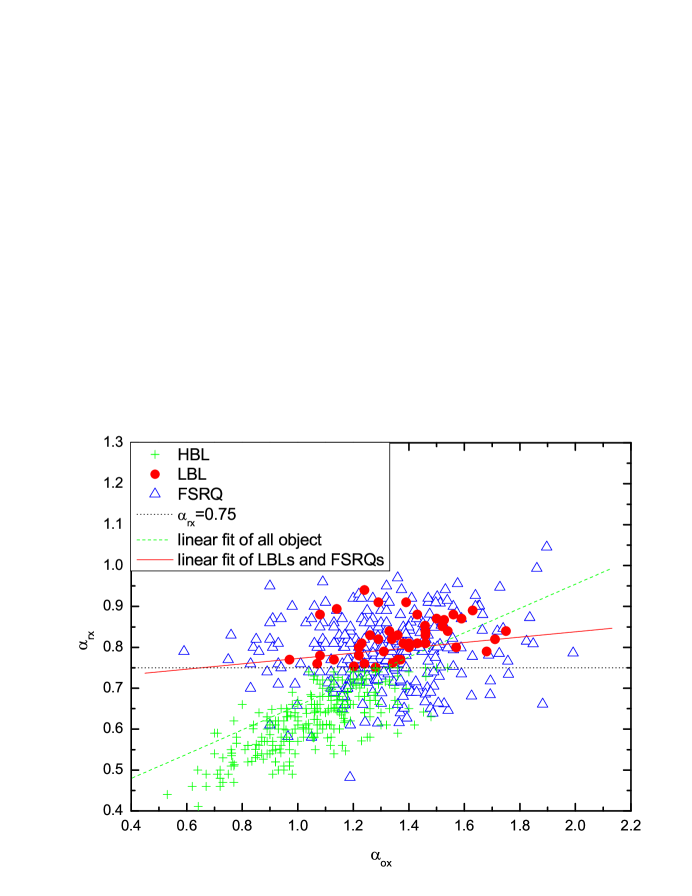
4.3 Diagram of versus
Based on the broad band spectral index versus , we investigated the relationships between and . Figure 6 plots versus . A linear regression analysis shows that there is a weak or even no correlation between and ( and ) for whole sample. This independent relation is obviously inconsistent with the foregoing correlation revealed from Figure 4 and Figure 5. However, the correlation is significant when considering FSRQs and LBLs sample and the the linear regression analysis equation is
| (5) |
where the correlation coefficient is and the chance probability is . This suggests that HBLs are different from FSRQs, but LBLs are similar to FSRQs. In addition, Figure 6 also shows that most of the FSRQs and LBLs locate the same region in - plot, but HBLs occupy a separate distinct region in versus plane. This is consistent with the distribution shown in Figure 4 and Figure 5. This supports the foregoing results: FSRQs and LBLs have similar spectral properties, but HBLs have distinct spectral properties.
4.4 Summary
As noted above, from Figure 4 and 5, there is a strong correlation between and , and as well as between versus for the whole sample, which provides some more evidence for the conclusion reported by Fossati et al. (1998) and Ghisellini et al. (1998). Namely, there is a unified scheme for blazars. On the other hand, from Figure 4, 5, and 6, one can note that there are also some different distributions from the blazar sequence reported by Fossati et al. (1998) and Ghisellini et al. (1998). In the color-color diagram, HBLs and FSRQs occupy seperated regions, while the LBLs and FSRQs mix together, which is consistent with that reported in some literatures (e.g. Chen et al., 2013; Fan et al., 2012; Li et al., 2010; Lyu et al., 2014; Xie et al., 2003). This suggests that FSRQs and LBLs have a similar property, but HBLs have a distinct property.
5 Discussion and Conclusions
Based on the Slew survey, the 1-Jy samples of BL Lacs and the 2-Jy sample of FSRQs, Fossati et al. (1998) studied the systematics of the SEDs of blazars using data from the radio to the -ray band, and found that three different kinds of blazars follow an almost continuous spectral sequence: from FSRQs through LBLs to HBLs. Ghisellini & Tavecchio (2008) revisited the so called ”blazar sequence”, and proposed that the power of the jet and the SED of its emission are linked to the two main parameters of the accretion process. This similar trend was also obtained by other authors (e.g. Xie et al., 2003; Sambruna et al., 1996; Ghisellini et al., 1998; Böttcher & Dermer, 2002; Maraschi et al., 2008) who found that similar physical processes operate in three kinds of blazars. However, Antón & Browne (2005) found that there are selection effects for the ”blazars sequence”. Moreover, some authors found that HBLs do not follow the blazars sequence (e.g. Chen et al., 2013; Fan et al., 2012; Giommi et al., 2005; Li et al., 2010; Padovani et al., 2003; Padovani, 2007) .
In this paper, we computed the distributions of the radio (at 5 GHz), optical (at 5000 ), and X-ray (at 1 keV) luminosities. The luminosities distributions reveal that it is an important parameter to distinguish FSRQs and BL Lacs objects, and the distributions are continuous for three kinds of blazars. The luminosities of FSRQs are lager than that of BL Lacs objects, which is in good agreement with the arguments reported by other authors (Abdo et al., 2009; Fossati et al., 1998; Ghisellini et al., 1998; Sambruna et al., 1996). The distributions of radio luminosity support the blazars sequence reported by Fossati et al. (1998) and Ghisellini et al. (1998). However, the distributions of optical and X-ray luminosities do not support the sequence.
The broadband energy distribution shows that three kinds of blazars have different spectral properties. It also shows that most FSRQs and LBLs mix together in the color-color diagram (see Figure 4, 5, and 6), which is consistent with previous results (Fan et al., 2012; Li et al., 2010; Sambruna et al., 1996; Xie et al., 2003; Zheng et al., 2007). This suggests that they have similar spectral properties, which provides some more evidence for the conclusion of unified scheme. However, the location of HBLs is separate with that of FSRQs and LBLs in the color-color diagram, which reveals that HBLs have different SEDs from FSRQs and LBLs. This suggests that the results from SDSS sample do not support the so called ”blazar sequence”, which is consistent with the results reported by the other authors (Antón & Browne, 2005; Fan et al., 2012; Chen et al., 2013; Li et al., 2010; Padovani et al., 2003; Padovani, 2007; Zhang et al., 2013). The spectral sequence obtained by Fossati et al. (1998) may be related to the selection effects, because the sample used by Fossati et al. (1998) are classic, high flux limit surveys in the radio and X-ray (Antón & Browne, 2005). Our sample used in the paper is a large sample including 606 blazars, which would result in a unbiased view of blazar spectral properties. Moreover, Figure 7 gives the relations between the redshift and spectral indices. Figure 7 shows that the spectral indices is independent of redshift, which suggests that the selection effects of our sample are weak.
Ghisellini et al. (1998) suggested the level of cooling is different for different subclasses of blazars. FSRQs suffer stronger cooling, and synchrotron emission peaks at much lower frequency. However, the cooling is less important for HBLs, and the energetic particles can produce synchrotron and inverse Compton (IC) emission up to high frequency. The level of cooling of FSRQs stronger than the one of HBLs may be due to the external radiation field (Ghisellini et al., 1998). Georganopoulos et al. (2001) suggested that the radiating jet plasma in weak sources is outside the broad line scattering region (BLR), while it is within in the power source. This implies that the location of emitting region between HBLs and FSRQs might be very different (Costamante, 2009). The jet energy of FSRQs would dissipate within the BLR, leading that the high energy electrons in the jet will suffer greater cooling (Chen & Bai, 2011). Ghisellini et al. (2010) suggested that the -ray emission from FSRQs is likely from the Compton scattering of an external radiation source, while for HBLs SSC is able to provide a good fit to the -ray emission. In addition, based on the physical properties of relativistic jets, Yan et al. (2014) found that the one-zone SSC model can successfully fit the SEDs of HBLs, but fails to explain the SEDs of LBLs. Moreover, they also suggest that the ratios of the Compton to the synchrotron peak energy fluxes of LBLs are greater than those of HBLs and IBLs, and then LBLs are Compton dominated (Yan et al., 2014). This suggests that there is an external radiation field for LBLs. Therefore, the levels of cooling of FSRQs and LBLs is stronger than HBLs, which lead that the synchrotron emission peaks of FSRQs and LBLs is lower than ones of HBLs. Abdo et al. (2010) found FSRQs and LBLs are the low synchrotron peaked blazars, while HBLs are high synchrotron peaked blazars. Fan et al. (2012) suggest that if the synchrotron peak frequency moves to the lower frequency, then the IC peak frequency may also move to the lower frequency. Thus, the X-ray of LBLs and FSRQs are from the combination of synchrotron emission and the IC emission, while the X-ray of HBLs are from the synchrotron emission of very high energy electrons (Abdo et al., 2010; Fan et al., 2012). In addition, the different SEDs between HBLs, FSRQs, and LBLs may be related to the different intrinsical environments around the blazar’s nucleus. The intrinsical environments of FSRQs and HBLs have a clear, physics difference: the environment of HBLs is ”cleaner” than that of FSRQs (Costamante, 2009). The central regions of FSRQs are rich in gas and dust, which would lead to a high accretion rate onto the central supermassive black hole (Böttcher & Dermer, 2002). Moreover, the material would efficiently reprocess and scatter the accretion disk radiation. This would lead to the observed strong optical emission lines in the BLR and to a high energy density of the external soft-photon field in the jet (Böttcher & Dermer, 2002).
Although HBLs have different SEDs from FSRQs and LBLs, the significant correlation revealed from Figure 4 and 5 suggests that there is a unified scheme for whole sample, which is consistent with the previous conclusion reported by other authors (Comastri et al., 1997; Fossati et al., 1998; Ghisellini et al., 1998; Li et al., 2010; Sambruna et al., 1996; Xie et al., 2001, 2003). This hints that there is a similar physical processes operating in all objects. In the case of the blazar-type sources where the emission is usually associated with a stream of relativistic jet, the overall spectrum is determined by the energy spectrum of the electrons as well as by the variation of the physics quantities along the jet (Begelman et al., 1984). HBLs, LBLs, and FSRQs have a significant correlation in the color-color diagram (see Figure 4 and 5), which implies that similar physical processes operate in all objects under a range of intrinsic physics conditions or beaming parameter. On the other hand, the difference among three subclasses of blazars, revealed from color-color diagram (see Figure 4, 5, and 6), should be attributed to the different level of cooling and the intrinsical different environments around the blazars nucleus for different subclasses blazars, which lead to different optical and X-ray spectra for different kinds of blazars.

Acknowledgements.
We are grateful to the anonymous referee for useful comments. We are grateful for the help from Liang Chen. This research has made use of the SDSS database. This work is supported by the National Natural Science Foundation of China (10878013), and the Natural Science Foundation of Yunnan Province (2011FZ081, 2012FD055, 2013FB063), and the Program for Innovative Research Team (in Science and Technology) in University of Yunnan Province (IRTSTYN), and Science Research Foundation of Yunnan Education Department of China (2012Y316), and the Young Teachers Program of Yuxi Nurmal University. In addition, the work of Yunguo Jiang is supported by the NNSFC with Number 11403015.References
- Abdo et al. (2009) Abdo, A. A., Ackermann, M., Ajello, M. et al., 2009, ApJ, 700, 597
- Abdo et al. (2010) Abdo, A. A., Ackermann, M., Ajello, M. et al., 2010, ApJ, 716, 30
- Antón & Browne (2005) Antón, S. & Browne, I. W. A., 2005, MNRAS, 356, 225
- Bao et al. (2008) Bao, Y. Y., Chen, L. E., Li, H. Z. et al., 2008, Ap&SS, 318, 169
- Begelman et al. (1984) Begelman, Mitchell C., Blandford, Roger D., Rees, Martin J., 1984, Rev. Mod. Phys., 56, 255
- Böttcher & Dermer (2002) Böttcher, M. & Dermer, C. D., 2002, ApJ, 564, 86
- Chen & Bai (2011) Chen, L. & Bai, J. M., 2011, ApJ, 735, 108
- Chen et al. (2013) Chen, L. E., Li, H. Z., Yi, T. F. et al., 2013, \raa, 13, 5
- Chen et al. (2006) Chen, L. E., Xie, G. Z., Ren, J. Y. et al., 2006, ApJ, 637, 711
- Chen et al. (2009) Chen, Z. Y., Gu, M. F. Cao, X. W., 2009, MNRAS,397, 1713
- Comastri et al. (1997) Comastri, A., Fossati, G., Ghisellini, G. et al.,1997, ApJ, 480, 534
- Costamante (2009) Costamante, Luigi, 2009, Int. J. Mod. Phys. D., 18, 1483
- Fan et al. (2012) Fan, J. H., Yang, J. H., Yuan, Y. H. et al., 2012, ApJ, 761, 125
- Fossati et al. (1998) Fossati, G., Maraschi, L., Celotti, A. et al., 1998, MNRAS, 299, 433
- Georganopoulos et al. (2001) Georganopoulos, M., Kirk, J. G. & Mastichiadis, A., 2001, ASPC, 227, 116
- Ghisellini et al. (1998) Ghisellini, G., Celotti, A., Fossati, G. et al., 1998, MNRAS, 301, 451
- Ghisellini et al. (2009) Ghisellini, G., Maraschi, L., Tavecchio, F. 2009, MNRAS, 396, 105
- Ghisellini et al. (1986) Ghisellini, G., Maraschi, L., Treves, A., Tanzi, E. G., 1986, ApJ, 310, 317
- Ghisellini et al. (2010) Ghisellini, G., Tavecchio, F., Foschini, L. et al., 2010, MNRAS, 402, 497
- Ghisellini & Tavecchio (2008) Ghisellini, G. & Tavecchio, F., 2008, MNRAS, 387, 1669
- Giommi et al. (1995) Giommi, P., Ansari, S. G., Micol, A., 1995, A&AS, 109, 267
- Giommi et al. (1990) Giommi, P., Barr, P., Pollock, A. M. T. et al., 1990, ApJ, 356, 432
- Giommi et al. (2005) Giommi, P., Piranomonte, S., Perri, M. & Padovani, P., 2005, A&A, 434, 385
- Li et al. (2010) Li, H. Z., Xie, G. Z., Yi, T. F. et al., 2010, ApJ, 709, 1407
- Lyu et al. (2014) Lyu, F., Liang, E., Liang, Y. et al., 2014, ApJ, 793, 36
- Ma et al. (2007) Ma, L., Chen, L. E., Xie, G. Z. et al., 2007, ChJAA, 7, 345
- Maraschi et al. (2008) Maraschi, L., Foschini, L., Ghisellini, G., Tavecchio, F. & Sambruna, R. M., 2008, MNRAS, 391, 1981
- Mei et al. (2002) Mei, D. C., Zhang, L., Jiang, Z. J., 2002, A&A, 391, 917
- Nieppola et al. (2006) Nieppola, E., Tornikoski, M., Valtaoja, E., 2006, A&A, 445, 441
- Padovani (2007) Padovani, P., 2007, Ap&SS, 309, 63
- Padovani & Giommi (1995) Padovani, P. & Giommi, P., 1995, MNRAS, 277, 1477
- Padovani et al. (2003) Padovani, P., Perlman, E. S., Landt, H., Giommi, P., & Perri, M. 2003, ApJ, 588, 128
- Plotkin et al. (2010) Plotkin, R. M., Anderson, S. F., Brandt, W. N. et al., 2010, AJ, 139, 390
- Plotkin et al. (2008) Plotkin, R. M., Anderson, S. F., Hall, Patrick B. et al., 2008, AJ, 135, 2453
- Sambruna et al. (1996) Sambruna, R. M., Maraschi, L., Urry, C. M., 1996, ApJ, 463, 444
- Scarpa & Falomo (1997) Scarpa, R. & Falomo, R., 1997, A&A, 325. 109
- Stern & Poutanen (2008) Stern, B. E. & Poutanen, Juri, 2008, MNRAS, 383, 1695
- Turriziani et al. (2007) Turriziani, S., Cavazzuti, E. & Giommi, P., 2007, A&A, 472, 699
- Urry & Padovani (1995) Urry, C. M. & Padovani, P., 1995, PASP, 107, 803
- Xie et al. (2001) Xie, G. Z., Dai, B. Z., Liang, E. w. et al., 2001, PASJ, 53, 469
- Xie et al. (2006) Xie, G. Z., Dai, H., Mao, L. S. et al., 2006, AJ, 131, 1210
- Xie et al. (2003) Xie, G. Z.; Ding, S. X.; Dai, H., et al., 2003, Int. J. Mod. Phys. D., 12, 781
- Xie et al. (2004) Xie, G. Z., Zhou, S. B., Liang, E. W., 2004, AJ, 127, 53
- Xie et al. (2008) Xie, Z. H., Hao, J. M., Du, L. M. et al., 2008, PASP, 120, 477
- Xie et al. (2007) Xie, Z. H., Dai, H., Hao, J. M. et al., 2007, ChJAA, 7, 209
- Xu et al. (2009) Xu, Y. D., Cao, X. W., & Wu, Q. W., 2009, ApJ, 694,107
- Yan et al. (2014) Yan, D., Zeng, H. & Zhang, L., 2014, MNRAS, 439, 2933
- Zhang et al. (2010) Zhang, J., Bai, J. M., Chen, L., & Liang, E. W., 2010, ApJ, 710, 1017
- Zhang et al. (2013) Zhang, J., Zhang, S. N., & Liang, E. W., 2013, IJMPS, 23, 54
- Zheng et al. (2007) Zheng, Y. G., Zhang, X., Hu, S. M., 2007, Ap&SS, 310, 1