A Helium Gas-Scintillator Active Target for Photoreaction Measurements
Abstract
A multi-cell He gas-scintillator active target, designed for the measurement of photoreaction cross sections, is described. The target has four main chambers, giving an overall thickness of 0.103 at an operating pressure of 2 MPa. Scintillations are read out by photomultiplier tubes and the addition of small amounts of to the He, to shift the scintillation emission from UV to visible, is discussed. First results of measurements at the MAX IV Laboratory tagged-photon facility show that the target has good timing resolution and can cope well with a high-flux photon beam. The determination of reaction cross sections from target yields relies on a Monte Carlo simulation, which considers scintillation light transport, photodisintegration processes in , background photon interactions in target windows and interactions of the reaction-product particles in the gas and target container. The predictions of this simulation are compared to the measured target response.
1 Introduction
The group-eight elements scintillate in the gas and liquid phases [1], producing a signal that has a linear dependence on energy deposited. Unlike many scintillators, there is no strong velocity dependence of the signal so that relatively low velocity heavy ions can be detected. Since the 1950’s [2] a variety of inert-gas scintillators have been developed for the detection of charged ions, but much of the effort has concentrated on Xe or Ar, which give good stopping power and high gain if the gas is also used as the ionisation medium for a proportional counter. More recently liquid Xe and Ar have been used for high-energy, hadron calorimetry [3].
Detectors using He scintillator tend to be more specialised, often driven by the desire to investigate the properties of or nuclei. High-pressure gas cells [4] have been used for fast neutron polarimetry [5, 6] as the analysing power for scattering is large and well known. Liquid helium scintillators, also with a long pedigree [7], have similarly been used for neutron polarimetry [8] and more recently to measure beta decay of magnetically trapped ultra-cold neutrons [9].
In this article we report on the development of a gas-scintillator active target (AT), where the target material is also the detection medium for the charged products of nuclear reaction processes. The objective is to measure the total and partial photodisintegration cross sections at photon energies from breakup threshold, potentially up to pion production threshold. These observables are sensitive to the structure of the nucleus and are important to the development of ab initio methods to calculate the wave function. The existing data set is surprisingly patchy [10] and has offered often contradictory evidence to these fundamental theoretical efforts.
With a conventional separate target and detector arrangement, it is difficult to reach the near-threshold region since low energy charged ions are easily stopped. Thus an AT, where the ions do not have to pass through any inert material before detection, is highly advantageous. A different AT technique where the He gas (with 25% methane admixture) is the ionisation medium for a time projection chamber has been used [11] to explore similar physics issues. The present target does not employ tracking elements for event reconstruction, so that large admixtures of other gases are undesirable if the He cross section is to be measured accurately.
The following sections describe the construction of the AT, the obtained scintillation signal, Monte Carlo (MC) simulations and the first measurements of reactions using the tagged photon beam at the MAX IV Laboratory.
2 The Gas Scintillator Active Target
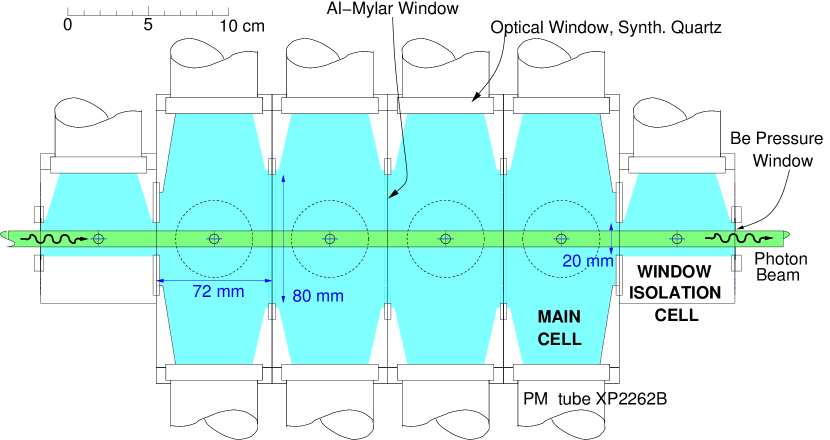
The active target is shown schematically in Fig.1 and is described in detail in Ref.[12]. It consists of
-
1.
4 Main Cells. Each cell is read out by 4 photomultiplier tubes (PMT), viewing the gas chamber through 10 mm thick synthetic quartz windows. A pressure-tight seal is made between the window and the body of the target using indium gaskets. The cell length is 72 mm, giving a thickness of 0.0257 per cell at 2 MPa pressure. The joint between cells is sealed by a “V-ridge” on a Cu gasket and the pressure between cells is equalised via an internal passage. The cells are isolated optically by 5 m thick aluminised Mylar windows.
-
2.
2 Window Isolation Cells. These cells, attached at either end of the target, have a single PMT attached to the target body in the same manner as the main-cell PMT. They isolate the main cells from particles produced in the outer pressure-containment windows, which are 0.5 mm thick Be. The main utility of the isolation cells is to remove the Be window from close proximity to the main cells. Signals from the isolation cells can be used to veto events from beam interaction with the windows.
The cells of the target were machined from solid Al alloy, cleaned and coated on the internal surfaces with reflector. The AT was then assembled and pressure tested with 2 MPa He. When leak tight the PMTs were added, coupled to the windows via optical grease.
2.1 Gas Handling
Prior to filling with He, the target and all the gas handling apparatus were evacuated. Any trace non-helium gas (for scintillation wavelength shifting) was then introduced and finally the He was added. During measurements with beam the target pressure and temperature were monitored continuously.
2.2 Investigation of Helium Scintillation
The scintillation emission spectrum of helium, in common with all noble gases, is a complex system of lines, bands and continua. The spectrum extends from the Near Infra-red (NIR) into the Vacuum Ultra Violet (VUV, nm) [13] and depends on pressure, modes of excitation and the ionisation density of the incident charged particle. At low pressure ( kPa) the scintillation is produced by atomic processes, while at higher pressure, collisions between excited or ionised He with neighbouring unexcited atoms, can produce He eximers. Part of the eximer’s energy is released in the form of scintillation, predominantly in the VUV. The intensity of the scintillation is expected [1] to be of the order photons per MeV deposited. VUV is difficult to detect with good efficiency and it is common to add an impurity to the He. Collisions and other processes, transfer energy from He eximers and/or excited atoms to the impurity molecules, which then emit at their longer characteristic wavelengths. and Xe are commonly used impurities. Although this results in an overall reduction in scintillation efficiency [1], this is more than compensated by the improved reflection, transmission and PMT quantum efficiency for visible photons. Furthermore, standard glass-window PMTs can be used, in this case XP2262B, which are cheaper and less susceptible to helium ingress than quartz.
Initial investigations of helium scintillation properties were made with a small test cell, which housed an open source (energy MeV), where the emissions were viewed by a quartz-window PMT type XP2020Q. The small amplitude of the pulses confirmed that transport and collection of the UV scintillation is inefficient, even with quartz windows on the target and a quartz-window PMT.
A wavelength-shifting “paint” type EJ-298 [15], which consists of a polyvinyl toluene binder and fluorescent dopant dissolved in xylene, was then used to coat the quartz window and the internal surfaces of the cell, which were previously coated with reflector. The dopant gives peak emissions at nm and is commonly used to shift the primary UV scintillation in plastic scintillator. The paint did boost the He scintillation yield, but also produced a signal itself, as was observed when the cell was evacuated, allowing the particles to strike the cell walls. The paint signal was considerably stronger than that from the shifted He scintillation.
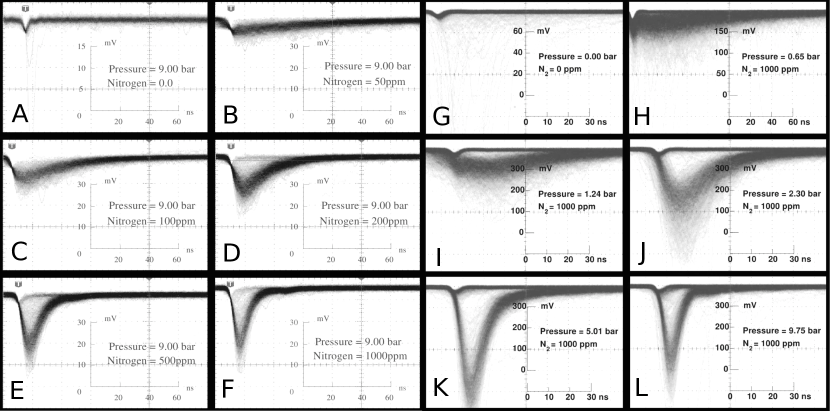
Alternatively a trace of impurity gas was added to the He. Tests were performed using , Xe and a mixture of and Xe, to shift the primary scintillation to the nm range, which is optimum for the bialkalai-cathode XP2262B PMT. Fig. 2A-F show oscilloscope traces for the response as a function of concentration at a pressure of MPa. It can be seen that the pulse decay time decreases as the concentration is increased up to 1000 ppm. With Xe admixtures at much higher concentration (2 - 20%) the peak is less well defined. Adding 500 ppm along with the Xe does not improve the performance and Xe admixtures were not investigated further.
The response also depends on pressure and Fig. 2H-L show that pulse rise and fall times decrease as the pressure was raised to MPa (9.75 bar), although the amplitude dropped between 0.5 and 1 MPa. There was a further, relatively small reduction in amplitude when the pressure was raised to 2 MPa, but the pulse time dependence did not change significantly compared to the 1 MPa case.
Although the gamma-ray detection efficiency is very low, the AT sitting directly in an intense bremsstrahlung photon beam will generate relatively high counting rates, so that a short pulse length is desirable. Furthermore since the goal of the project is precise measurement of photoreaction cross sections, any wavelength-shifting impurity concentration should be kept small. At 1000 ppm concentration the effect on a total cross section measurement will generally be very small (Sec. 3.3.2), although at energies very close to photodisintegration threshold ( MeV) the background may be larger. With this concentration and 2 MPa pressure, a well-defined, sharp signal, with a rise time of ns and fall time of 10 ns, was observed for MeV particles. These operating conditions were used for the tagged photon experiment at MAX IV Laboratory (Sec.4).
3 Monte Carlo Models
The response of the AT has been simulated using a MC model based on Geant-4 [16]. This was performed in two stages. The first (Sec. 3.2) calculates the transport of scintillation photons from the point of their creation up to the point where they produce photoelectrons in the cathode of a PMT. From this the position dependence of the amplitude of the PMT signal is obtained. The second (Sec. 3.3) calculates the energy deposited by photodisintegration products for two, three and four-body breakup of . From that, and the results of the optical transport simulation, the amplitudes of the AT signals at the PMT photocathodes are calculated. This procedure also provides estimates of the effect of materials other than He on the AT signal.
3.1 AT Geometry Specification
Originally the Geant-4 geometry was specified in “Geometry Dependent Markup Language”, derived from the CAD files used to machine the AT components. This method was discarded as the Geant-4 tracking algorithms did not recognise AT boundaries correctly, possibly due to perceived “overlapping volumes”.
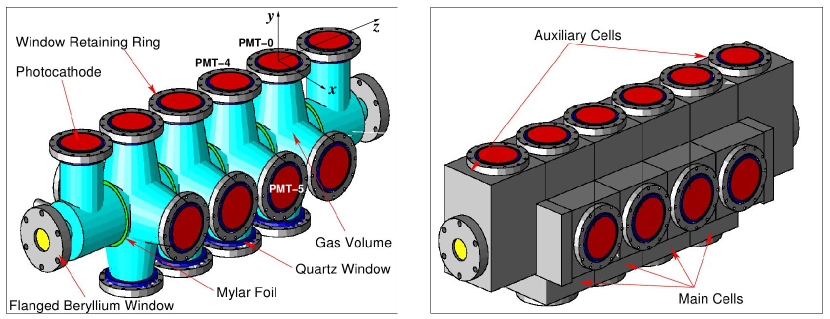
An alternative procedure was developed using combinations of simple shapes (Fig. 3). This models the AT geometry accurately, considering: main cells, window-isolation cells, internal reflective paint (EJ-510), internal Al Mylar foils, quartz windows (HOQ-310), PMT (only the glass window and photo-cathode are modelled), Al window retaining rings and flanged Be windows. This implementation of the geometry behaved correctly with respect to tracking behaviour at the boundaries between volumes.
3.2 Optical Photon Transport
For simulations involving the transport and tracking of scintillation photons, optical properties and boundary characteristics were defined as described in the following.
- 1.
- 2.
-
3.
The He gas refractive index was taken from the calculations of Ref.[13]. This is very close to 1 and had negligible effect on the calculation.
-
4.
The transmission and reflectivity of the Al-Mylar foils were measured using a UV-Visible spectrophotometer. The reflectivity is and transmission consistent with zero at wavelengths in the region of the emission spectrum.
-
5.
The quantum efficiency of the XP2262 photocathode [14] was input as a function of incident wavelength.
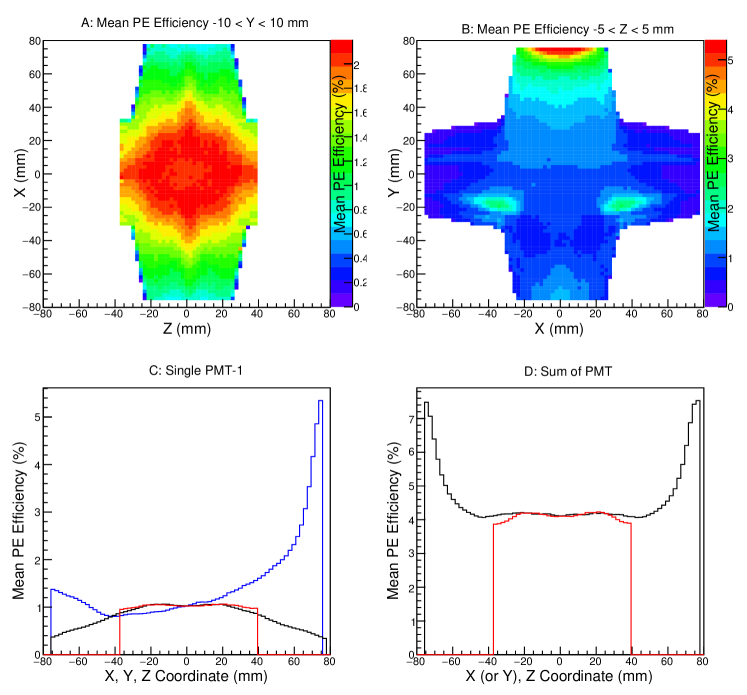
The position dependence of the scintillation signal from the AT was simulated by generating optical photons, at wavelengths sampled according to the emission spectrum [19], at given positions within the AT. Optical photons were tracked and the number of photoelectrons generated in each PMT counted. The starting position was stepped on an grid (Fig. 3: perpendicular PMT-0 axis and the AT axis, y along PMT-0 axis, along the AT axis) and the variation in photo-electron generation efficiency (PE-efficiency) along these directions is displayed in Fig.4. PE-efficiency is the number of photo-electrons produced in a single PMT cathode, expressed as a percentage of the number of scintillation photons started from a given grid point. Thus the quantum efficiency of the cathode, which peaks at for wavelengths in the vicinity of 400 nm, is included. A total of photons were generated, at positions sampled throughout the volume occupied by the gas in an AT cell. The volume was divided into voxels, each of size mm, situated on a grid and, for each voxel, the number of photo electrons generated in the cathode of each of the 4 PMTs was recorded. As would be expected, the highest summed PE-efficiency occurs close to the PMT windows. Away from these regions the variation in summed PE-efficiency is a smooth and relatively slowly varying function of position.
Based on the measured PMT gain, the signal amplitude produced by MeV particles is consistent with a position-averaged signal at a single PMT cathode of photo electrons per MeV.
3.3 Photo-Reaction Modelling
Samples of photodisintegration events, which include 2, 3 and 4-body breakup modes, were produced in an external, ROOT-based [20] event generator. Event sampling used the incident-energy-dependent, partial cross sections for ( MeV), ( MeV), ( MeV) and ( MeV) as given in Ref.[10], which reviewed available data and provided ab initio calculations for the two-body breakup channels. The quantities in parentheses are the reaction threshold energies. We did not include the channel as the cross section is negligible compared to the others. Event sampling was further weighted according to the bremsstrahlung () distribution. The angular distributions of the final-state particles were sampled from available kinematic phase space in the center-of-mass system and then boosted into the laboratory frame. Sampling from a distribution was also performed for the two-body breakup channels, to test the sensitivity of the response to the input angular distributions. Photon interaction points were chosen randomly along the length of the AT, within a cone of half-angle 1.1 mr (defined by the experimental photon collimator), with the angle sampled from the bremsstrahlung angular distribution (Ref.[16]: Koch and Motz distribution 2BS).
Photo-reaction events were then run through the Geant-4 model of the AT. The ionisation energy loss of charged reaction products was calculated using the Bethe-Bloch formula, or parametrised models [16] at low energy where the Bethe-Bloch formalism breaks down. Multiple scattering and other processes were also modelled using the Geant-4 “Low Energy Electromagnetic” package [16]. At the energies employed in the present investigation, hadronic interactions of reaction products in the He gas, target windows and target walls do not produce a large effect. They were however accounted for using the “High Precision neutron model”, “Pre-compound model” and “Low energy parametrised model” which are included in Geant-4 [16].
As charged particles were tracked in discrete steps through the AT gas, the position of each step was obtained. From this, the probability was calculated of a scintillation photon generating a photoelectron at the cathode of each of the four PMTs. This was performed by three-dimensional interpolation from the grid of values obtained in the simulation of optical photon transport (Sec. 3.2). The individual PMT signal amplitudes were derived from the energy losses in the steps, weighted by the interpolated light collection efficiencies to each PMT. These weighted energy losses were accumulated along the track for each PMT, so that the position dependence of the light collection efficiency was folded with the energy loss, and then converted to the (nearest integer) number of photoelectrons. Random fluctuations in this number were simulated by sampling from a Poisson distribution, and the resultant converted back to energy. Electronic noise was modelled by sampling from a Gaussian of width 0.15 MeV, consistent with the observed width of QDC pedestal distributions.
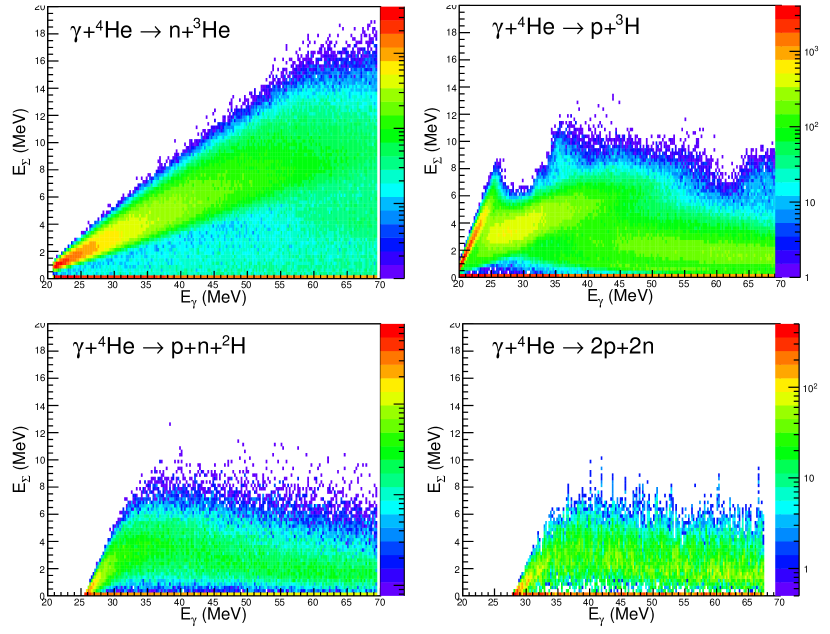
Fig. 5 displays the simulated signal in the AT as a function of incident beam energy. It shows the sum of the calculated signals for all main-cell PMTs (), for charged particles produced by the four breakup modes of . Smearing effects have been omitted to show the intrinsic signal more clearly.
In the MAX IV Laboratory experiment, tagged photons produced photodisintegration events from breakup threshold up to 67 MeV. Neutrons have a very small chance of interacting in the He gas and therefore the distribution produced by is the simplest to interpret. There is one interacting ion, , which stops more readily in the gas than , or ions and therefore provides a means of calibrating the AT energy response. The spread in energy at a given incident photon energy (Fig. 5) results from the spread in angle of the produced . The distribution produced by is more complicated, with the “cusp” at MeV produced when protons cease to stop in the target gas, being the most prominent feature. Three and four-body photodisintegration channels produce relatively featureless distributions.
The AT is not able to separate the various photodisintegration processes cleanly and the measured response is a convolution of the distributions of Fig. 5. MC calculations are compared with the measured response in Sec. 4.
3.3.1 AT Detection Efficiency
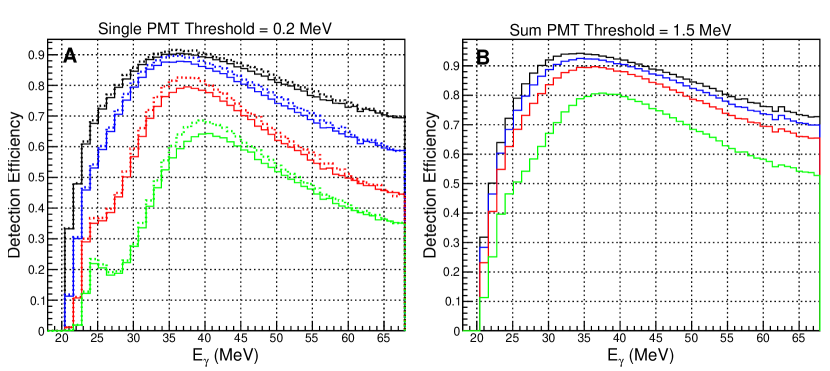
The MC simulation was used to calculate the detection efficiency of the AT for the range of photon energies employed in the MAX IV Laboratory experiment. The energy deposited in the target is significantly different for the different breakup modes of (Fig.5) and close to threshold there is a strong dependence on photon energy. Thus it is important that the reaction event generator models the differential cross sections realistically. Here the employed partial cross sections were obtained from Ref. [10]. Weighting for the bremsstrahlung energy dependence has been included. Pulse height resolution effects, due to photoelectron statistics (5 photoelectrons per MeV in a single PMT (Sec.3.2)) and electronic noise (constant MeV), were folded into the simulation. Detection efficiency is just the fraction of reaction events which produce a summed active target pulse height exceeding a given detection threshold. MC generated data have been analysed using the same event-selection conditions (Sec. 4.1) as the real data. Calculations (Fig.6) were made for summed pulse height detection thresholds ( in the range 0.5 – 4 MeV (the hardware threshold was MeV), with the detection threshold for any single-PMT pulse height ( fixed at values 0.0, 0.1, 0.2 and 0.4 MeV. One PMT only is required to exceed for an accepted event and event time was not considered. Non-constant bin widths in follow the widths spanned by each focal-plane detector of the MAX IV photon tagger. The bump in efficiency observed at MeV for thresholds set above 3 MeV is related to the cusp in deposited proton energy from the reaction (Fig.5). The sensitivity of the calculated efficiency to the employed angular distributions for the two-body breakup channels can be seen in Fig. 6A. A distribution (expected for incident dipole radiation) produces slightly higher efficiency than an isotropic distribution, since particles produced roughly perpendicular to the beam direction will on average see a larger thickness of He gas.
3.3.2 Simulation of Background Events
MC calculations have been made to estimate the effect of photo reactions on the Be windows which hold the gas pressure and the Al-Mylar windows which isolate each cell of the AT optically. The Be has a total thickness of 0.18 , which is almost twice the total thickness of the main AT gas cells (0.103 . The Al-Mylar (each window 0.5 m Al evaporated on 5 m ) has a total thickness of around 0.0035 , about 3% of the thickness of He gas. A detailed analysis of partial cross sections for the nuclei of interest will be made when the total photoabsorption cross section is evaluated. Here a rough estimate of the relative integrated effect of photoreactions on the various nuclei is given in Table 1. is the number of nuclei per relative to He, is the total photoabsorption cross section integrated over the range MeV [10, 17] and is the product , parametrising the relative numbers of photonuclear reactions produced in the in-beam materials. The integrated effect of the 1000 ppm gas admixture is small relative to Al-Mylar.
| Element | (mb.MeV) | ||
|---|---|---|---|
| 1.0 | 105 [10] | 105 | |
| 0.78 | 173 [17] | 135 | |
| 291 [17] | 2.07 | ||
| 361 | 0.36 | ||
| 432 [17] | 1.21 | ||
| 739 [17] | 0.67 |
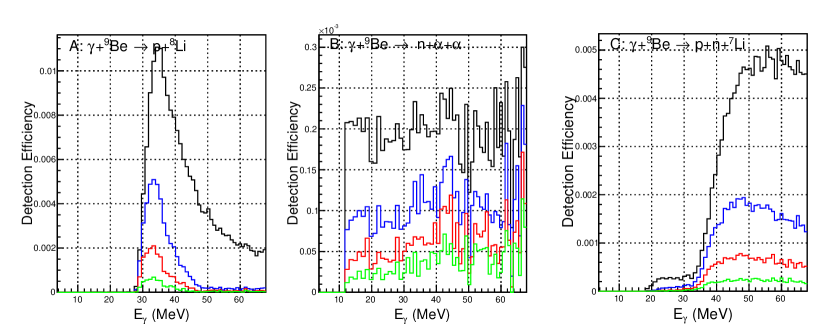
Window-isolation cells reduce the effect of photonuclear interactions in the Be and the MC model has been used to estimate the detection efficiency in the main AT cells for reaction products from , and photodisintegration channels. Calculations follow the method of Sec. 3.3.1 using angular distributions sampled from kinematic phase space. However the reaction cross sections were assumed to be independent of photon energy. Calculations were made for both upstream and downstream windows and the combined results are displayed in Fig.7. At MeV the maximum detection efficiency for a event is slightly over 1%. With low detection thresholds, the main cell closest to the upstream window has a factor 5-6 more events than its next neighbour, but this factor reduces as thresholds are raised. The effect of Be on the measured reaction yield is assessed in Sec. 4.2 by comparison of yields obtained from the two outer and two inner main AT cells.
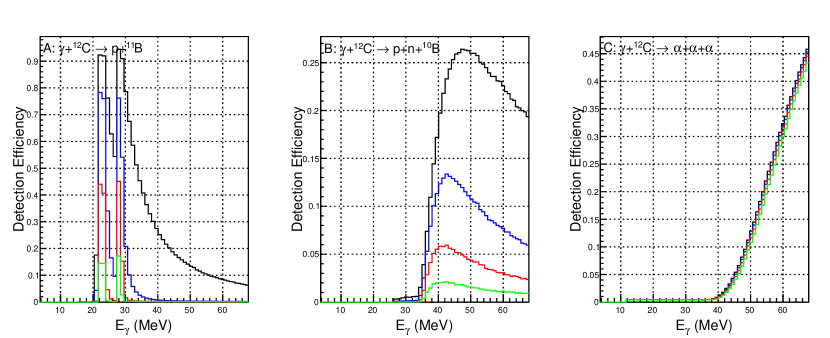
The Al-Mylar windows are thin compared to the Be (Table 1), but on the other hand they are directly adjacent to the main-cell gas and so photo reaction particles are much more readily detected. Carbon has the highest factor of the Al-Mylar elements and Fig. 8 displays MC calculations for , and . The method follows that employed for Be. Single knock out is most important at giant-dipole-resonance energies, with knock out becoming more important (both in terms of efficiency and cross section) at higher energies. The 3 cross section is likely to be very small [21] in the region where its efficiency becomes significant. Measured yields (Sec.4.2) suggest that some non-helium background is detected (especially at low threshold settings) and more detailed MC event generators, which model partial reaction channel differential cross sections as realistically as possible, will be necessary to obtain a more quantitative estimate of this background.
4 Measurements of 4He Photodisintegration at MAX IV Laboratory.
The electron accelerator at MAX IV Laboratory [22], operating in pulse-stretcher mode for nuclear physics experiments, delivers a duty-factor beam up to an energy of MeV and a current of nA. Bremsstrahlung, produced on a thin Al foil, is tagged by detecting the post-bremsstrahlung electron, either in the broad-band main tagging (MT) spectrometer [23] or in the end-point tagging spectrometer. The present experiment used an electron beam energy of 164.7 MeV, with the MT set for a central momentum of 94.8 MeV/c, producing a tagged-photon energy range of MeV. The focal plane detector of the MT was segmented into 62 channels, giving an average channel width of MeV.
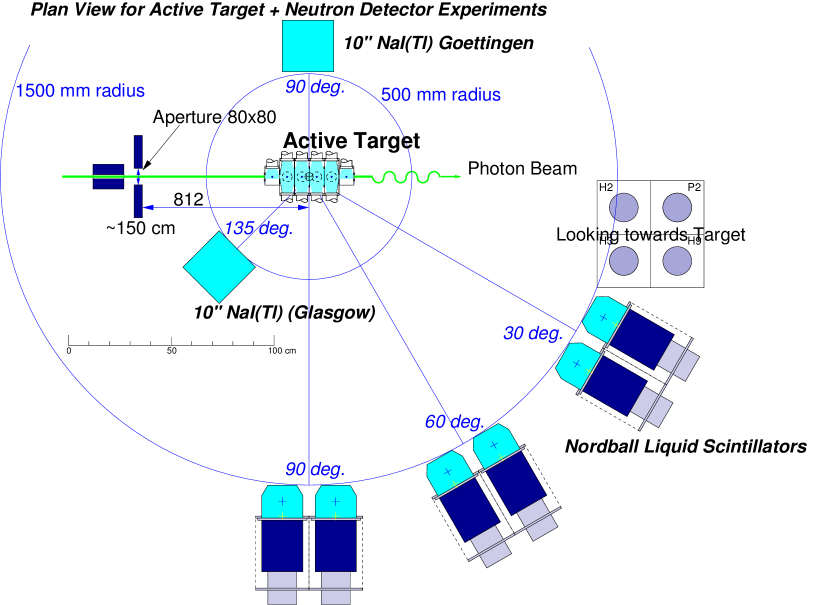
The AT was placed directly in the photon beam (Fig. 9) which was collimated to produce a spot of 11 mm diameter on the entrance window. As the AT is relatively insensitive to the electrons produced in pair-production or Compton-scattering processes and has a sharp scintillation pulse (duration ns) it ran comfortably up to the maximum available photon beam intensity. A time resolution of ns was obtained (Sec.4.1), giving signal-to-random ratio for coincidences with the tagger focal-plane detectors, which at maximum intensity counted at average rates in excess of 1 MHz. Measurements were made at maximum intensity, to obtain reasonable numbers of coincidences between the AT and external detectors, and also at a factor 10 lower intensity for inclusive measurements of the total photo absorption cross section.
Good timing performance makes the AT suitable as a “start” detector for neutron time of flight (TOF) measurement. The TOF spectrometer, the “Nordball” array [24] of liquid scintillators (Fig.9), was positioned at angles and a flight path of m to measure coincident neutrons produced by , and reactions in the target. Neutron energy was measured by TOF [25], with the AT providing the time reference, and pulse shape analysis [26] was employed to distinguish interacting neutrons from photons or electrons. With detection thresholds set to 100 keV electron equivalent, Nordball can detect neutrons of energy above MeV [27, 28].
Two 10” NaI(Tl) counters were positioned at angles to detect energetic photons from nuclear Compton scattering events. The coincident recoiling in the AT, together with the tagged photon energy would in principle allow full reconstruction of the Compton scattering kinematics, enabling efficient rejection of background processes which otherwise contaminate the very weak Compton signal. Analysis of this data is not presented here.
4.1 Collection and Analysis of Active Target Data
Pulses from the 4 PMTs of each main AT cell were summed and fed to discriminators, to produce the data readout trigger. This also gave the start and gate signals for all time- and charge-to-digital converters (TDC, QDC). Photon beams produce a high flux of electron background from atomic interactions of photons with the target gas, entrance/exit windows and air. However the average of electrons in 2 MPa He is keV/cm so that the target is rather insensitive to this background.
Background was observed in the AT, which was not due to He scintillations, since it was present even with the AT evacuated. Generally it had larger amplitude than PMT dark-current noise and has a number of possible sources:
-
1.
electron or positron interactions with the dynodes of the PMTs.
-
2.
electron or positron interactions in the quartz AT windows.
-
3.
electron or positron interactions with the glass PMT cathode windows.
-
4.
neutron interactions with the Boron in the PMT glass.
Empty cell measurements show that non-scintillation processes generally produce a significant pulse height in only one of the four PMTs attached to an AT cell and can be suppressed by demanding that >1 PMT from a cell has fired. All 18 individual PMT signals are attached to discriminators so that the PMT multiplicity can optionally be incorporated in the trigger. Liquid scintillator and NaI(Tl) signals were not included in the trigger, but their pulse amplitudes and hit times were recorded.
The MAX I ring, which provided stretched beam for the tagged-photon facility, operated with a 10 Hz injection rate from a pulsed LINAC. During the first ms of the 100 ms long extraction cycle there is a sharp spike in the beam intensity and thus the electronics were inhibited during this period.
The following parameters were recorded for off-line reaction reconstruction.
-
1.
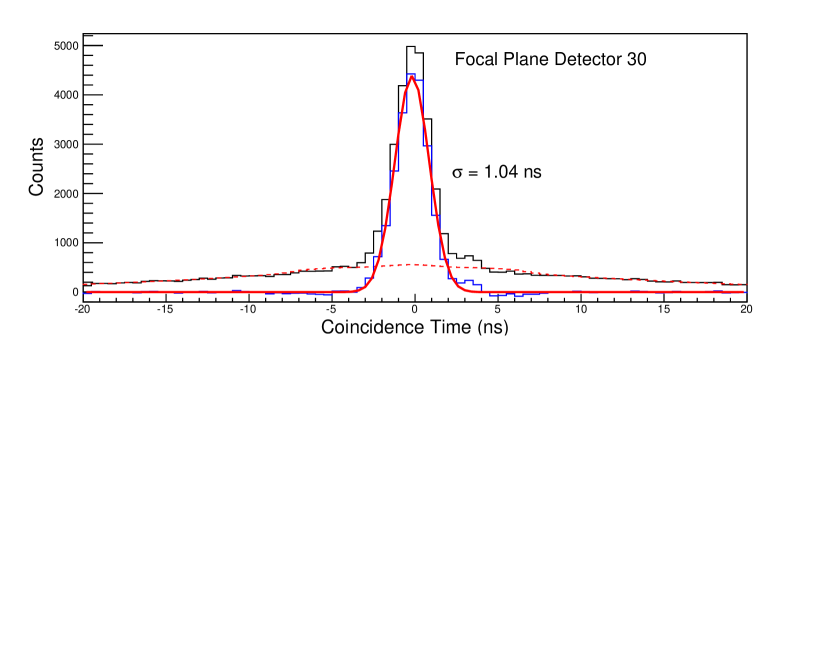
Hit times (relative to the active target) of the 62 plastic scintillators which make the focal-plane (FP) detector of the tagger were recorded in multi-hit TDCs. A coincident hit (Fig. 10) in a particular FP counter corresponds to a particular photon energy with a channel width of MeV. The random coincidence background has been estimated using the technique of Ref.[29] implemented through the “TSpectrum” class of the ROOT analysis library [20]. After subtraction of the background, the integral from -10 to +10 ns of the resulting coincidence peak gives the AT yield for a particular energy bin. The peak in Fig. 10 has been fitted with a Gaussian producing a width ns. Fitted widths for the other FP detectors fall in the range ns.
-
2.
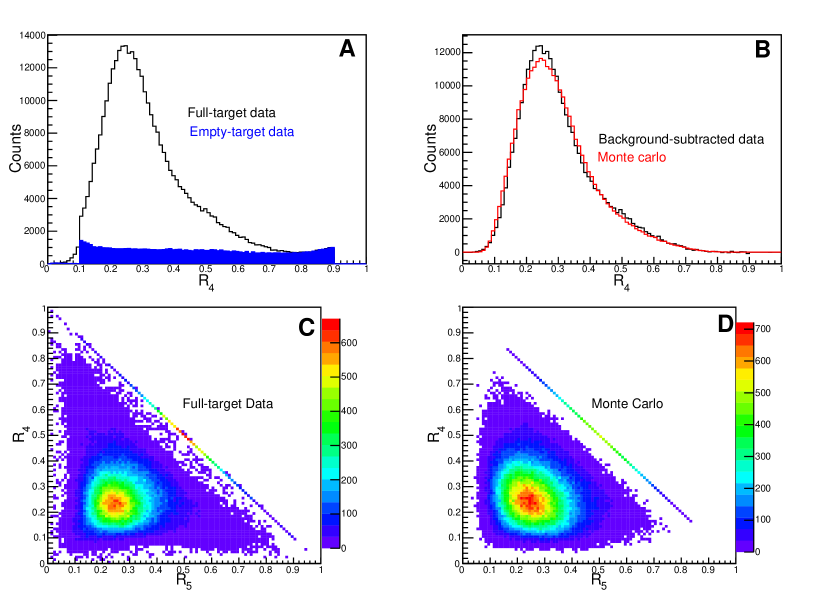
Pulse charge and relative time from all 18 PMTs on the active target were recorded in QDCs and TDCs. The scintillations should produce similar signals in each PMT, while electron interactions in optical windows (Cherenkov light) or the PMT electrodes will produce a disproportionately large signal in a single PMT. Thus the balance of charge can be used to select scintillations. The parameter , where is the charge produced by a single photomultiplier and is the sum of the four PMTs attached to a particular AT cell, should produce a distribution centred at . Fig. 11 compares the measured response with that calculated by the AT Geant-4 model, assuming only scintillation processes in the He gas. The scintillation signal falls within the range and the real data has been filtered so that at least one PMT combination is within these limits of , to suppress spurious, single-PMT hits.
-
3.
Time and amplitude from each of the 12 liquid-scintillator elements of the Nordball array were recorded in QDCs and TDCs. The pulse-shape signal was also recorded in a voltage-to-digital converter (VDC). The neutron TOF signal determines the momentum and signal quality may be enhanced by an off-line cut on the pulse-shape information.
-
4.
Time and amplitude from the two NaI(Tl) counters were recorded in TDCs and QDCs.
4.2 The AT Pulse Height Response
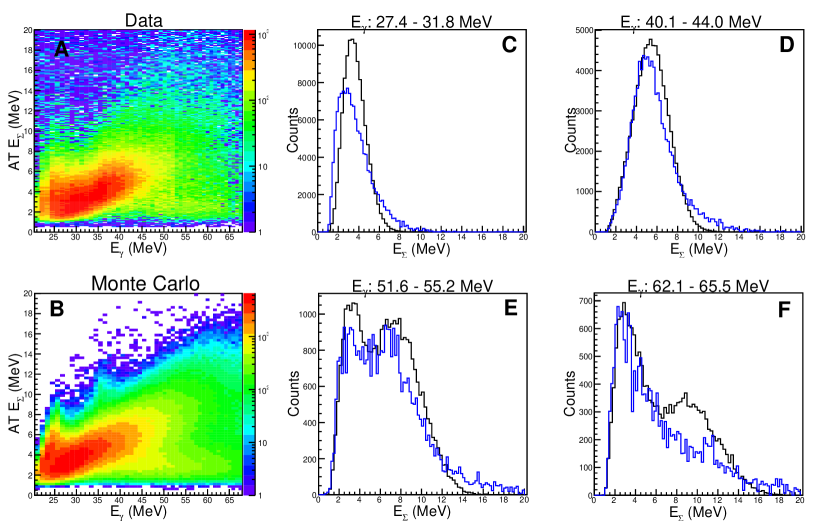
The measured AT pulse height response, as a function of tagged photon energy, is compared with the MC calculation in Fig. 12. Random coincidence contributions to the AT pulse height distributions (see Fig. 10) have been subtracted. There is some variability in the efficiency of the tagger channels, which produces discontinuities in the experimental data. The main features of the measured distribution are reproduced by the simulation, which is binned in identically to the measurement. The band of produced by recoiling and ions, which increases with , is clearly visible. Similarly the “cusp” at MeV, produced as protons cease to stop in the He gas is seen, although the second weaker cusp at MeV is less evident in the experimental data where the statistical fluctuations are greater. In the 1D projections showing distributions for specific bites of , the MC has been normalised to the integral of the data distribution. There are some differences in the shapes which will have the largest effect on detection efficiency (Fig. 12C) at low , close to where thresholds are applied. At higher photon energies (Fig. 12F) the predicted bump at MeV is not visible in the data, suggesting that the cross section input to the MC is too high at MeV.
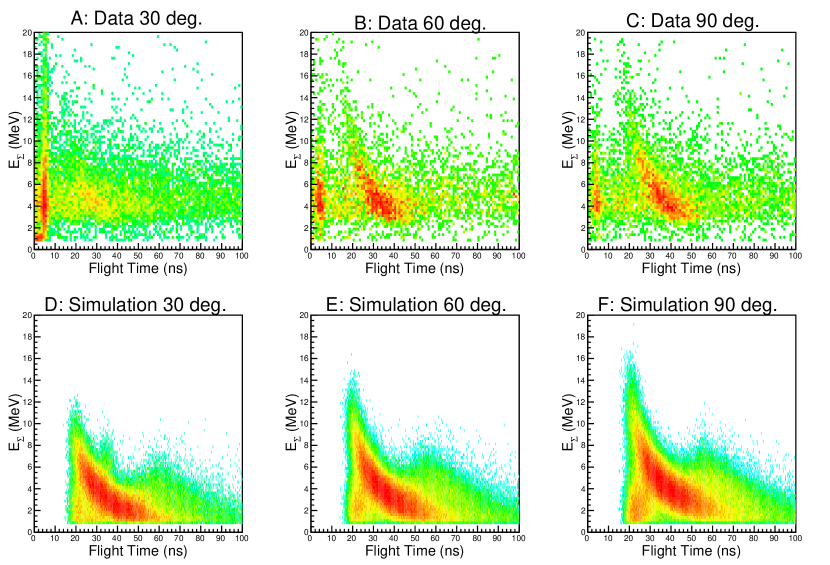
Fig. 13 displays the AT pulse height ( correlation with NordBall TOF. The prominent curved band, corresponding to the final state, is clearly seen in both measurement and MC. These are reasonably consistent, showing the increase in maximum pulse height at TOF ns, as the neutron angle increases from . The MC calculation does not include scattered relativistic photons or electrons, which show as a vertical band in the experimental data at flight times ns.
4.3 Systematic Corrections to the Reaction Yield
The inclusive yield as a function of was determined by integrating the random-subtracted coincidence peaks in the 62 FP time spectra. Data filtering (see Fig.11) to select He scintillation events and subtraction of non-scintillation empty-cell background was applied. This yield was then normalised to units of b using the relation:
| (1) |
The parameters of Eq.1 are explained as follows:
-
1.
is the yield obtained from integration of the coincidence peak of a tagger TDC (Fig.10). Since the inclusive-yield runs were made at relatively low intensity using multi-hit TDCs, dead time corrections to the yield were not necessary.
-
2.
is the AT detection efficiency, obtained from the MC simulation assuming phase-space angular distributions for photoreactions, as described in Sec.3.3.1.
-
3.
is the tagging efficiency, the probability of a bremsstrahlung photon passing through the collimator, given a hit in the FP detector. The tagging efficiency was measured periodically by inserting a 100% efficient Pb-scintillating fibre detector in the photon beam and counting coincidences at reduced beam intensity. The tagging efficiency was determined from the mean of 12 measurements taken periodically between the main runs and was found to vary systematically with photon energy between 8 and 9%.
-
4.
is the number of electrons registered in the tagger, counted by the scalers attached to particular tagger FP detectors. The number of tagged photons incident on the target is .
-
5.
is the number of target nuclei per at 2 MPa pressure. Both AT pressure and temperature were monitored continuously and the overall uncertainty due to gas pressure is estimated at %. Around % will be possible when run-by-run pressure corrections are made. Since the Be windows of the target do not “bow” significantly under pressure, the length of gas in the target (288 mm total) could be determined to better than 1 mm.
Fig.14A displays the effect on of background and efficiency corrections, where the error bars show the statistical uncertainties. The size of these corrections depends on the applied and : respectively the single and summed PMT energy thresholds. The background increases and the efficiency correction decreases as the thresholds are lowered. Fig.14B compares from the two outer and two inner AT main cells. There is no significant difference, consistent with an insignificant background from the Be windows.
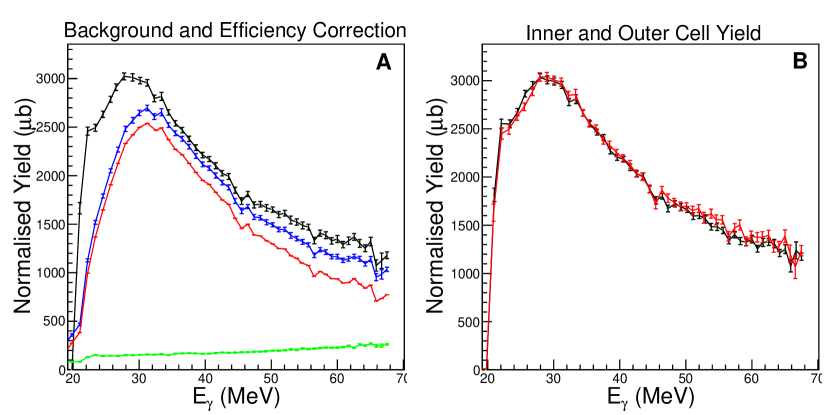
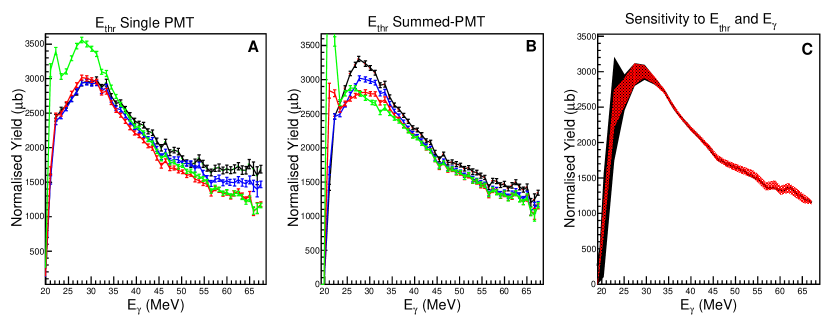
Fig.15 displays the effect on of varying and . In panel A is fixed at 1.5 MeV. At MeV, is relatively stable with respect to , apart from MeV where the efficiency correction appears to be too large. Above 40 MeV, drops as increases to 0.2 MeV, but stabilises between 0.2 and 0.4 MeV. With fixed at 0.2 MeV (Fig.15B) is quite stable with respect to change in at MeV, but there is significant variation at lower energies. At MeV the efficiency correction is apparently too large for MeV. Panels A and B show statistical uncertainties, while C gives an estimate of the sensitivity of the corrected yield to systematic effects at MeV, MeV. The black error band shows the effect of a systematic error of MeV in the calibration of , which is large below 30 MeV. The red error band shows the effect of a systematic error of MeV in the calibration of . Again this is largest at lower photon energies.
Although is given in b, it is not yet a cross section. Overall has greatest stability with respect to variation in threshold at MeV and MeV, but it is apparent that the MC calculation of detection efficiency requires improvement. For the sensitivity of the calculated efficiency to the relative cross sections for the different breakup channels needs to be examined more carefully: for example the lack of observed signal compared to MC at higher . Data for this and the three- and four-body breakup channels are rather sparse at MeV. More realistic modelling of the angular distributions may also be necessary as the present calculations show a modest sensitivity in this respect. The Be windows appear not to have a significant effect, but contributions from the Al-Mylar windows remain to be evaluated in detail. The integrated effect cannot be large (Sec.3.3.2), but different (from ) dependence of differential cross sections could produce significant localised effects, especially close to breakup threshold.
5 Summary and Outlook
A He gas scintillator has been developed for photonuclear reaction experiments. The scintillator operates at a pressure of 2 MPa and uses an admixture of 1000 ppm of to shift the primary scintillation from UV to visible wavelengths. When used as an active target, this level of admixture keeps contributions to cross section measurements below the 1% level in general. The scintillation pulse has a rise time of ns and fall time of ns, so that the detector can provide a precise time reference and run at relatively high rates.
An experiment at the MAX IV Laboratory tagged photon facility has shown that the He gas scintillator can be used as an active target for photonuclear studies. Runs at full photon beam intensity demonstrated the timing and rate capability of the AT. In addition they produced sufficient coincident counting rate to correlate the AT signal with neutral particles escaping and interacting in an external TOF spectrometer. This detector system has already been used to measure the photon asymmetry, of [30] with linearly-polarised incident photons.
The ability of the AT to provide an accurate measurement of the total photoabsorption cross section was assessed from data taken at a factor lower beam intensity, where rate-dependent corrections to yields are very small, and an open trigger may be used without overwhelming the data acquisition system. Even at reduced intensity, excellent statistical uncertainties were obtained with a few days of running. Similarly small systematic uncertainties can be achieved for MeV, but as breakup threshold ( MeV) is approached the size of the detection efficiency correction, and its uncertainty, increases. Work is in progress to finalise the tagged-photon energy calibration and to extend the MC event generators to give a more realistic description of photoreactions on He and other AT materials. These will both have a bearing on the final evaluation of the total photoabsorption cross section and its systematic uncertainty.
In the future it is planned to use a gas scintillator to measure in conjunction with the Crystal Ball electromagnetic calorimeter at Mainz [31]. The possibility to use Si photomultipliers inside the pressure vessel to detect the scintillation is being investigated.
Acknowledgements
The authors acknowledge the outstanding support of the MAX IV Laboratory staff. We are also grateful for the support of the UK Science and Technology Facilities Council (grant numbers 57071/1, 50727/1 and ST/H003177/1), the Swedish Research Council, the Knut and Alice Wallenberg Foundation and the Crafoord Foundation.
References
- [1] J.B. Birks, The Theory and Practice of Scintillation Counting, Pergammon Press, Oxford 1964.
- [2] C. Eggler and C.M. Huddleston, Nucleonics, 14 (1956), p. 34.
-
[3]
H. Wilkens et al., J. Phys. Conf. Series 160
(2009), p. 012043.
G. Aad et al., Eur. Phys. J. C70 (2010), p. 723. - [4] G.L. Morgan and R.L. Walter, Nucl. Instr. and Meth. 58 (1968), p. 277.
- [5] H. Davie and R.B. Galloway, Nucl. Instr. and Meth. 108 (1973), p. 581.
- [6] L. Drigo et al., Nucl. Instr. and Meth. 166 (1979), p. 261.
- [7] E.H. Thorndike and W.J. Shlaer, Rev. Sci. Instr. 30 (1959), p. 838.
- [8] I. Kazuo et al., Nucl. Instr. and Meth. A262 (1987), p. 323.
- [9] D.N. McKinsey et al., Nucl. Instr. and Meth. A516 (2004), p. 475.
- [10] S. Quaglioni et al., Phys. Rev. C69 (2004), p. 044002.
- [11] T. Kii et al., Nucl. Instr. and Meth. A552 (2005), p. 329.
- [12] R. Al Jebali, Ph.D. Thesis, University of Glasgow, 2013. http://www.nuclear.gla.ac.uk/npe-theses/AlJebali_thesis.pdf
- [13] Y. M. Chan and A. Dalgarno, Proc. Phys. Soc. 85 (1965), p. 227.
- [14] Type XP2262, Data Handbook Photomultipliers, Philips Components Ltd., Book PC04, 1990.
- [15] Eljen Technology Ltd., http://www.eljentechnology.com.
-
[16]
S. Agostinelli et al., Nucl. Instr. and Meth.
A506 (2003), p. 250.
Geant-4 Physics Reference Manual Version 10.0, 6th Dec. 2013, http://geant4.cern.ch/support/userdocuments.shtml - [17] J. Ahrens et al., Nucl. Phys. A 251 (1975), p. 479.
- [18] Data sheet HOQ-310 fused quartz POL-O/424M-E, Heraeus, http://optics.heraeus-quarzglas.com/media/webmedia_local/datenbltter/O424me_HOQ.pdf
- [19] E. Wiberg, N. Wiberg and A. F. Holleman, Inorganic Chemistry p. 1655, Academic Press, 2001, ISBN 0-12-352651-5.
- [20] R. Brun et al., http://root.cern.ch/drupal/content/users-guide
- [21] F. K. Goward and J. J. Wilkins, Proc. Royal Soc. London A 217 (1953), p. 376.
- [22] J.-O. Adler et al., Nucl, Instr. and Meth. A715 (2013), p. 1.
- [23] J.M. Vogt et al., Nucl. Instr. and Meth. A324 (1993), p. 198.
- [24] M. Cronqvist et al. Nucl. Instr. and Meth., A317 (1992), p. 273.
- [25] J.R.M. Annand et al., Nucl. Instr. and Meth. A400 (1998), p. 344.
- [26] J.R.M. Annand et al., Nucl. Instr. and Meth. A262 (1987), p. 371.
- [27] A.J.H. Reiter, Ph.D. thesis, University of Glasgow 2004, http://www.nuclear.gla.ac.uk/npe-theses/Reiter_thesis.pdf
- [28] A. Reiter et al., Nucl. Instr. and Meth. A565 (2006), p. 753.
- [29] M. Morhac et al. Nucl. Instr. and Meth. A401 (1997), p. 113.
- [30] V. Ganenko et al., A measurement of the reaction cross section asymmetry below pion photoproduction threshold, MAX IV Laboratory proposal 10-02, November 2010.
- [31] J.R.M. Annand et al., Experiment proposal A2-01/13, Mainz Microtron MAMI, 2013, http://wwwa2.kph.uni-mainz.de/images/PAC2013/MAMI-A2-01-2013.pdf