Enhancement of Light Yield and Stability of Radio-Pure Tetraphenyl-Butadiene Based Coatings for VUV Light Detection in Cryogenic Environments
Abstract
The detection of VUV scintillation light, e.g. in (liquid) argon detectors, commonly includes a reflector with a fluorescent coating, converting UV photons to visible light. The light yield of these detectors depends directly on the conversion efficiency. Several coating/reflector combinations were produced using VM2000, a specular reflecting multi layer polymer, and Tetratex® a diffuse reflecting PTFE fabric, as reflector foils. The light yield of these coatings was optimised and has been measured in a dedicated liquid argon setup built at the University of Zurich. It employs a small, 1.3 kg LAr cell viewed by a 3-inch, low radioactivity PMT of type R11065-10 from Hamamatsu. The cryogenic stability of these coatings was additionally studied. The optimum reflector/coating combination was found to be Tetratex® dip coated with Tetraphenyl-butadiene with a thickness of 0.9 mg/cm2 resulting in a 3.6 times higher light yield compared to uncoated VM2000. Its performance was stable in long term measurements, ran up to 100 days, in liquid argon. This coated reflector was further investigated concerning radioactive impurities found to be suitable for current and upcoming low-background experiments. Therefore it is used for the liquid argon veto in Phase II of the Gerda neutrinoless double beta decay experiment.
keywords:
Noble liquid detectors; Photon detectors for UV, visible and IR photons (gas); Dark Matter detectors; Double-beta decay detectors1 Introduction
Liquid argon is used as a scintillator in several present experiments such as Gerda [1], ArDM [2], DarkSide [3], DEAP [4] and ICARUS [5] and a likely candidate for upcoming experiments like DARWIN [6] and GLACIER [7]. Its scintillation light has a wavelength of 128 nm which is below the transmittance of quartz, a commonly used window material of light detection devices like photomultiplier tubes (PMTs). The light is usually converted to longer wavelength by a coating containing the wavelength shifter (WLS) Tetraphenyl-butadiene (TPB). The focus of developments presented in this paper is set on the production of square meter scale WLS reflectors showing long-term stability in liquid argon, a high light yield and low radioactivity. The light yield was measured for coatings applied to reflective materials. Many of these coatings are transparent, hence they allow a direct transfer to applications where transmitted light is detected, e.g. PMTs. The coated reflector installed as part of the liquid argon veto of Gerda is an outcome of the developments presented in this paper. The veto is an important part of the upgrade to Phase II [8]. Earlier developments for LArGe [9] and long term stability issues observed therein were the starting point of the presented developments.
2 Description of Coatings, Reflectors and Coating Procedure
Coatings are applied onto VM2000 Radiant Mirror foil, 254 m thick Tetratex® and Copper. VM2000 is a multilayer polyester foil with ¿98 % specular reflectance from 3MTM [10] (very similar or possibly identical to VikuitiTM ESR). It is stiff and available only with glue on one side which was removed before application of the coatings. VM2000 acts as a wavelength shifter by itself emitting light of approximately 420 nm for an excitation wavelength of 260 nm as shown in Fig. 4. Tetratex® is an expanded PTFE fabric from Donaldson [11] with high diffuse reflectance. It is very flexible, can be stretched easily and resists strong forces before ripping. The stretch is mostly elastic making it suitable to span over uneven surfaces. Cu is of importance as it is a known low radioactivity material commonly used in many low background experiments. It was treated with acetic acid before coating in order to remove copper oxide.
All coatings are produced by pulling the reflectors at an angle of about 45∘ through a solution containing the respective fluorescent substance. For this purpose, a dedicated tool was developed consisting of a pot containing the solution and two rotating cylinders. The reflector is inserted between the two cylinders and pulled trough the bath situated below the second cylinder.
Four coatings using Makrolon®, TPB and Dichloromethane with different ratios of TPB to Makrolon® were produced. The amount of TPB + Makrolon® adds up to 31.3 g per liter of Dichloromethane in each solution. In such a coating the TPB is embedded into a polymer matrix which provides mechanical stability. Additionally, pure TPB was dissolved in Dichloromethane with concentrations from 5.8 g/l to its saturation at 46 g/l. A coating containing 3g/l TPB + 30 g/l polystyrene dissolved in Toluene, which had been found to be a stable and efficient coating for liquid argon scintillation light in [12], was provided by the MPIK Heidelberg. Commercial plastic scintillators are also good candidates for efficient wavelength shifters. For this reason UPS-923A, BCF-10 and BC 408 were dissolved in Toluene with a concentration of 33 g/l and coated on VM2000. The thickness of each coating was determined by measuring the weight of a small reflector sample before and after coating. The thickness of latter coatings were 0.16 mg/cm2, 0.26 mg/cm2 and 0.25 mg/cm2 respectively. It was measured five times for VM2000 with 80 % Makrolon® and 20 % TPB resulting in a thickness of 0.082 mg/cm2 with a variation of . Four coatings of VM2000 with polystyrene + TPB resulted in 0.073 mg/cm2 with a variation of .
With the coating tool described above, it is not possible to avoid an undetermined amount of coating being also deposited on the backside of the reflector. For this reason coatings on VM2000 produced to measure the thickness were done vertically dipping the sample into a bath and slowly pulling it out again. Pulling vertically instead of under an angle of 45∘ might result in a slightly thinner coating than obtained using the coating tool.
The fabric nature of Tetratex® causes the solution to be soaked up by the foil. As a result, the coating is on both sides of the foil as well as within it. This allows to coat with a solution containing only TPB and the solvent. Applying this coating, Tetratex® shrinks by 40 % and becomes curly while the solution is drying. This can be avoided by fixing it to a PTFE sheet. The deposited amount of TPB was in the range of 0.17 to 1.18 mg/cm2 depending on the concentration of TPB. The thickness of these coatings was reproducible within 3 %. This uncertainty is assumed for the thickness of all coatings of this type.
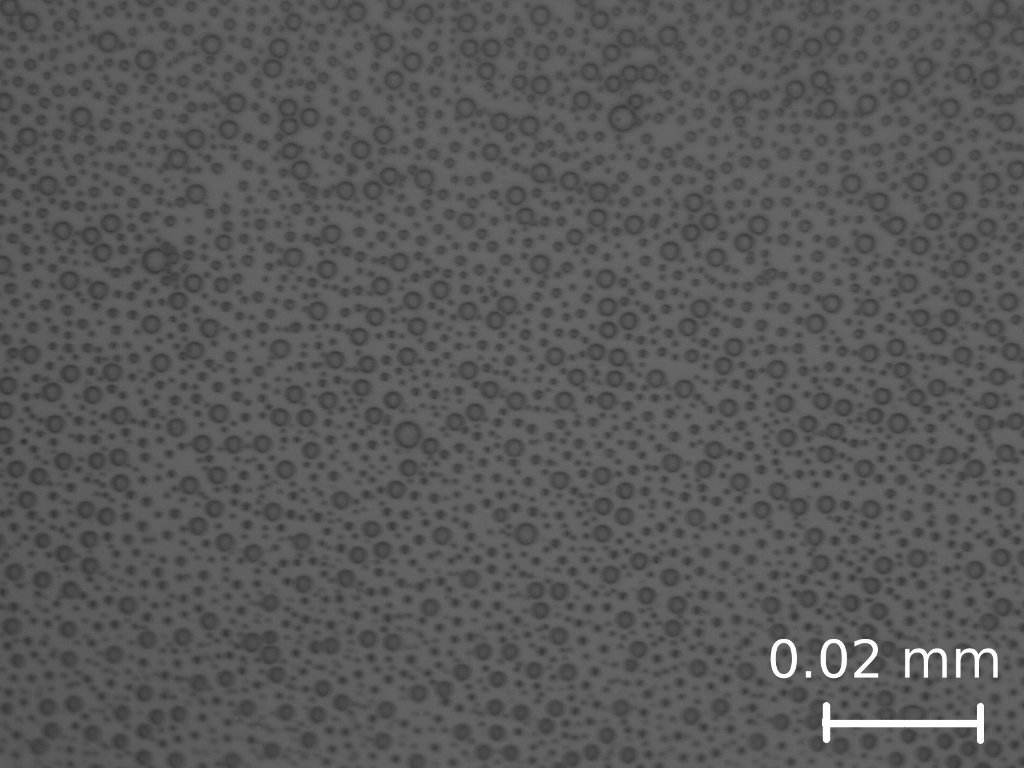
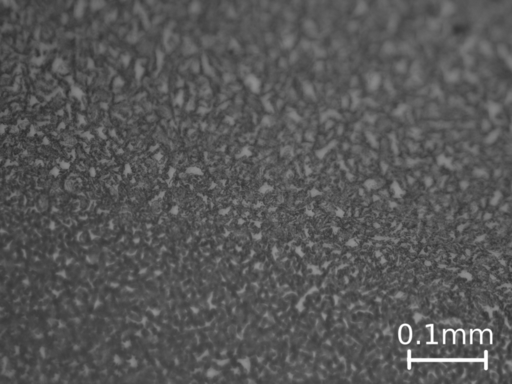
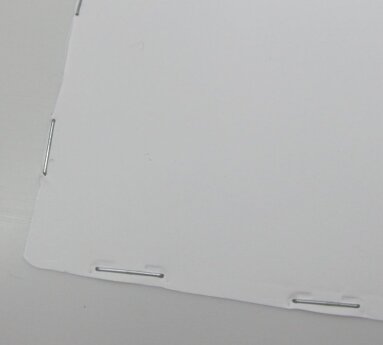
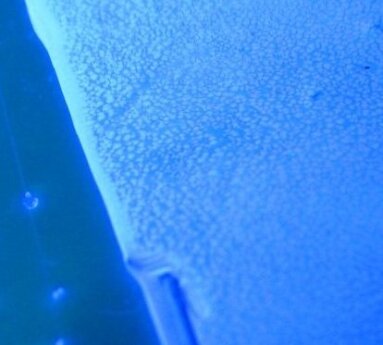
Coated samples of all produced coating - reflector combinations were inspected by eye and with a light microscope using both UV and visible light. polystyrene + TPB coatings are completely clear (Fig. 1 left). Under UV light they appear less bright than Makrolon® + TPB coatings, which is an indication for a worse efficiency. Samples coated with Makrolon® + TPB look milky (Fig. 1 right). The higher the concentration of Makrolon® relative to TPB the more uniform the coating. The origin of the milky appearance are small bubbles of different sizes (Fig. 2 left) visible under the microscope. Adding more solvent significantly decreases the number of bubbles per area and increases their size. Micro crystals are forming for a concentration of 80 % TPB and 20 % Makrolon® (Fig. 2 right). These are most likely crystals of pure TPB not embedded into the polymer matrix.
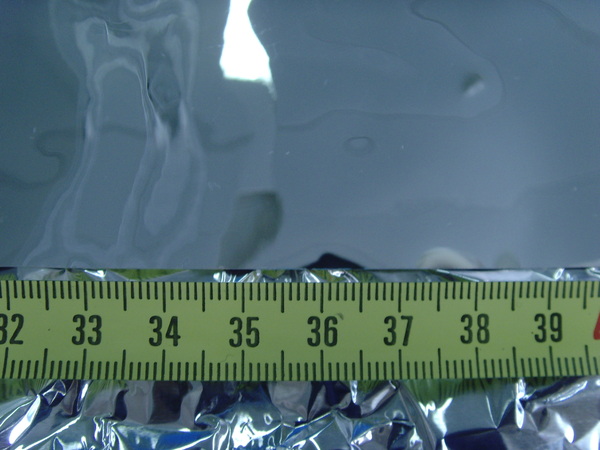
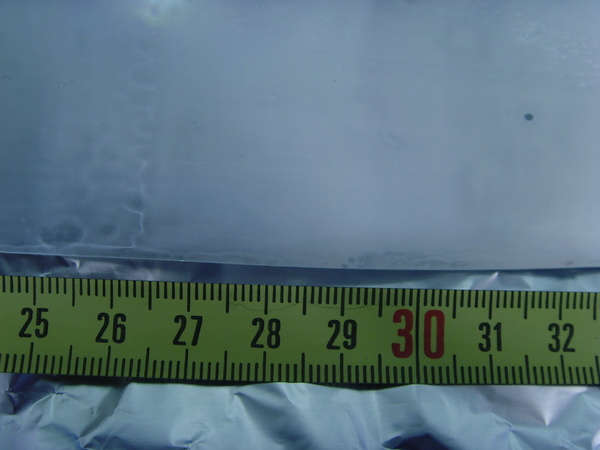
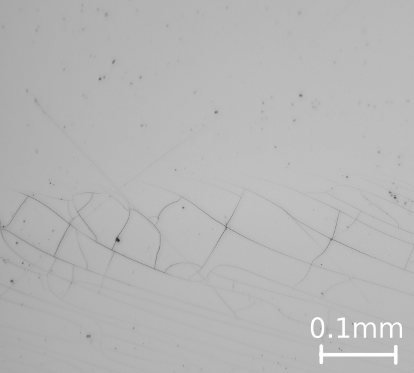
Tetratex® coated with pure TPB looks perfectly white under visible light, both by eye (Fig. 3 left) and with the microscope. Under UV light there are small spots visible which are more bright than the rest. These spots have a size in the range of 0.1 - 1 mm. The spot size is varying even when using the same concentration of TPB in the solution. The area covered by these spots increases with the concentration of TPB in the solution. As an example, the central picture in Fig. 3 was taken from a coating with 0.73 mg/cm2.
Additionally, a Tetratex® and a VM2000 sample evaporatively coated with TPB as described in [13] and [14] respectively, were kindly provided by the respective groups. For the apparatus used to coat the first sample, a capability to coat reflector sheets with up to 120 x 25 cm2 is reported. For the latter a maximum size of 45 x 45 cm is estimated from the information provided in [14].
In summary, the following samples are investigated:
VM2000: bare, TPB + Makrolon® in various concentrations, polystyrene + TPB 10:1, UPS-923 A, BCF-10, BC 408, pure TPB
evaporated;
Tetratex®: pure TPB dip coated in various thicknesses, pure TPB evaporated;
Cu: TPB + Makrolon® in various concentrations and polystyrene + TPB 10:1.
3 Mechanical and Cryogenic Stability
Several tests including wiping, scratching, bending and blowing air onto the sample have been performed to gather information on the abrasive stability of all previously described coatings, before and after immersion into liquid nitrogen. Wiping with a vinyl glove over Tetratex® coated with pure TPB results in small amounts of TPB on the glove visible using UV light but does not leave observable traces on the foil, both under UV and visible light. The same is true for the sample with TPB evaporatively deposited on VM2000. A summary of the mechanical stability tests together with basic sample properties is provided in Table 1.
| Reflector | Tetratex® | VM2000 | ||||
|---|---|---|---|---|---|---|
| characteristic | elastic, fabric | stiff, multilayer | ||||
| coating | dip coated | evaporated | evaporated | Mak. 40 % | Mak. 20 % | PS 91 % |
| reflectivity | diffuse | diffuse | diffuse | prim. specular | prim. diffuse | specular |
| bending | + | + | + | + | + | + |
| blowing | + | - | + | + | + | + |
| wiping | o | - | o | + | - | + |
| scratching | - | - | - | - | - | - |
Each sample had been cycled 10 times and stored in liquid nitrogen for 72 days. Afterwards all samples where inspected for cracks using a microscope. TPB + polystyrene coatings developed cracks (see Fig. 3 right) already after the first immersion into liquid nitrogen. These cracks developed preferably at sub-mm to mm scale locations having a thicker coating due to imperfection of the coating method. None of the other coatings developed any cracks, not even when bending the coated reflector while immersed in liquid nitrogen. No change has been observed in the mechanical stability after immersion into liquid nitrogen for any sample.
4 Fluorescence Spectra at an Excitation Wavelength of 260 nm
The emission spectra of all coatings described in Section 2 except for the commercial scintillators have been measured at an excitation wavelength of 260 nm employing a fluorescence spectrometer of type Cary Eclipse from the Varian company [15] at the MPIK Heidelberg. It employs a monochromator on the excitation and emission side to select a specific wavelength from a continuous spectrum. It is however transparent for light with wavelengths of multiples of the selected one. The device automatically corrects for its spectral sensitivity and is regularly calibrated by the producer. Samples were installed under an angle prohibiting specular reflectance into the spectrum analyser. A representative selection of these measurements is shown is Fig. 4. The peak at 520 nm ( nm) is diffusively reflected light of twice the excitation wavelength. This peak is not related to the shifting efficiency but corresponds to the diffusivity of the sample. A large peak at 520 nm as observed for dip coated Tetratex® does hence mean a large diffuse component of the reflectivity (diffuse reflector). Otherwise a small peak as for uncoated VM2000 means a small diffuse component (specular reflector). VM2000 (blue lines in Fig. 4) was used as a reference, to monitor the time stability of the measurement apparatus and the reproducibility of the measurements. The amplitude of this spectrum was varying by approximately 10 %.
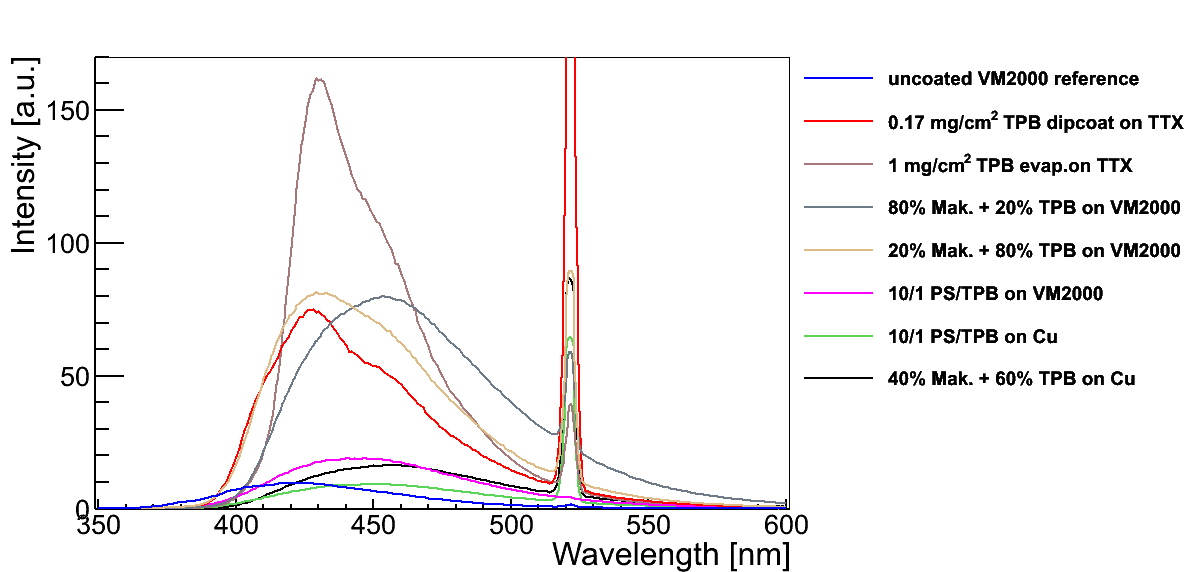
The dark brown line in Fig. 4 shows TPB evaporatively deposited onto Tetratex®. For the given thickness of 1 mg/cm2 the spectrum is expected to be strongly dominated by the properties of TPB, independent of the used substrate (see Fig. 8 right in [13]).
Coating Tetratex® by wet dipping with 0.17 g/cm2 (red line in Fig. 4) results in more light emitted at the low wavelength side of the spectrum but a smaller overall efficiency. As shown in section 5.4 the light yield of this coating can be increased by a thicker layer of TPB.
Coatings with TPB + Makrolon® on VM2000 and Makrolon® concentrations of 40, 60 and 80 % have the same spectral shape and light yield within the uncertainty of the measurement. Representatively shown is the spectrum for 80 % Makrolon® and 20 % TPB (gray line in Fig. 4). The spectral shape of coatings with 80 %TPB and 20 % Makrolon® on VM2000 is dominated by TPB with a small effect of the Makrolon® content.
Coatings on Cu (green and magenta lines in Fig. 4) have a significantly reduced light yield compared to the same coatings on VM2000. This shows the importance of the reflector itself. These results are however still important for detector components which can not be covered by reflector foils.
5 Light Yield in Gaseous and Liquid Argon
The scintillation light of argon has a shorter wavelength of 128 nm compared to the 260 nm of the fluorescence spectrometer. The light yield and emission spectrum from the reflector foil can be different for these two wavelength which makes it necessary to confirm the result at the excitation wavelength of interest. A special setup was built for this purpose, also to study possible effects of argon gas and liquid argon (87 K at standard pressure) both on the stability and light yield. The latter can be affected in two ways. First, a change in temperature has been observed to cause a slight change in the emission spectrum of TPB [14] and a thermal contraction of the reflector. Second, the refractive index is different for liquid argon and air resulting in changed refraction and reflection properties at the wavelength shifter - argon and argon - light detection device surfaces.
5.1 Scintillation Process in Argon
Charged particles crossing gas or liquid argon cause excitation and ionization of argon atoms which collide with other Ar atoms to form Ar2 molecules, so called excited dimers or excimers [16]. These excimers are produced in a singlet and a triplet state with life times of 7 ns and 1600 ns, respectively [17]. The decay of these molecules emits light with a wavelength of 128 nm. Impurities such as oxygen, water or nitrogen provide an additional non radiative decay channel by collisions [18]. This effect is significantly larger on the triplet state due to its longer life time. This makes the triplet life time a good measure of the purity.
5.2 Experimental Setup
The liquid argon setup is shown in Fig. 5. The inner volume is evacuated by a turbo molecular pump to a pressure below mbar. Argon with a purity of 99.9999 % (6.0) is filled from a gas bottle. Liquid nitrogen is used to condensate argon on a Cu cooling coil. The cooling power is regulated by the flow rate of evaporated nitrogen at the output side of this coil. The liquid level is measured employing a capacitive level meter. The temperature inside the chamber is measured by two PT-100 resistant thermometers. One is located at the bottom of the cryostat and one just above the PMT face to additionally verify a sufficient fill level. A hollow PTFE cylinder is placed between the cryostat wall and the active volume when operating in liquid to reduce the amount of argon needed.
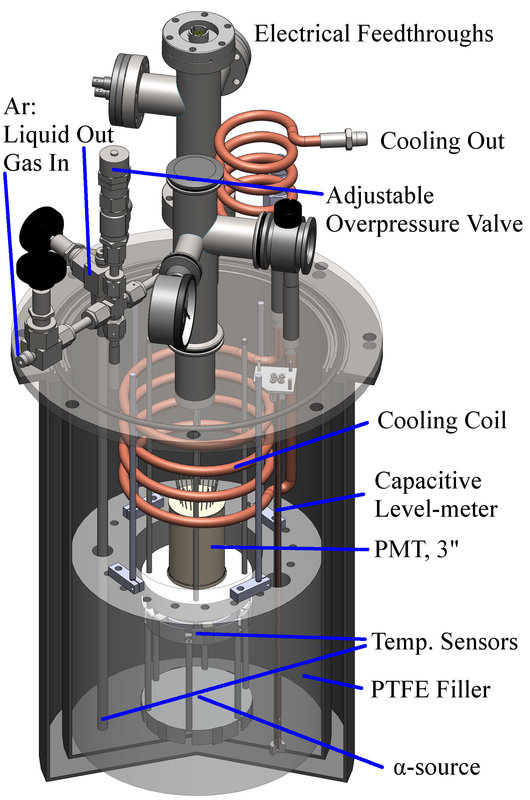
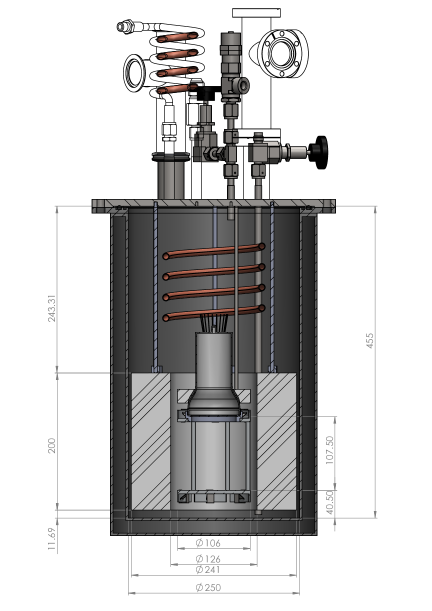
A reflector foil to be measured is installed, forming the mantle of the active volume of kg of liquid argon defined by an aluminium cylinder. The cylinder consists of a top ring holding the PMT and a bottom ring holding an 241Am source. Dimensions are provided in Fig. 5 right. Both rings have a rim directed outwards and are connected by six aluminium bars equally distributed on the outer edge of the cylinder inside the active volume. The reflector foil is wrapped around this cylinder and clamped to the top and bottom rim cut to a length allowing 5 – 20 mm of overlap. It is taken care to minimise gaps between the rim and the reflector foil as well as where the foil is overlapping. The shifted light is detected with a 3 inch low radioactivity PMT of type R11065-10 from Hamamatsu [19], closing the top part of the active volume. Scintillation light hitting the PMT directly is absorbed by its quartz glass window and not detected. The PMT signals are recorded without amplification using a 250 MHz ADC with 12 bit resolution.
241Am source for cryogenic liquids
The 241Am source was prepared by means of the Molecular Plating technique [20], [21], [22]. Electrodeposition was performed from a 241Am nitrate solution in isopropyl alcohol using the cell shown in Fig. 6, with an inner diameter of 16 mm and a diameter of 7 mm of the deposition zone. Prior to use, 25 m stainless steel backing material was treated with a diamond polish (1 m grain size) and subsequently rinsed with distilled water and ethanol. The 241Am solution (about 10 ml) was filled into the cavity of the deposition cell. A spiral-shaped Pt wire covering the required circular deposition area (0.3 cm2) served as a counter electrode and was placed at a distance of about 1 cm from the cathode. 1 h electrodeposition at 600 V allowed for production of homogeneous 30 Bq 241Am source with qualitative yield (i.e. 80 to 90 % of Am is deposited).
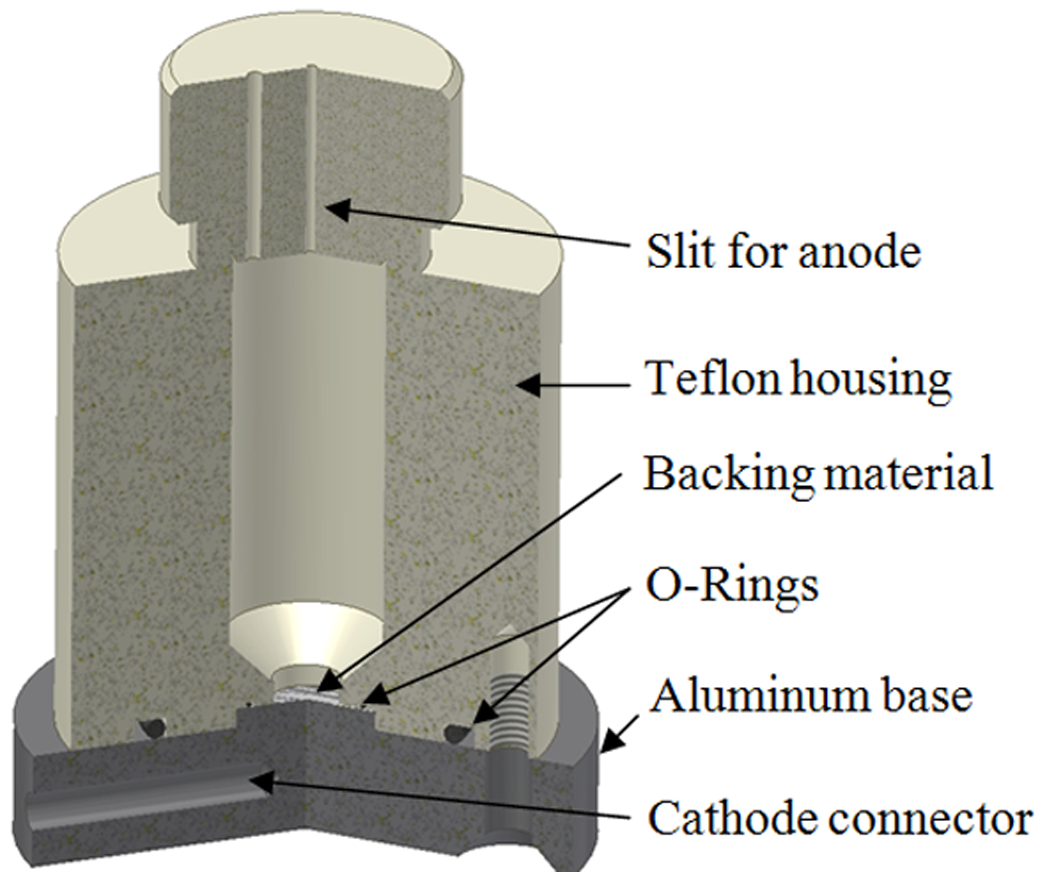
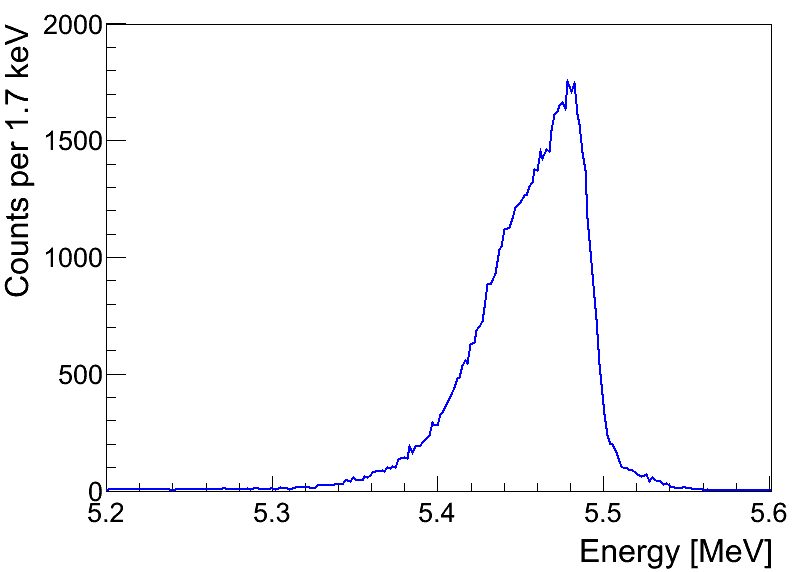
An effective 241Am thickness of 0.62 ng/cm2 was expected according to the measured 241Am activity, but a visible deposition was observed pointing to a considerable high amount of inactive carrier material (zircon iodate). This carrier was used in preparation steps producing the 241Am stock solution to enhance the chemical yield. Therefore, the resolution of the -peak in the spectrum (Fig. 6) was degraded in a way that the satellite -line of 241Am (5.388 MeV, 5.443 MeV, 5.511 MeV and 5.544 MeV) could not be separated from the main -line at 5.486 MeV.
The mechanical stability of the deposition was tested after the preparation using -spectroscopy. The sample was placed 2 mm in front of the carbon fibre window of a Canberra BEGe-2825 high purity Ge-detector and measured for 15 min. The recorded, background subtracted peak area of the characteristic 241Am -line at 59.54 keV was 3496. The sample was immersed in liquid nitrogen for min and warmed up to room temperature afterwards. This procedure was repeated 10 times. Afterwards, a second -spectrum was recorded under identical conditions yielding a peak area of 3532. The count rate before and after these treatments are therefore identical within the statistical uncertainties.
5.3 Analysis Methods
The light yield of each coating is determined in terms of the number of photoelectrons (pe) detected for 5.486 MeV events at a given argon purity. For this purpose, a series of analysis steps needs to be performed. In a first step recorded waveforms are analysed offline using a modified version of an analysis software originally developed for the ArDM [2] experiment. Relevant calculated parameters for each event are baseline, integrals, component ratio (see below), pedestal standard deviation and an estimate on the triplet life time.
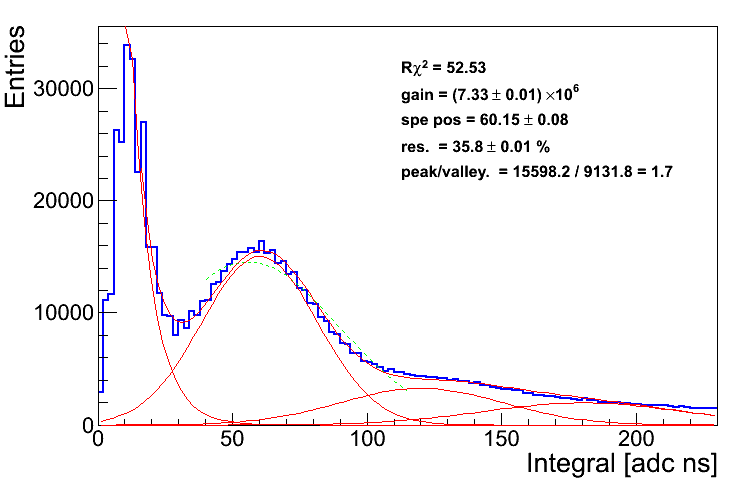
The PMT gain is calibrated using single photoelectron spectra. An example is shown in Fig. 7. It is obtained directly from light yield measurement traces using the following peak finding algorithm. When the recorded trace exceeds 2 standard deviations of the pedestal it is classified as a peak. The integral of a peak is calculated summing the samples above threshold plus one sample before and after. This method results in high statistics if the argon purity is good due to many single photo electron events present in the long tail of the triplet component.
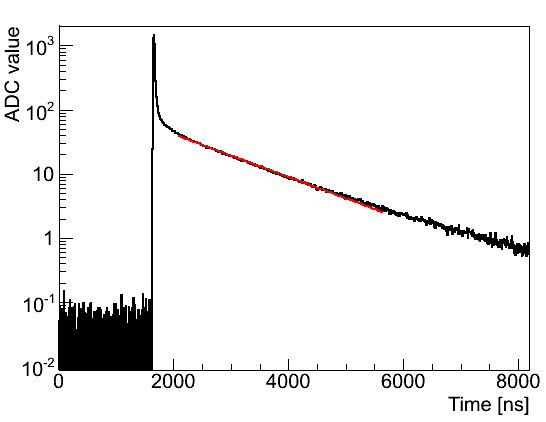
The life time of the triplet state and hence the purity of the argon is determined fitting an exponential function to a mean trace using a maximum likelihood method. This is shown in Fig. 8 on the left. The mean trace is calculated from 1000 consecutive events removing events with an integral of less than 50 pe. The systematic uncertainty determined using different fit ranges is 20 ns. Additionally an event by event fit is performed to monitor sudden changes in the purity. The latter has large uncertainties and is not used for the determination of efficiencies.
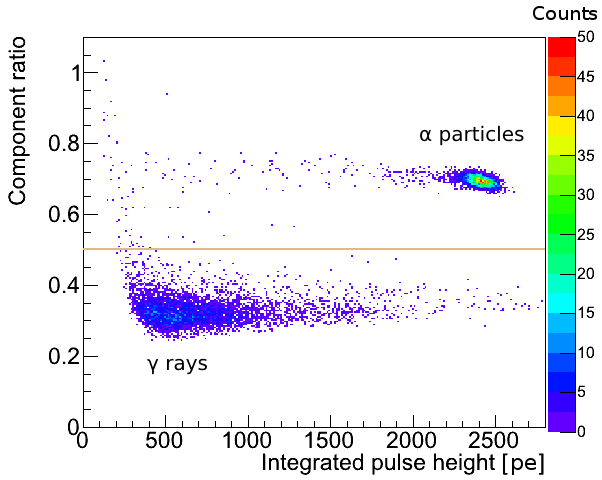
The component ratio is defined as the ratio of light in the fast component divided by the total amount of light. This ratio is smaller for light originating from electron traces compared to nucleus traces due to different ionisation densities [23]. events at this energy can be selected without background events, producing electron recoils, due to this property of argon. This is shown in Fig. 8 on the right. Background events are expected from natural contaminations of the setup materials and surrounding lab. These are visible because of the low activity of the 241Am source of Bq.
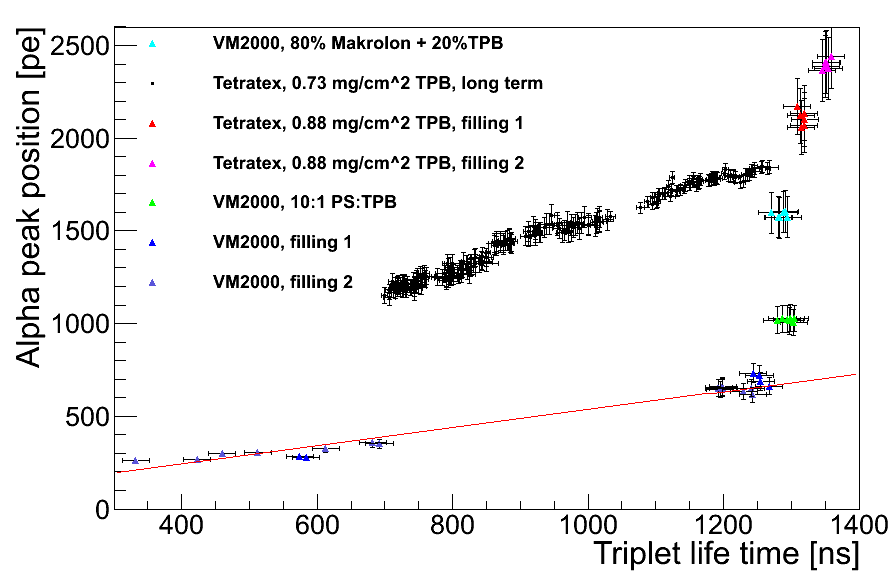
Maintaining a constant argon purity for all measurements and over the course of longer measurements is very difficult. For this reason, uncoated VM2000 was measured as a reference at several argon purities. The obtained triplet life time dependent light yield was fit with a linear function. The light yield of any other coating measured at a given triplet life time was compared to VM2000 at the same argon purity using the fitted function. This relative light yield is in good approximation a purity independent measure of the light yield which is explained in detail in the following including the influence of wavelength shifting by impurities [24]. The rate of photons emitted by decaying excimers can be approximated by the sum of two exponential decays,
| (1) |
The first term represents the singlet and the second the triplet state with decay times and respectively. The height of the emitted light pulse at t=0 is independent of the purity in contrary to the integral with a value of . The decay time of non-radiative deexcitations by impurities is much larger than the singlet life time but smaller than the triplet life time for the presented measurements. The total amount of light is hence proportional to the measured triplet decay time plus a constant assuming no wavelength shifting by impurities. This results in the amount of detected light of
| (2) |
with an effective efficiency containing the conversion, light collection and PMT sensitivity. The relative light yield of a wavelength shifter is then the ratio:
| (3) |
and hence independent of the purity (the measured alpha peak position at a measured is compared to VM2000 extrapolated to the same ).
If there are impurities which shift light additionally to the coated reflector foil one has to extend the formula for with a term for light absorbed by impurities. If the absorption occurs with a probability and detected with an effective efficiency containing the conversion and collection efficiency as well as the PMT sensitivity, Equation 2 becomes:
| (4) |
depends on the purity and hence on the measure which would result in a non-linear dependency of the alpha peak position as function of . The influence on the relative light yield can be studied by the functional form of in the presence of light shifting impurities:
| (5) |
The formula is valid under the assumption that each measurement is dominated by the same impurities. The assumption is justified as our primary source of impurities is air emanating from the pores of PTFE detector components, mainly the PTFE filler. For the ratio becomes equal to and equal to 1 for (all light shifted by impurities). A higher impurity concentration would hence result in an underestimation of the light yield of wavelength shifter with a higher efficiency than the reference uncoated VM2000, which is the case for all presented samples.
5.4 Measured Relative Light Yield
The light yield in the peak as a function of triplet life time of a selection of coating/reflector combinations measured in liquid argon is shown in Fig. 9 on the left. Further measurement series were performed in liquid and gaseous argon. The resulting relative efficiencies of all measured samples are summarized in Table 2.
| Coating | TPB on TTX | Mak+TPB | PS+TPB | BC408 | BCF-10 | UPS-923A |
|---|---|---|---|---|---|---|
| GAr | 3.62 0.14 | 1.2 0.08 | 1.5 0.11 | 1.2 0.08 | ||
| (G) | 2564 – 2981 | 1946 – 2270 | 1543 – 1991 | 2323 – 2501 | ||
| LAr | 3.15 0.16 | 2.3 0.16 | 1.5 0.11 | |||
| (L) | 1279 – 1319 | 1271 – 1295 | 1279 – 1305 |
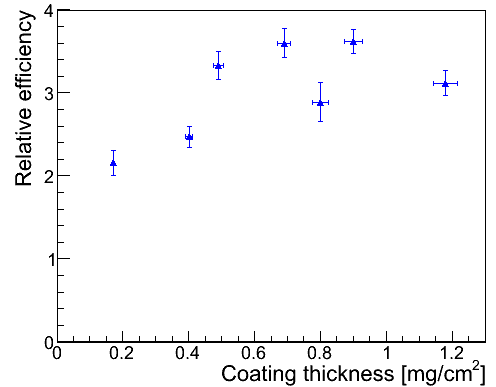
Among these measurements, Tetratex® coated with pure TPB shows the highest light yield in addition to the previously mentioned advantages. It was further optimised by varying the coating thickness from 0.17 mg/cm2 to 1.2 mg/cm2. The latter corresponds to the saturation concentration of TPB in Dichloromethane of 4.6 g/100 ml. The relative light yield as a function of coating thickness is shown in Fig. 9 on the right. According to these measurements the optimal thickness is 0.9 mg/cm2.
The observed linear dependency of the light yield with the triplet life time is consistent with the assumption that the amount of light shifted by impurities is small compared to light shifted by the coated reflector foils. This is confirmed by a measurement performed without wavelength shifter which resulted in an upper limit of % of light detected compared to uncoated VM2000. The primary source of impurities are expected to be initial contaminations in the argon bottle (6.0) and air emanating from pores of PTFE detector components. An estimation of the concentration is performed employing the results of [25] and [26]. Therein the triplet life time was measured as a function of O2 and N2 contamination. Their purest argon had a contamination of ppm O2 and ppm N2 resulting in a triplet life time of ns which is shorter than in all liquid light yield measurements presented in Table 2. 0.5 ppm N2 corresponds to ppm O2 under the assumption of air which resulted in a decrease by ns in their measurements. This is hence a conservative upper limit on the contaminations in liquid measurements in the present work. The total air contamination in the gas measurements presented here is in the range of approximately 0.01 – 0.5 ppm as estimated employing the results of [27].
The uncertainty on the relative light yield was found to be 7 %. It is calculated from fluctuations within one measurement and fluctuations between measurements of the same coating taken under seemingly same conditions. This includes effects originating from mounting and dismounting like the curvature of the mounted foils and small slits. The curvature influences the solid angle of scintillation light hitting the foil and the solid angle of illuminated reflector foil seen by the PMT. For coatings measured several times, the uncertainty was divided by the square root of the number of measurements.
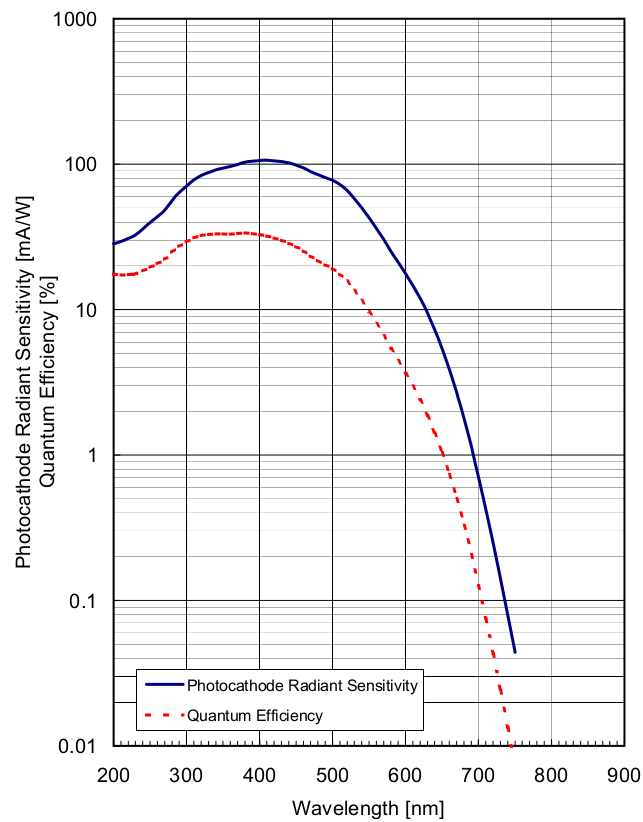
For the results presented in Table 2 a PMT of type R11065-10 was employed. In order to transfer these results to other light detection devices it is essential to know the spectral response of this individual PMT which is provided in Fig. 10 as measured by Hamamatsu [19].
5.5 Long-term Stability in Liquid Argon
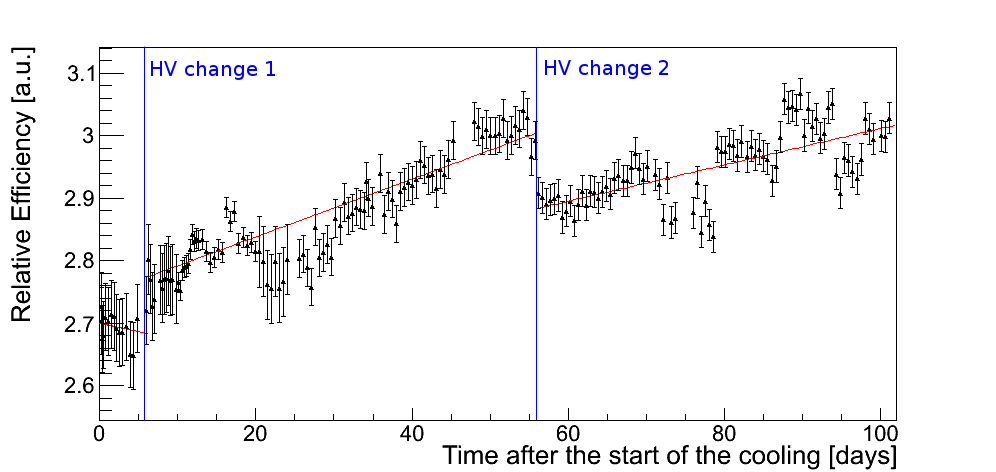
The long-term stability of Tetratex® dip coated with pure TPB was tested with a continuous measurement of 100 days in liquid argon. The purity was decreasing within this period from an initial triplet life time of ns to ns. The initial life time corresponds to a maximum contamination of ppm N2 and ppm O2 as described in the previous section. The final triplet life time of 700 ns corresponds accordingly to of O2 and of N2. The relative light yield is expected to be insensitive to changes in purity if the amount of light shifted by impurities is negligible compared to the coated reflector. Otherwise it would decrease with increasing impurity concentration as described in Section 5.3. The PMT voltage had to be changed once due to sparking in the chamber or PMT and once to obtain a better separation of the single photo electron peak from noise. An anti-correlation was observed between gain and light yield fluctuations which shows that the gain change from one to the next run is small compared to uncertainties in the gain determination procedure. For this reason, a mean gain is used for periods without clear gain changes. An apparent increase in light yield of (13.87) % was observed over the period of 100 days (see Fig. 11) excluding impurities to have a significant contribution to the shifted light. Error bars reflect the uncertainty on the gain (including systematics) and on the extrapolation for equal triplet life times. The gains of the measurements in the clusters around day 75 and day 95 which show a light yield lower than compatible with the red curve could not be determined and were taken as the average gain in that region. The decrease might hence not be caused by a decrease in light yield but in gain. The voltage changes are marked in the plot. There is no clear reason for fluctuations at other times. The light yield in gas argon measured before and after the long-term measurement (in liquid) shows an increase of (3.9 7)%. This verifies the stability of the coating and is consistent with both a constant and an increasing light yield.
The scintillation efficiency is dependent on the electric field [28]. In particular, a reduction in the electric field strength above the source due to charge accumulation, e.g. at the PMT window, reflector foil or PTFE holder could result in an increased amount of scintillation light. The origin of the electric field in the setup is the voltage of the PMT photocathode relative to the grounded metal parts of the chamber. It was simulated using Comsol Multiphysics [29]. The field strength 28 m above the source was found to be 1400 V/m without accumulated charge. This low field strength is expected to have no observable effect with the given setup and hence disfavours charge accumulation as the primary effect for the apparent light yield increase.
5.6 Stability to Air Exposure
The relative light yield of a Tetratex® sample coated with 0.88 mg/cm2 of TPB was measured in liquid argon to be 3.00.2. After this measurement is was stored in air for 51 day. The sample was protected from incident light by an aluminium foil but exposed to humidity and oxygen from the air. This sample was reinstalled and the relative light yield was measured again. It was found to be 3.30.2, which is consistent within the uncertainties with the previous measurement. Wipe tests and inspections of the foil and setup with a UV lamp showed no signs for mechanical degradation of the coating. This confirms that the light yield and mechanical stability is not affected by air and ambient humidity.
6 Radiopurity
Traces of radioactive isotopes in Tetratex® and TPB have been identified using three complementary techniques: ray spectrometry, inductively coupled plasma mass spectrometry (ICP-MS) and radon emanation.
The ray spectrometry was performed by the UZH high purity Ge detector facility, Gator [30]. It is operated underground at Laboratori Nazionali del Gran Sasso (LNGS) of INFN. Thanks to the ultra-low background (counts/day in the [50–2700] keV energy range) it is one of the world’s most sensitive germanium spectrometers. -ray spectrometry is the only non destructive technique sensitive to all primordial (e.g. 40K and isotopes belonging to the 238U and 232Th decay chains), and anthropogenic radio-isotopes (mainly 137Cs).
The activities of the radio-isotopes are determined from the intensity of their most prominent lines (e.g. the lines with the highest branching ratios) as described in [30]. This technique allows the detection of a break in the secular equilibrium of a radioactive chain. The photo-absorption efficiency of each line is calculated by means of Monte Carlo simulations performed with a detailed GEANT4.9.3 [31] model of the sample and detector. In order to simulate properly each isotope or decay chain the G4RadioactiveDecay class [32] of the GEANT4 package is used, where all the branching ratios of different lines are taken into account.
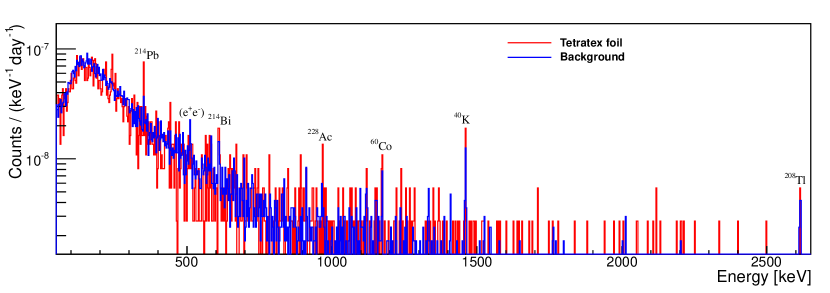
A 208 g TPB coated Tetratex® foil was measured for 10.5 days in the Gator cavity. Before the measurement the foil was folded to a rectangular shape with dimensions cm2 (comparable to the Ge crystal) and an average thickness of cm. The sample was placed on top of the detector’s cryostat a few mm from the sensitive crystal.
The spectrum of the coated Tetratex® is shown in Fig. 12 (red) and compared to the background (blue) acquired with a 47.8 days run. For all isotopes of interest the rates of the lines are compatible with background expectations (a detection claim is based on a statistical test with 5% significance level). In Table 3 the upper limits at 90% C.L. are reported for each isotope analysed with this technique.
ICP-MS measurements were performed by the chemical service of LNGS. A sample of uncoated Tetratex®, a sample of scintillation grade TPB from Sigma Aldrich and a sample of Tetratex® dip coated with TPB dissolved in p.a. grade Dichloromethane were analysed. The blank subtracted concentrations of 232Th, 238U and 40K in Tetratex®/TPB/coated Tetratex® are 0.053/0.016/0.173 ppb, 0.071/0.014/0.123 ppb and 287/137/746 ppb respectively. These values converted into activities are given in Table 3.
| [mBq/kg] | 238U | 226Ra | 228Ra | 228Th | 235U | 40K | 60Co | 137Cs | 232Th |
|---|---|---|---|---|---|---|---|---|---|
| Gator | ¡ 115 | ¡ 11.6 | ¡ 15.3 | ¡ 9.79 | ¡ 6.68 | ¡ 54.3 | ¡ 3.43 | ¡ 3.58 | |
| ICP-MS | 1.5 | 23 | 0.70 |
The emanation rate of 222Rn was measured by the Max-Planck-Institut für Kernphysik in Heidelberg. 373 g of uncoated Tetratex® was loaded into a vacuum chamber, pumped and flushed with Rn depleted He. After this cleaning procedure emanating 222Rn is accumulated in the vacuum chamber and transferred to proportional counters employing Rn depleted He gas. The number of Rn decays is detected in the proportional counters and converted into a Rn emanation rate. An upper limit of 54 Bq/kg was found at 90 % C. L.. A more detailed description of the setup and measurement procedure can be found in [33].
7 Conclusion
The light yield of several reflector/coating combinations have been measured in gaseous and liquid argon and with a fluorescence spectrometer. Amongst the measured samples, Tetratex® dip coated with TPB is the superior coated reflector foil. The optimal thickness of this coating was found to be 0.9 mg/cm2 resulting in a 3.6 times higher light yield compared to uncoated VM2000. It is stable for long term operation in liquid argon and insensitive to exposure to ambient humidity and oxygen. The effort to produce square meter scale reflectors by dip coating is significantly smaller compared to evaporation, thus making it a well suited solution for large experiments. The mechanical stability of the foil permits easy handling during installation and long-term operation. It has been installed in the liquid argon veto of Gerda Phase II. A coating containing 80 %Makrolon® and 20 % TPB is a good alternative if transparency is required. It has a 2.3 times higher light yield compared to uncoated VM2000.
Acknowledgements.
This work is financially supported by the Swiss National Science Foundation (SNF grant Nb. 200020-149256 and 20AS21-136660) and ITN Invisibles (Marie Curie Actions, PITN- GA-2011-289442). We would like to thank M. Heisel, A. Smolnikov and A. Wegmann from the Max Planck Institut für Kernphysik in Heidelberg for their technical support and discussions, H. Simgen who performed the radon emanation measurement and Maria Laura Di Vacri and Stefano Nisi from the LNGS chemistry laboratory for the IPC-MS measurements. We also thank for the kind possibility to use the clean room facility “First Lab” at ETH Zurich, the fluorescence spectrometer at Max Planck Institut für Kernphysik in Heidelberg and the optical microscope of the group of Hans-Werner Fink at the University of Zurich.References
- [1] K. Ackermann et al., “The GERDA experiment for the search of decay in 76Ge,” Eur.Phys.J., vol. C73, no. 3, p. 2330, 2013.
- [2] Badertscher, A. and Bay, F. and Bourgeois, N. and Cantini, C. and Curioni, A. and others, “ArDM: first results from underground commissioning,” JINST, vol. 8, p. C09005, 2013.
- [3] P. Agnes et al., “First Results from the DarkSide-50 Dark Matter Experiment at Laboratori Nazionali del Gran Sasso,” arXiv:1410.0653 [astro-ph.CO].
- [4] P.-A. Amaudruz et al., “DEAP-3600 Dark Matter Search,” arXiv:1410.7673 [physics.ins-det], 2014.
- [5] S. Amerio et al., “Design, construction and tests of the ICARUS T600 detector,” Nucl.Instrum.Meth., vol. A527, pp. 329–410, 2004.
- [6] L. Baudis, “DARWIN: dark matter WIMP search with noble liquids,” J.Phys.Conf.Ser., vol. 375, p. 012028, 2012.
- [7] A. Rubbia, “The LAGUNA design study: Towards giant liquid based underground detectors for neutrino physics and astrophysics and proton decay searches,” Acta Phys.Polon., vol. B41, pp. 1727–1732, 2010.
- [8] M. Agostini et al., “Upgrade of the gerda experiment,” PoS, vol. TIPP2014, p. 109, 2014.
- [9] M. Agostini, M. Barnabe-Heider, D. Budjas, C. Cattadori, A. Gangapshev, et al., “LArGe - Active background suppression using argon scintillation for the GERDA -experiment,” 2015.
- [10] “3M Corporation, St. Paul, Minnesota, USA (VikuitiTM ESR can be found on their homepage but not VM2000).”
- [11] “Donaldson Company Inc., 1400 West 94th Street, Bloomington, Minnesota, USA .”
- [12] P. Peiffer, Liquid argon as active shielding and coolant for bare germanium detectors: A novel background suppression method for the Gerda 0 experiment. PhD thesis, Universität Heidelberg, 2007.
- [13] The ArDM Collaboration, “Development of wavelength shifter coated reflectors for the ArDM argon dark matter detector,” JINST, vol. 4, p. P06001, 2009.
- [14] R. Francini, R. Montereali, E. Nichelatti, M. Vincenti, N. Canci, et al., “Tetraphenyl-butadiene films: VUV-Vis optical characterization from room to liquid argon temperature,” JINST, vol. 1309, p. C09010, 2013.
- [15] “Varian Inc., now part of Agilent Technologies, 5301 Stevens Creek Blvd. Santa Clara, California, USA.”
- [16] M. Suzuki, J.-z. Ruan(Gen), and S. Kubota, “Time dependence of the recombination luminescence from high-pressure argon, krypton and xenon excited by alpha particles,” Nucl. Instr. Meth., vol. 192, pp. 565–574, 1982.
- [17] W. Lippincott, K. Coakley, D. Gastler, A. Hime, E. Kearns, et al., “Scintillation time dependence and pulse shape discrimination in liquid argon,” Phys.Rev., vol. C78, p. 035801, 2008.
- [18] R. Acciarri, M. Antonello, B. Baibussinov, M. Baldo-Ceolin, P. Benetti, et al., “Effects of Nitrogen and Oxygen contamination in liquid Argon,” Nucl.Phys.Proc.Suppl., vol. 197, pp. 70–73, 2009.
- [19] “Hamamatsu Photonics K.K., 325-6, Sunayama-cho, Naka-ku, Hamamatsu City, Shizuoka Pref., 430-8587, Japan.”
- [20] W. Parker, H. Bildstein, and N. Getoff, “Molecular plating I, a rapid and quantitative method for the electrodeposition of thorium and uranium,” Nucl. Instr. and Meth., vol. 26, p. 55, 1964.
- [21] N. Getoff and H. Bildstein, “Molecular plating: VI. Quantitative electrodeposition of americium,” Nucl. Instr. and Meth., vol. 70, p. 352, 1969.
- [22] I. Usoltsev et al., “Preparation and high intensity heavy ion irradiation tests of intermetallic 243am/pd targets,” Nuclear Instruments and Methods in Physics Research Section B: Beam Interactions with Materials and Atoms, vol. 318, Part B, no. 0, pp. 297 – 305, 2014.
- [23] A. Hitachi, T. Takahashi, N. Funayama, K. Masuda, J. Kikuchi, et al., “Effect of ionization density on the time dependence of luminescence from liquid argon and xenon,” Phys.Rev., vol. B27, pp. 5279–5285, 1983.
- [24] T. Heindl, T. Dandl, M. Hofmann, R. Krucken, L. Oberauer, et al., “The scintillation of liquid argon,” Europhys.Lett., vol. 91, p. 62002, 2010.
- [25] R. Acciarri et al., “Oxygen contamination in liquid Argon: Combined effects on ionization electron charge and scintillation light,” JINST, vol. 5, p. P05003, 2010.
- [26] R. Acciarri et al., “Effects of Nitrogen contamination in liquid Argon,” JINST, vol. 5, p. P06003, 2010.
- [27] C. Amsler, V. Boccone, A. Buchler, R. Chandrasekharan, C. Regenfus, et al., “Luminescence quenching of the triplet excimer state by air traces in gaseous argon,” JINST, vol. 3, p. P02001, 2008.
- [28] T. Doke, A. Hitachi, J. Kikuchi, K. Masuda, H. Okada, and E. Shibamura, “Absolute scintillation yields in liquid argon and xenon for various particles,” Jpn. J. Appl. Phys., vol. 41, no. 3A, pp. 1538–1545, 2002.
- [29] “Comsol Multiphysics 4.3.”
- [30] L. Baudis, A. Ferella, A. Askin, J. Angle, E. Aprile, et al., “Gator: a low-background counting facility at the Gran Sasso Underground Laboratory,” JINST, vol. 6, p. P08010, 2011.
- [31] S. Agostinelli et al., “Geant4-a simulation toolkit,” Nuclear Instruments and Methods in Physics Research Section A: Accelerators, Spectrometers, Detectors and Associated Equipment, vol. 506, no. 3, pp. 250 – 303, 2003.
- [32] S. Hauf, M. Kuster, M. Batic, Z. W. Bell, D. H. H. Hoffmann, et al., “Radioactive Decays in Geant4,” IEEE Trans.Nucl.Sci., vol. 60, no. 4, pp. 2966–2983, 2013.
- [33] W. Rau and G. Heusser, “222Rn emanation measurements at extremely low activities,” Applied Radiation and Isotopes, vol. 53, no. 1 - 2, pp. 371 – 375, 2000.