A COMPREHENSIVE HST BVI CATALOGUE OF STAR CLUSTERS IN FIVE HICKSON COMPACT GROUPS OF GALAXIES.
Abstract
We present a photometric catalogue of star cluster candidates in Hickson compact groups (HCGs) 7, 31, 42, 59, and 92, based on observations with the Advanced Camera for Surveys and the Wide Field Camera 3 on the Hubble Space Telescope. The catalogue contains precise cluster positions (right ascension and declination), magnitudes, and colours in the filters. The number of detected sources ranges from 2200 to 5600 per group, from which we construct the high-confidence sample by applying a number of criteria designed to reduce foreground and background contaminants. Furthermore, the high-confidence cluster candidates for each of the 16 galaxies in our sample are split into two sub-populations: one that may contain young star clusters and one that is dominated by globular older clusters. The ratio of young star cluster to globular cluster candidates varies from group to group, from equal numbers to the extreme of HCG 31 which has a ratio of 8 to 1, due to a recent starburst induced by interactions in the group. We find that the number of blue clusters with correlates well with the current star formation rate in an individual galaxy, while the number of globular cluster candidates with correlates well (though with large scatter) with the stellar mass. Analyses of the high- confidence sample presented in this paper show that star clusters can be successfully used to infer the gross star formation history of the host groups and therefore determine their placement in a proposed evolutionary sequence for compact galaxy groups.
keywords:
galaxies: groups: general — galaxies: groups: individual: HCG 07, HCG 31, HCG 42, HCG 59, HCG 92; — galaxies: evolution — galaxies: interactions — galaxies: star clusters: general1 Introduction
It is widely accepted that interactions and mergers between gas-rich galaxies lead to star formation (e.g., Kennicutt et al., 1987; Mihos & Hernquist, 1996; Barton Gillespie et al., 2003; Springel et al., 2005), and that the majority of stars form in clusters and associations (Lada & Lada, 2003; Bressert et al., 2010). It therefore follows that a detailed analysis of star cluster populations in a galaxy can reveal its history of interaction events (e.g., Whitmore et al., 1999; Gallagher et al., 2001; Bastian et al., 2005; Wilson et al., 2006).
In that light, star clusters are a powerful tool for studying star formation events triggered by mergers and tidal interactions between galaxies. In particular, star clusters could prove useful for studying compact groups (CGs), specifically Hickson Compact Groups (HCGs; Hickson, 1982, 1997; Hickson et al., 1989, 1992). By virtue of their selection criteria (low velocity dispersions and high galaxy number densities), HCGs represent an environment with frequent and prolonged interactions, that can trigger the formation of star cluster populations associated with specific events.
Initially motivated by the work of Verdes-Montenegro et al. (2001), Johnson et al. (2007) proposed an evolutionary sequence of HCGs by separating them into three types based on the ratio of their H i content (a proxy for the available reservoir of cool gas for star formation) and the dynamical mass111Alternative dynamical classifications exist that determine the state of the group through means other than mass ratios. For example, Bitsakis et al. (2011) use early-type galaxy fractions to ascertain the dynamical state of a group., with Type I being the gas-rich groups and Type III the gas-poor ones. Johnson et al. (2007) also report – based on Spitzer mid-infrared colours – that galaxies in Type I groups are more actively star-forming than galaxies in Type II groups while galaxies in Type III groups are relatively quiescent. Konstantopoulos et al. (2010) expanded on this classification by splitting group types into two parallel sequences according to their gas distributions: Sequence A groups maintain the bulk of their cold gas inside galaxies, whereas Sequence B groups have gas dispersed throughout the intra-group medium (IGM) (Konstantopoulos et al., 2010, their fig. 1). The gas distribution of Sequence B groups likely results from strong interactions that occur while disk galaxies are still gas-rich. The initial conditions of the positions and relative velocities of Sequence A group galaxies are such that only softer interactions occur, and while secular evolution may be enhanced and lead to a boost in star formation rates in individual galaxies, the bulk of the cold gas is not pulled into the IGM. As a consequence, the groups in Sequence A are expected to ultimately lead to the formation of a single elliptical galaxy with little to no X-ray envelope, as gas is consumed within galaxies before late-stage dry mergers. Groups in Sequence B – where galaxies interact strongly before gas is consumed – would be more likely to form ellipticals with a strong X-ray envelope (heated by star-formation triggered by one or more gas-rich mergers), as can be seen around some massive elliptical galaxies or so-called ‘fossil’ groups (Jones et al., 2003). The differences in star-forming histories, which vary depending on gas content and distribution and advance along the evolutionary path, must be reflected in the star cluster populations of the groups. Thus, star cluster populations can potentially be used to infer their hosts’ placement on the CG evolutionary sequence proposed by Konstantopoulos et al. (2010).
In this paper, we consolidate the information on star clusters in compact groups of galaxies that has been presented in a number of projects (Gallagher et al., 2010; Konstantopoulos et al., 2010; Fedotov et al., 2011; Konstantopoulos et al., 2012, 2013) and present it in a consistent, coherent catalogue, with the goal of further assisting researchers in star cluster-related studies. We also take this opportunity to compare the basic properties between cluster populations in compact groups at distinct evolutionary stages.
This paper is organized in the following way: in Section 2, we describe the samples and data sets. We outline the procedure for constructing the catalogue in Section 3, and present our results and discuss them in Section 4. Lastly, we summarize the main conclusions in Section 5. Throughout, we use the cosmology H km s-1 Mpc-1, , and to determine distances and physical sizes.
2 Data
The data for this project were obtained with the Hubble Space Telescope (HST) Advanced Camera for Surveys (ACS) and Wide Field Camera 3 (WFC3). These observations are part of two programs: ID 10787 (PI J. Charlton) and ID 11502 (PI K. Noll). The observations were carried out in the F435W (F438W for WFC3), F606W, and F814W filters, which are similar to the Johnson -bands. Hereafter, we refer to the HST filters as , , , and , although we did not make transformations to the Johnson-Cousins system.
Table LABEL:tab:observations contains an observation log. The last column in the table lists publications related to those observations. Table LABEL:tab:HCG_info presents properties of the 16 individual galaxies within the five compact groups included in this sample.
3 Data Analysis
Before we go into the detailed description of selecting and sorting the detected sources, here are a few words about our terminology to clarify the differences between samples.
Our catalogue consists of all detected point sources that passed the criteria described below. However, the high-confidence portion of the catalogue is divided into two subcategories that we denote as star cluster candidates (SCCs) and globular cluster candidates (GCCs). The major difference between these two subcategories is that the selection criteria for the SCCs do not discriminate against sources with significant nebular emission. In contrast, the selection criteria for GCCs filter out objects with nebular emission (both in terms of their colours and their spatial extent), while being less strict about the lower luminosity limit (see Fig. 1). These two subcategories are not mutually exclusive, i.e., the same cluster may be present in both categories. Indeed, the selection criteria (described in detail in the section below) for the globular cluster candidates are fine-tuned to filter out potentially young star clusters in the dynamically young groups with active star formation (e.g., HCG 31) where we detect many young SCs. Thus, we expect to see a small fraction of SCCs being classified as GCCs in such groups (for HCG 31 out of 338 SCCs only 13 of them, or less than 4%, are also GCCs). On the other hand, in a group such as HCG 42, which in our sample is represented by the giant elliptical NGC 3091 and where the majority of the detected sources are expected to be old star clusters, we anticipate a majority of SCCs to be also classified as GCCs (out of 356 SCCs for HCG 42, 331 of them, or are classified as GCCs). Hence, we use the SCC sample primarily to study the young star cluster populations and GCCs to study globular cluster populations.
Throughout the paper we use the terms young, intermediate, and old when we talk about star clusters. These are general terms without standard definitions in the literature. For this paper, when we talk about young star clusters we mean clusters that are younger (according to their location in colour space) than 10 Myr. For intermediate clusters the age range is between a low hundreds Myrs and a few Gyrs, and for the old clusters the range is from Gyr to 14 Gyr. The intervals not covered by our definitions are grey areas, and star clusters in those intervals are labelled according to context. For example, if we are talking about intermediate age clusters (750 Myr old), clusters less than 50 Myr old could be referred to as young/younger SCs. For most of the cases, whenever we are using these terms (young, intermediate, old) we are specifying the time intervals within the parentheses following the term.
3.1 Star Cluster Selection
For the ACS observations, the closest group is HCG 07 at a distance of 56.6 Mpc (from the initial radial velocity measurement by Hickson (1982) modified based on the velocity field model of Mould et al. (2000)), equivalent to a distance modulus of mag. At this distance, the pixel size of the ACS corresponds to 13.7 pc. The distance to Stephan’s Quintet which was observed with the WFC3, is adopted to be 88.6 Mpc (Hickson, 1982; Mould et al., 2000), equivalent to mag. Thus, one pixel on WFC3 corresponds to 17.2 pc. With the average star cluster half-light radius of pc (e.g., Larsen, 2004; Barmby et al., 2006; Scheepmaker et al., 2007), the majority of the detected clusters in all observations are expected to be unresolved or marginally resolved in the case of the closest groups (e.g., Harris, 2009). Therefore, for this catalogue we used point spread function (PSF) fitting as the preferred method of obtaining photometry. In the next section we give a more detailed explanation for favouring PSF photometry.
For point source detection we used the images, as they offer the faintest limiting magnitudes at 50% completeness level among the observations (see Table LABEL:tab:completeness). To detect point sources, we run the DAOFIND (Stetson, 1987) task in IRAF222IRAF is distributed by the National Optical Astronomy Observatory, which is operated by the Association of Universities for Research in Astronomy (AURA) under cooperative agreement with the National Science Foundation. on median-divided images, obtained by division of the original images by median boxcar-smoothed ones (with a 1313 pixel smoothing window). The coordinates of point sources detected in were transformed into the and coordinate systems. PSF photometry was performed on each image independently, and the results were cross-matched (with matching radius of 1.5 pixels) to yield point sources that were present in all three frames.
PSF models for each filter of each group were constructed from bright, isolated, and unsaturated stars with smooth radial curves of growth. The aperture correction was calculated as an average of the difference between magnitudes obtained from aperture photometry (with a 10-pixel aperture) and PSF-magnitudes (calculated at 3 pixels). The aperture corrections between 10 pixels and infinity in the case of ACS observations were taken from Sirianni et al. (2005), and in the case of WFC3 observation were calculated from the enclosed energy curves as the difference between unity and the enclosed energy in the given aperture and wavelength (B. Whitmore, priv. comm.). The foreground extinctions were obtained from Schlafly & Finkbeiner (2011), published in the NASA/IPAC Extragalactic Database (NED)333http://ned.ipac.caltech. edu/ngi/. Table LABEL:tab:PSF_info gives overall information on the number of stars used in the PSF constructions, the aperture correction values, and foreground extinctions for different filters and targets.
At this stage, we had an unfiltered point source list for each group, which we refer to as the “extended sample”.
3.2 PSF photometry justification
Quite often in studies of extragalactic star clusters, the question of which type of photometry to use (aperture or PSF) arises. If star clusters can be resolved, then, logically, aperture photometry would produce the most accurate results. On the other hand, for unresolved objects PSF photometry is preferred. What about sources that are marginally resolved? Harris (2009) have shown that if a SC is larger than of the FWHM of the stellar PSF then it can be treated as marginally resolved and aperture photometry should be applied. This result is certainly important for studies that look at SC sizes, but what about work that focussing on the colours (and colour-based properties such as ages) of these SCs?
Colours are differences between the magnitudes in different filters and as such are less dependent on the accuracy of the total magnitude measurements than the relative magnitudes. That is, if measurements are carried out consistently for all of the filters, the magnitude differences between filters (i.e., the colours) should be similar for both PSF and aperture photometry. For our study, most of the compact groups are at distances where their SCs may be marginally resolved, except, perhaps HCG 92 (at 88.6 Mpc). However, most of our groups have areas with highly variable backgrounds, and in some cases, albeit rarely, the issue of crowding arises. The above concerns lead us to prefer PSF photometry. Additionally, if a PSF for a given filter is generated and applied correctly, PSF photometry can potentially give more accurate magnitude measurements than aperture photometry, and with much smaller uncertainties.
We have compared the aperture photometry with our PSF photometry and found that the difference between the two are within the accepted error level for this study ( mag). Moreover, as was mentioned previously, the differences in the photometries becoming even less noticeable in colour indices ( mag). Thus, we conclude that on average the two photometries produce comparable results, and we prefer PSF photometry for the reasons given above.
3.3 Star Cluster Candidate Selection
To create a catalogue of high confidence star cluster candidates we applied to our extended samples the following selection criteria:
-
1..
Magnitude cut at mag (S1)
To eliminate the contamination from individual luminous supergiants, which can reach mag, we only considered sources with mag. This roughly corresponds to a cluster mass of a few at 10 Myr and at 10 Gyr (depending on metallicity and distance modulus). -
2..
Photometric error mag in all three filters (S2)
To maintain photometric quality of magnitudes and colours, all point sources that had photometric errors larger than 0.3 mag in any of the , , or filters were discarded. -
3..
Sharpness between 2 and 2 in all bands (S3)
To further minimize contamination from cosmic rays and background galaxies, we applied a sharpness filter which, essentially, is a constraint on the intrinsic angular size of the detected objects. Sharpness is measured as the difference between the square of the width of the object and the square of the width of the PSF, and for our purposes should be between and 2: large positive values of sharpness are indicative of blended sources and partially resolved galaxies, whereas large negative numbers are flags for cosmic rays and blemishes. For a well-matched width the sharpness is zero. -
4..
-band (S4)
The DAOPHOT goodness of fit factor from PSF-fitting in the -band should be less than 3. The use of -band for the parameter is twofold: (a) the PSF model is typically best determined in that band because we have the most PSF stars; and (b) no contamination from nebular emission lines (e.g., H) is expected (nebular emission around a young star cluster may cause them to be marginally resolved in the -band images). -
5..
Colour cuts (S5)
In order to minimize the contamination from foreground Galactic stars, we applied colour cuts, where all sources that had colours mag or mag were discarded. As can be seen on fig. 8 of Trancho et al. (2012), applying these colour cuts removes the majority of spectroscopically confirmed contaminants.
3.4 Globular Cluster Candidate Selection
In a similar manner we created a catalogue of Globular Cluster Candidates, with the following (generally stricter) criteria (based on Rejkuba et al. (2005)):
-
1..
Hyperbolic filters in photometric error (G1)
The hyperbolic filter in the photometric error was defined in such a manner as to retain of all recovered artificial sources (these are the sources that were used in determining the completeness level, see Section 3.5). The application effect of this filter on detected sources can be observed in Fig. 1, panels b0 and b1. -
2..
Hyperbolic filters in DAOPHOT sharpness parameter (G2)
We defined the hyperbolic filter in the DAOPHOT sharpness parameter in the same manner as the photometric error filter. That is, the sharpness filter is tuned so that it retains of all recovered artificial sources. However, there is a possibility that for the closest groups (e.g., HCG 07, HCG 42) some of the GCCs might be marginally resolved. In these cases we relax the upper envelope of the sharpness filter to make sure that we do not discard larger GCCs. The example of the application and effect of the sharpness filter on detected sources can be seen in Fig. 1, panels c0 and c1. -
3..
Magnitude cut at mag (G3)
Because contamination from supergiants is less of a problem for objects with GC-like colours, we relaxed our luminosity cut to mag to get closer to the expected peak of the GC luminosity function (e.g., Ashman & Zepf, 1998; Harris, 2001). The magnitude cutoff roughly corresponds to a globular cluster mass of (depending on metallicity and distance modulus). The effect of application of this filter is shown on Fig. 1, panels d0 and d1. -
4..
Milky Way Globular Cluster selection parallelogram (G4)
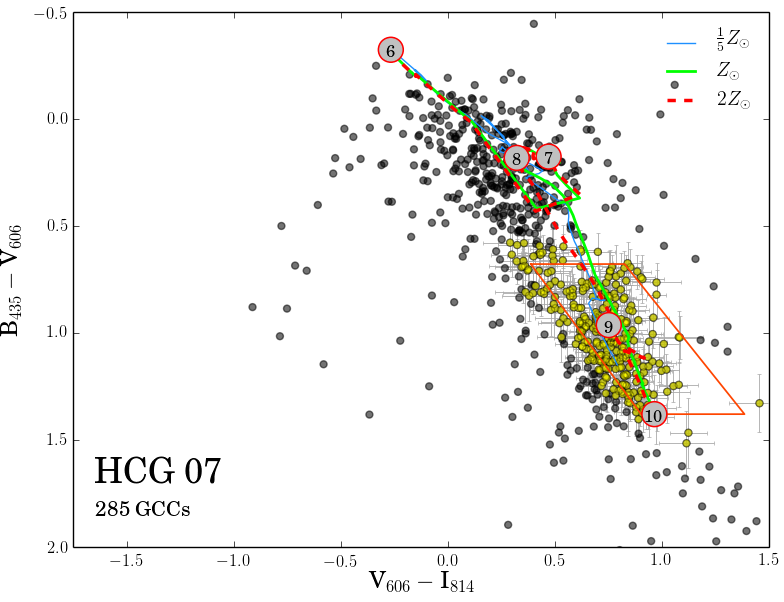
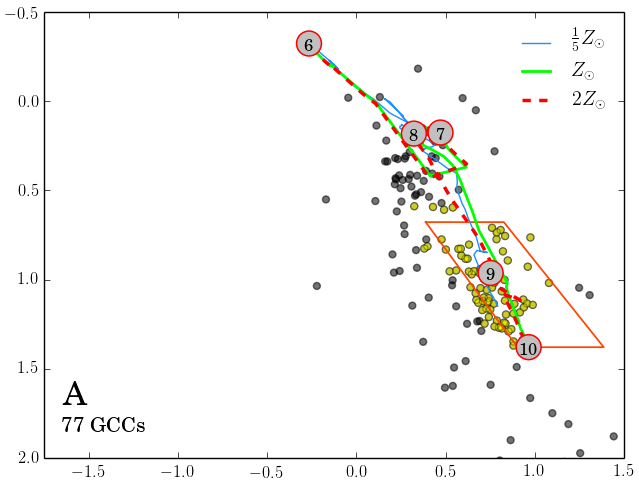
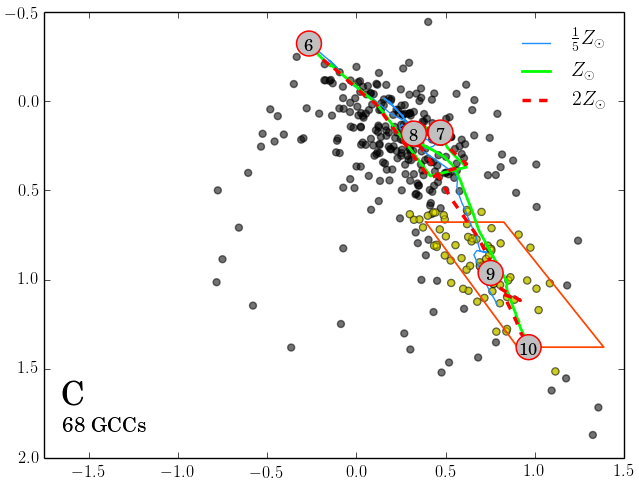
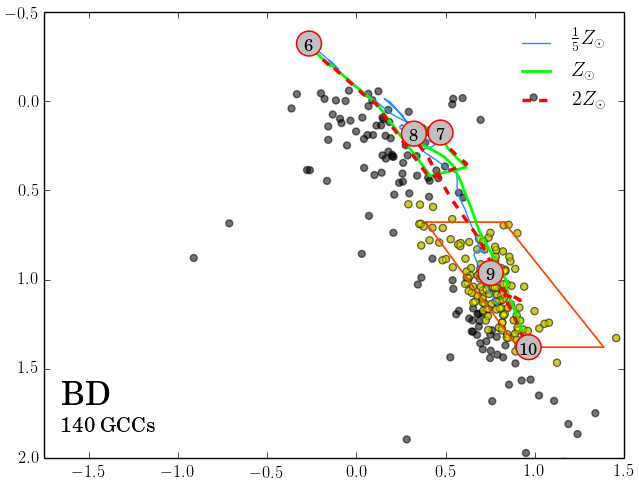
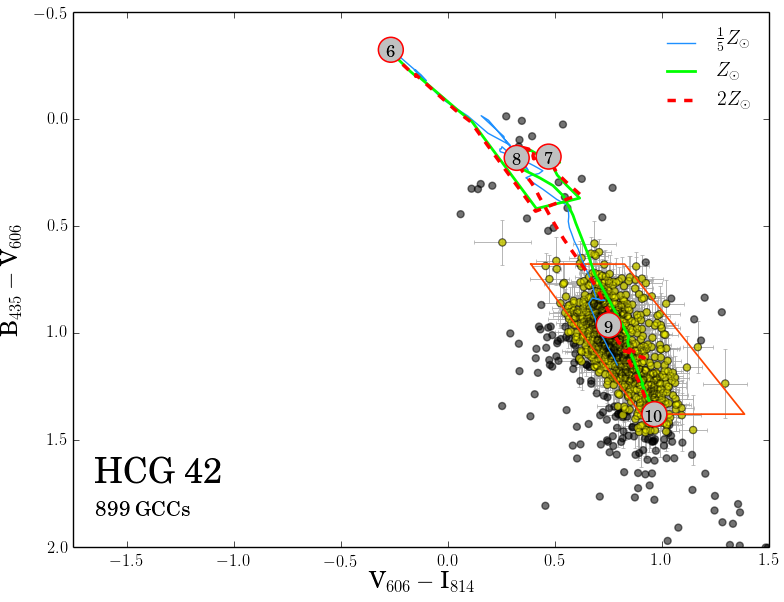
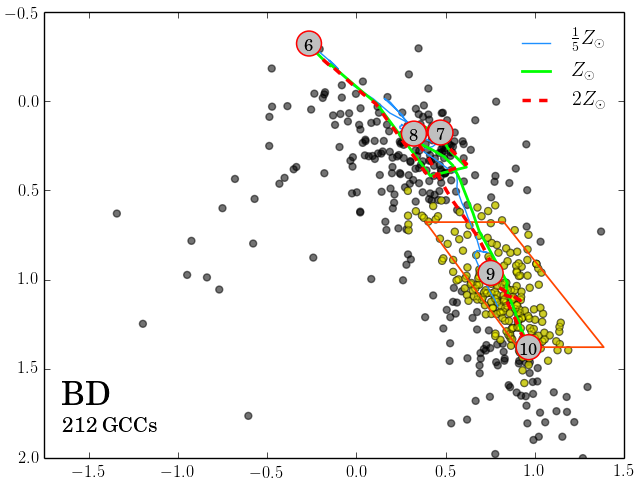
We use dereddened GCs from the updated Harris (1996) Milky Way Globular Cluster catalogue to derive a selection parallelogram in vs. colour space. We convert the vertices of the parallelogram from Johnson’s , , magnitudes to , , magnitudes via transformations derived from Sirianni et al. (2005). We keep all sources that would fall into the selection parallelogram in the vs colour space or that would overlap the selection region with their 1 error bars. HCG 92 was observed with WFC3 and there is (to our knowledge) currently no equivalent to the Sirianni et al. (2005) calibration paper for this instrument. Therefore, we apply the same selection box for globular clusters to these data as for the ACS data. Given the similarities between these two instruments and their filter sets, we would not expect a significant change in the number of globular cluster candidates as the result of that action.

Table LABEL:tab:criteria specifies what fraction (in percent) of the initial number of point sources (rightmost column) remains after applying each criterion individually. For example, after applying the S1 criterion (absolute magnitude cut) on 4243 sources detected in HCG 07 only 11.6% (or 493 sources) of the original sample remains, whereas after applying the S2 criterion (photometric error 0.3 mag in all three filters) on the initial list of 4243 sources 91.3% of the extended sample (or 3874 sources) remain, and so on.
3.5 Completeness Levels
To determine completeness of our catalogue we carried out the following routine for each group in our sample. For groups HCG 07, 42, 31 and 59 we used ADDSTAR to add 3000 artificial stars to the images (over the entire field, including the galaxies) in the apparent magnitude range 24–28 mag, i.e., absolute magnitudes ranging between mag and mag (taking into consideration that these groups are located in the range of distances from 56.6 and 62.8 Mpc). For HCG 92 we used ADDSTAR to add 5000 artificial stars to the image as the image covers a larger field of view. The apparent magnitude range of artificial stars was the same, i.e., 24–28 mag, which translates into absolute magnitudes range between mag and mag, given that the distance modulus for HCG 92 is 34.74 mag. After artificial stars were added to the images, we applied the same algorithm for point source detection to determine the recovery rates. The average limiting magnitudes for the 50% and 90% recovery rates for each group are presented in Table LABEL:tab:completeness. As can be seen, we operate at the slightly higher than 90% completeness level (in V606 filter) for GCCs and at even higher completeness level for the SCCs, except for HCG 92 which is the most distant group in our sample. In that case we are at and completeness level for the GCCs and SCCs, respectively. We point out that the method described gives the values for the average completeness level over the entire image. Because of the random distribution of artificial sources and because galaxies (with elevated surface brightness) typically take up a smaller fraction of the field-of-view, our actual completeness levels will generally be lower as star clusters tend to be found in galaxies (with HCG 92 as a notable exception).
The level of completeness becomes especially important when we are dealing with the specific frequencies and metallicity distributions for globular cluster candidates. The colour for GCCs is, on average, about 1 although our selection parallelogram (the G4 criterion, §3.4) goes down to . As an example, consider a hypothetical GCC source in HCG 42. If this source has m mag (just above the 90% completeness level in the filter; Table LABEL:tab:completeness), its magnitude in , according to our G4 criterion, will be between 26.68 and 27.38. However, the 90% completeness level in is mag. Thus, if we force our sources to have 90% completeness level only in the filter, we will be missing some of the red sources at the faint end. Moreover, even forcing 90% completeness in the limiting filter (in our case it is filter), we are still risking missing some objects (Fig. 2).
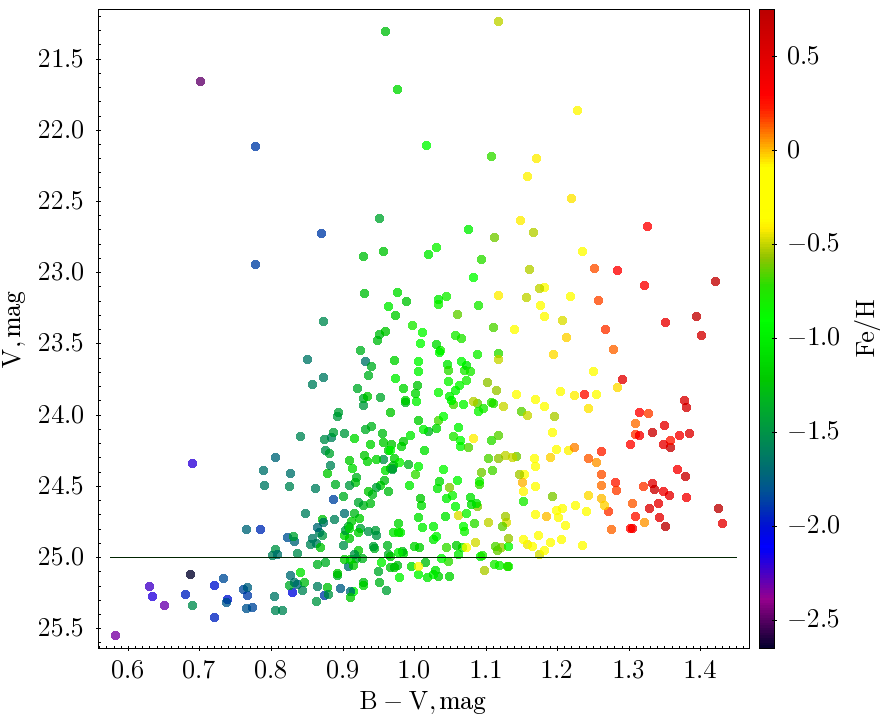
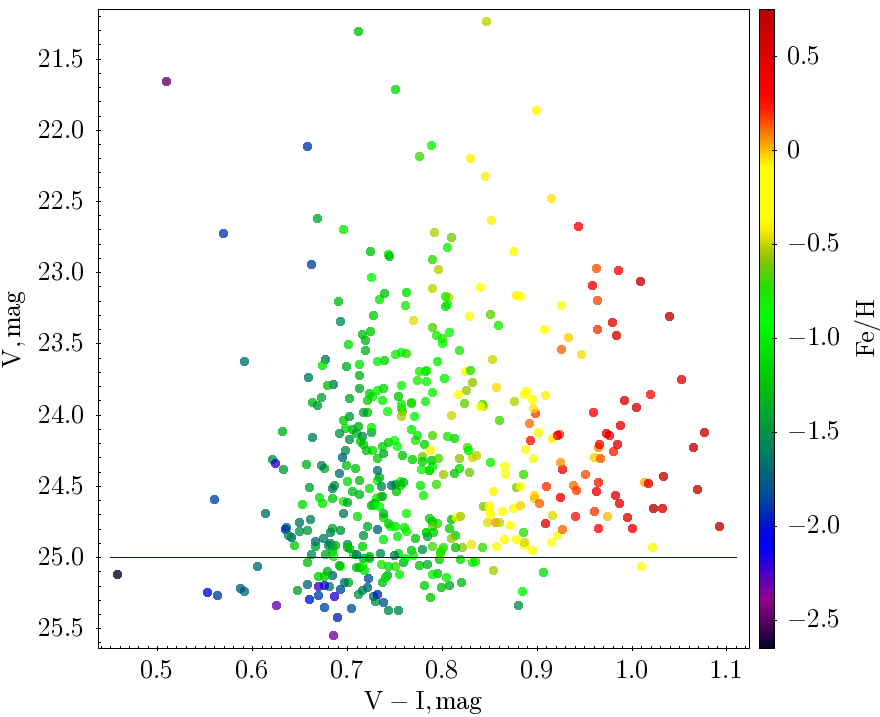
So, for the calculation of the total number of clusters in the GC system of a host galaxy, the globular cluster specific frequency, and the metallicity distributions, we will be using a portion of our catalogue, in which all sources are at or above 90% completeness level in all three filters and which also minimises the loss of the faint metal rich GCCs. For our sample of HCGs, that corresponds to -filter magnitude cutoffs at 25.0 mag for HCG 42, and 25.5 mag for HCG 07, 31, and 59. The only exception is HCG 92, the farthest group in our sample. For this group we went down to 50% completeness level, to maximise the number of GCCs to strengthen the statistical conclusions validity. Unfortunately, even at that completeness level, we are still sampling only about 10% of the GCLF making the derived values of the total number in the GC populations () and specific frequencies () of HCG 92 galaxies highly uncertain ( factor of 5). Although we forego determining and for HCG 92 (for aforementioned reasons), we are still attempting a GCC population analysis, based on a “face value” GCC catalogue containing sources that are at or above the 50% completeness level with a cutoff at mag (to minimise the loss of the faint metal rich GCCs).
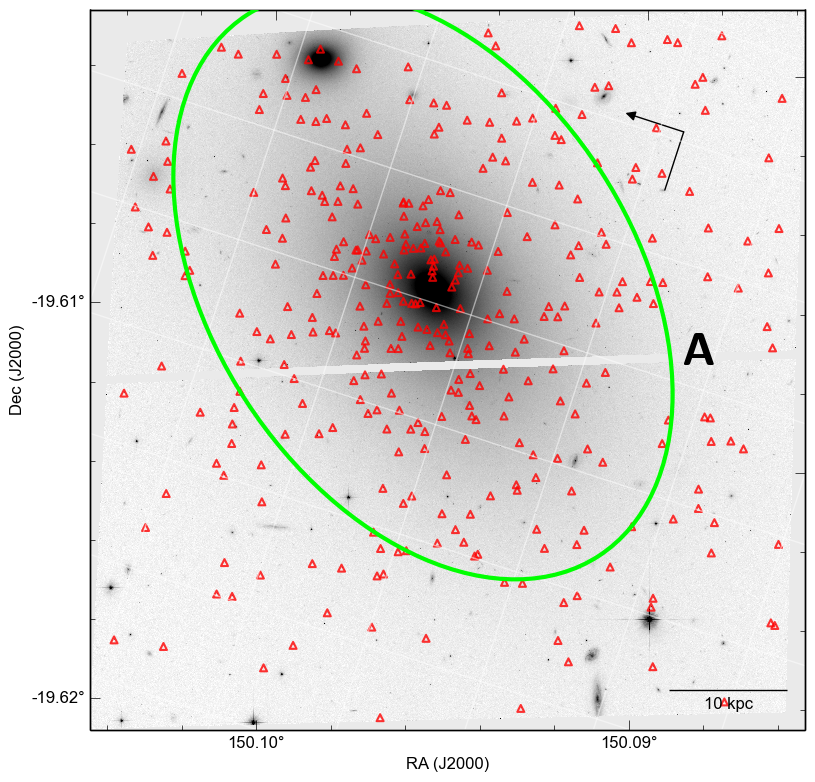
3.6 Physical Extent of the SCC and GCC Systems
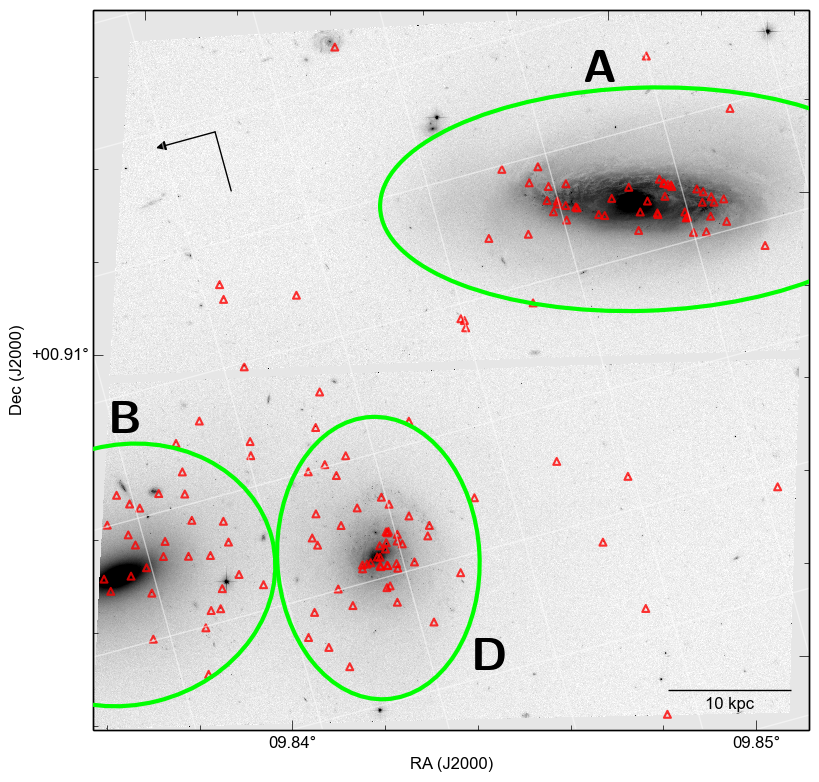
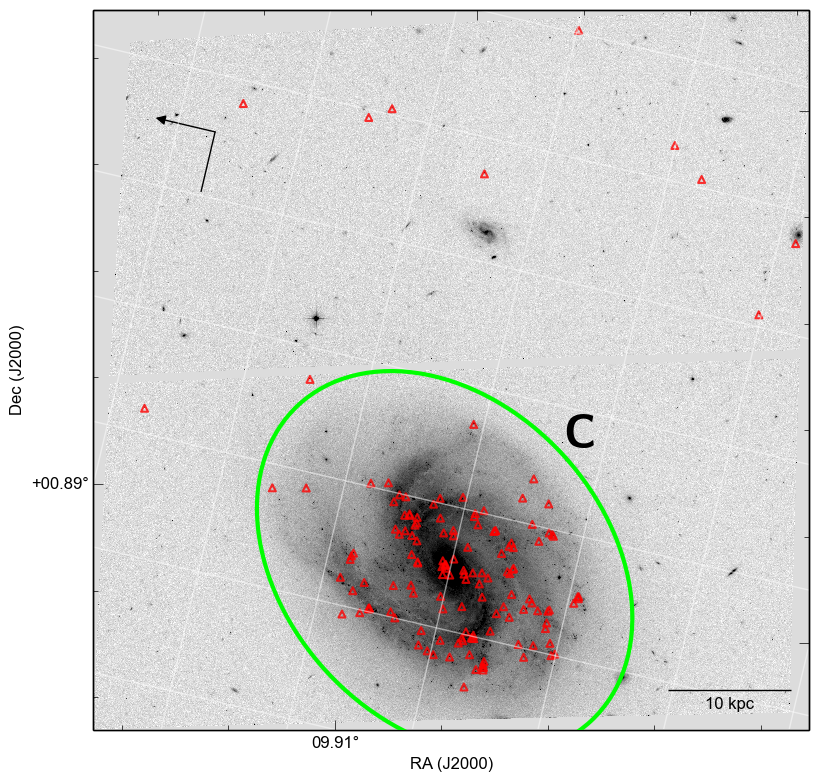
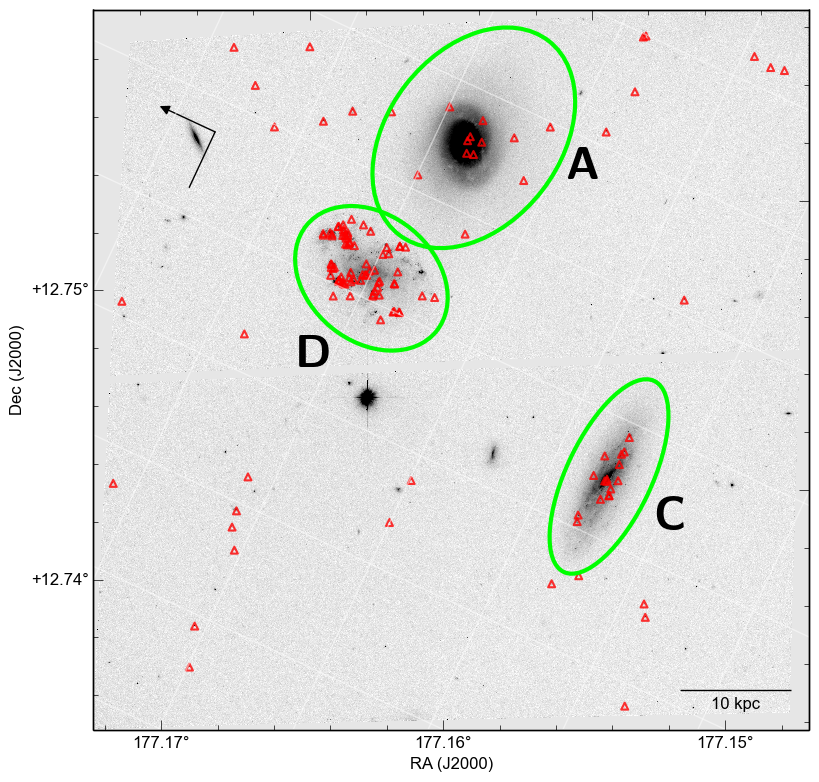
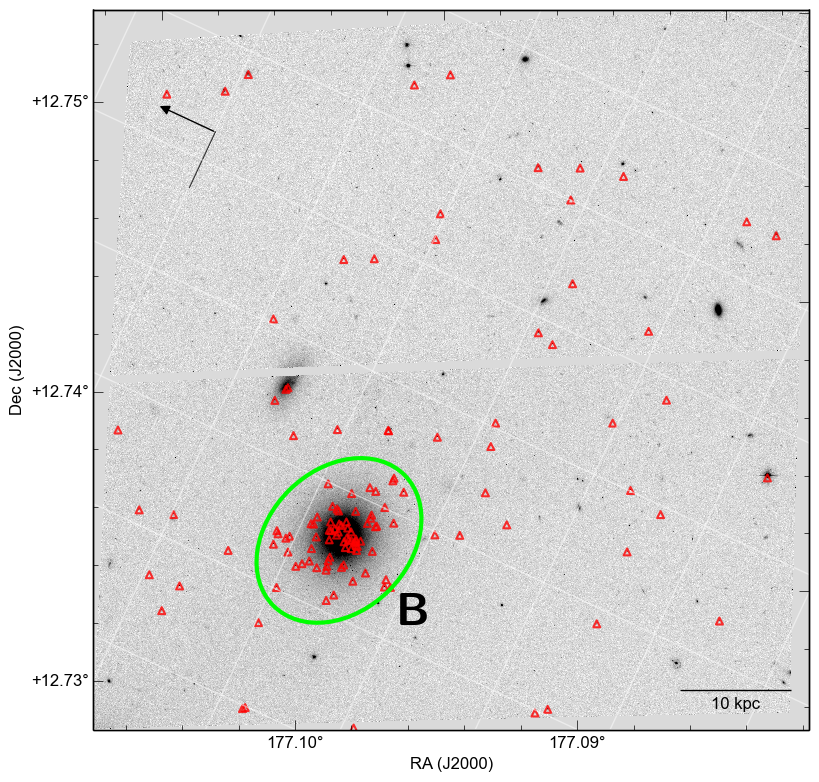
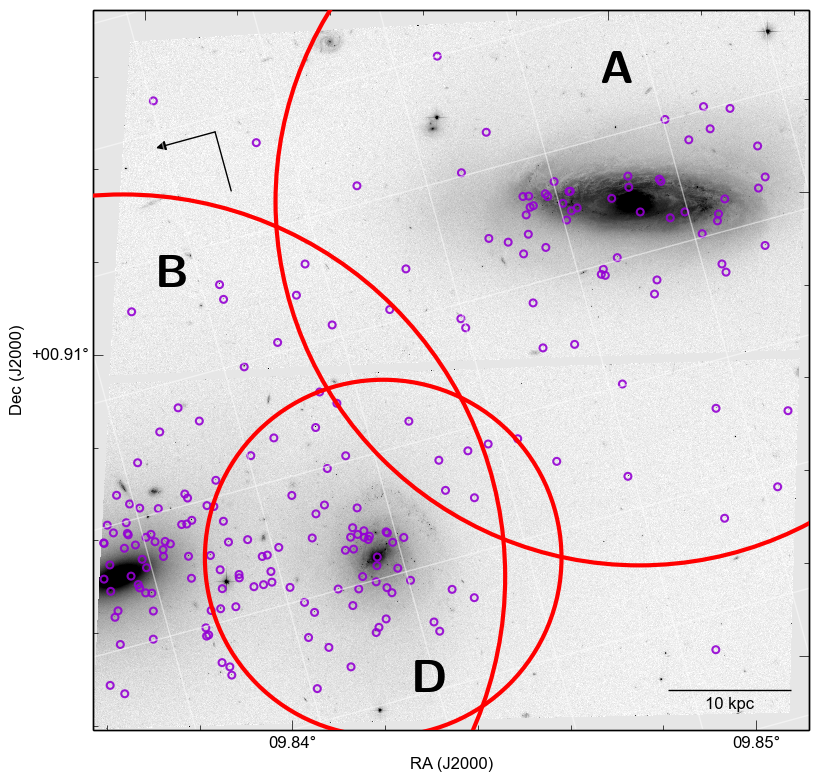
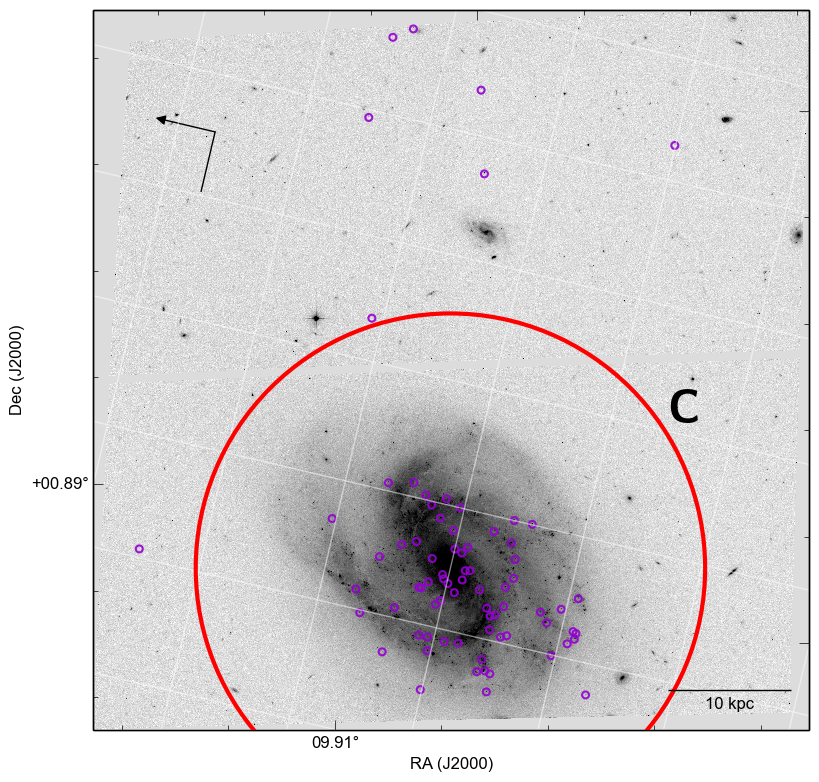
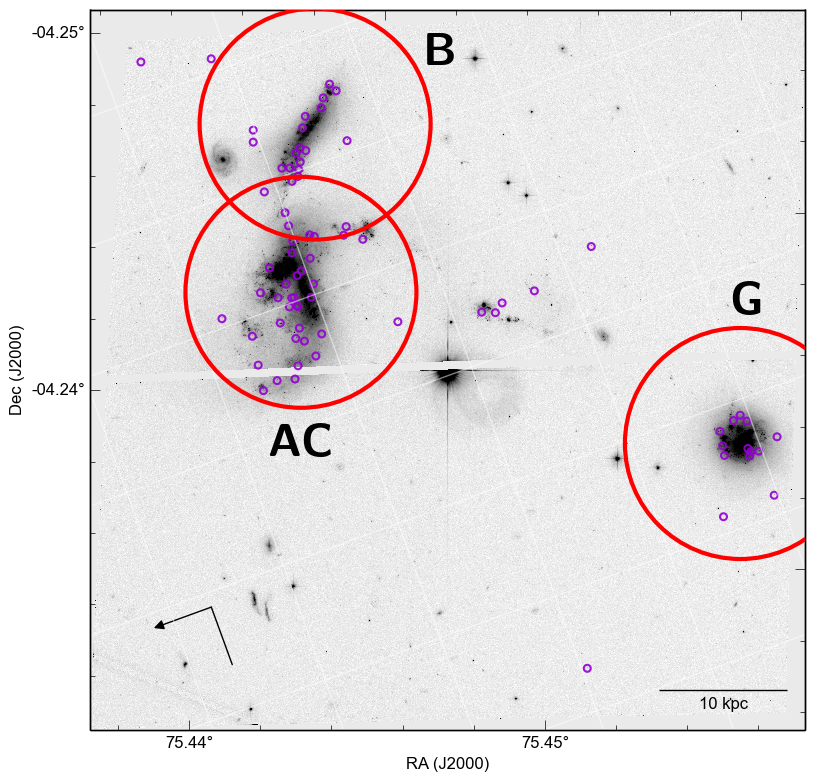
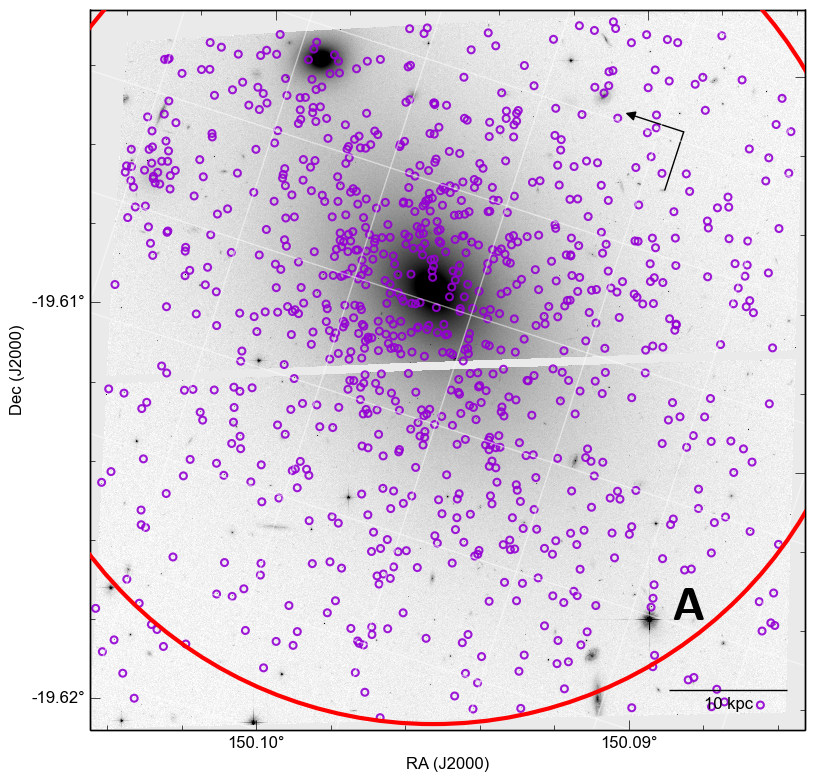
For each group, we present an image with regions that define the
expected extent of the star cluster and globular cluster systems
for each galaxy in that group (e.g., panel (b) of Fig. 9,
panel (c) of Fig. 14). We define the extent of the
star cluster systems as a brightness contour of
above the background level in the image to trace the
stellar light in each galaxy. The value of was identified
after experimenting with different values to both cover the optical
extent of the galaxies and include the apparent star cluster populations.
We successfully applied this criterion in our previous studies, and we
enclose areas large enough to include sources that are likely associated
with the host galaxies.
To define the expected extent for the globular cluster systems
(which populate much fainter galaxy halos), we initially use the
formula outlined in Rhode et al. (2007):
| (1) |
where is the mass of a host galaxy in and
is the expected radial extent of a system in kpc. However, given
the quadratic nature of the above equation and the low mass of some
galaxies in our sample, we needed to modify that expression to get
more realistic numbers for the lower range of stellar masses. We
made an assumption that for a small galaxy with a mass of ,
the expected radial extent of the GC system would be 9 kpc. This
assumption is supported by observed GCC distributions in galaxies
in our HCG sample. Combining that with data of the GC systems extent
from Rhode et al. (2007) and fitting a power-law function, we obtain
the following relation:
| (2) |
with and defined as above. This relation is valid for the range of log(mass) values from 9 to 12.5 . The result (dashed line) can be seen in Fig. 3.

3.7 Photometric Estimates of Metallicity
We use the Sirianni et al. (2005) synthetic transformations to convert
colours for GCs to the Johnson photometric system
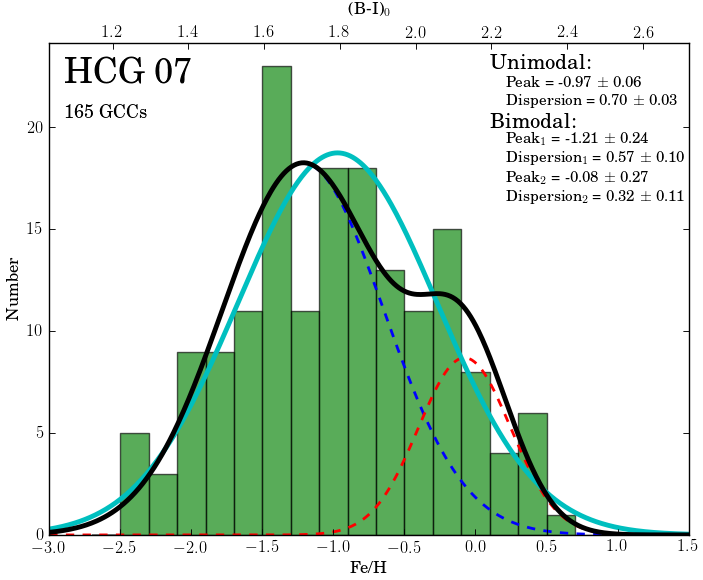
colours. We estimate the globular cluster metallicities using the
to [Fe/H] transformation from Harris et al. (2006):
| (3) |
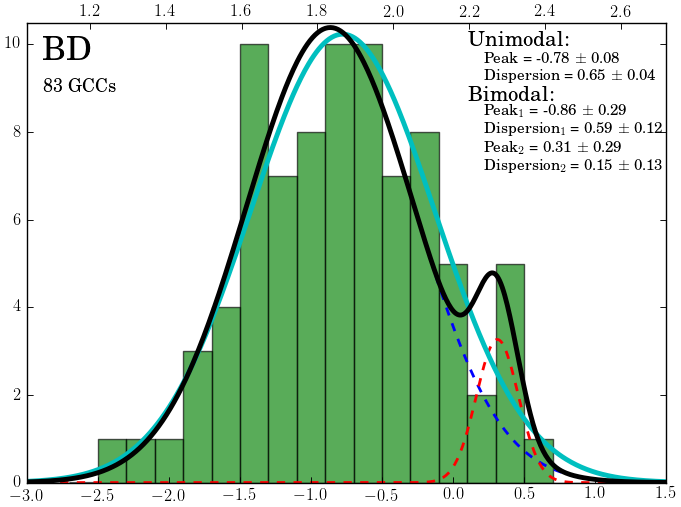
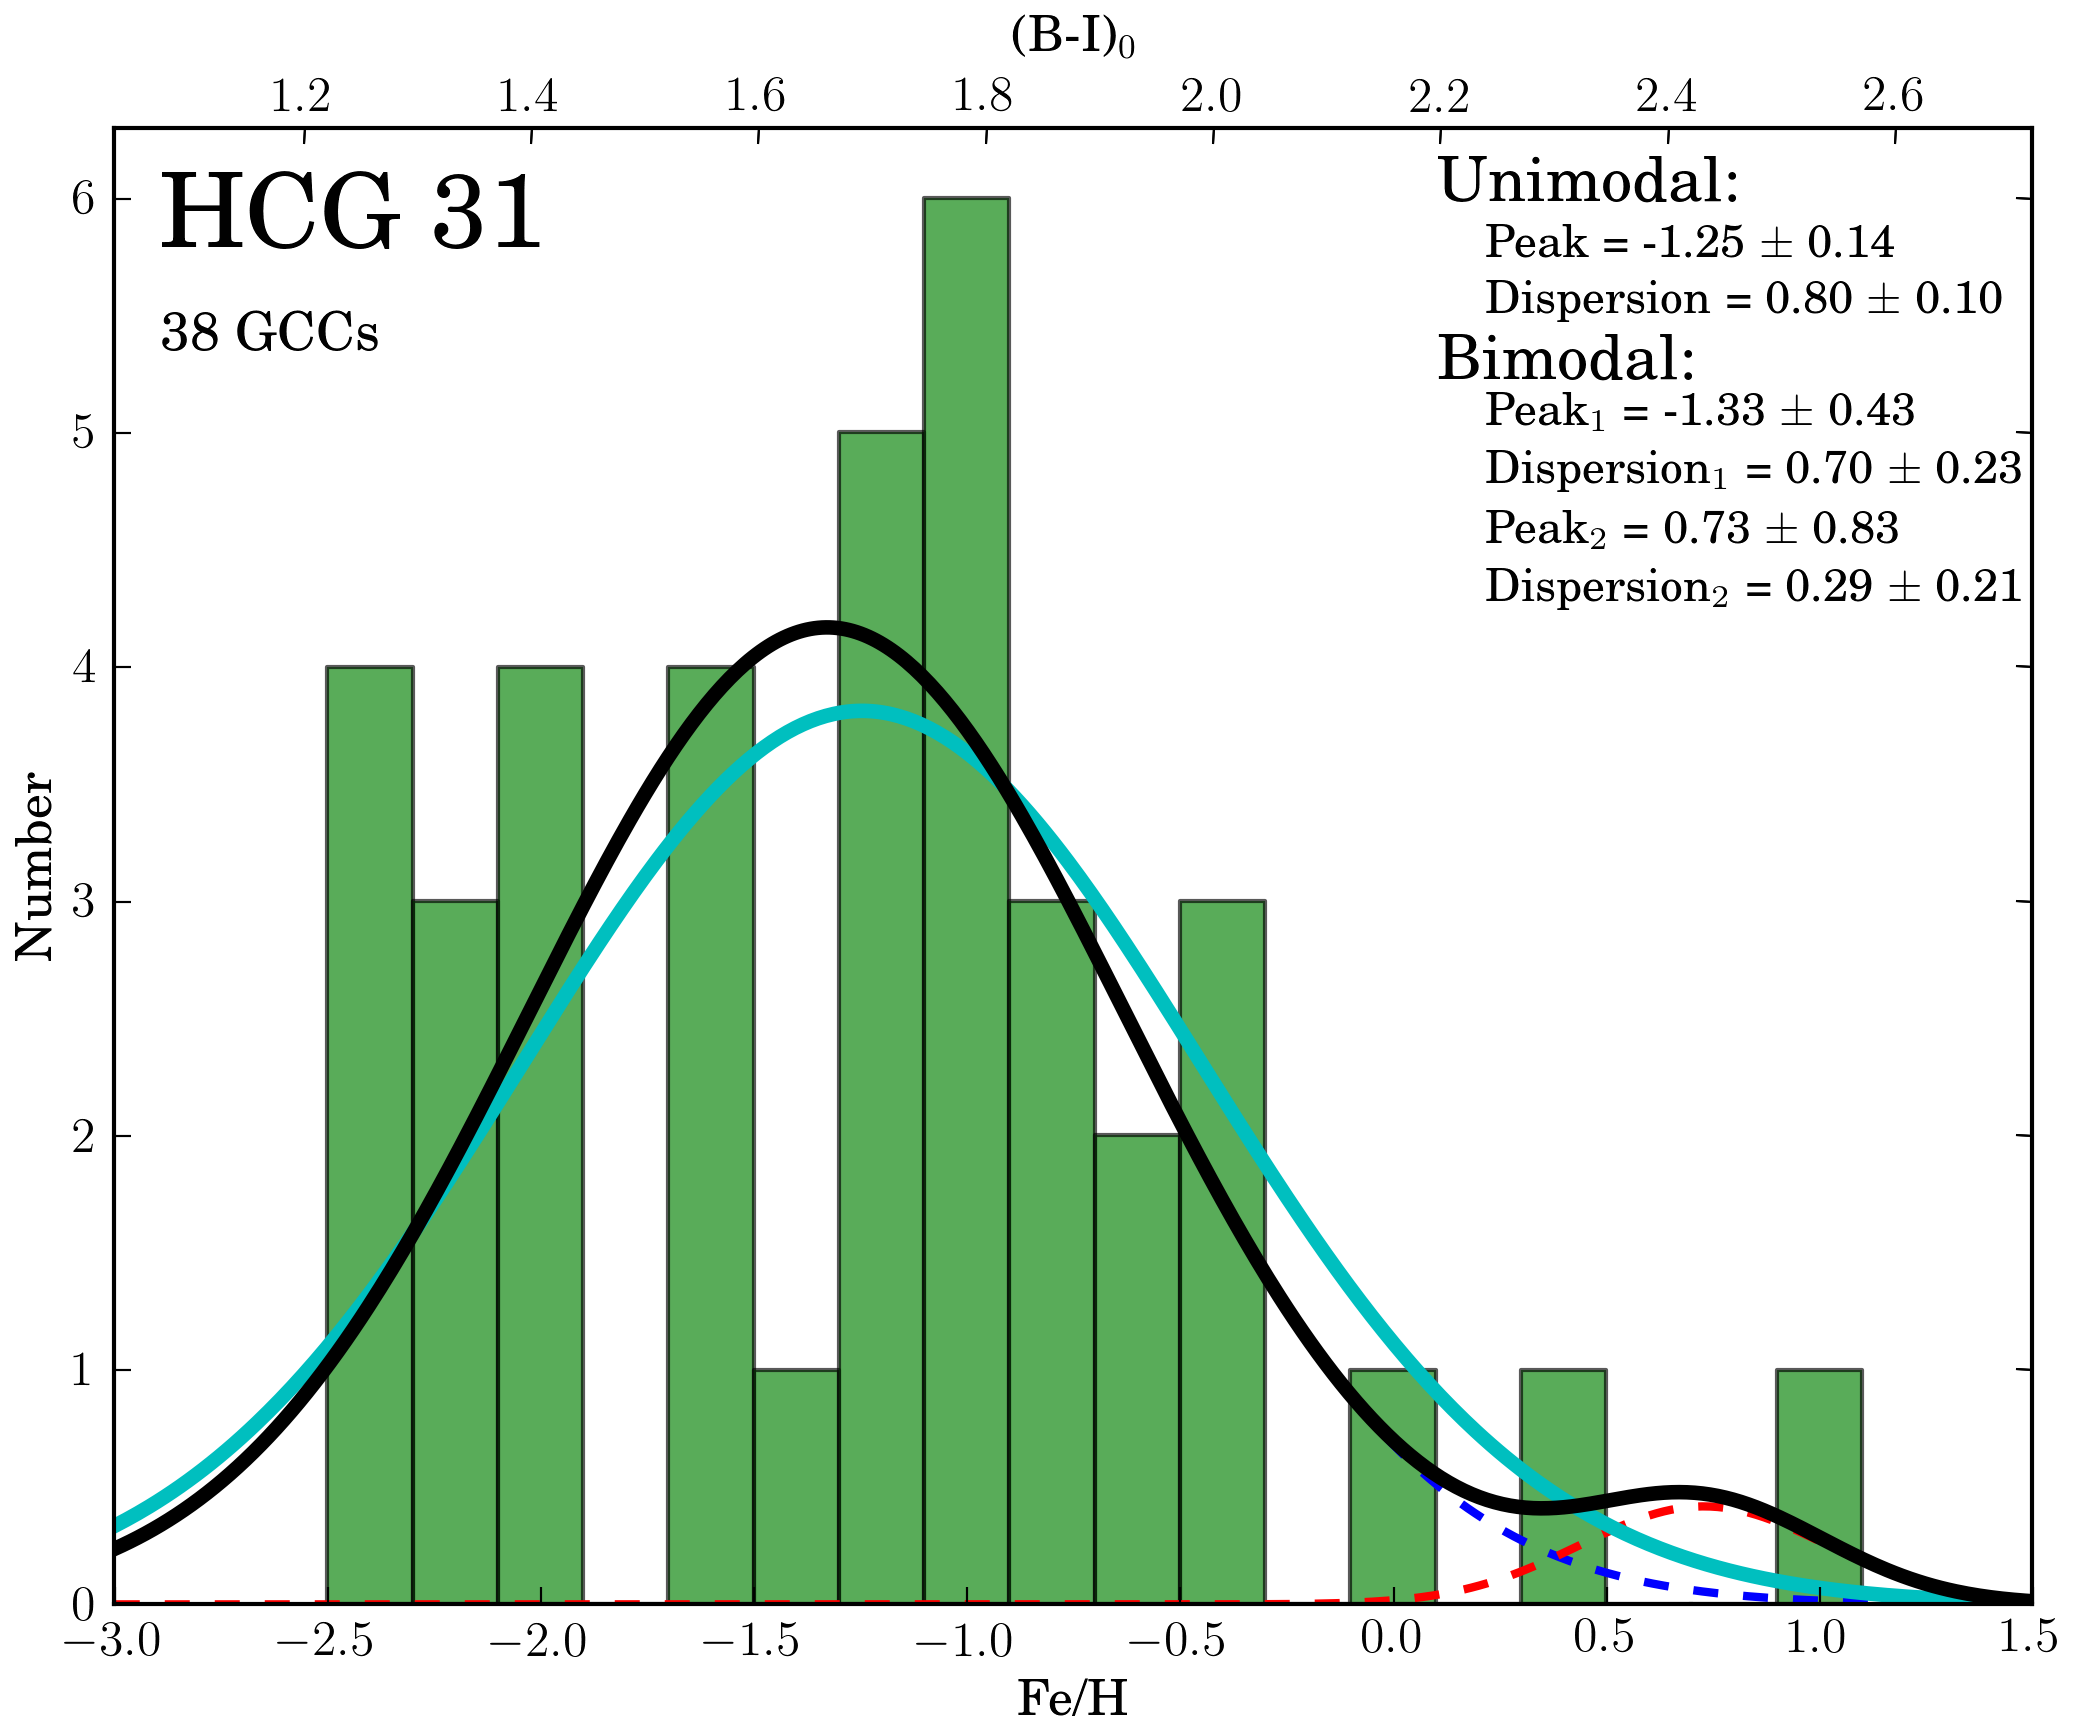
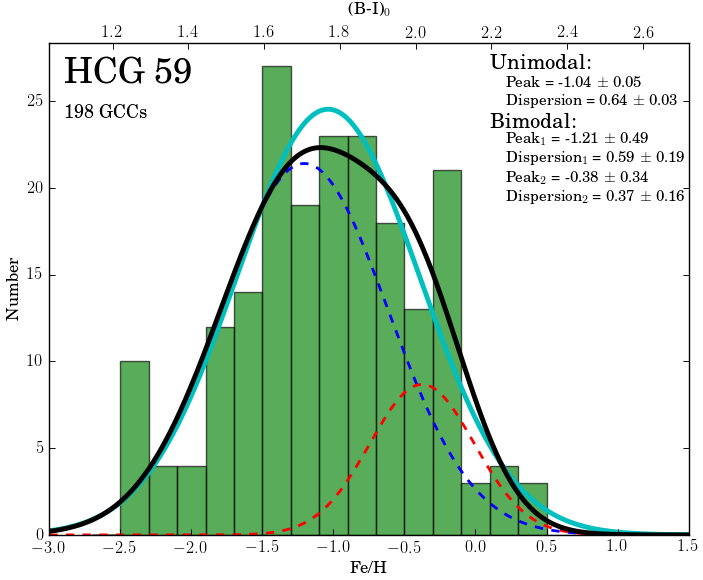
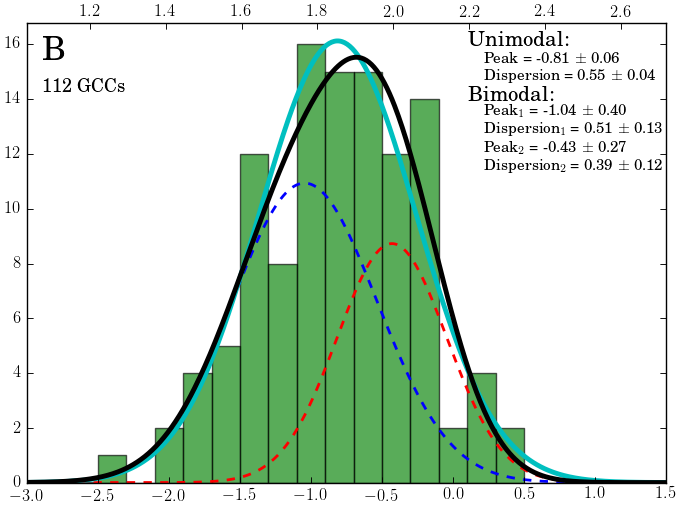
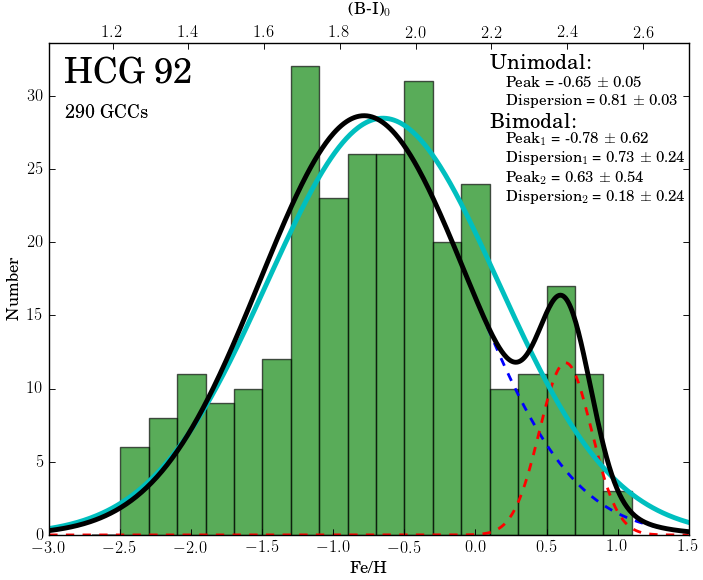
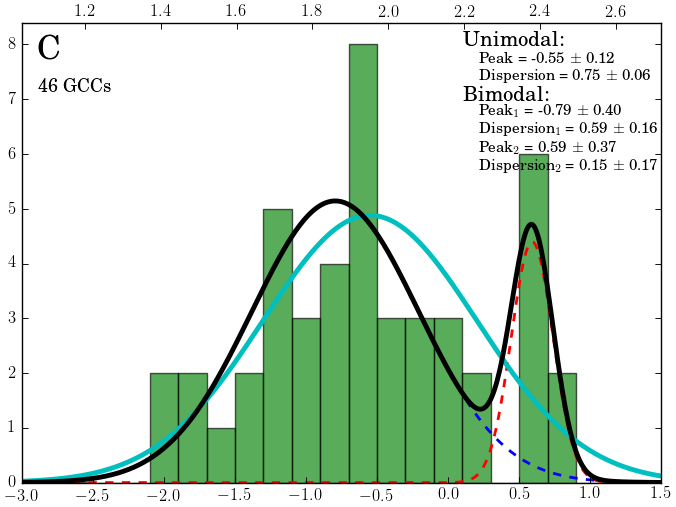
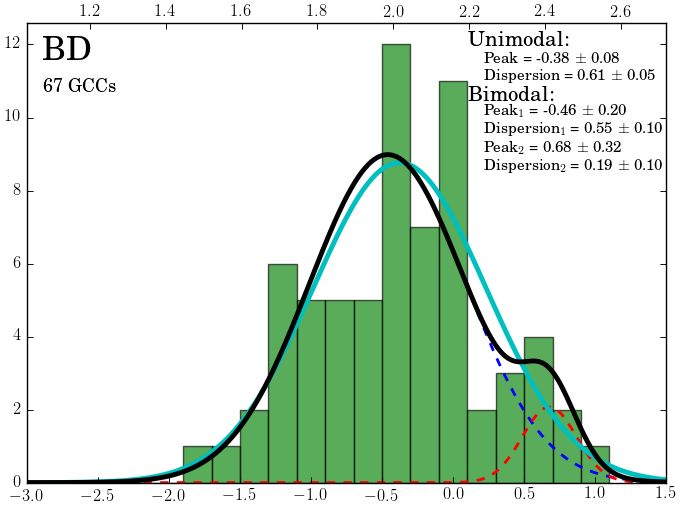
For the GC population of our sample galaxies with a sufficient number of clusters (we use populations with 40 or more GCs), we plot the colour distribution and measure the specific frequency. We also plot colour distributions of GCs for each galaxy group in our sample. We use the GMM (Gaussian Mixture Modeling) code of Muratov & Gnedin (2010) to probe the bimodality and to determine the peaks and dispersions of these distributions. Because mixture modeling codes are generally sensitive to extended tails we use GMM on the distribution between . The GMM results are recorded in Table LABEL:tab:unibi similarly to table 2 of Blakeslee et al. (2012), where one can find a detailed guide to interpreting the GMM results. The plots of the metallicity distributions for groups and galaxies from Table LABEL:tab:unibi are presented in Figures 14 – 18, and described on a group-by-group basis in §4 below.
3.8 Empirical Estimate of GC System Population
In recent work, Harris et al. (2013) have determined an empirical
predictor of the total number of GCs for galaxies of all
luminosities as a function of effective radius () and
velocity dispersion (), given by equation:
| (4) |
For those galaxies in our sample for which we were able to find the values of and in the literature (HCG 42A and HCG 59B), we calculate the predicted numbers of GCs and compare them to our estimates (Table 1) based on the observed GC luminosity function in each galaxy.
4 Results and Discussion
Below, we present a short overview of the star cluster populations in our sample of Hickson Compact Groups. Analyses of the data presented in this catalogue for individual groups have been published in a number of publications (e.g., Gallagher et al., 2010; Konstantopoulos et al., 2013). However, most of these analyses were on a case-by-case basis. In this publication, we aim for a systematic approach by applying the same criteria to the catalogue selection as whole. Because of this, there will be some differences between already published results and the numbers obtained in this paper. For example, the total number of GCCs may differ because we apply a different magnitude cut off or use a slightly modified distance modulus. Throughout the paper, we carefully outline all of our steps so the reader can follow them and, if desired, modify them to apply their own criteria.
Furthermore, we examine the star cluster populations of compact groups through the prism of the formation history and evolution of those groups. As mentioned previously, Konstantopoulos et al. (2010) outlined a proposed evolutionary sequence of CGs with respect to the amount and spatial distribution of cold gas in these groups. In brief, using the ratio of gas mass to the dynamical mass, the groups are divided into three types: I, II, and III for gas rich, intermediate, and gas poor groups. Moreover, these groups are further split into two parallel sequences, depending on the location of gas inside a group. Sequence A is for groups with gas contained in galaxies, and Sequence B is for groups with gas being dispersed throughout the intra-group medium. Our sample represents all three types of groups in terms of gas content, and so we can trace differences between the group types through the lens of their star cluster populations.
To check the general properties of galaxies in our sample we plot two figures. First, we plot the number of detected GCCs in galaxies as a function of stellar masses of those galaxies, Fig. 4.

On average, the numbers of GCCs in a host galaxy are proportional to the stellar mass of that galaxy. However, galaxy 59B, and as the result the whole HCG 59, appears to have an excess of GCs given its stellar mass. This is discussed in §4.4 in more detail.

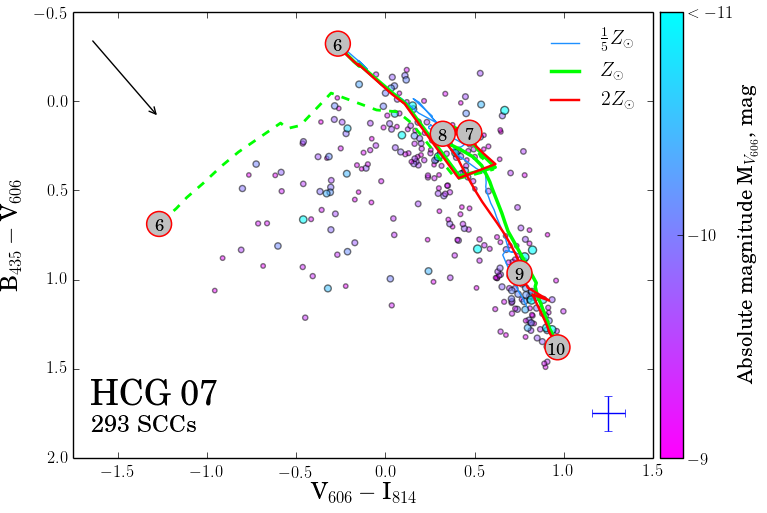
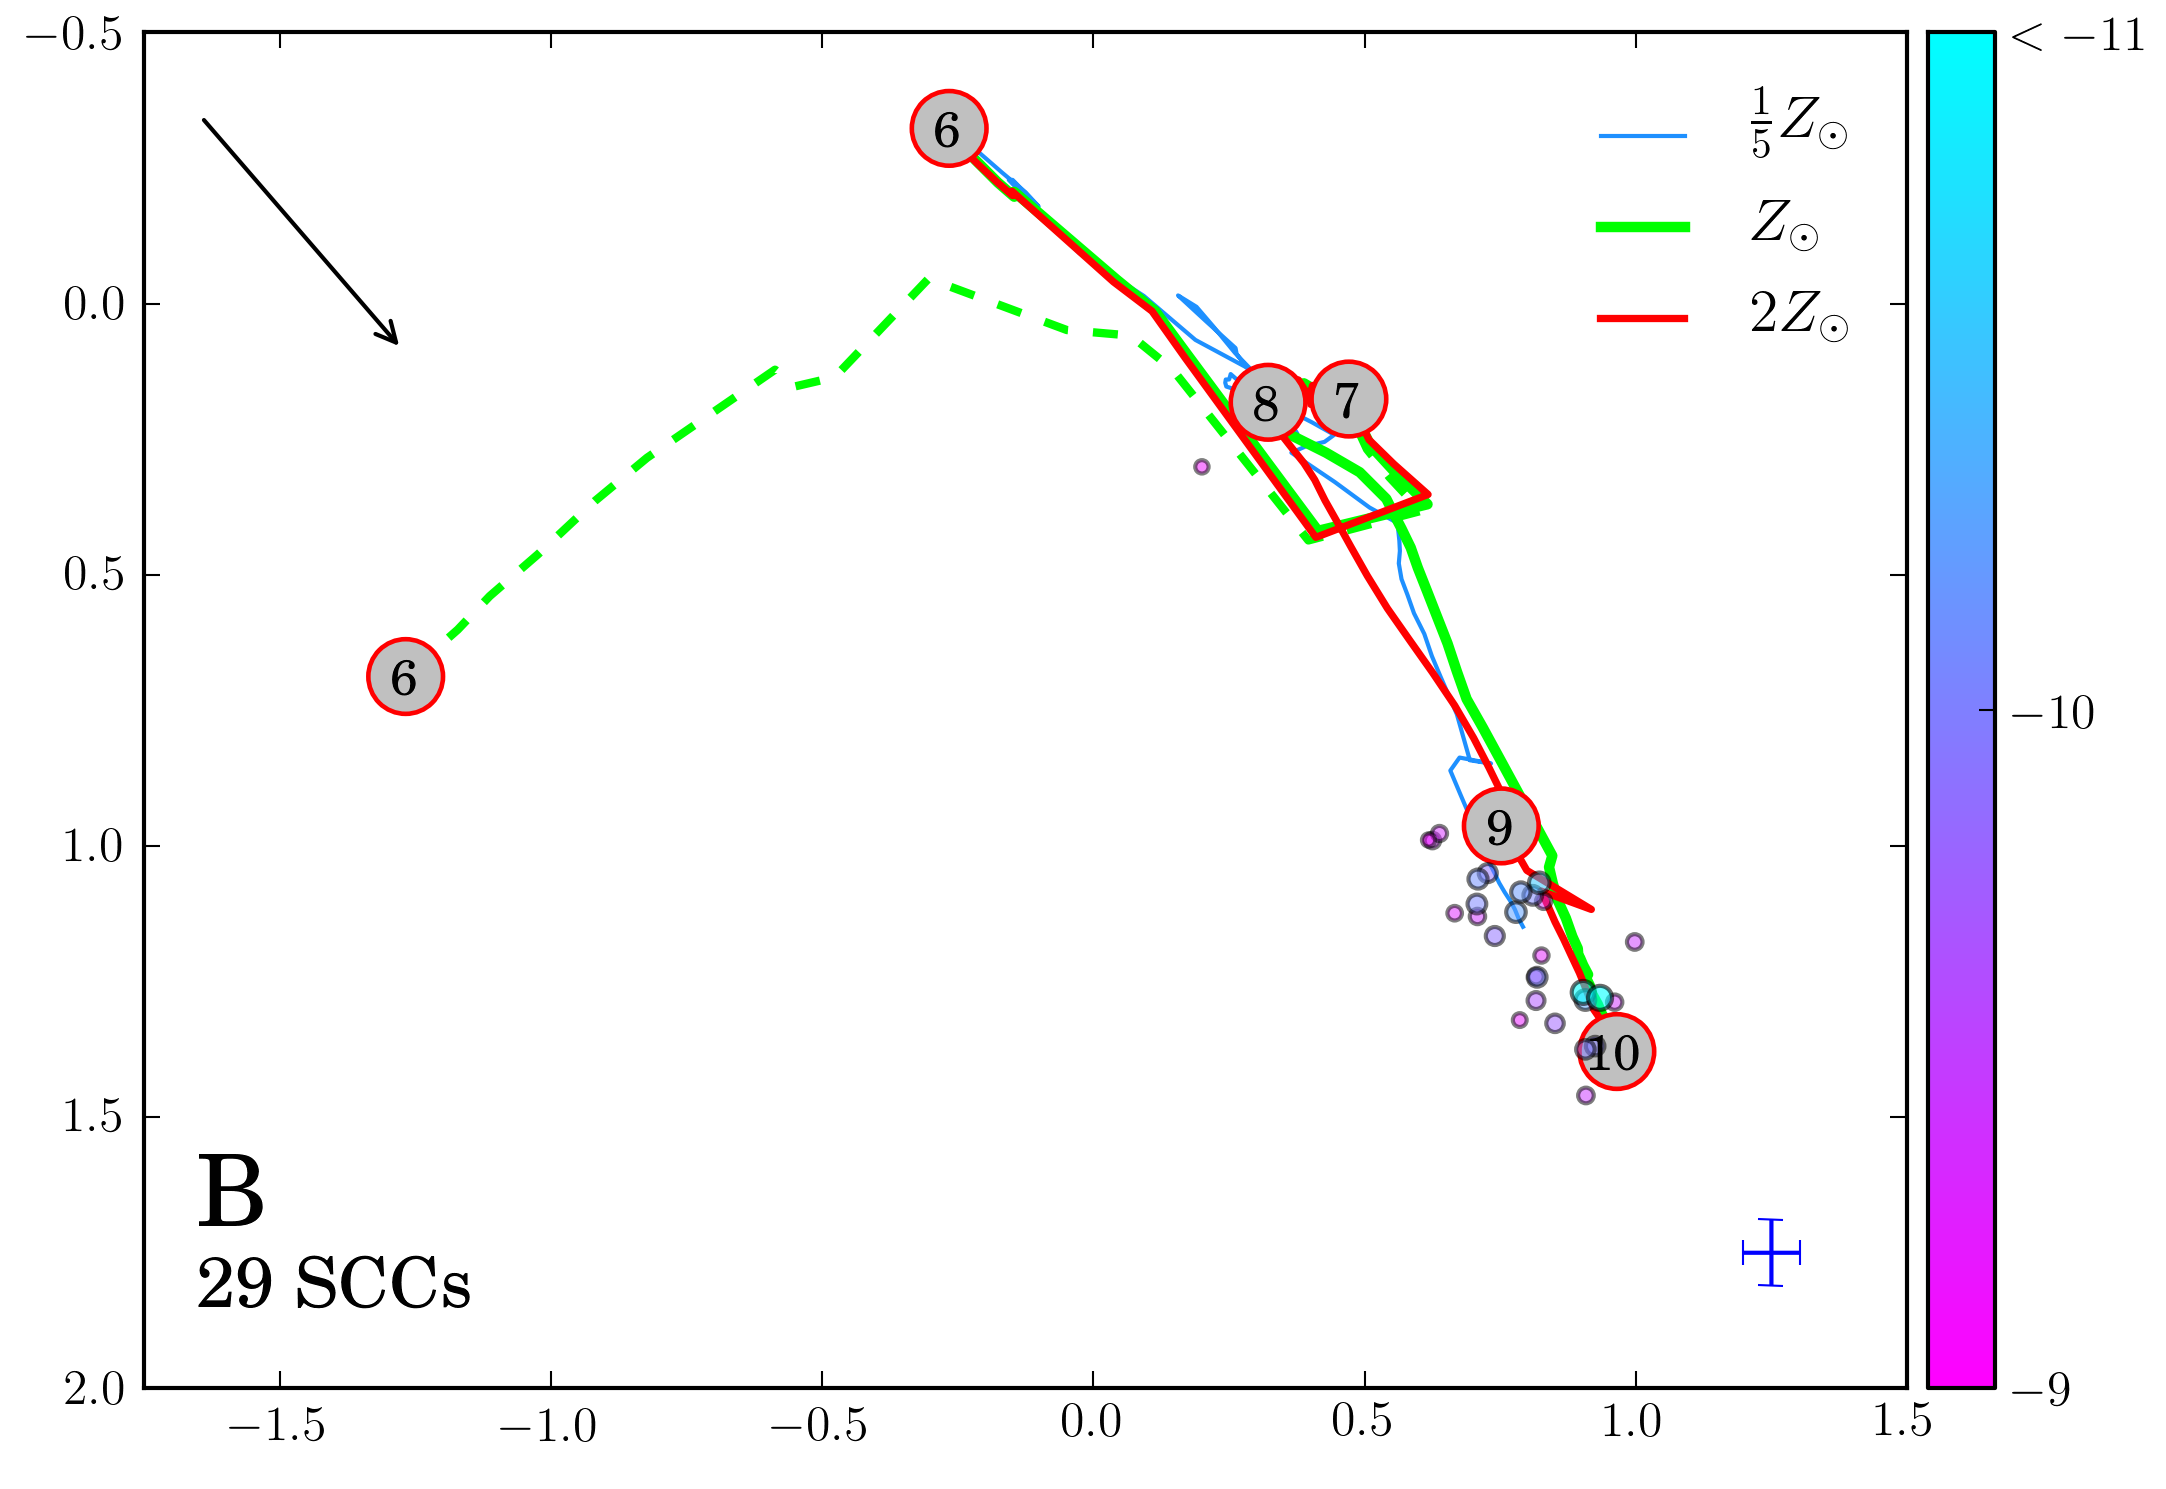
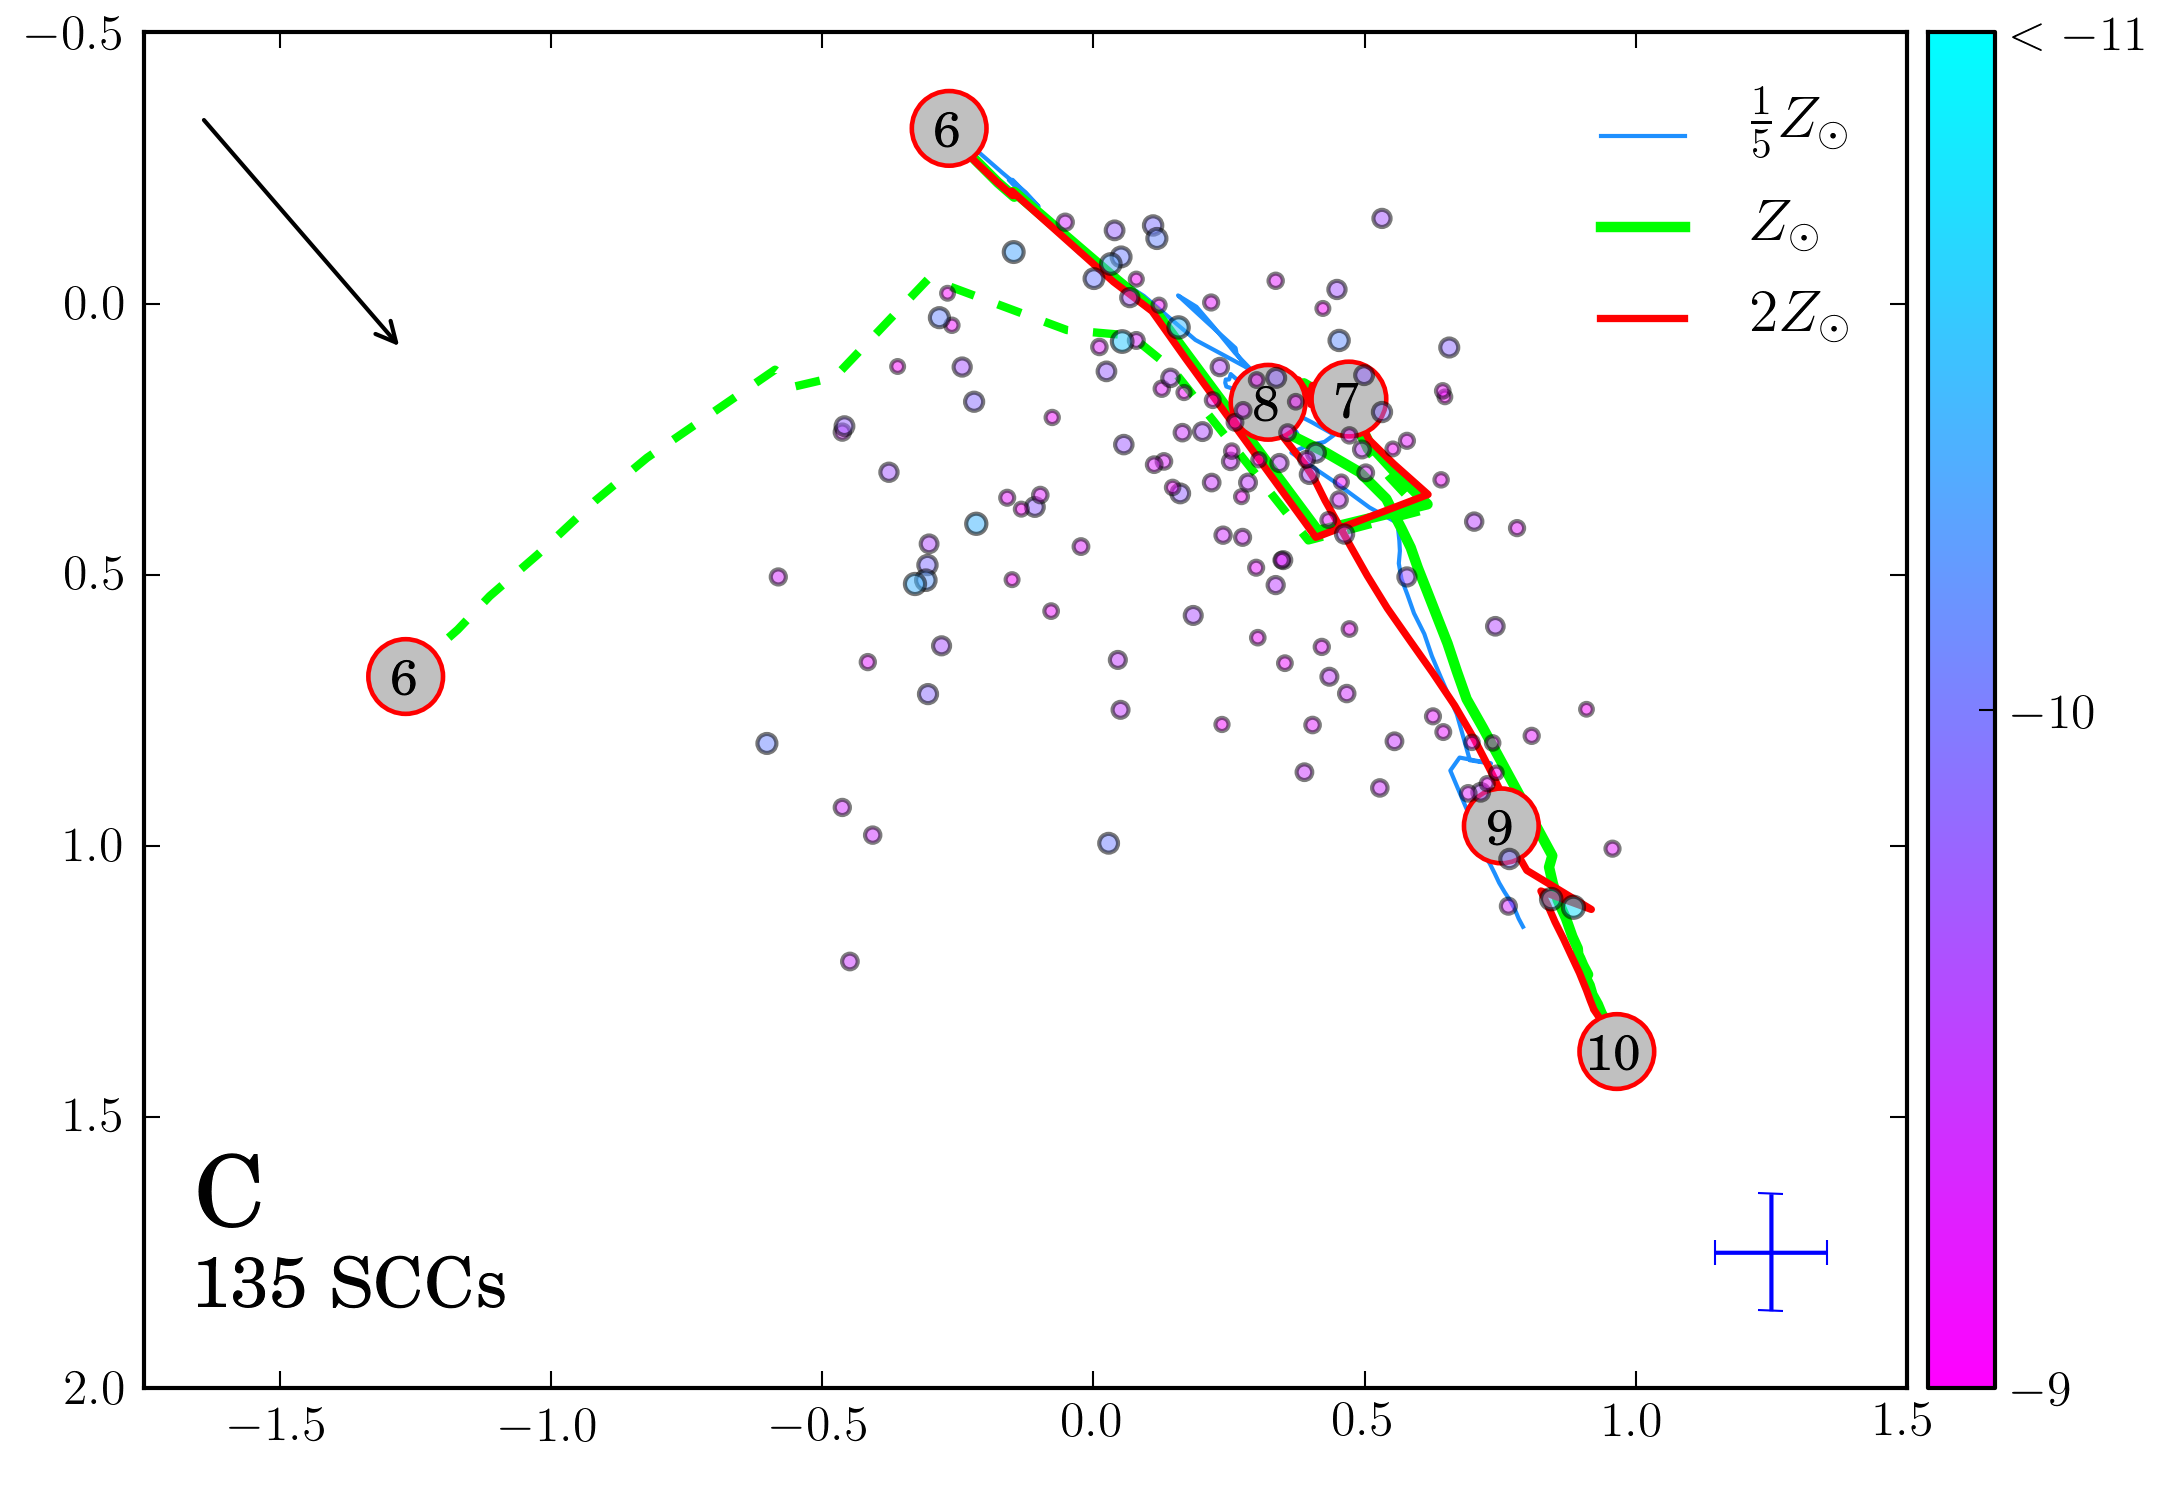
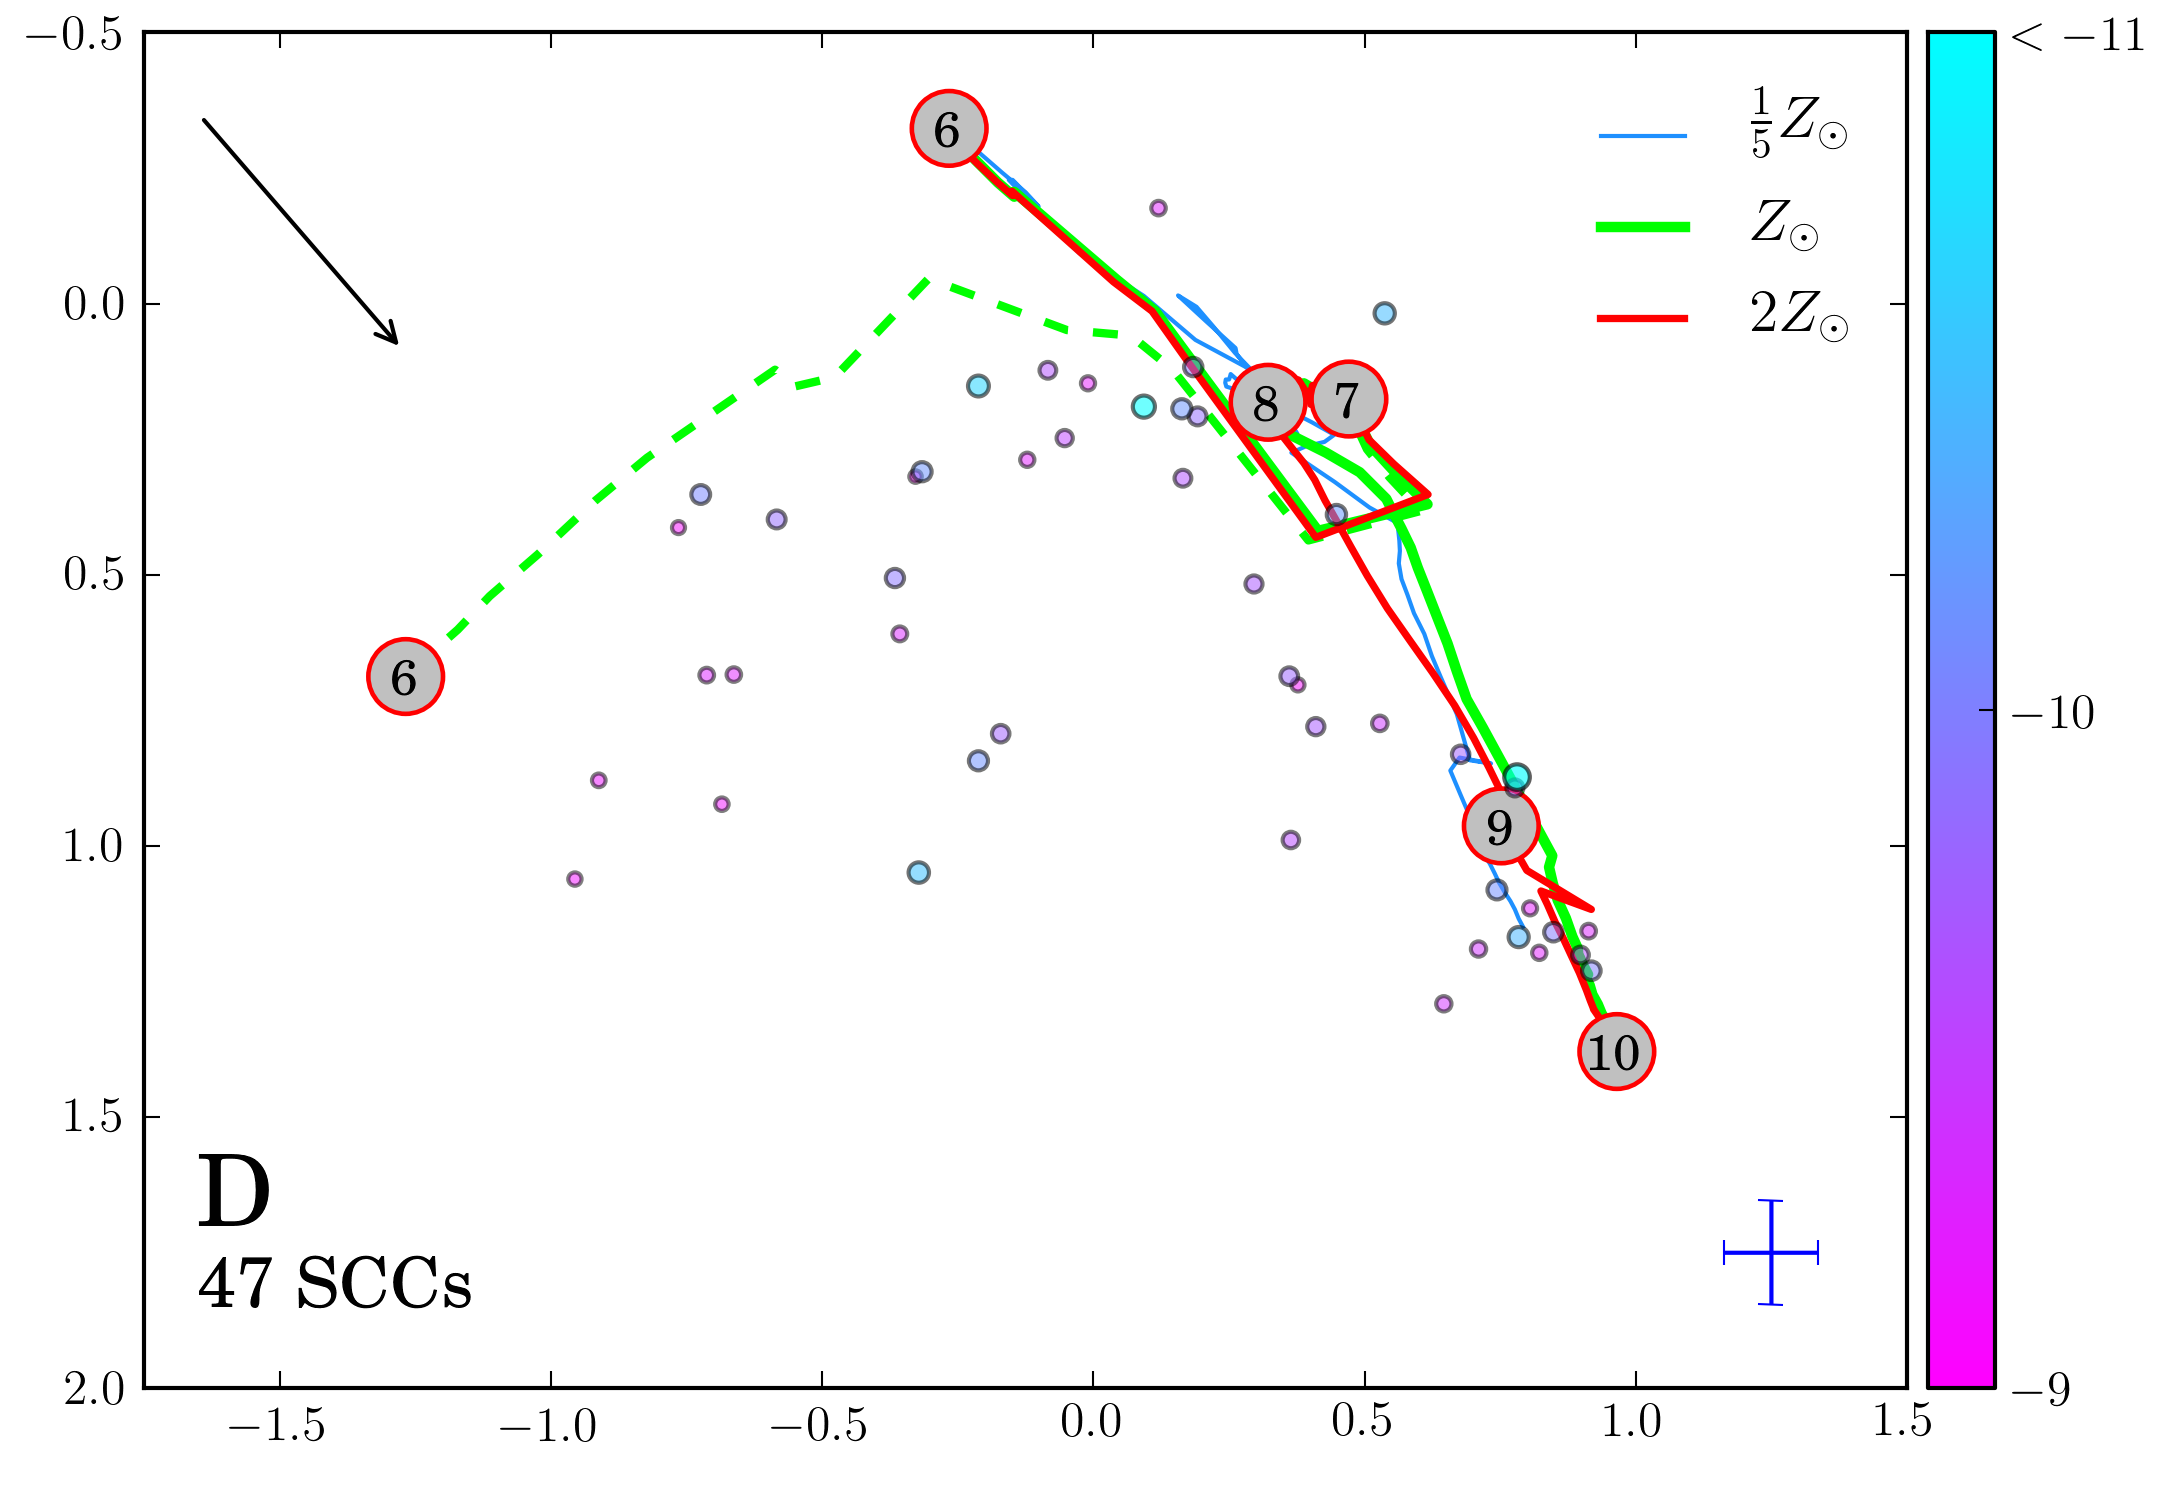
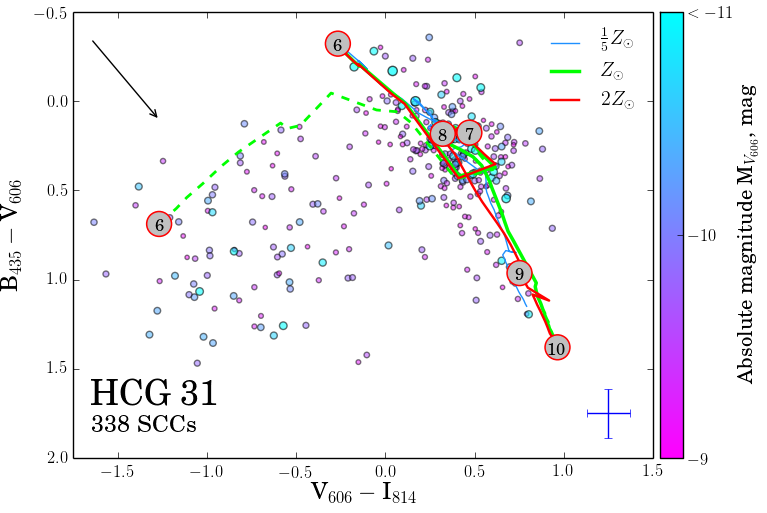
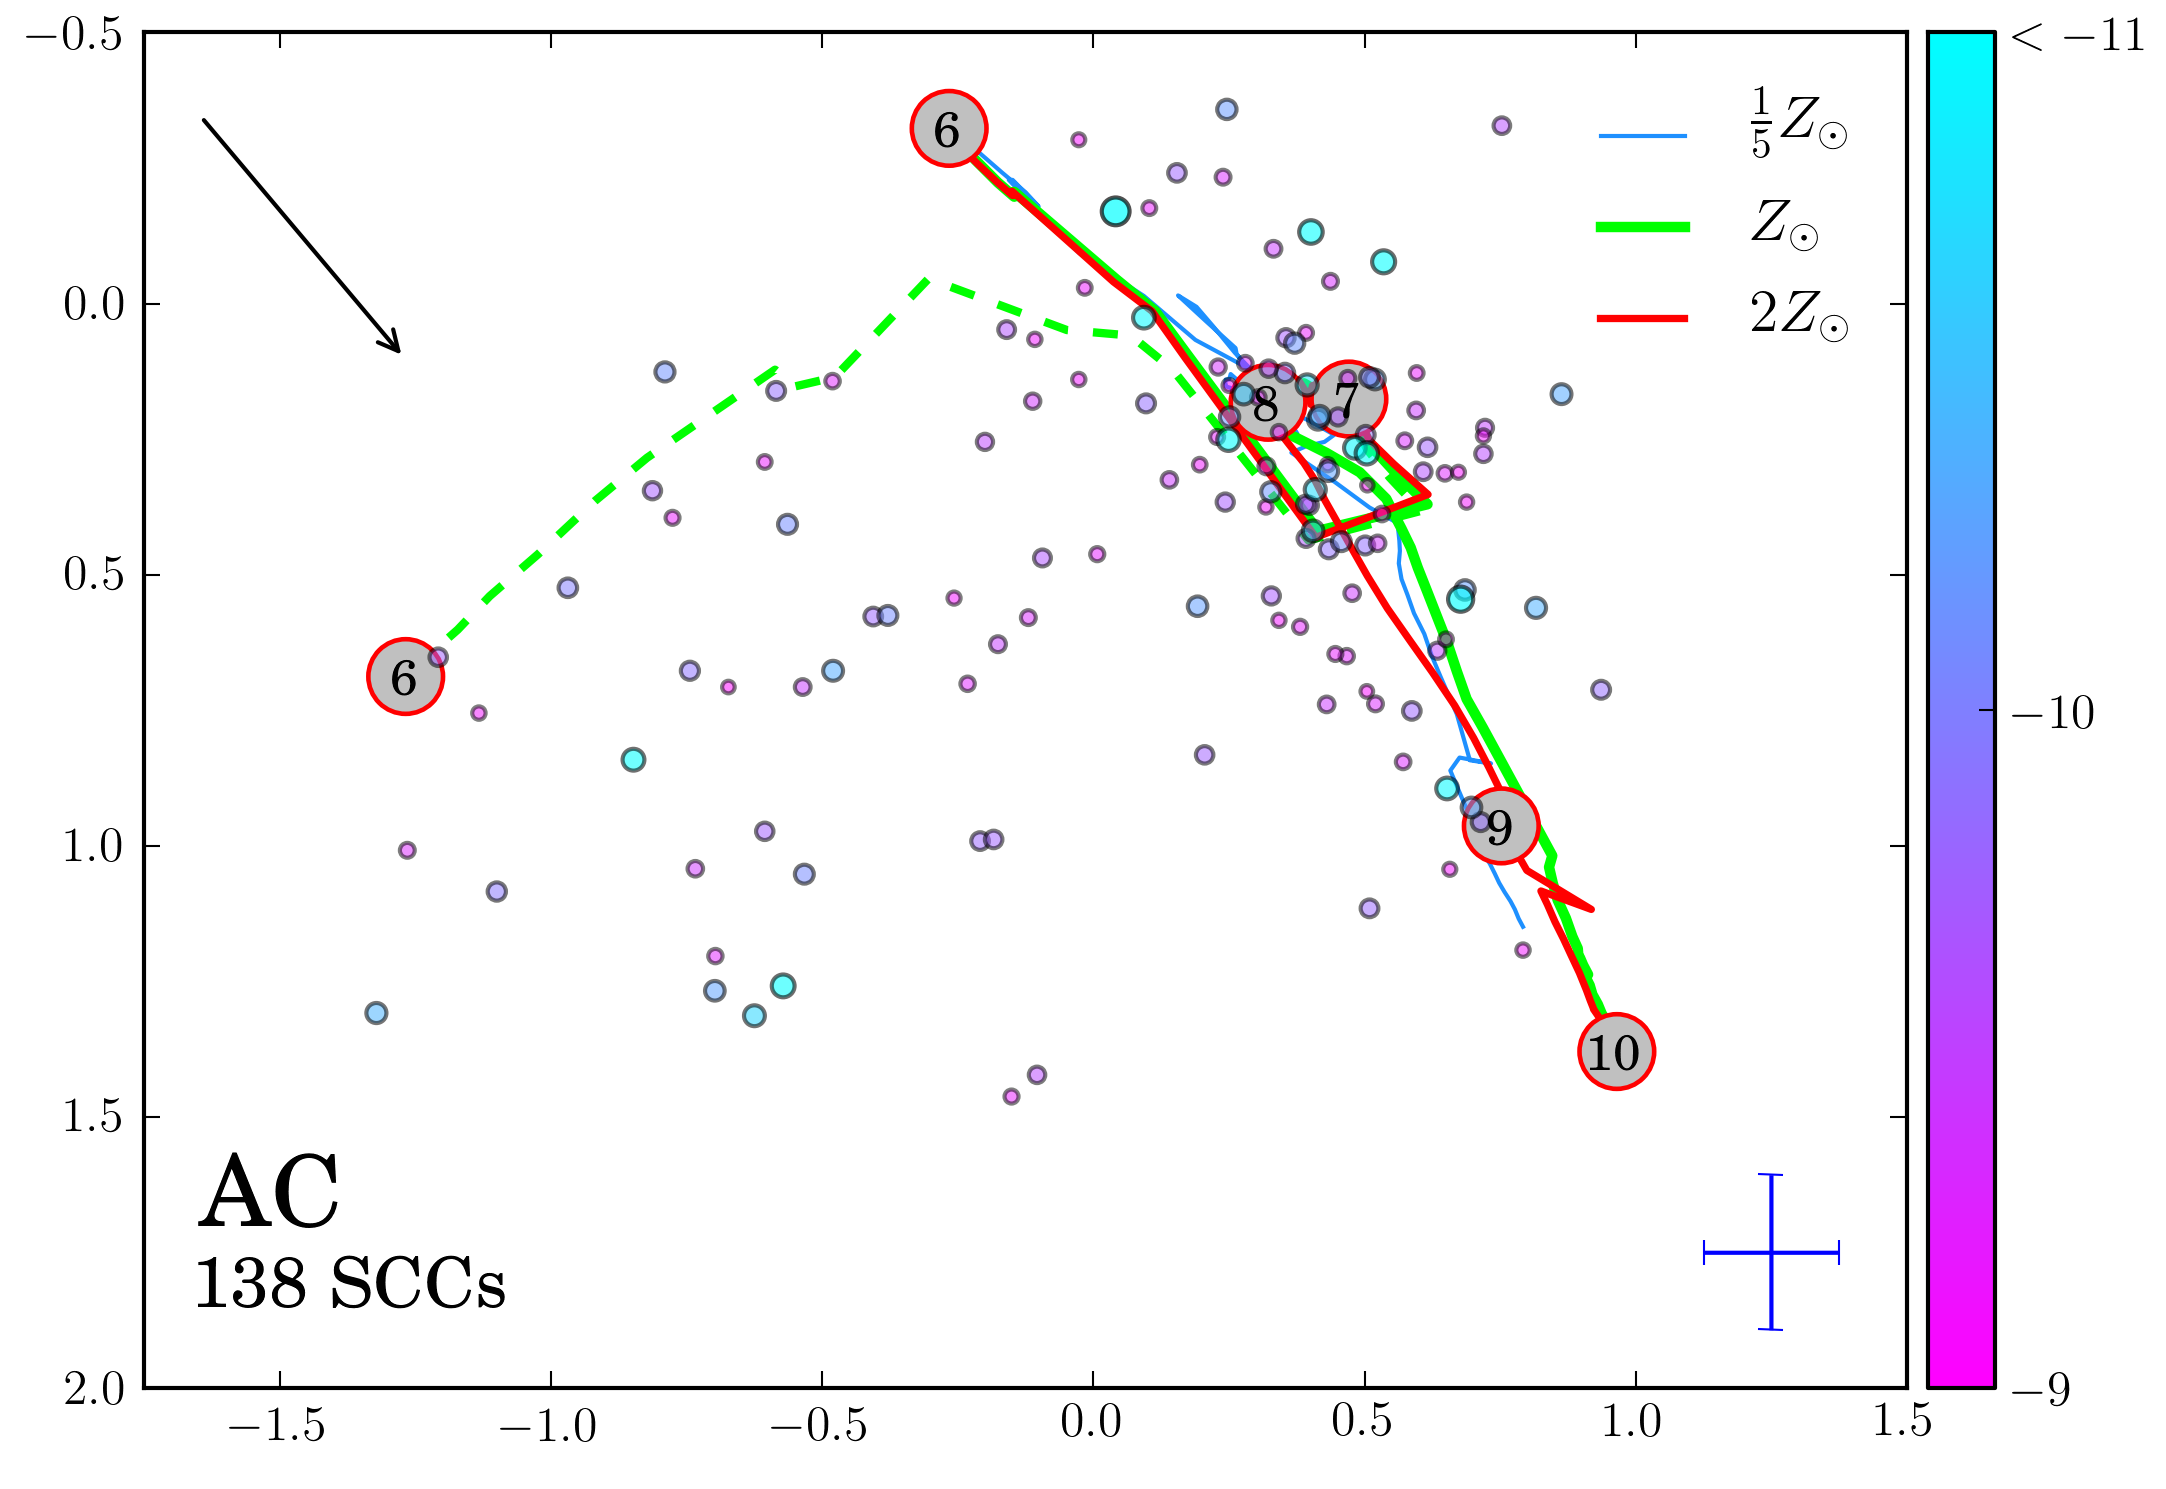
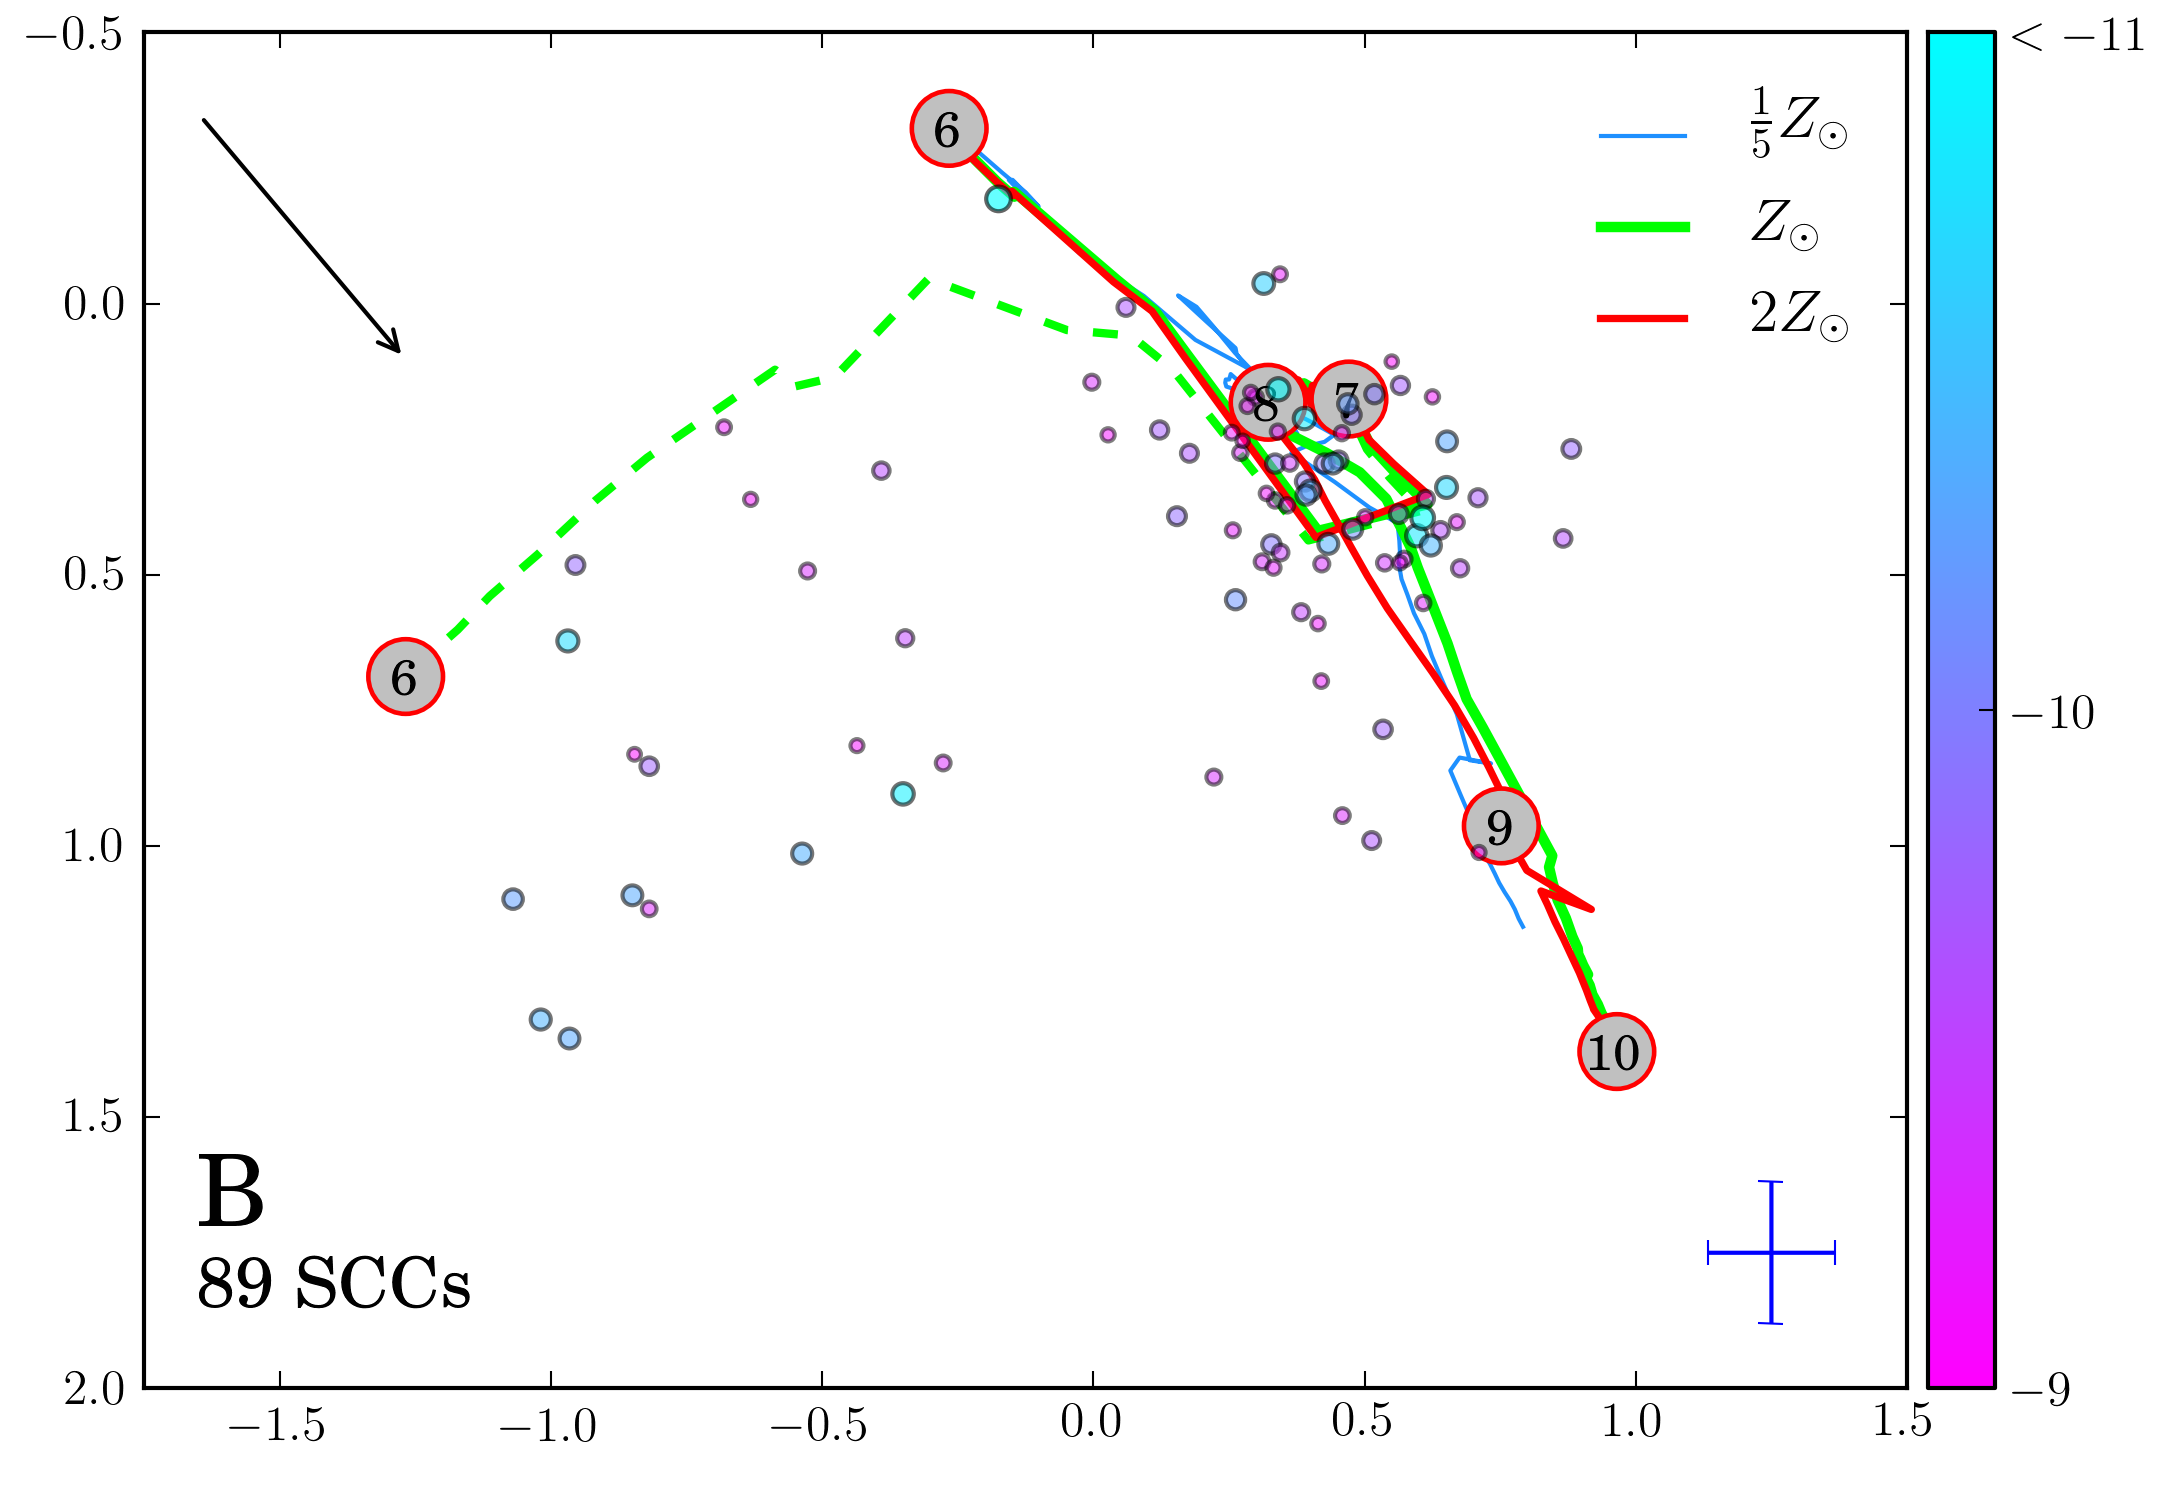
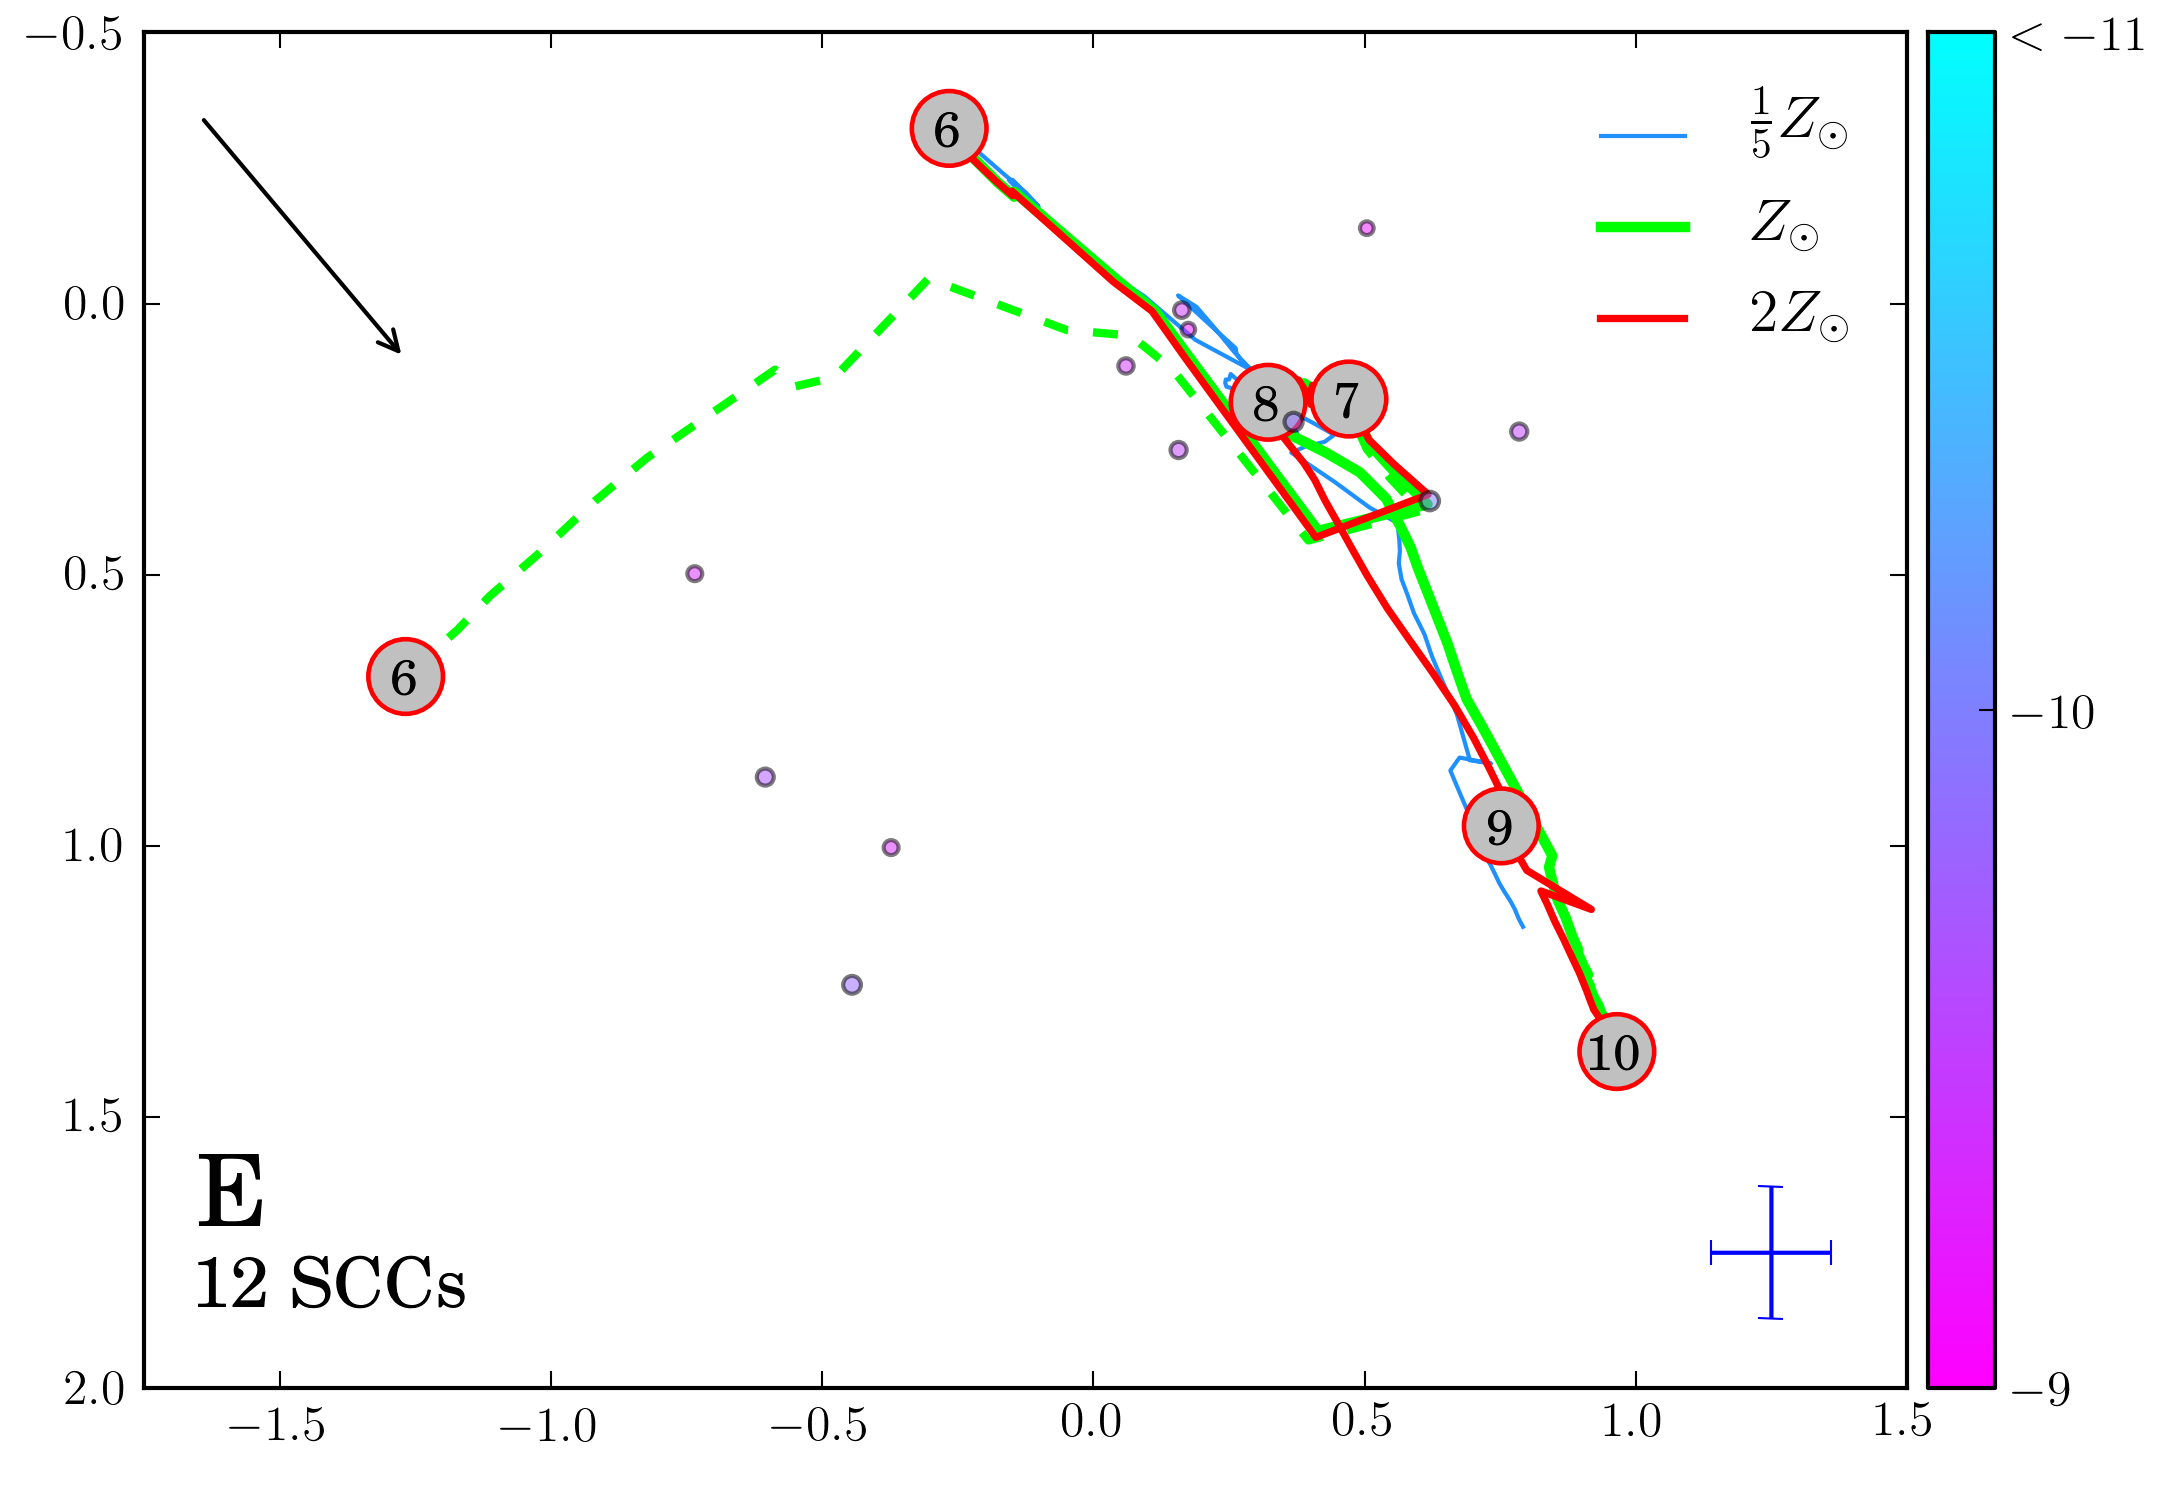
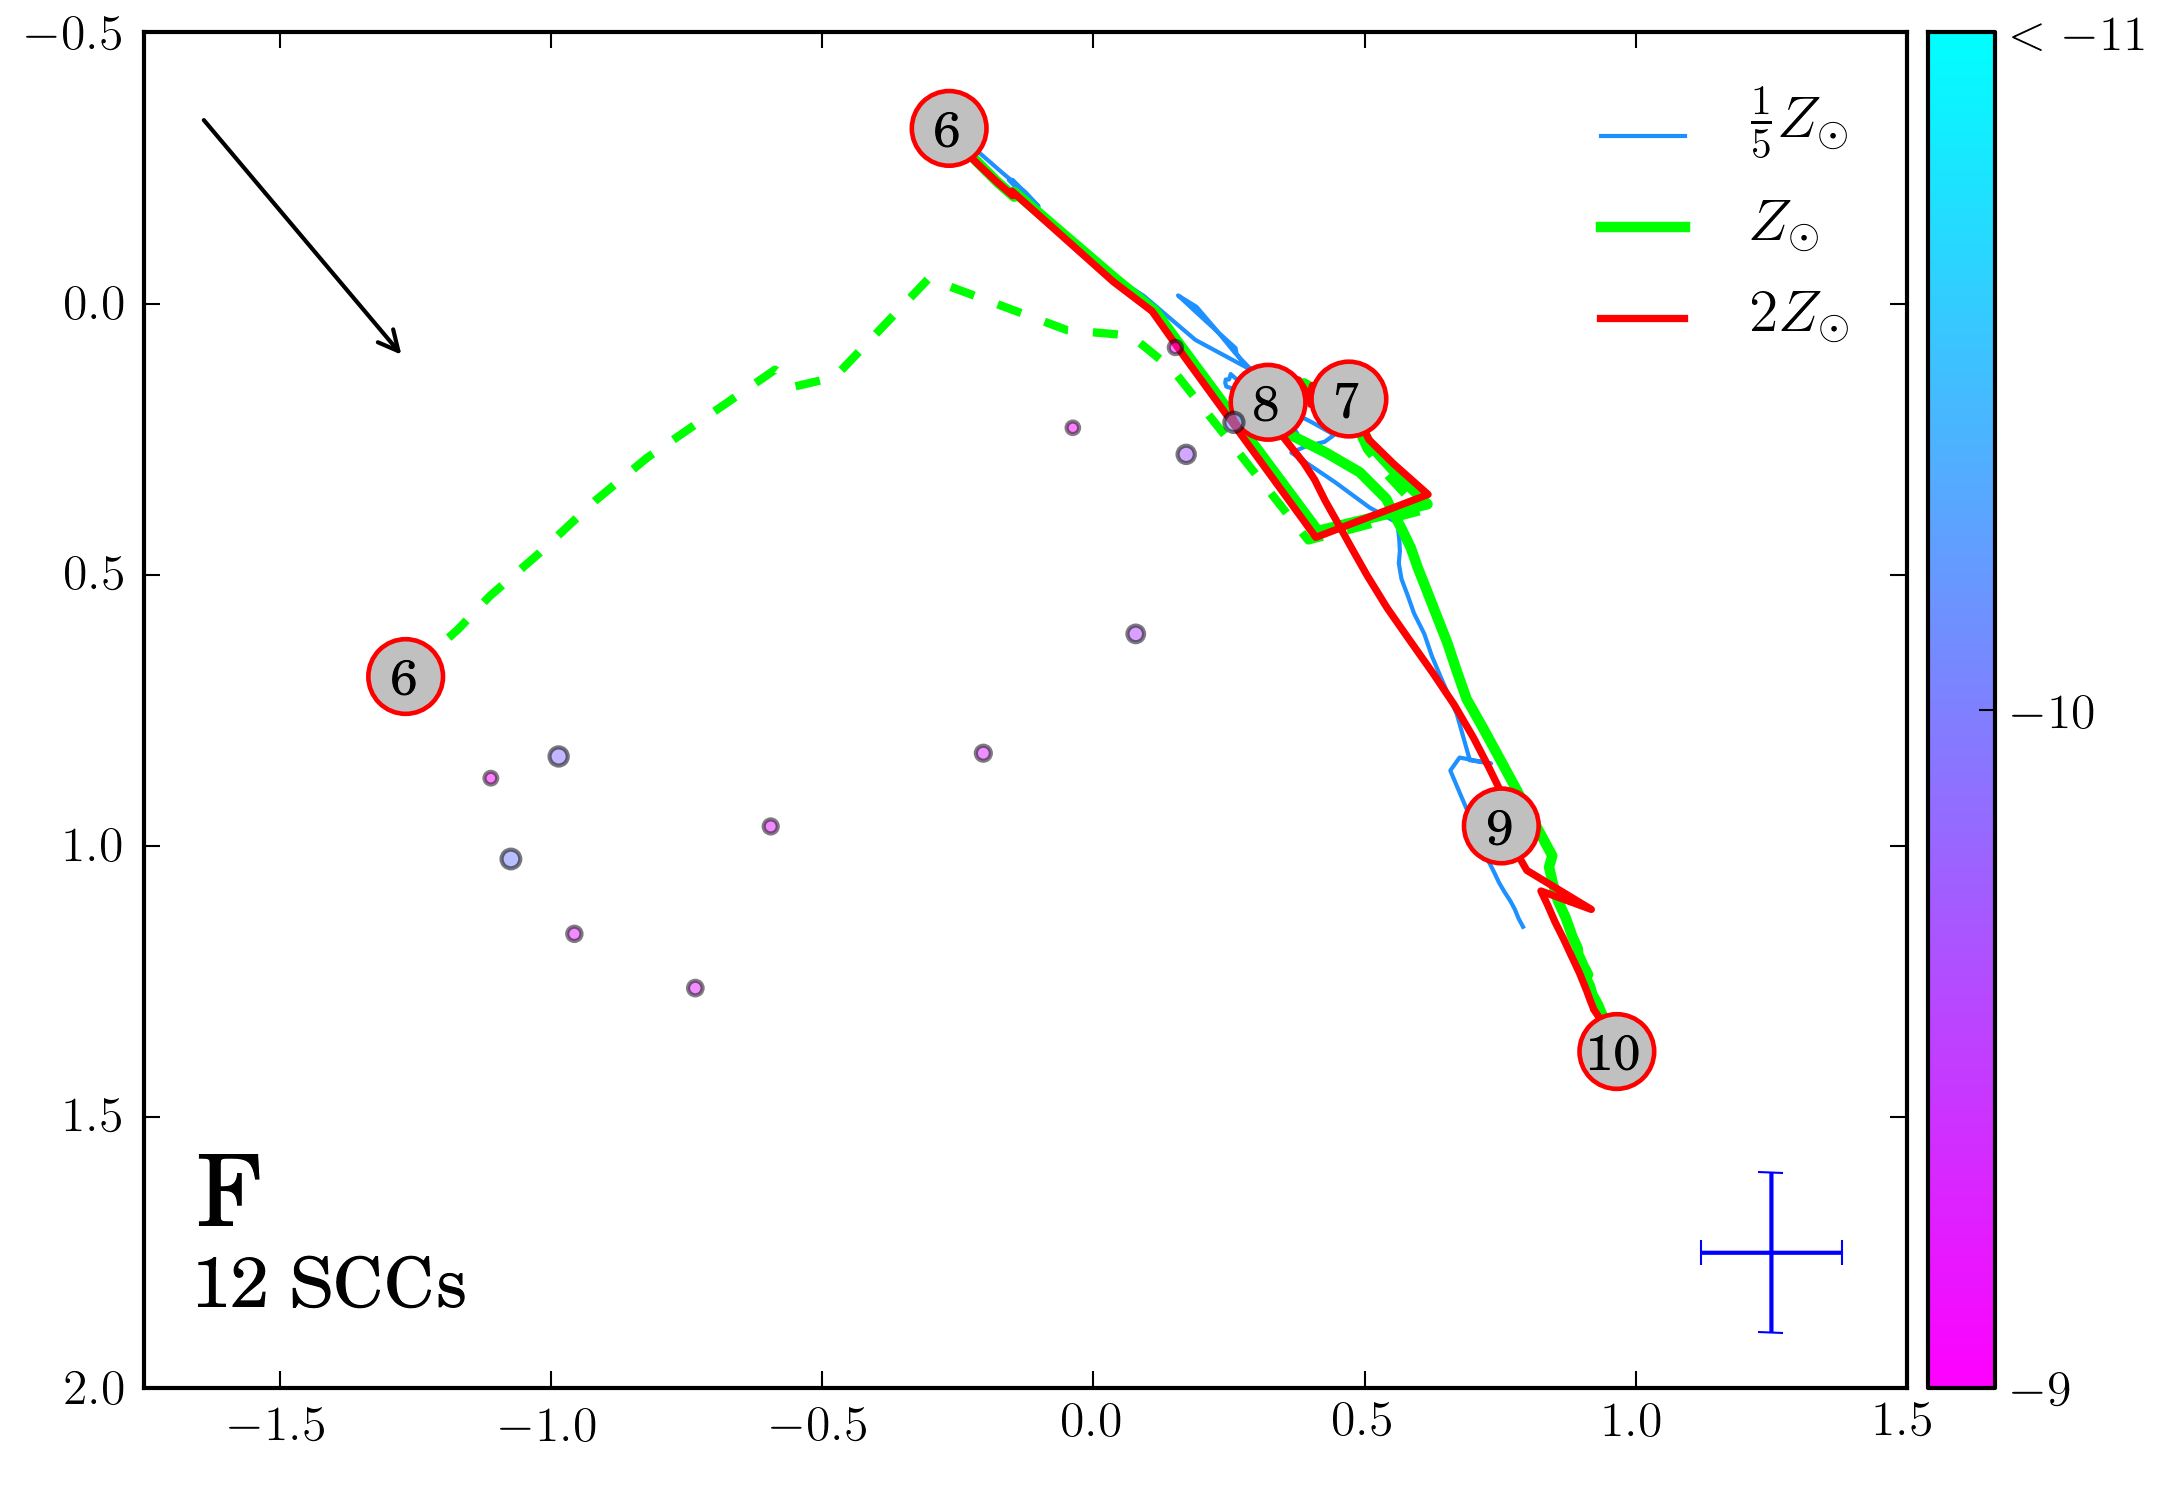
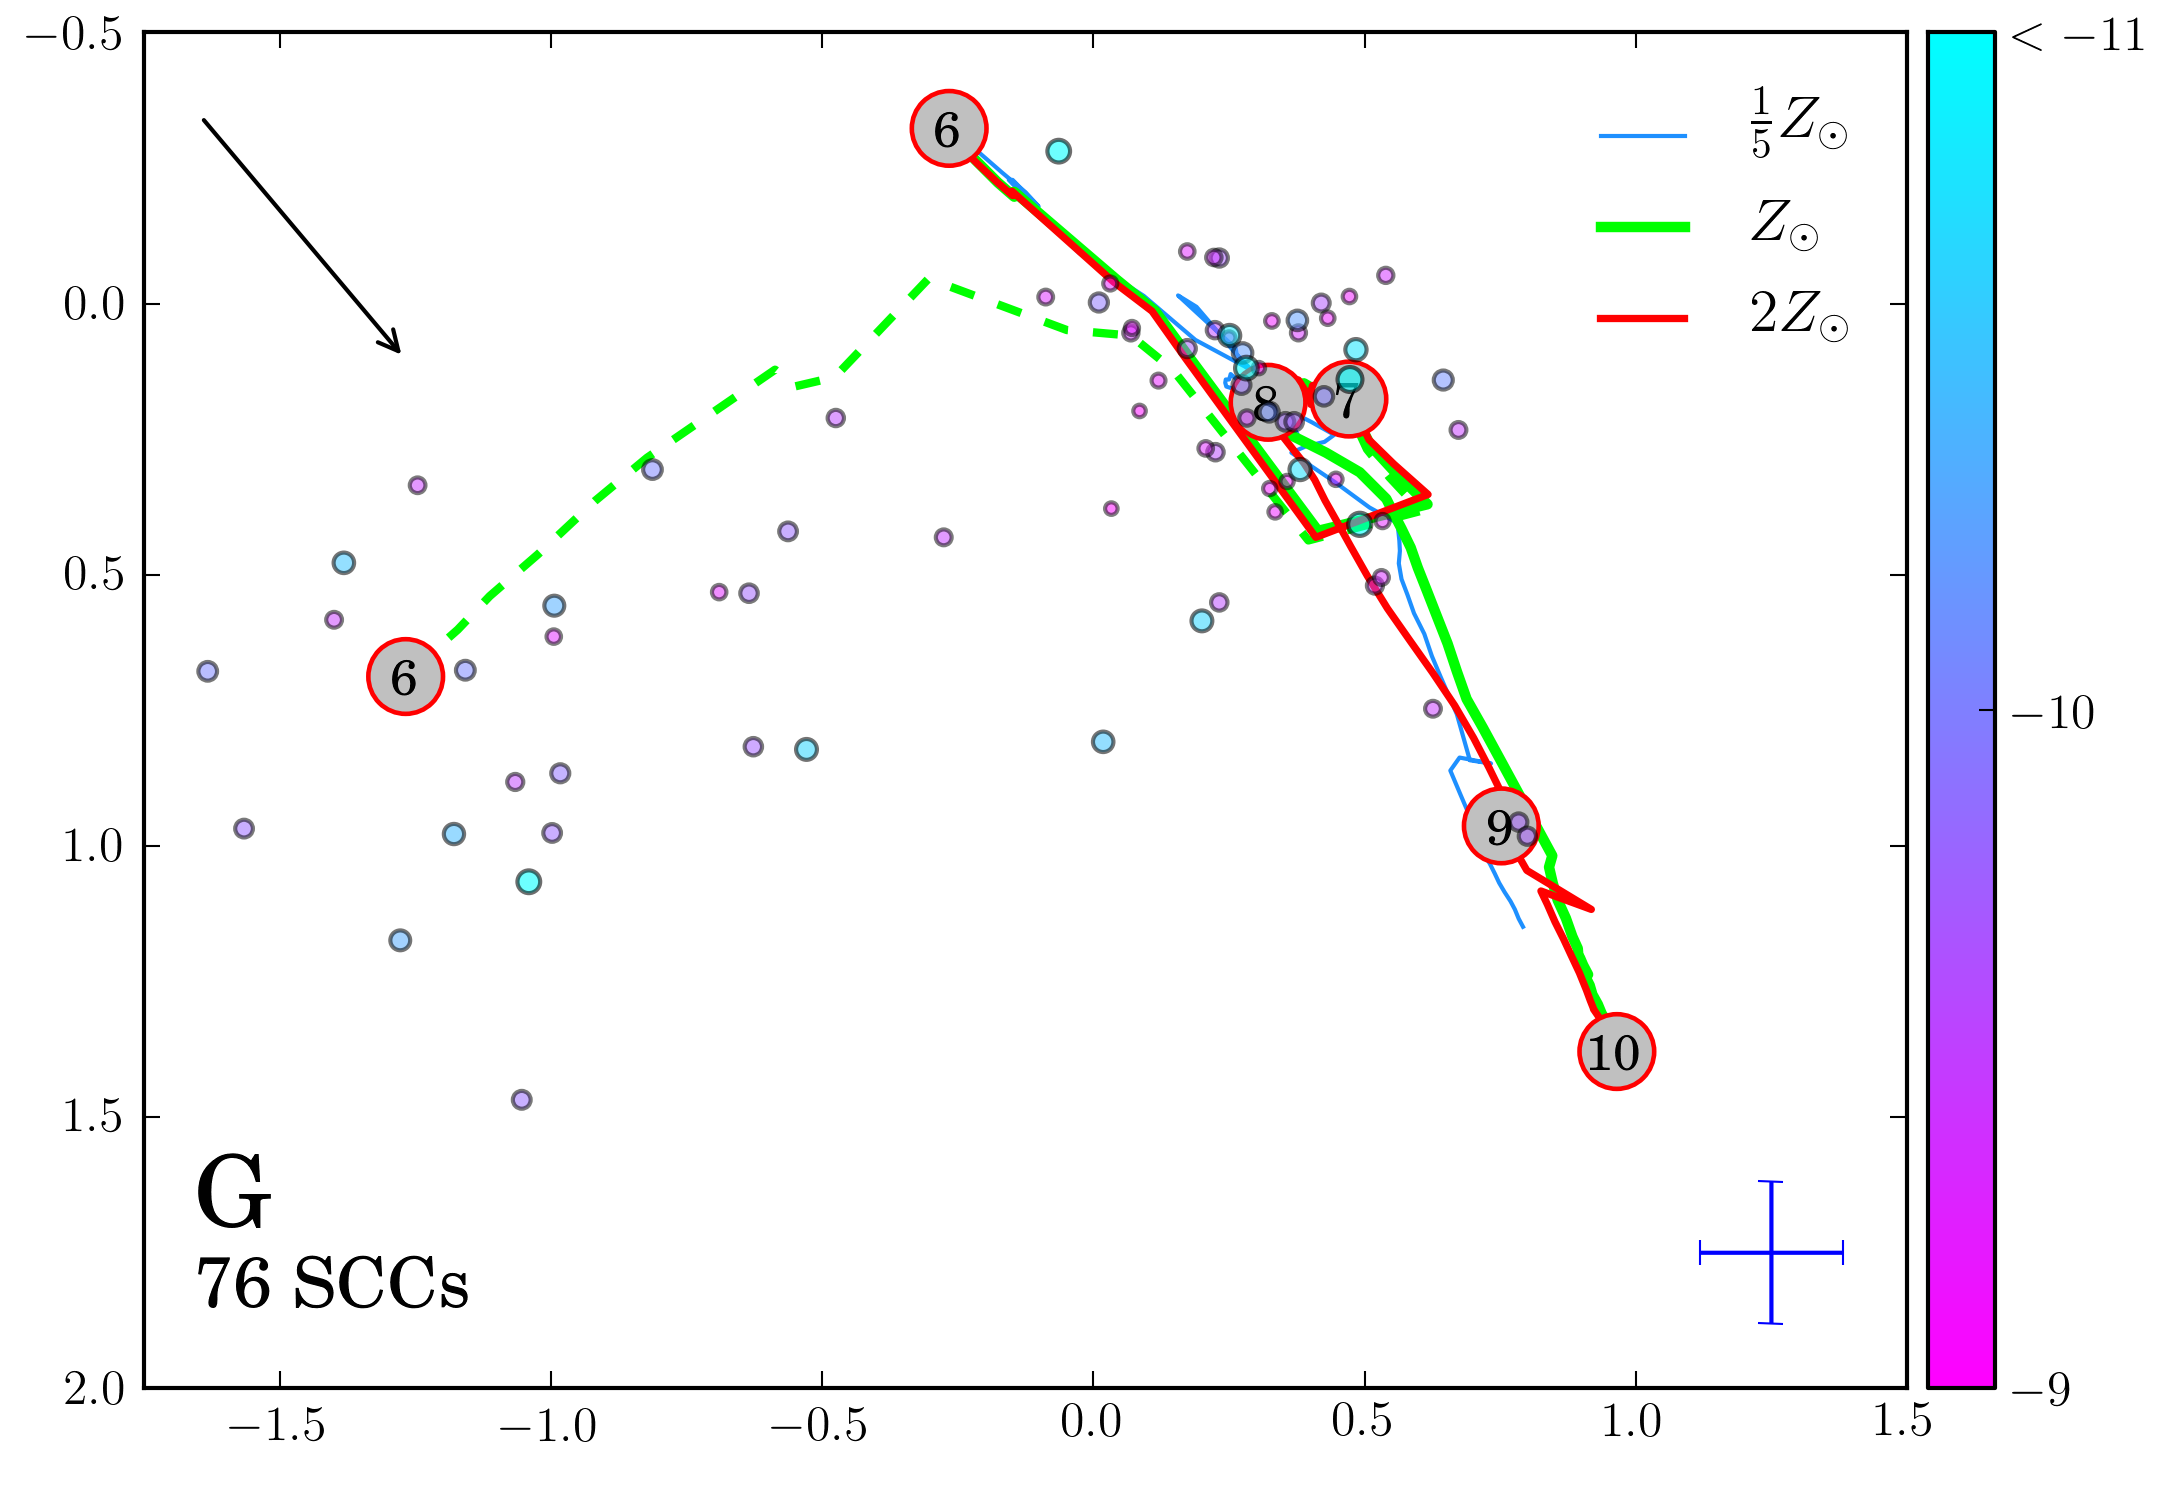
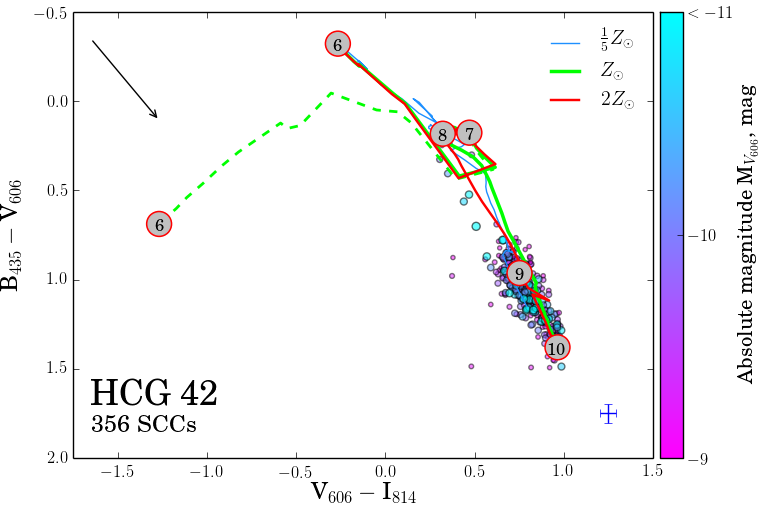
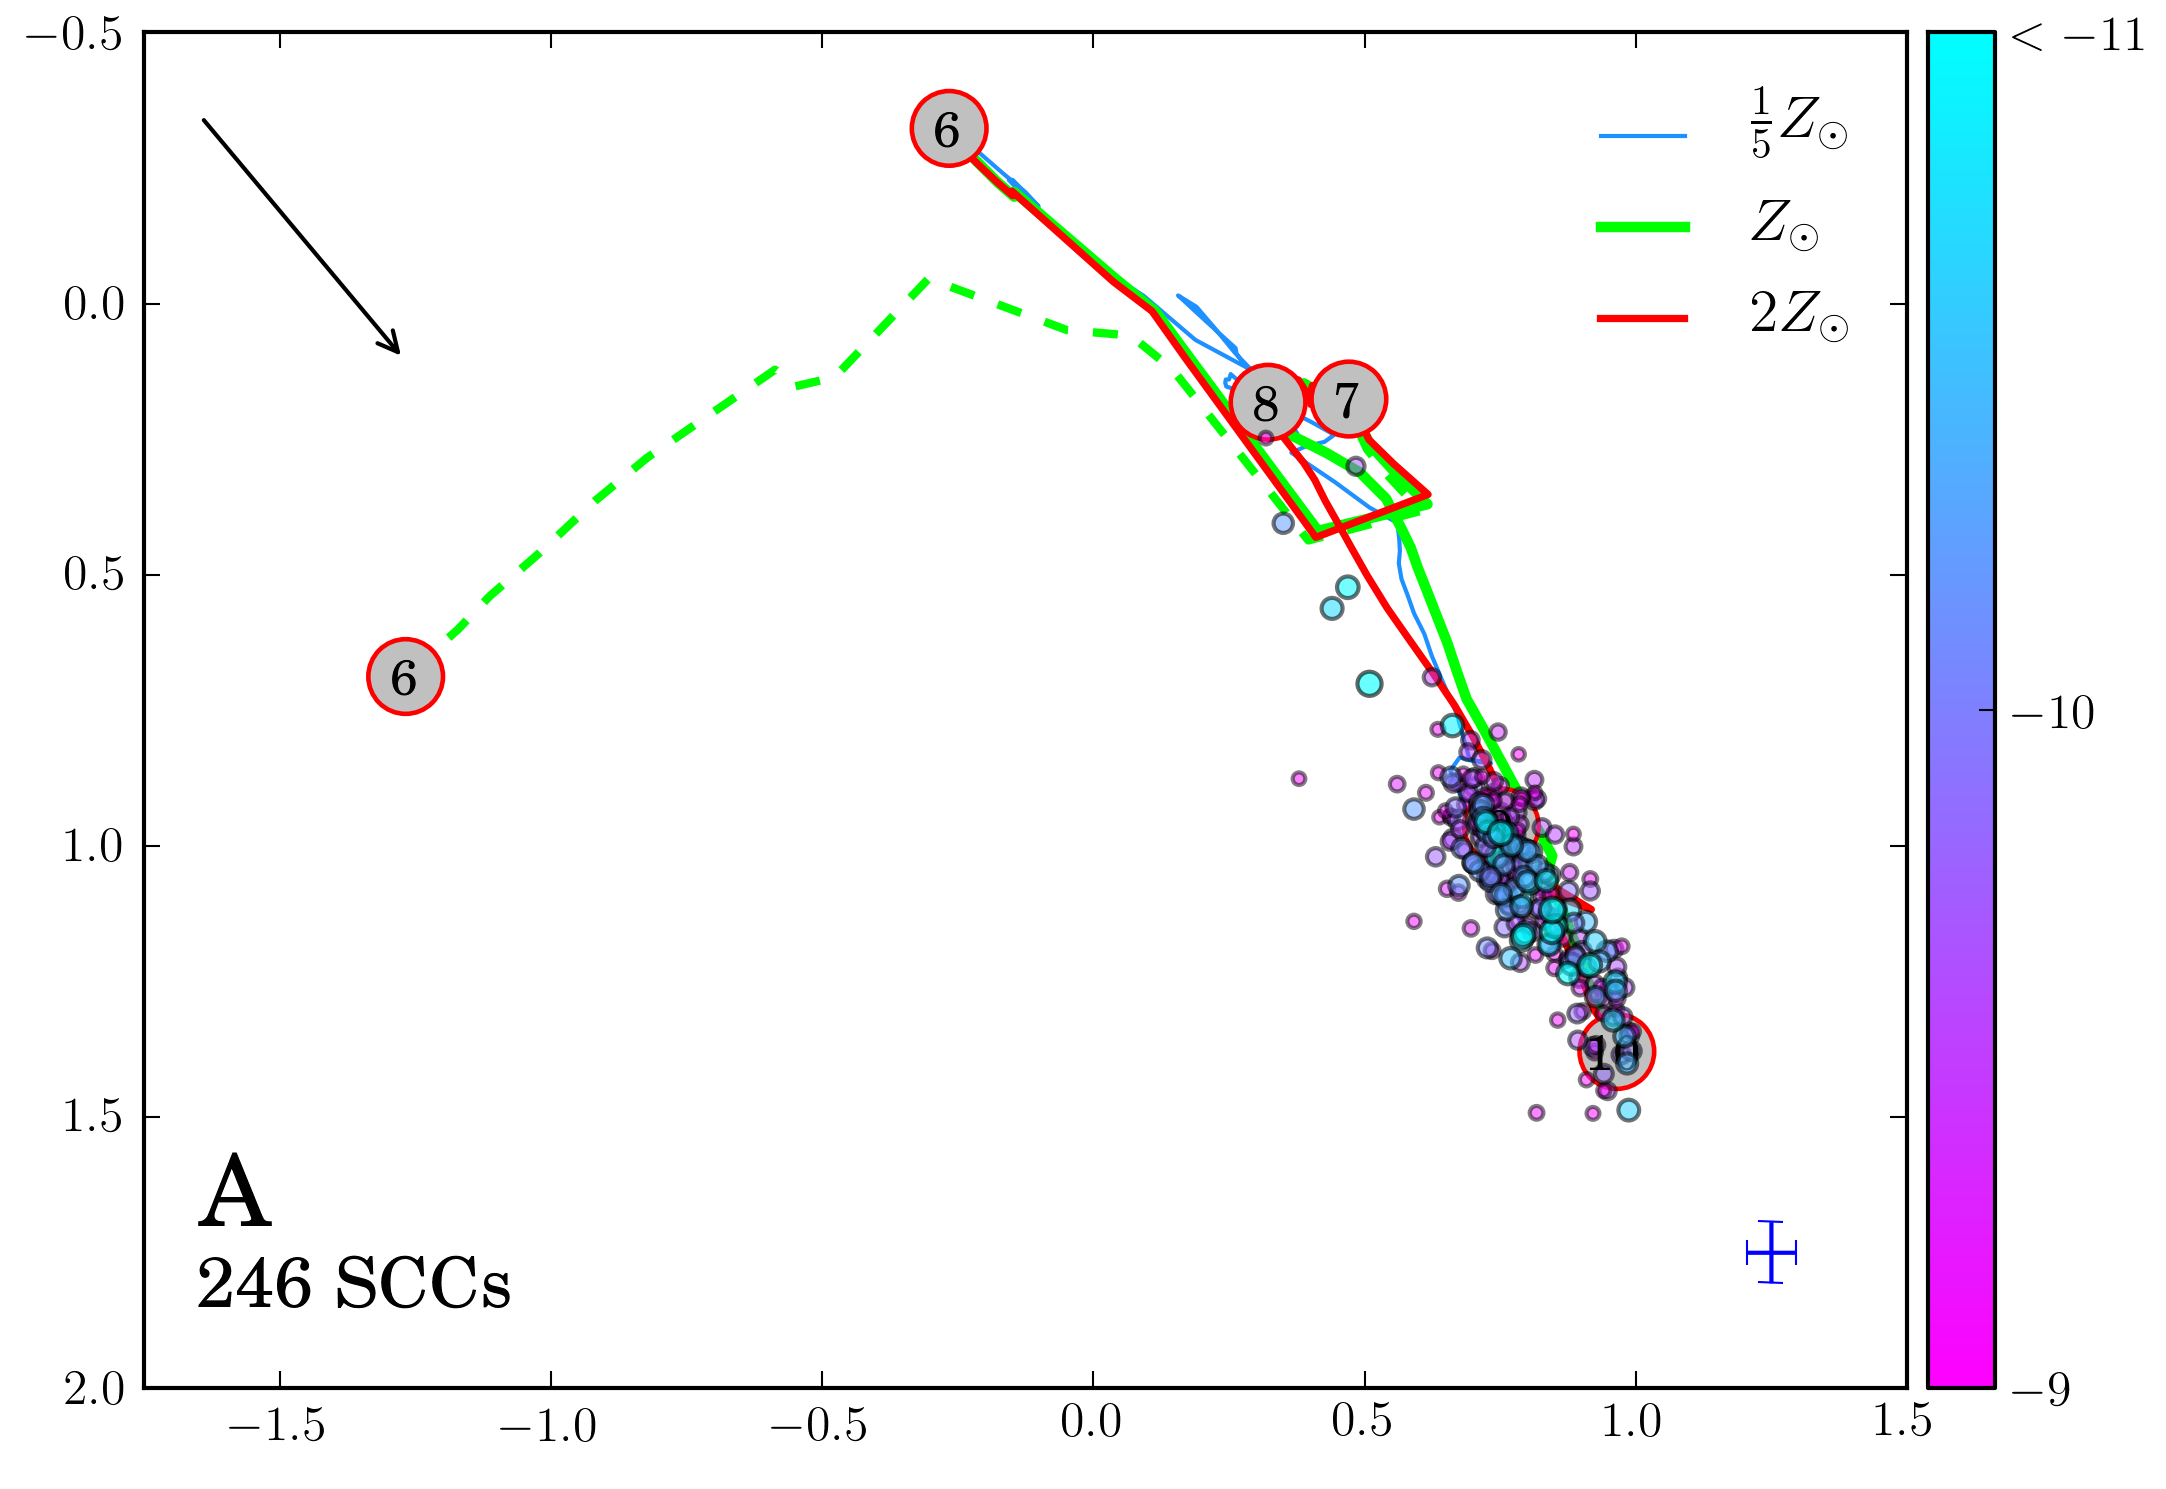
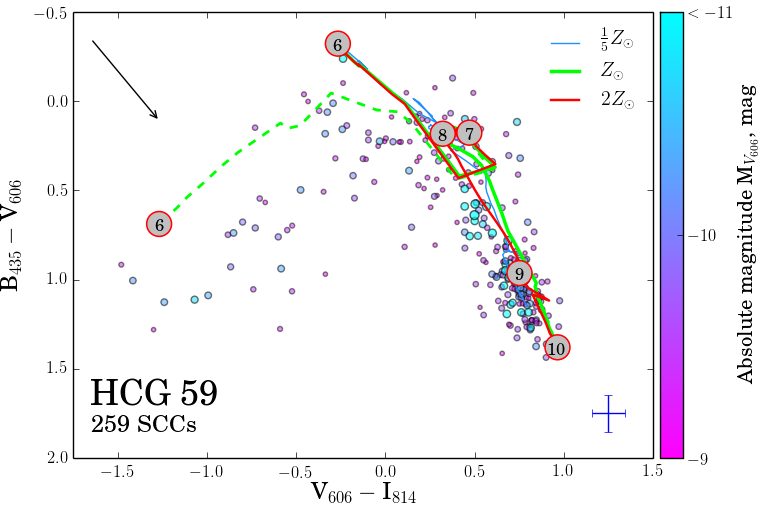
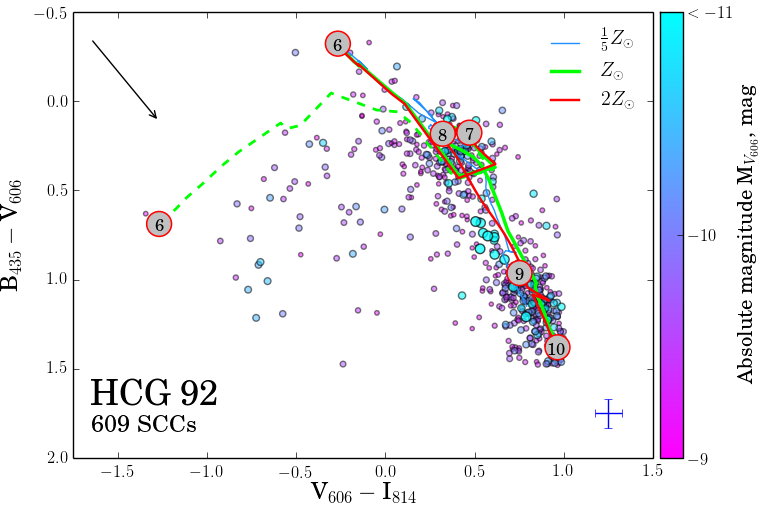
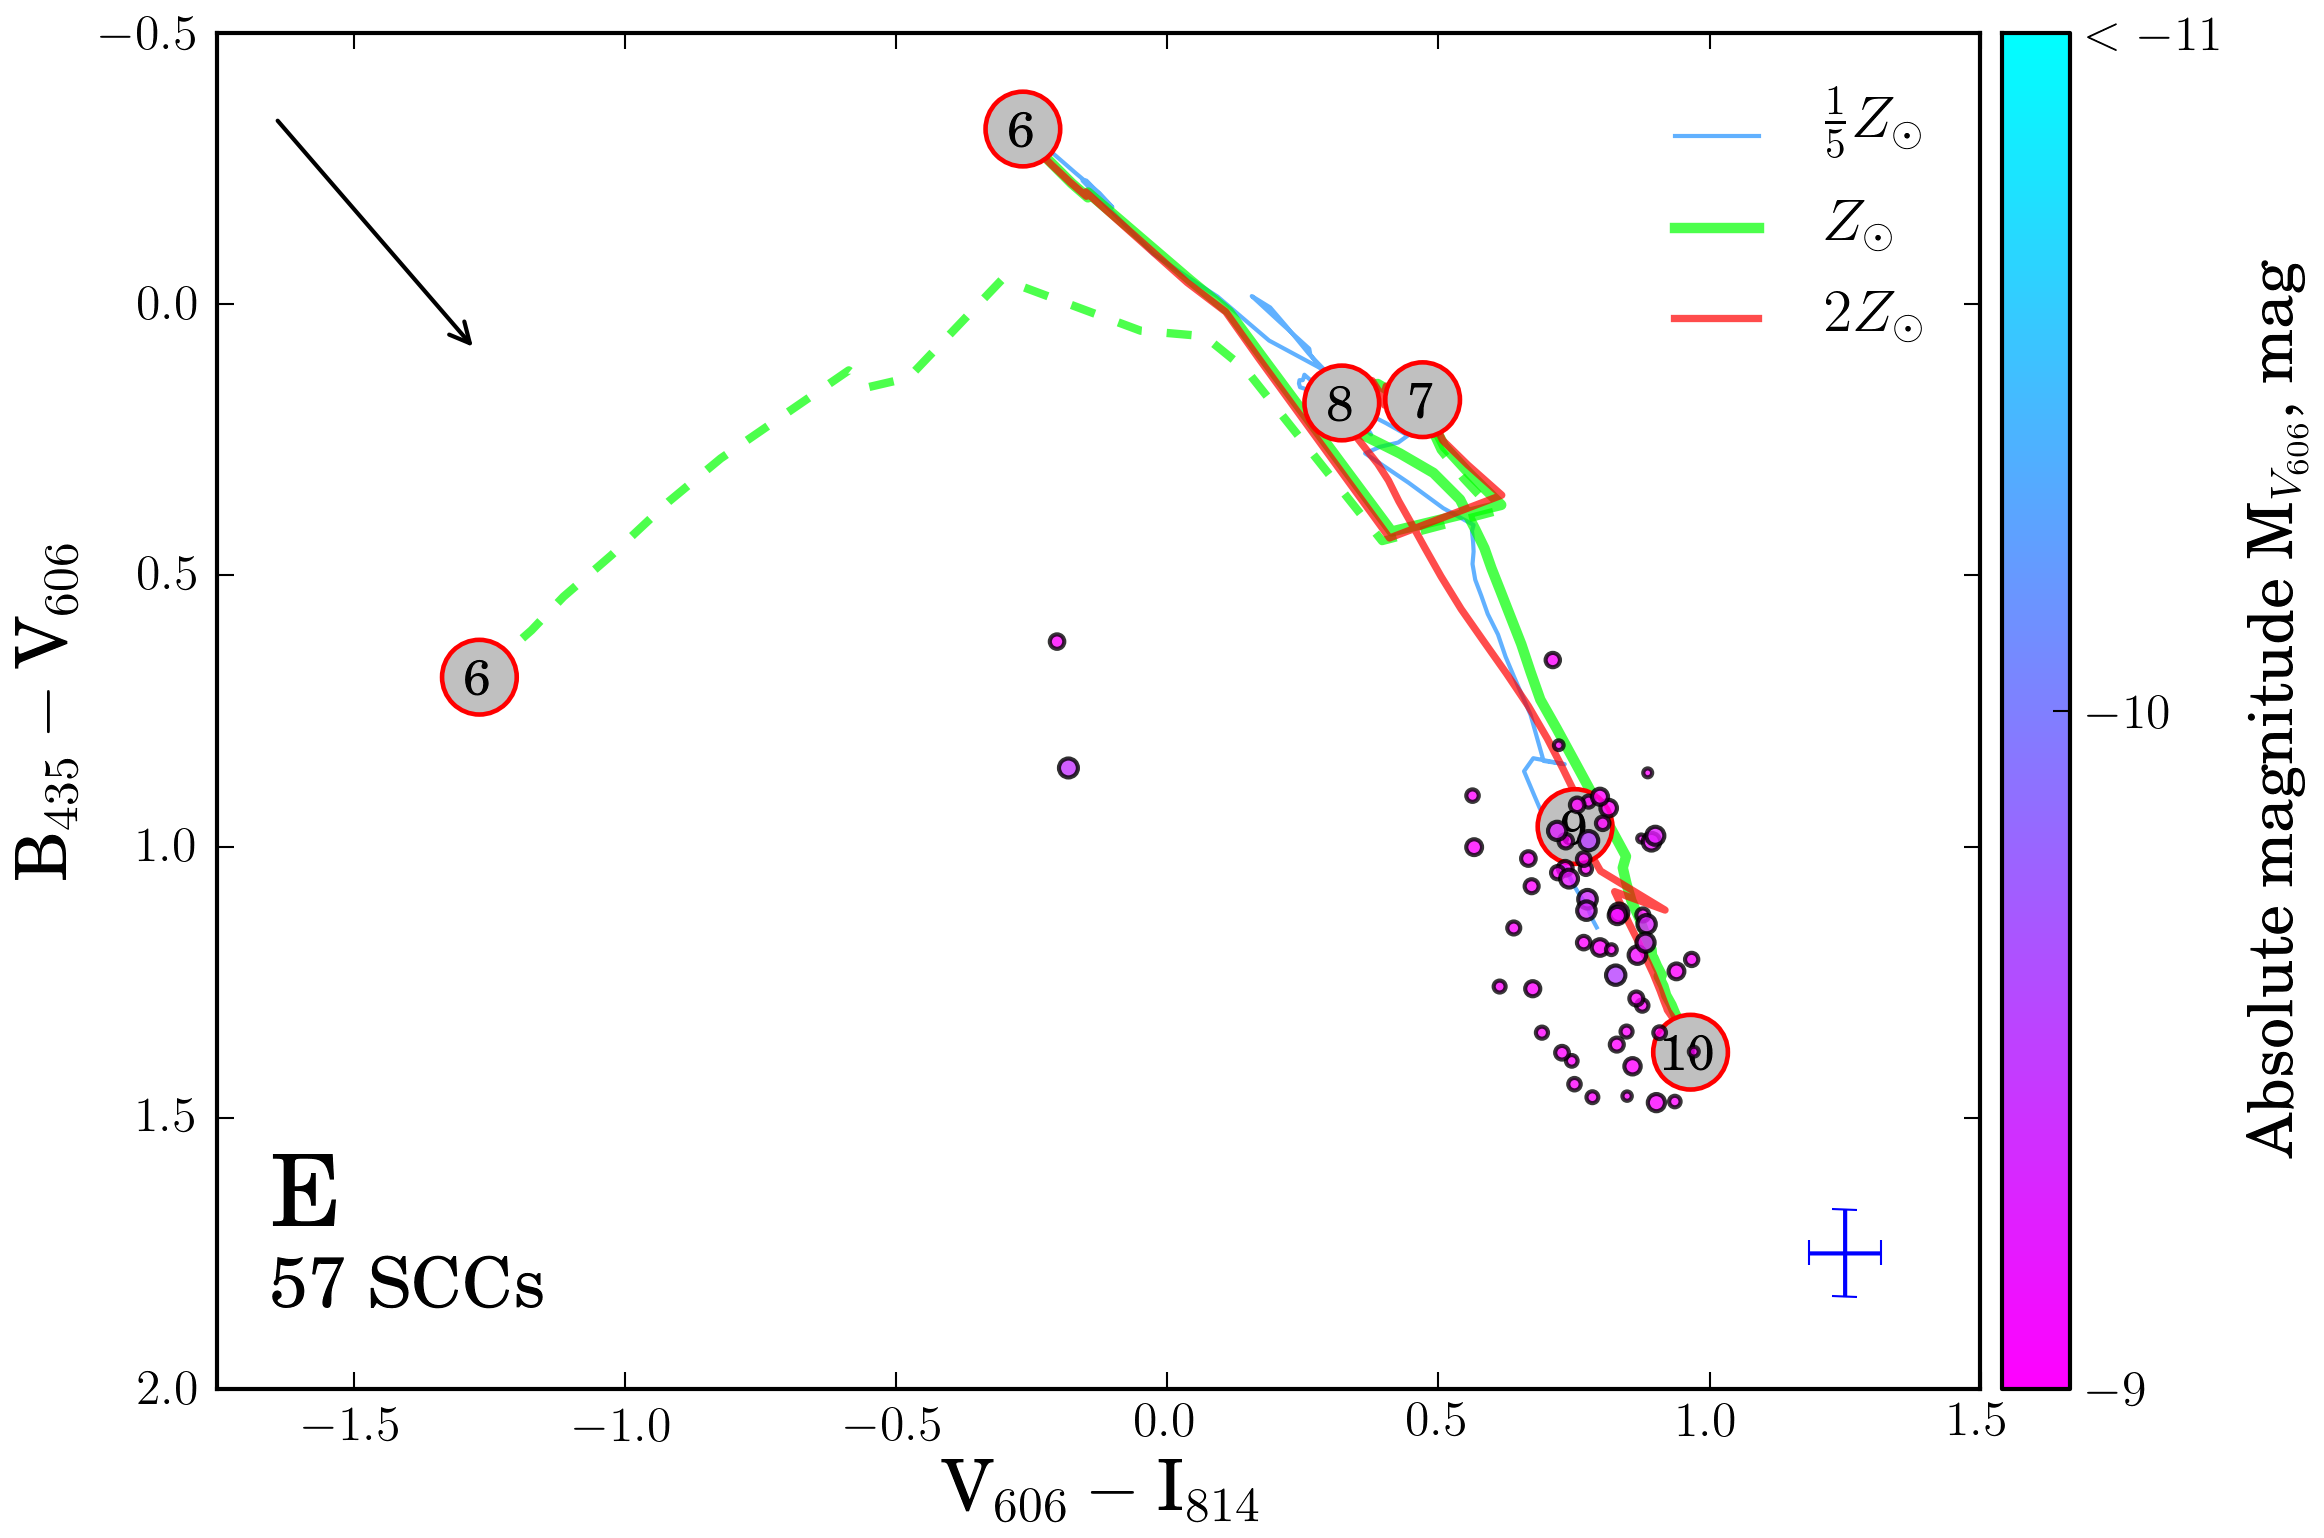
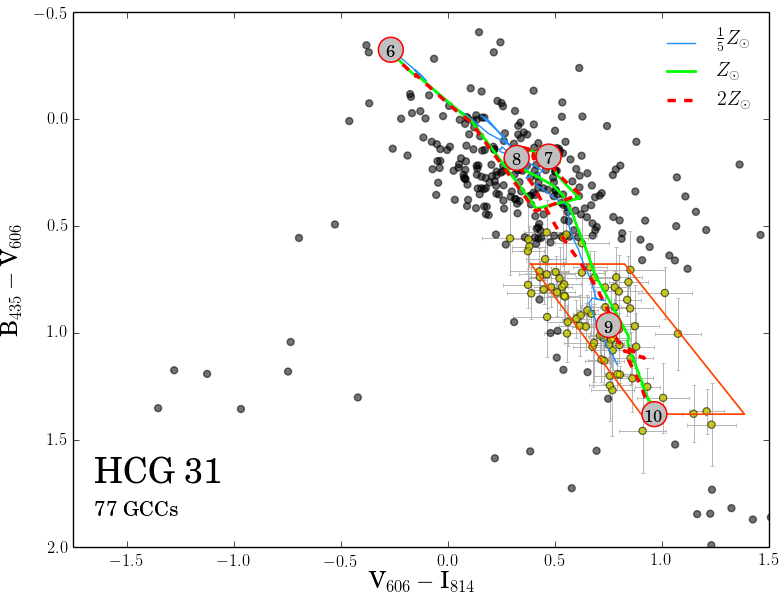
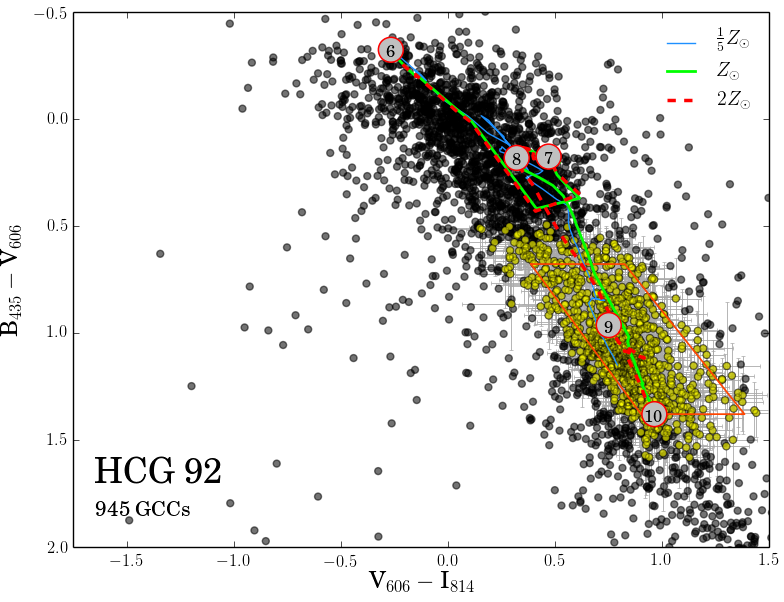
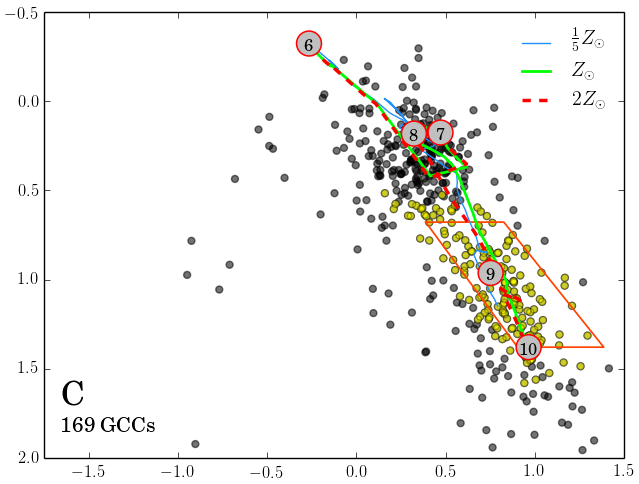
The second plot represents the number of “blue” star clusters (young SCs with ages Myr) in each galaxy as a function of star formation rate of the host galaxies, Fig. 5. The young SCs were selected by applying the colour cut of . This generous colour cut enables us to keep the maximum number of young clusters, even those that may have significant reddening, avoiding both the evolutionary track loop around ages of 10 and 100 Myr and the old globular cluster region (see Fig. 9 for reference). The numbers of young SCs behave in a predictable manner as well: the galaxies with higher SFR have a larger number of young SCs. Notably, the large irregular 59d has a very high number of young SCs given its mass and SFR.
In the subsections below, we discuss the star and globular cluster populations of each group individually.
4.1 HCG 07
4.1.1 Star Cluster Candidates
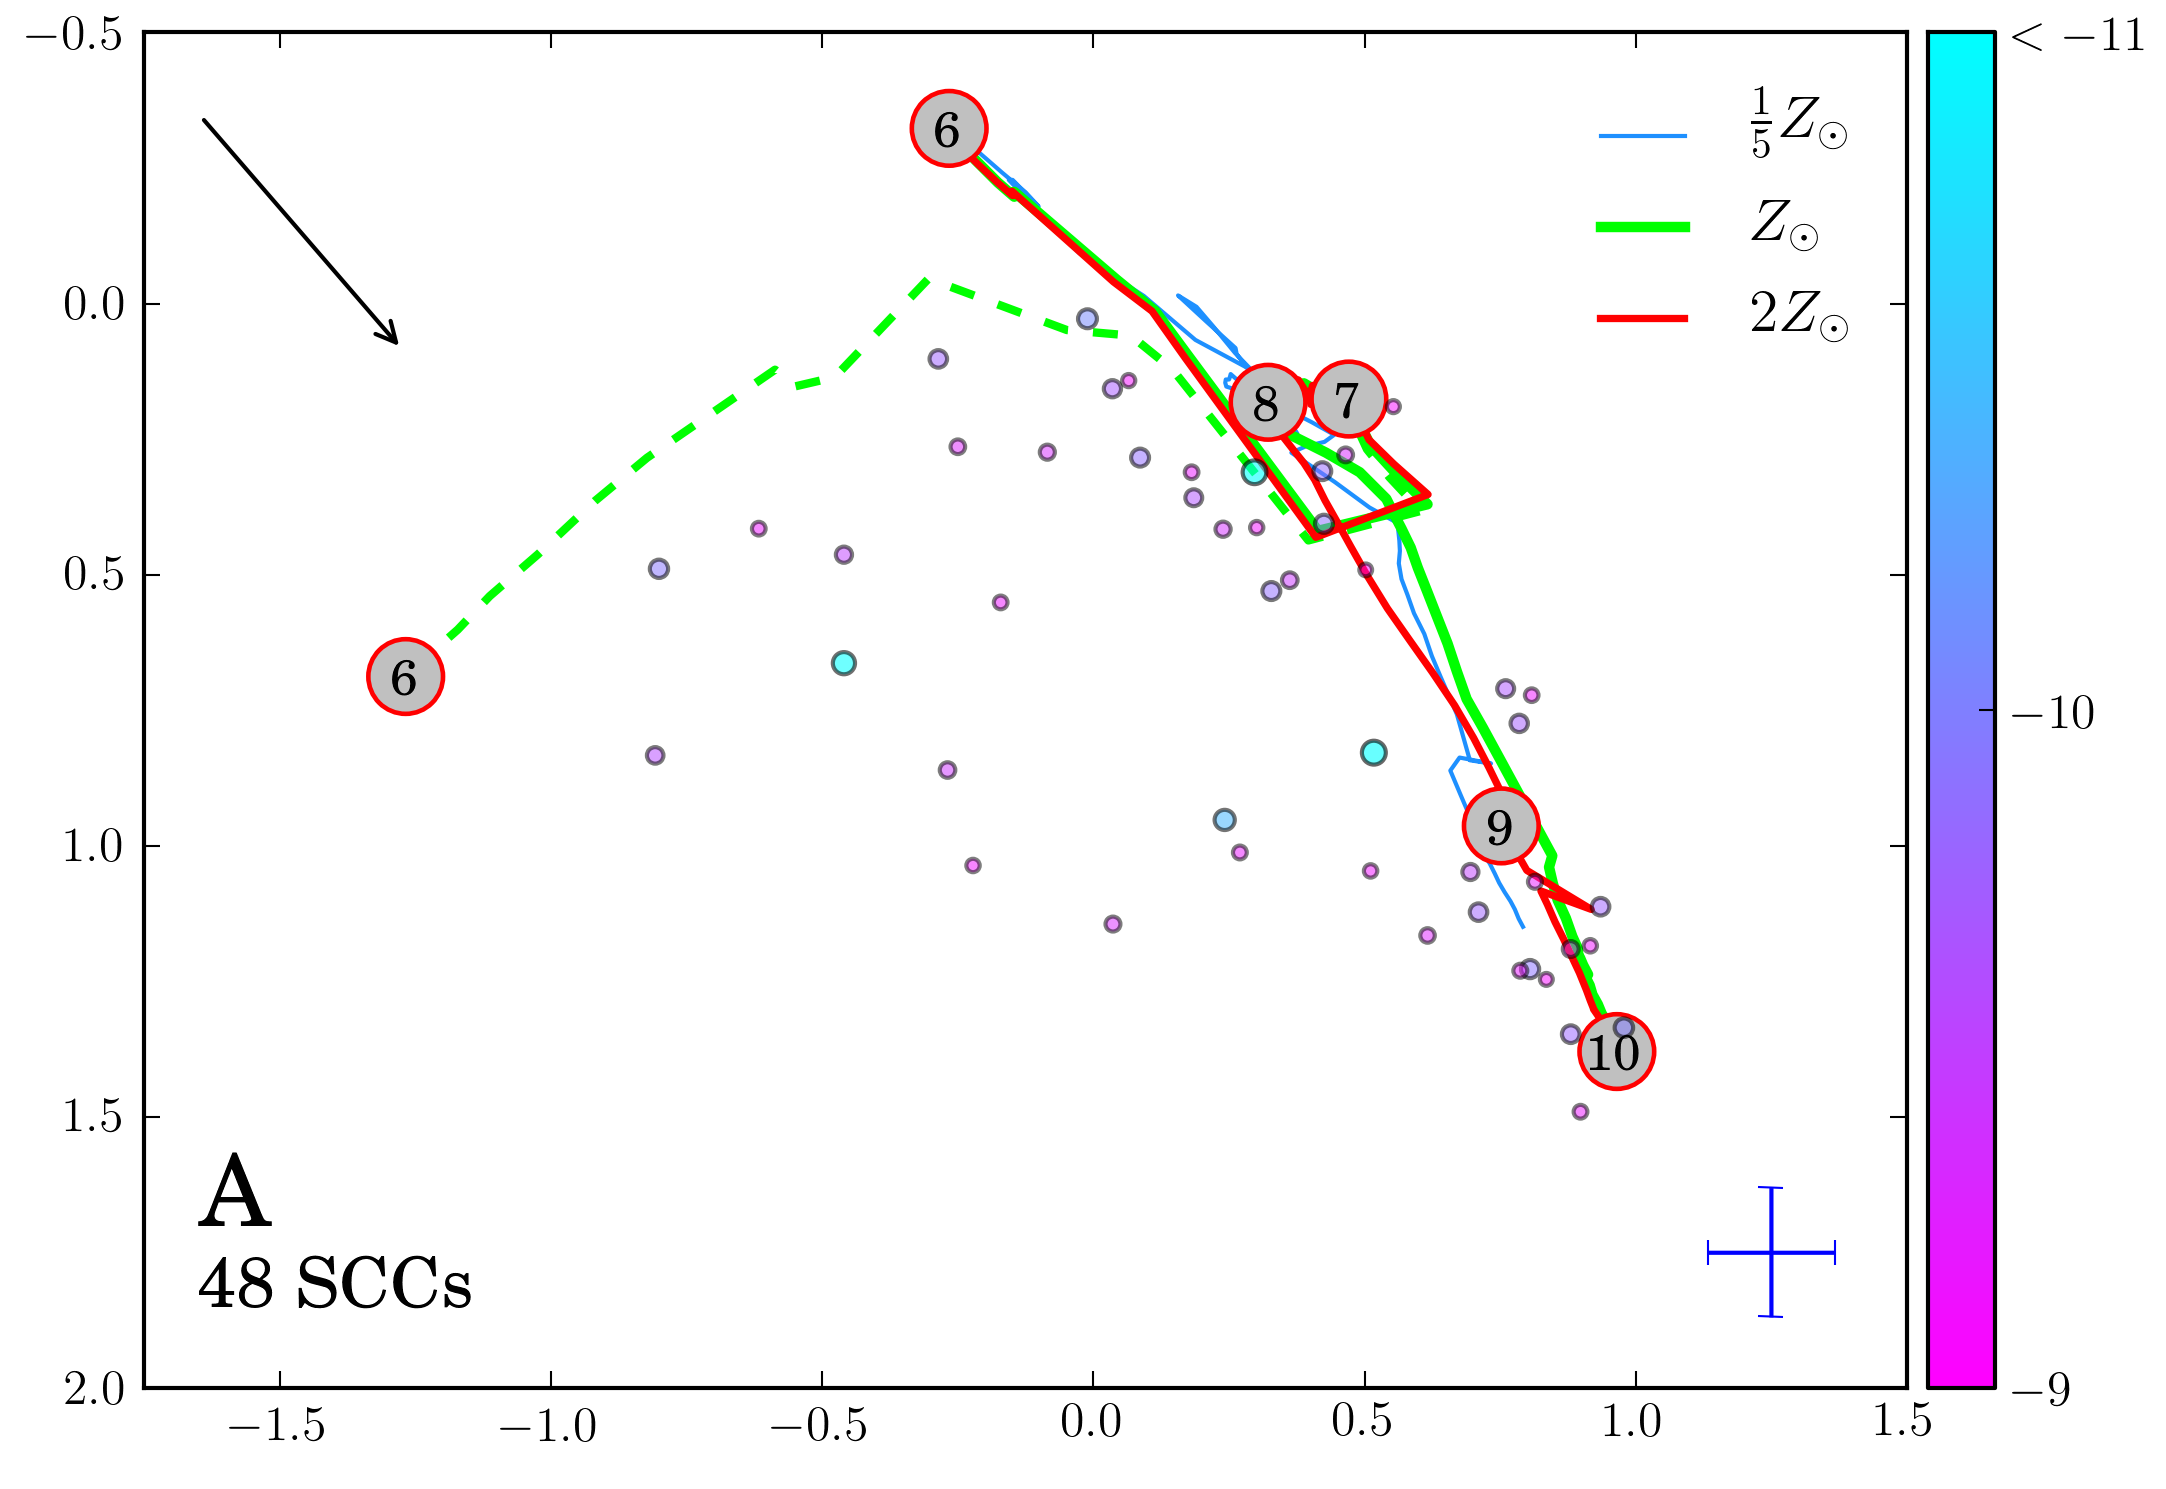
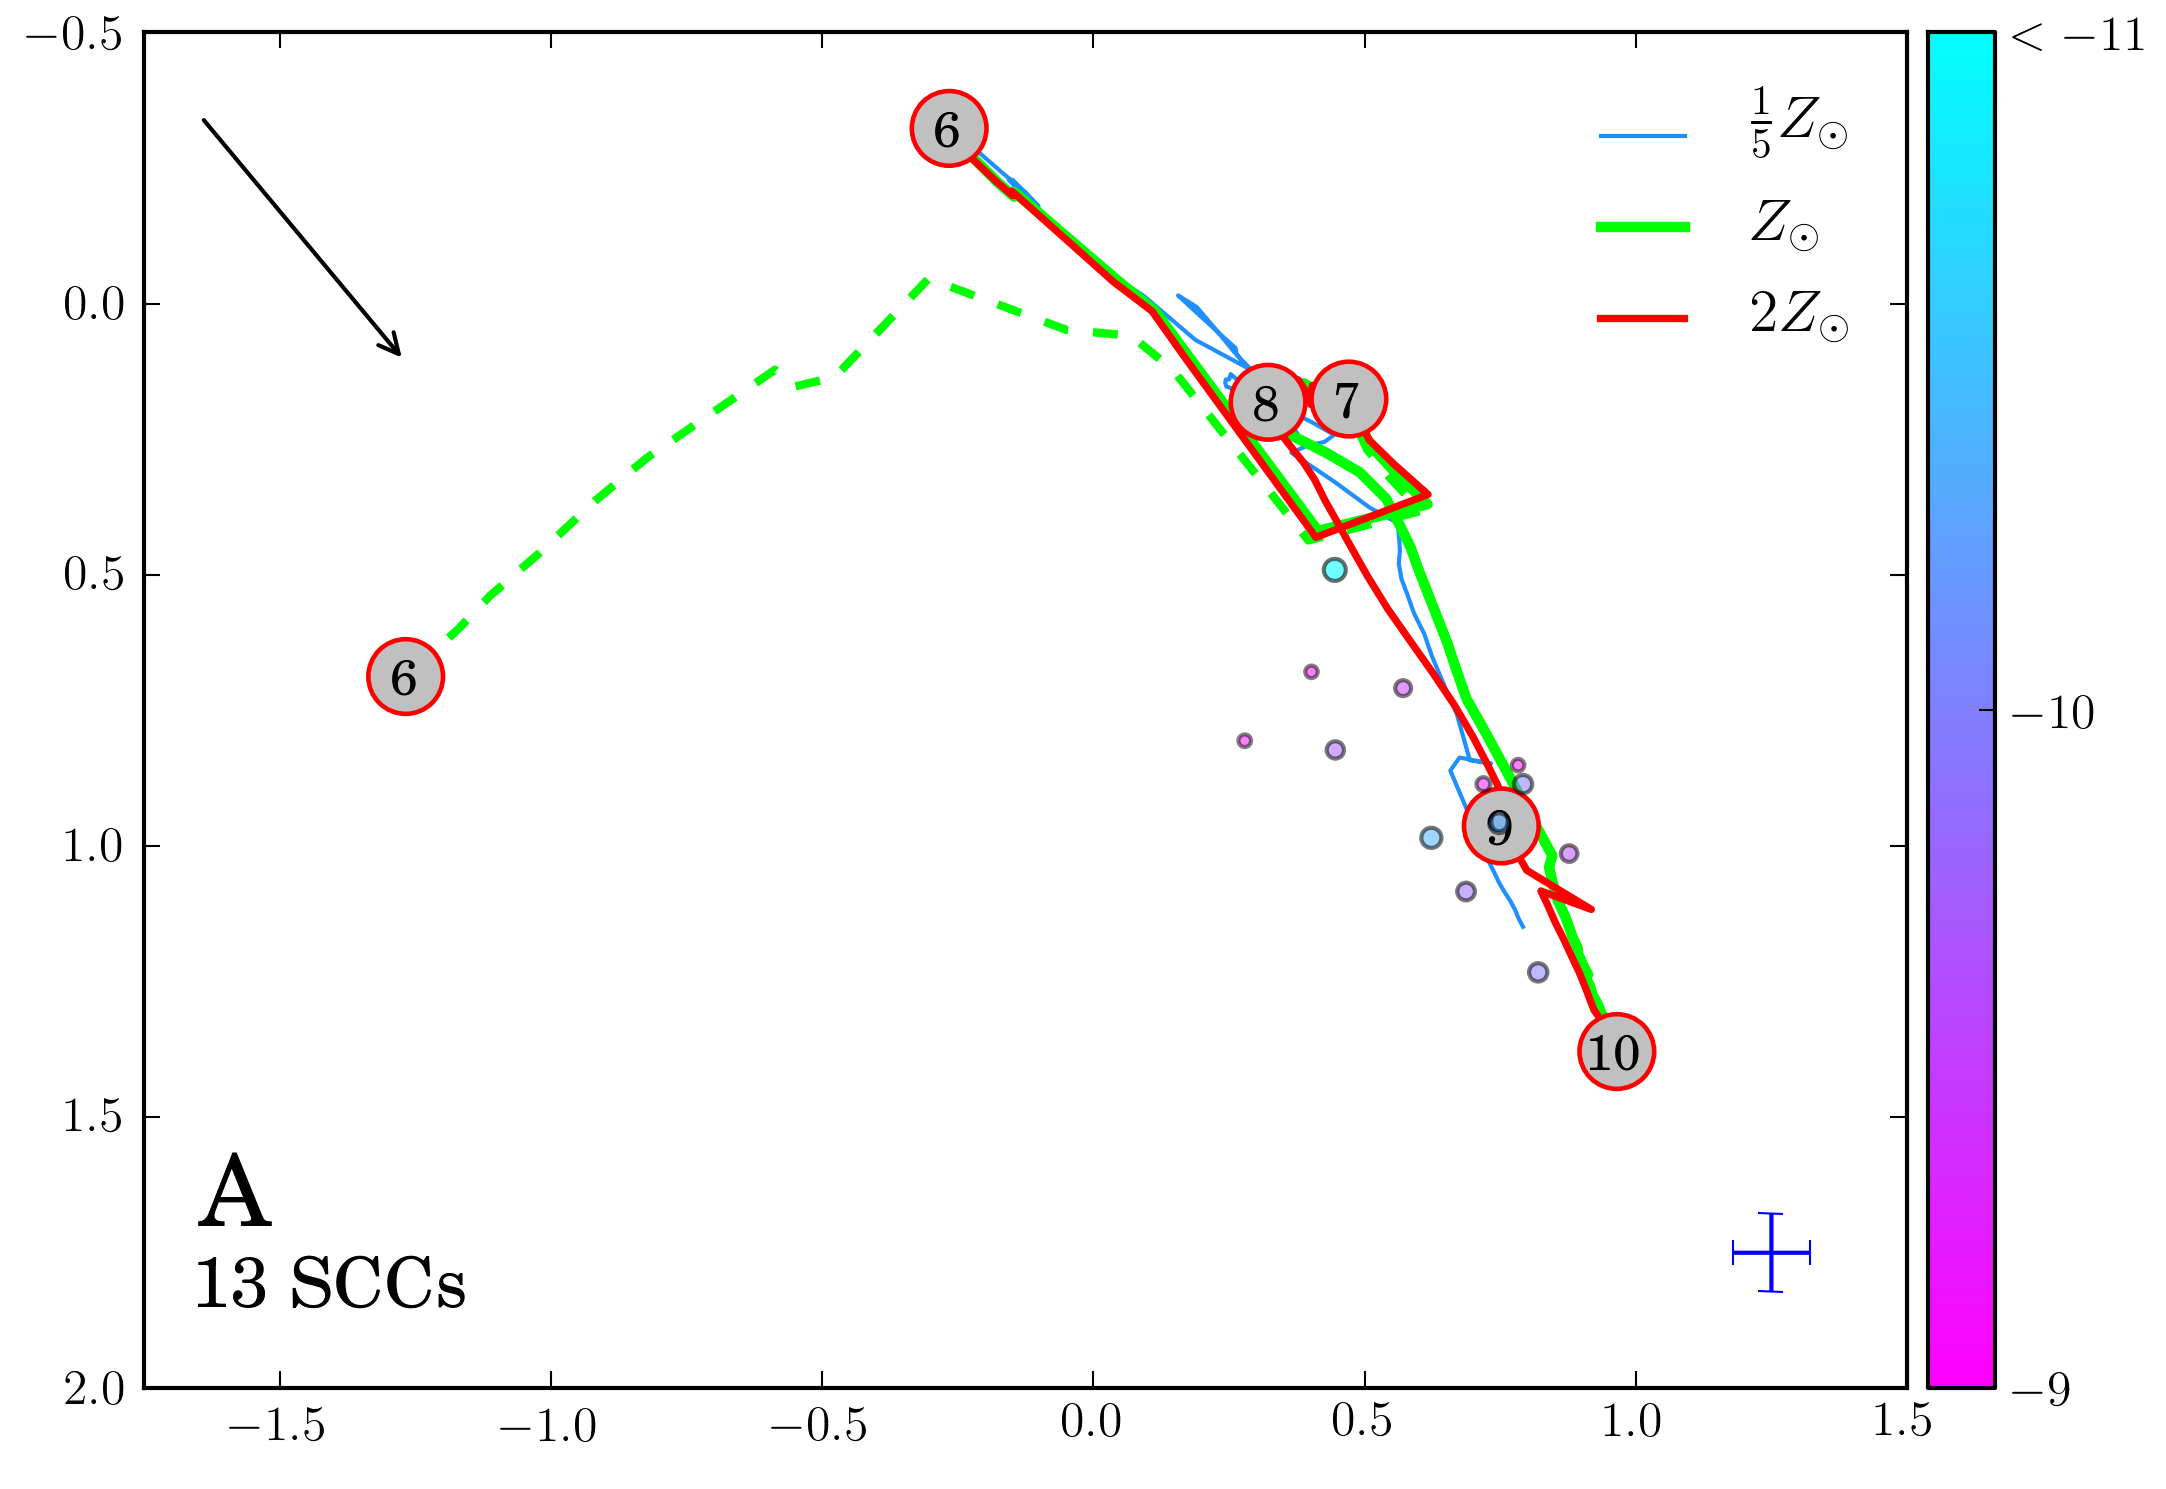
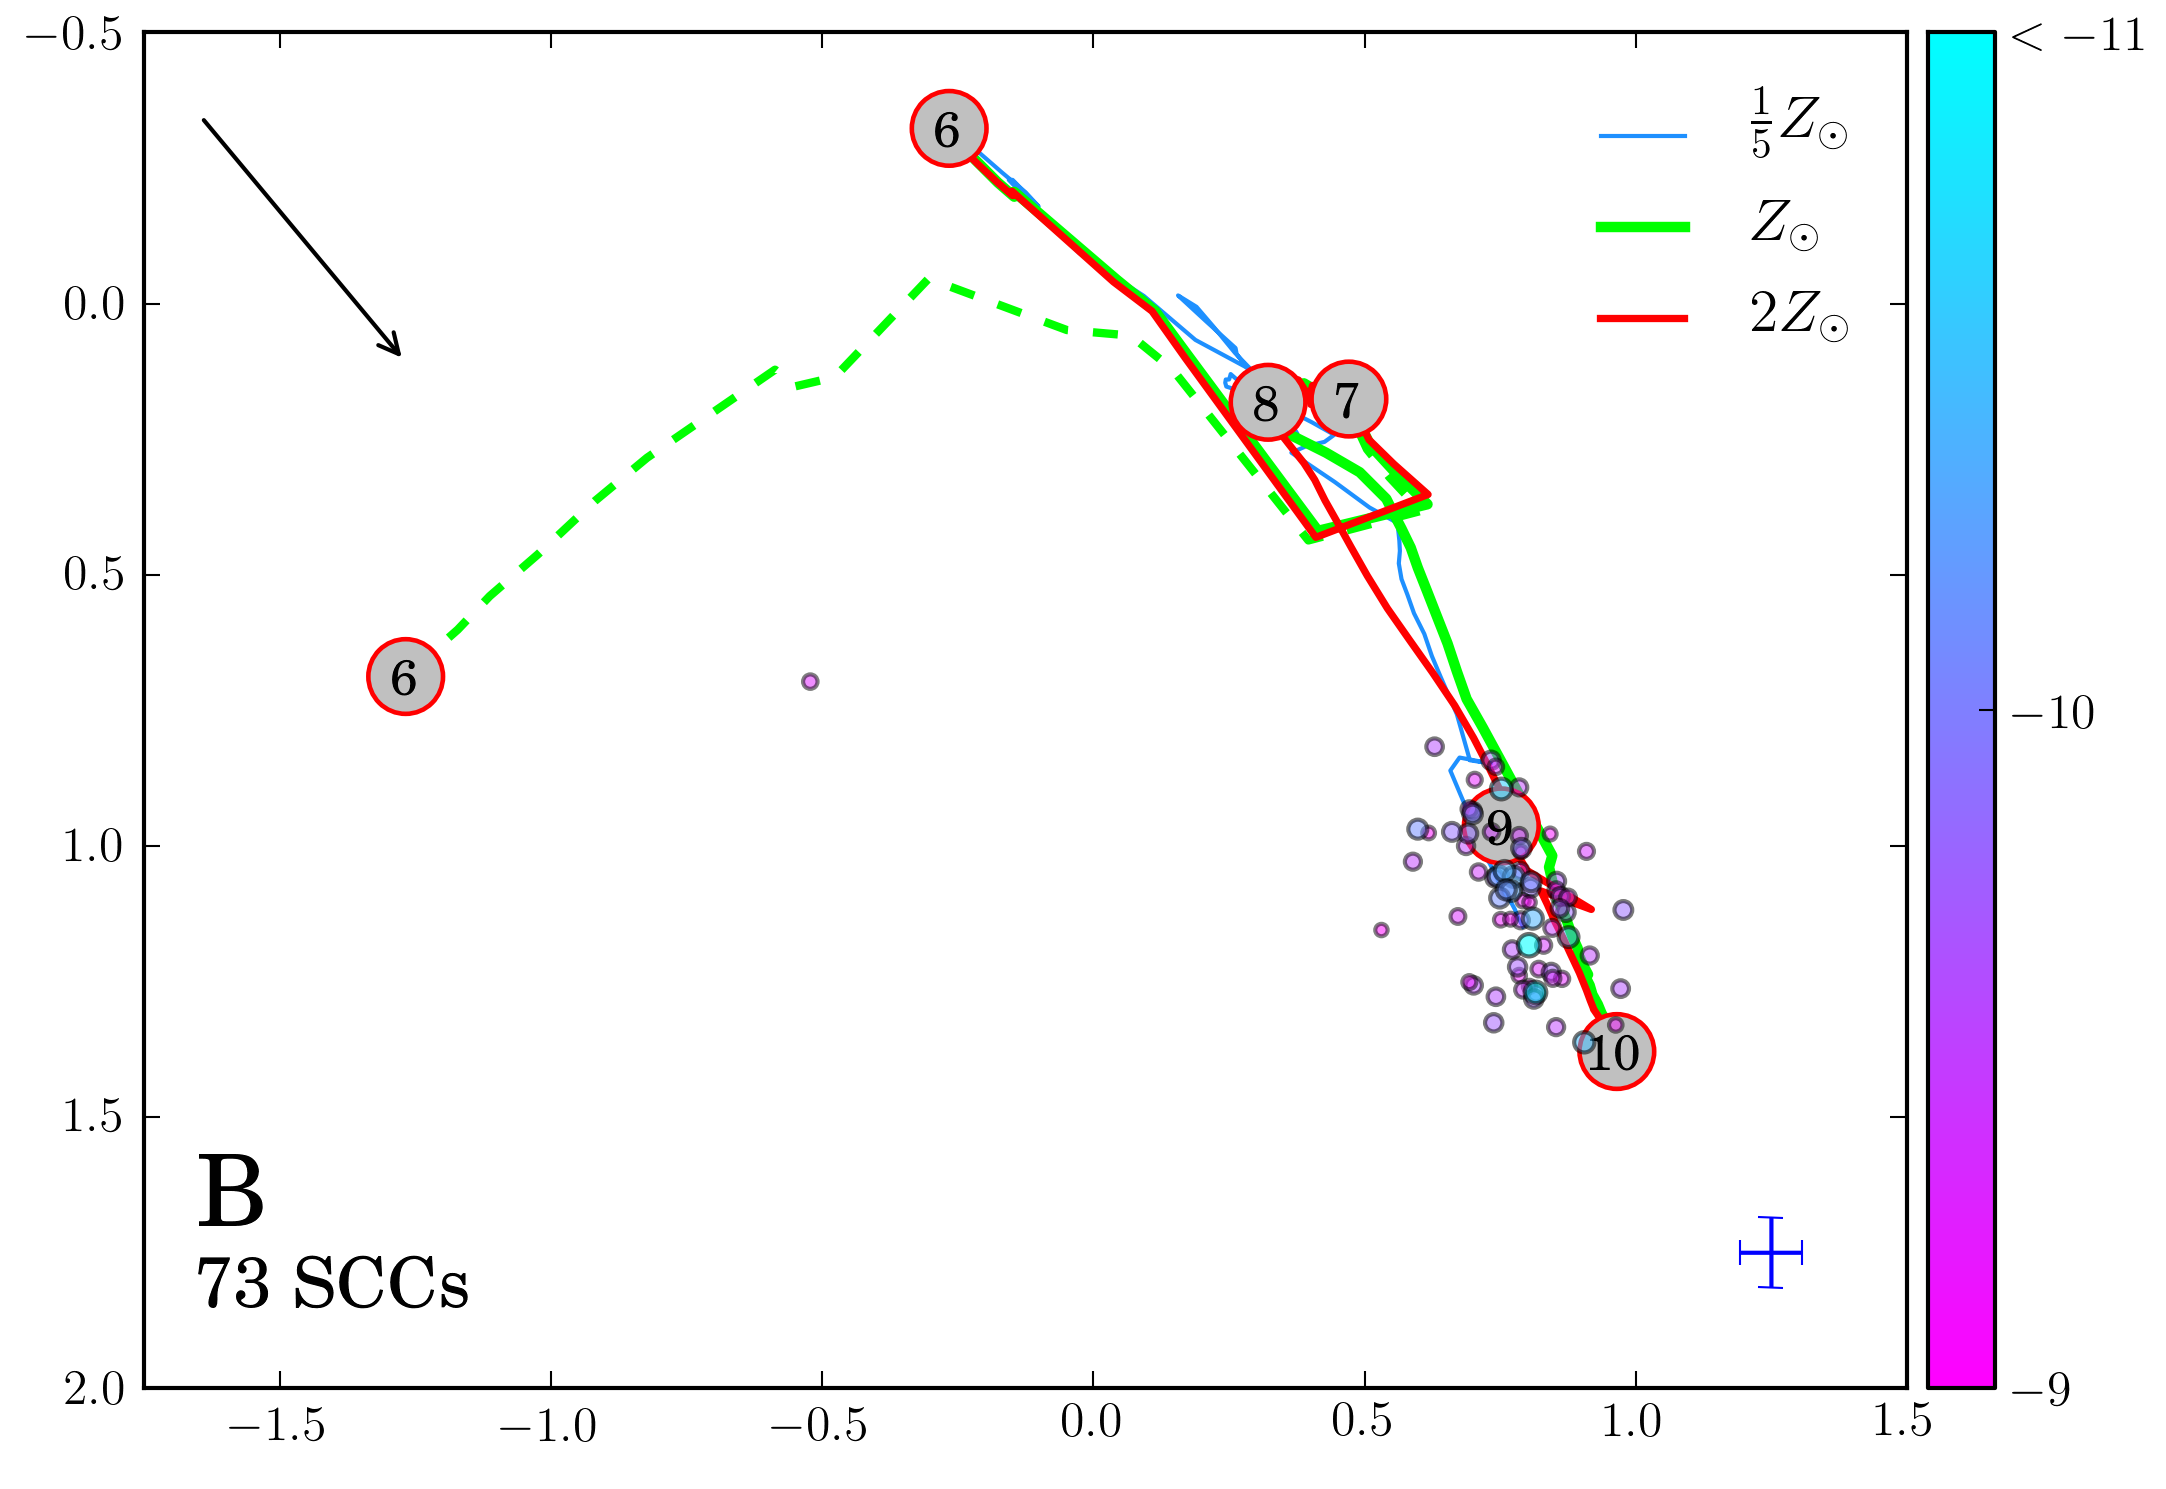
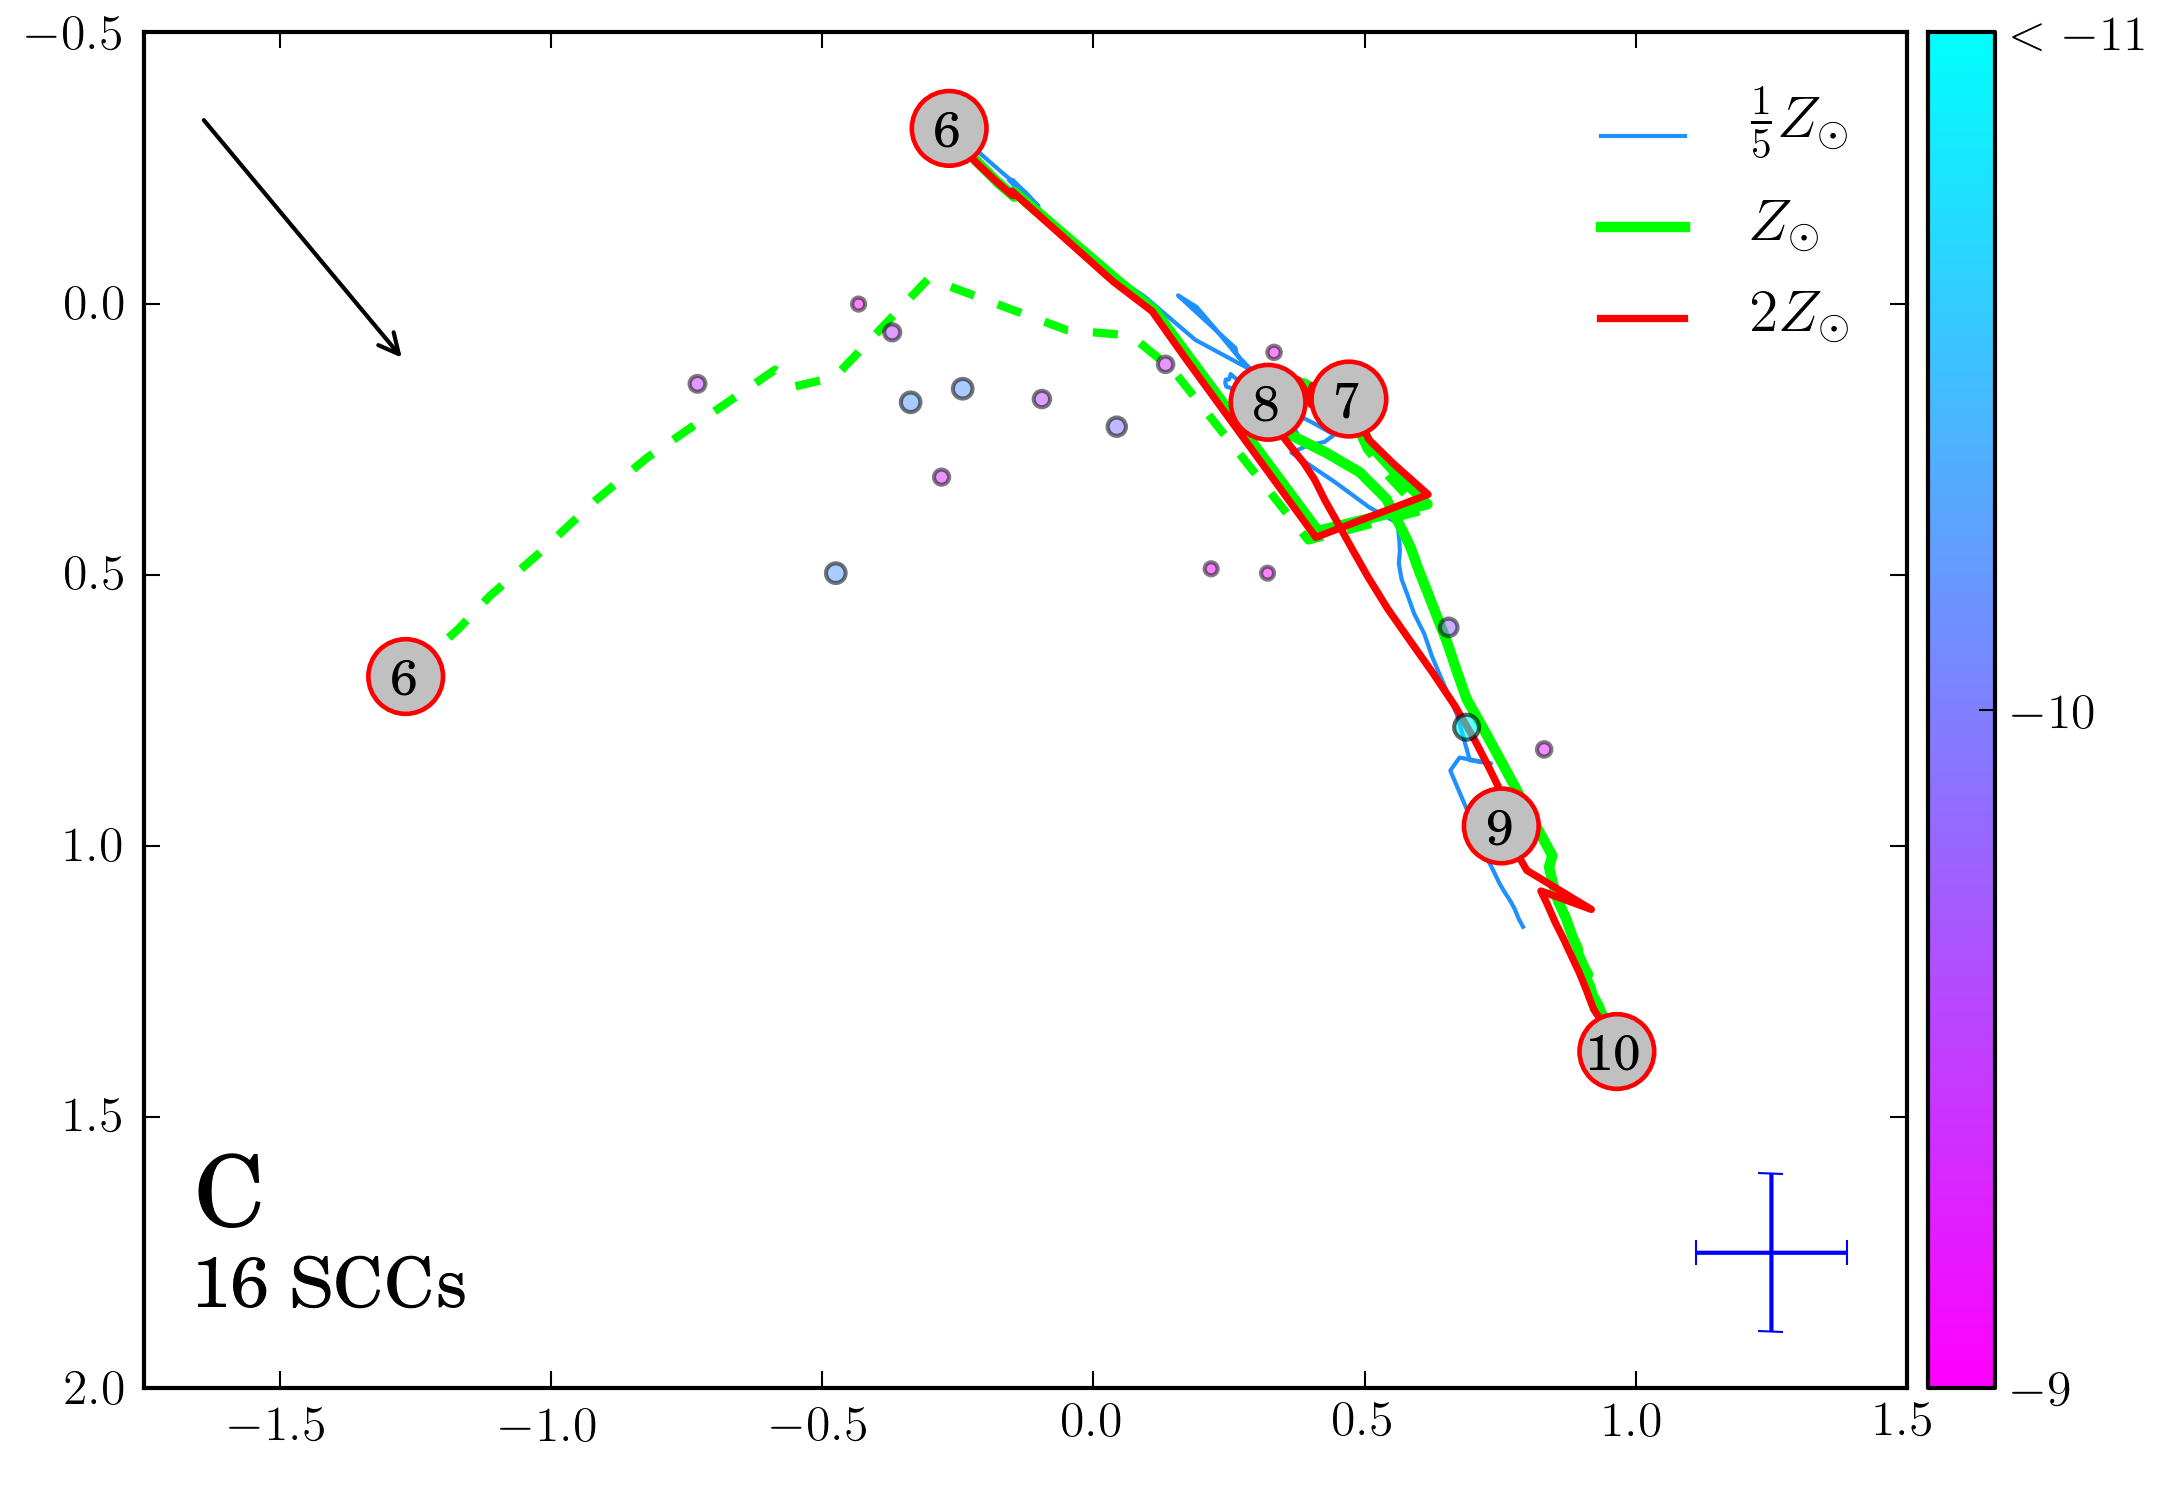
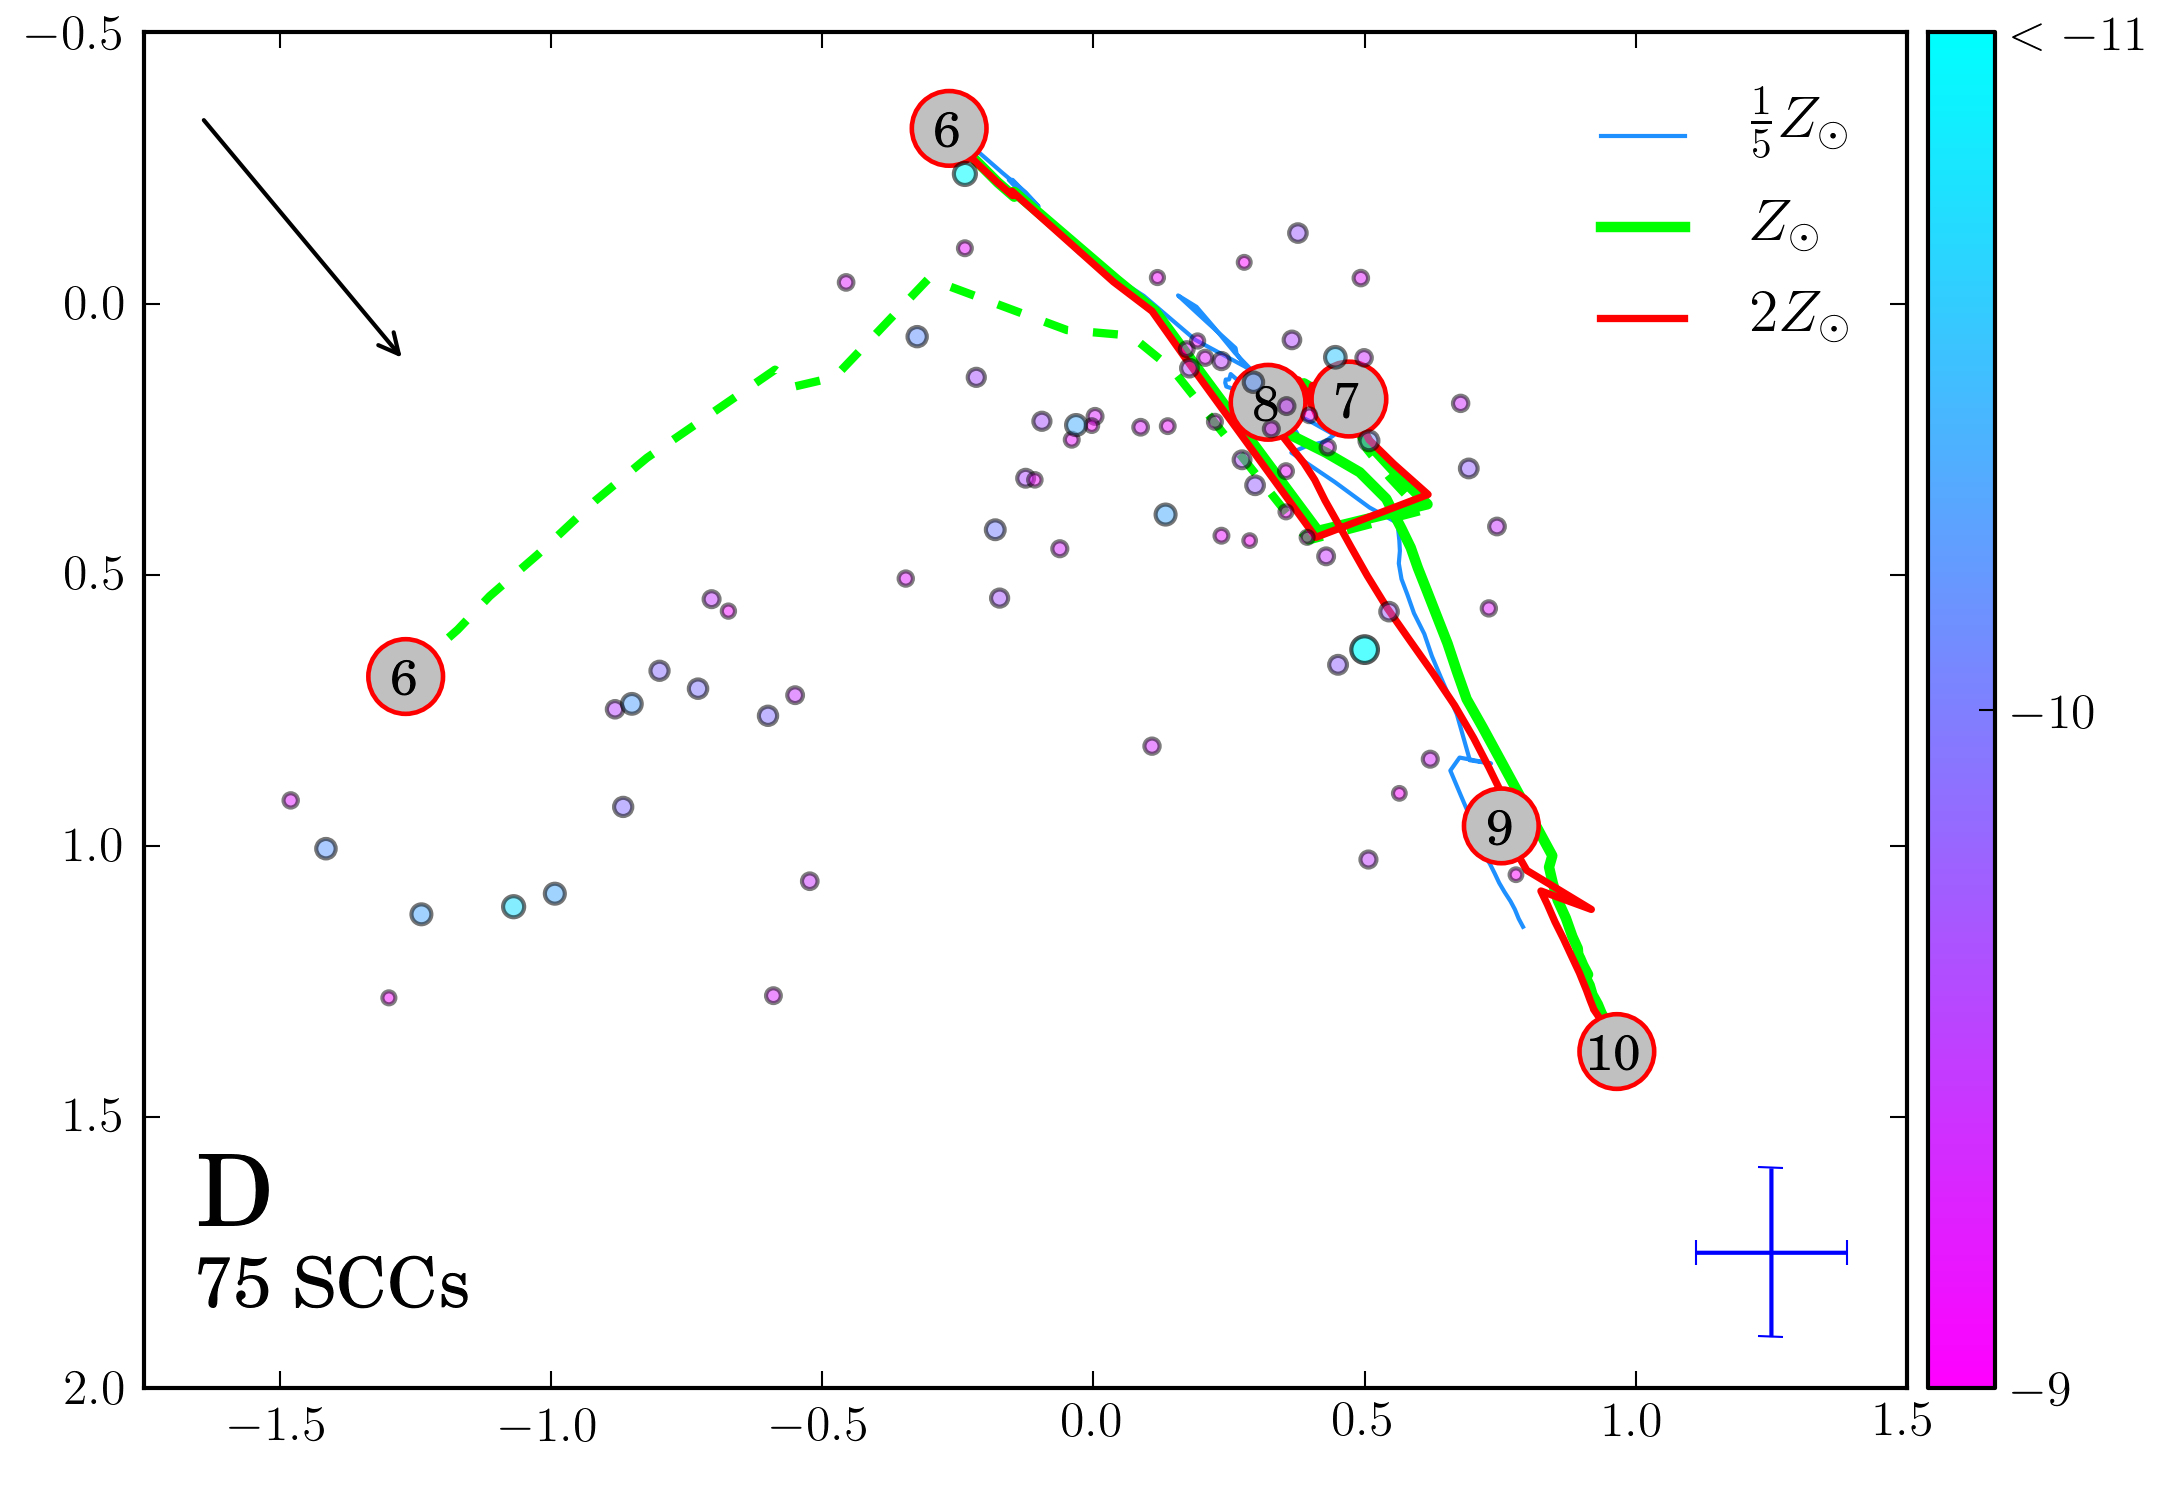
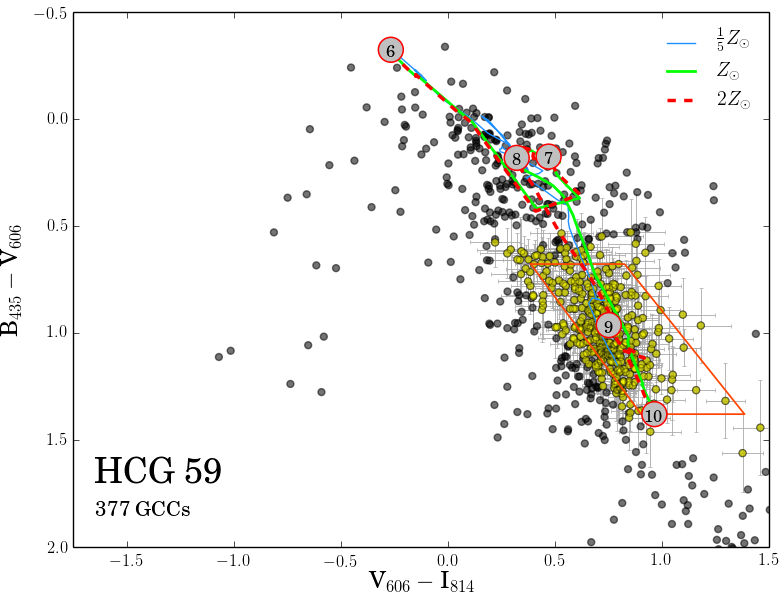
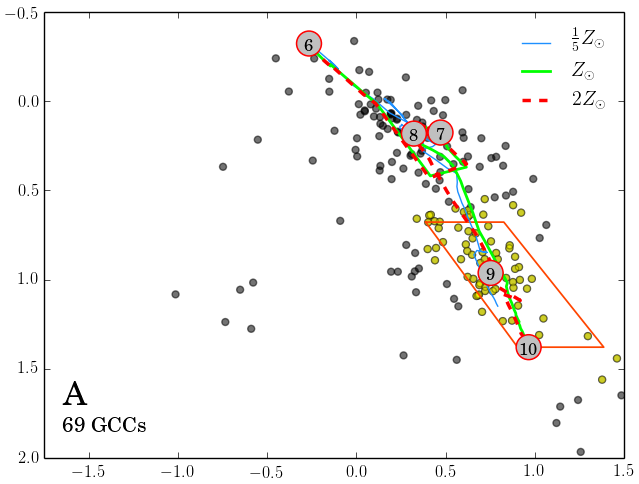
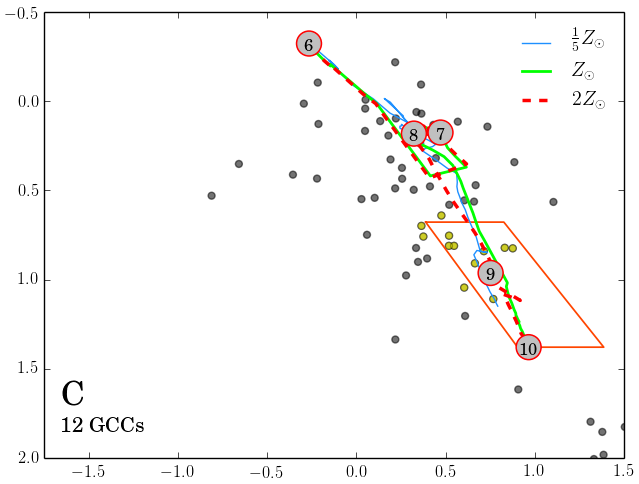
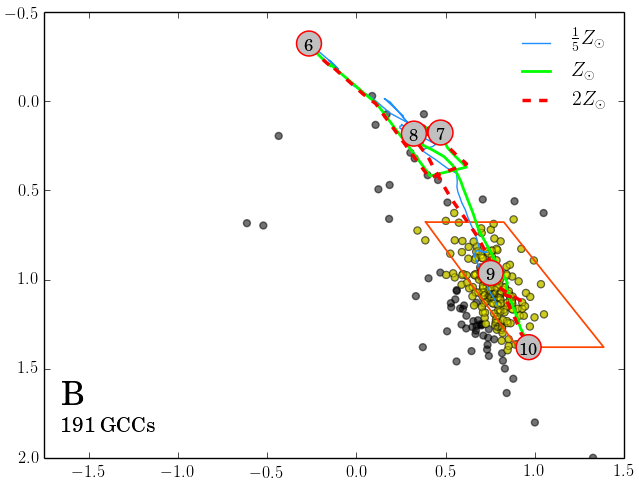
This group is classified as a Type II group in the evolutionary sequence, with an intermediate amount of gas contained within the individual galaxies. As first presented in Konstantopoulos et al. (2010), although we do not observe strong signs of interactions between the galaxies in this group, the large number of young star clusters indicates that star formation rates are at an elevated level (see Fig. 5). From the distribution of clusters within the colour-colour diagrams compared to the simple stellar population models (SSP) of Marigo et al. (2008), galaxies A, C, and D appear to have the youngest SCCs, while B has a more mature population. Most of the youngest SCCs are located down and to the right of the dashed evolutionary track of nebular emission for Myr clusters along the direction of the reddening vector, consistent with the hypothesis that these clusters have to 3 mag. Similarly, Whitmore & Zhang (2002) found that the median extinction value for optically selected very young clusters ( Myr) in the Antennae galaxies is 2.6 mag. Moreover, from the distribution of SCCs it would appear that the star formation in galaxy C has a more extended history, whereas galaxies A and D exhibit an onset of more recent star formation (Fig. 9), as shown by lower cluster densities between the ages of 100 Myr and 1 Gyr.
4.1.2 Globular Cluster Candidates
The colour-colour plots of the GCC population for galaxies in HCG 07 are presented in Fig. 14 and their properties are presented in Table 1. Because galaxies A, C, and D are spiral galaxies (with C and D being face-on galaxies), the number of GCCs in them should be taken with caution. The GCCs located in the central regions and spiral arms may be contaminated by reddened young star clusters. For the GCCs of galaxies B and D, we considered the pair as a single object because of the difficulty of distinguishing cluster ownership given the overlap of the expected extent of the GC systems in these galaxies. As derived from the colour, the average metallicities of the globular clusters in galaxy A (spiral) and the BD (B is lenticular, D is spiral) system are below Solar metallicity and comparable to metallicities of galaxies of comparable luminosity (e.g., Barmby et al., 2000; Goudfrooij et al., 2003; Chandar et al., 2004; Kundu & Whitmore, 2001; Peng et al., 2006). Galaxy A has observed GCCs with mag. Compensating for the missing portion of GC system extent, and assuming a circular symmetry, we estimate the total number of observed GCCs as (taking in consideration the foreground sources, Table 1). At the given mag cutoff, assuming the GCLF turnover at mag and width mag, we sample of the GCLF. Taking our completeness fraction as , we conclude that for galaxy A ( mag) the total number of GCCs in the system is and specific frequency is . Applying the same approach to other galaxies in the group we find that for the BD region ( mag for B, mag for D) and , for C () and . We note that because galaxies A and C are spiral (A is highly inclined and C is a face-on), a significant number of objects with GC-like colours could, potentially, be reddened young star clusters.
4.2 HCG 31
4.2.1 Star Cluster Candidates
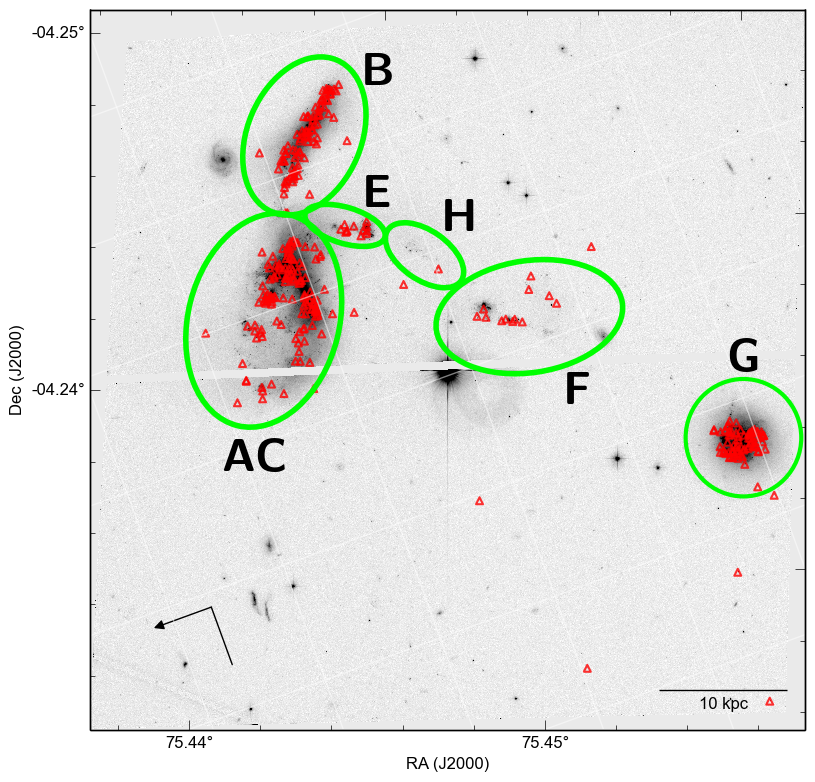
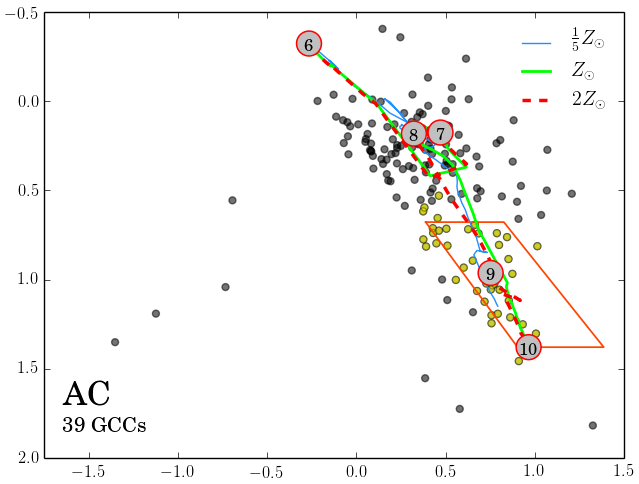
This group – classified as Type I with a cold gas-rich intra-group medium – consists of a number of small galaxies apparently coming together for the first time. The colour-colour plot of all detected SCCs, including those in the intra-group medium, paints a picture of a group that is actively forming stars for the last tens of Myrs (panel (a) of Fig. 10). Simultaneous interactions (e.g., galaxies AC and B) have triggered a very high star formation rate of 8.11 Myr-1 (Tzanavaris et al., 2010), as shown by the large number of very young SCCs on the colour-colour plots. Virtually all of the SCCs in regions E and F (24 SCCs combined) are younger than 10 Myr. These regions are tidal features connecting spiral galaxy G, interacting pair AC and B, placing a time constraint on the interaction between those galaxies. There is a high concentration of SCCs around the region where the evolutionary track makes a backward loop, essentially making it impossible in this colour-space to distinguish between SCs of 10 to 100 Myr old (panels (c) and (d) of Fig. 10). However, given the low density of SCs older than 300 Myr ( yr) and the large number of young SCs ( Myr), we consider it likely that most of the SCs in the vicinity of evolutionary track loop are closer to being a few tens of Myr old rather than 100 Myr.
4.2.2 Globular Cluster Candidates
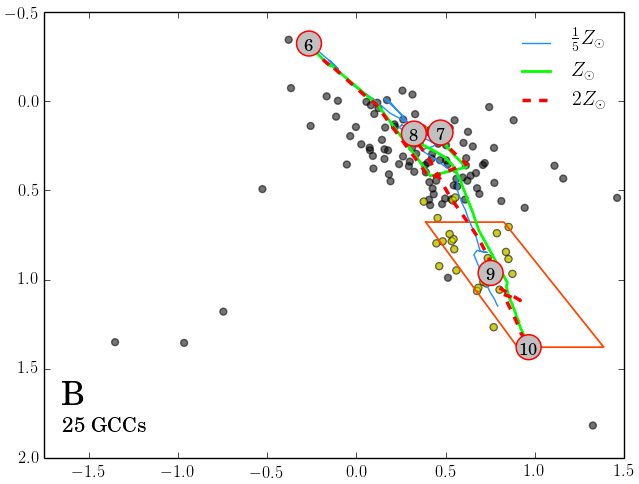
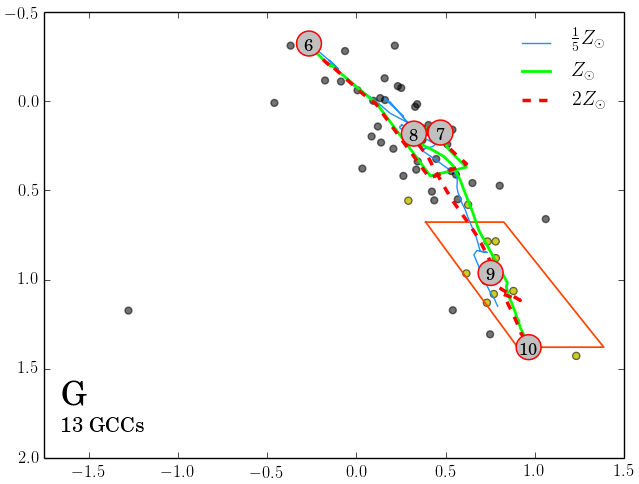
The globular cluster population of HCG 31 as expected is rather small, with only 77 sources with colours similar to the Milky Way’s GCs. Most of the clusters are situated within the boundaries of the major galaxies AC, B, and G, and, in all likelihood, are reddened young SCs (especially for galaxies B and G). Additionally, we do not expect a large GC population in this group as the galaxies are not massive enough to host a significant number of GCs with masses (and hence luminosities) large enough to be detectable at such distances. Furthermore, we observe a lack of old ( Gyr) star clusters in the colour-colour plot for SCCs of HCG 31 (panel (a) of Fig. 10).
Determining the total number of GCCs and GC specific frequencies in the galaxies of HCG 31 is more straightforward – there is no reason to extrapolate to areas outside the ACS field of view. At the mag cutoff we observe of the GCLF, assuming the GCLF turnover is at mag and mag. Taking the completeness fraction as , we obtain and for 31AC (), and for 31B (), and and for 31G ().
4.3 HCG 42
4.3.1 Globular Cluster Candidates
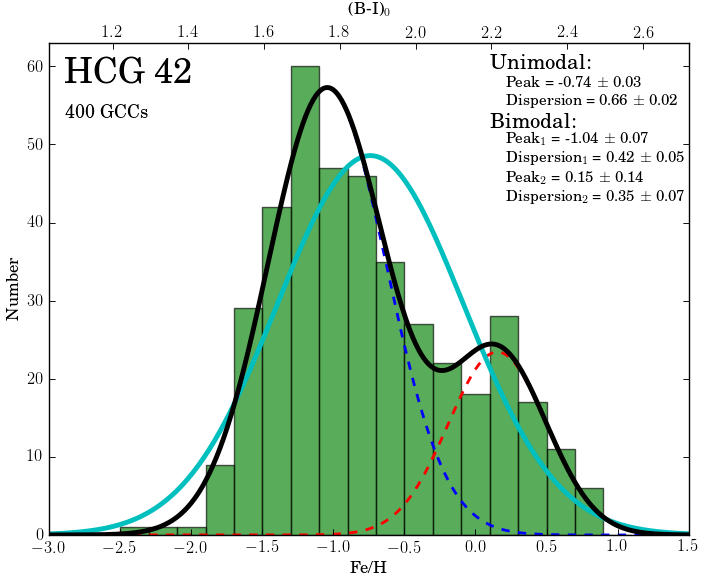
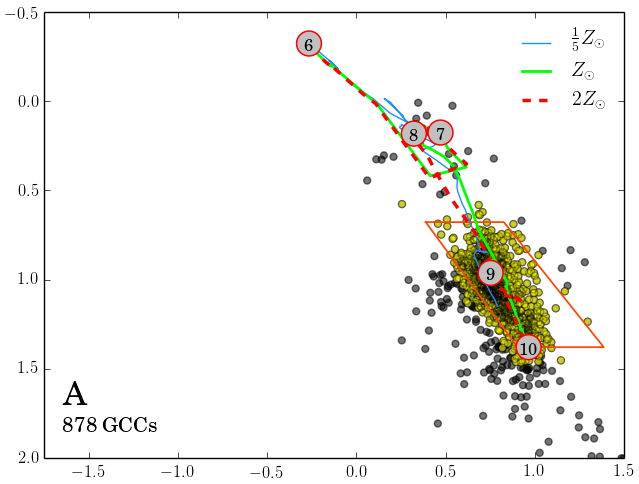
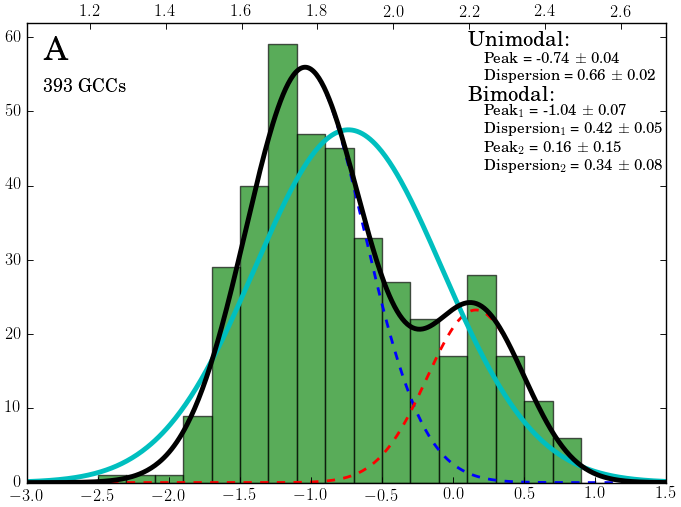
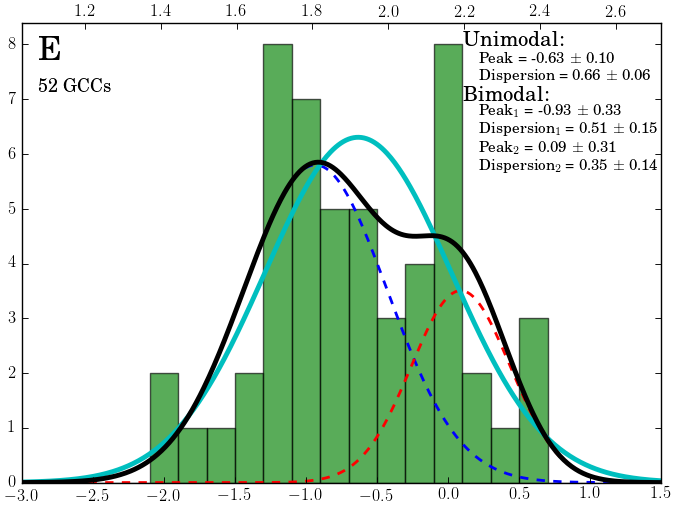
The HCG 42 group consists of four large galaxies, three of which are elliptical and one lenticular, with low overall H i content. In the evolutionary sequence scheme this group qualifies as Type III. More details on this group configuration including the dwarf galaxy population can be found in Konstantopoulos et al. (2013). Because of the predominance of elliptical galaxies in the group and the low content of the cold gas we do not expect to find young and intermediate-age star clusters, as illustrated by Fig. 11 panel (c). Thus, we start our star cluster population analysis by looking at the GCCs. The ACS observations of this group consist of only one pointing that covers the two elliptical galaxies, 42A and C (panel (b) of Fig. 11). The brightest of these two galaxies, 42A, has an optical luminosity comparable to M87 ( and ; Misgeld & Hilker, 2011). The extent of the globular cluster system for this galaxy covers most of the field of view and overlaps the extent of the globular cluster system of the neighbouring galaxy 42C. From the magnitude difference of these two galaxies ( mag), most of the detected globular cluster candidates in this image are expected to belong to 42A. Additionally, northward of 42A lies a dwarf galaxy [VC94] 0957531922.2, which has been identified as a member of HCG 42 (Carrasco et al., 2006; Konstantopoulos et al., 2013). We observe a slight overdensity of globular clusters in that region (panel (c) of Fig. 16). However, following the same line of argument as above, we consider those clusters to be part of the 42A globular cluster system. Altogether, there are 878 detected GCCs that located inside the GC system extent. The photometric metallicity distribution as probed by was determined for 393 of them (for reasons mentioned in §3.5). The distribution has a very well defined bimodality with peaks at and , for the ‘blue’ and ‘red’ peaks, respectively. Both peaks appear to be more metal rich by as compared to the average peaks of GC metallicity distributions of approximately and measured for different types of galaxies (VanDalfsen & Harris, 2004, and references within).
From RC3, we find that the effective radius is (estimated from a Johnson image and corresponding to kpc); the value for the velocity dispersion of was obtained from HyperLeda444http://leda.univ-lyon1.fr (Makarov et al., 2014). Using the above numbers and equation 4, we find that the predicted population of the GC system for 42A is GCs. At the cutoff magnitude of and with the assumption for GCLF turnover at mag and mag, we probe of the GCLF. Taking a completeness fraction as we estimate and . Although the number is larger that one predicted by equation 4, it is still within reasonable uncertainties. Given the large number of GCCs in a luminous, central dominant group elliptical, it seems likely that 42A is the product of a gas-rich merger from several Gyr ago.
4.4 HCG 59
4.4.1 Star Cluster Candidates
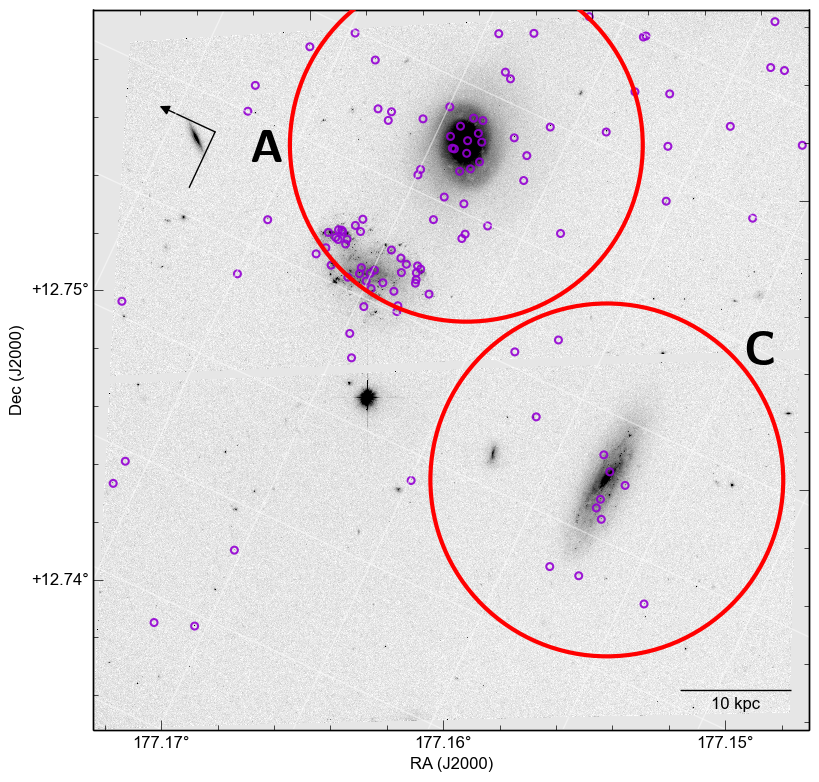
According to Konstantopoulos et al. (2012), HCG 59 belongs to the Type III groups, with low H i content relative to its apparent dynamical mass. However, a number of young SCCs are found in this group, located in the smaller galaxies 59C and D (panels (f) and (g) of Fig. 12). The SCC population of the spiral 59C is somewhat small, with only 16 SCCs detected in the disc of the galaxy. These clusters span a range of ages between a few Myr and 1 Gyr, similar to clusters in the large irregular 59D. The difference between the SCC populations of those galaxies is that 59D has a larger population of clusters detected and there is also a number of very young clusters present (). Given that these two galaxies have approximately the same stellar mass (Table LABEL:tab:HCG_info) we can compare their sSFRs and see that 59D is forming stars over 8 times more efficiently than 59C (sSFRs are 0.024 Gyr-1 and 0.200 Gyr-1 for 59C and 59D, respectively), which can be seen clearly in the colour-colour plots for each galaxy. The irregular galaxy 59D has a higher sSFR likely because of the larger amount of available cold gas. Star formation in 59D may also be enhanced dynamically because of its proximity to 59A.
4.4.2 Globular Cluster Candidates
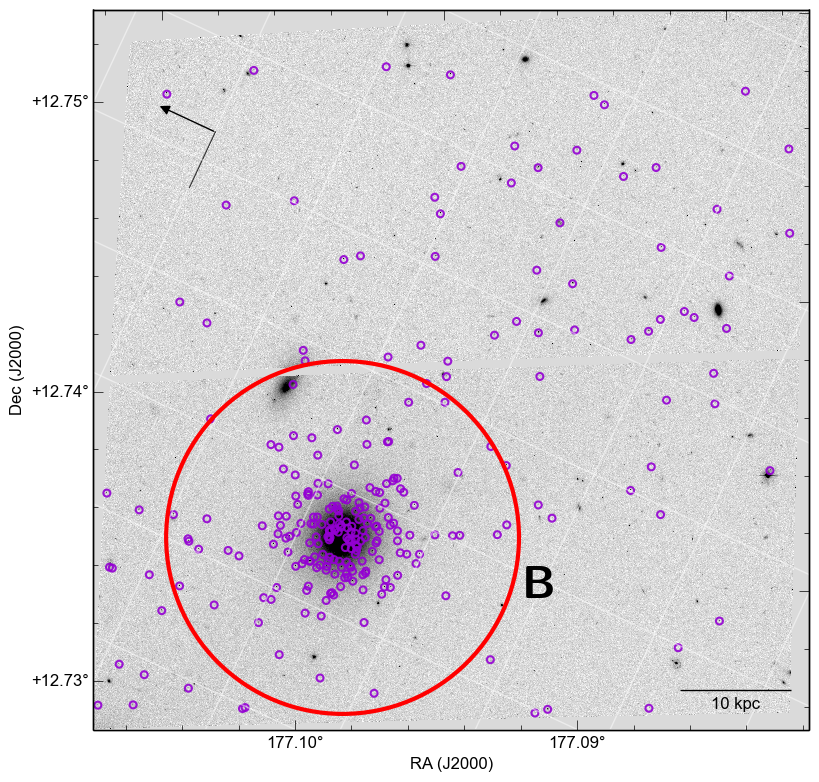
The majority of GCCs in HCG 59 are part of the globular cluster system of the elliptical galaxy 59B (IC 0736) (panels (d) and (g) of Fig. 17). Intriguingly, it appears that the GCC population is much richer than would be expected of a galaxy of its luminosity (; Sabater et al., 2012). We use the SDSS (York et al., 2005) values for the velocity dispersion, km s-1 and the value of the effective radius (as determined from a deVaucouleurs profile) which corresponds to 0.96 kpc. Substituting these numbers into equation 4, we find that the predicted number of GCs for this galaxy is significantly smaller than the number of GCs estimated from the observed bright end of the GCLF (, details to follow), and is in fact even smaller than the number of detected GCCs ( or for sources with 95% completeness level). However, we note that the velocity dispersion value taken from SDSS appears to be rather low for a galaxy with this mass (see Table LABEL:tab:HCG_info). In addition, we point out the unusually dense population of extragalactic star clusters located to the south-west of 59B (panel (d) of Fig. 17), away from the visual center of the group and along the stellar stream that appears to connect galaxies A and B Konstantopoulos et al. (2012). One of the possible explanations for this population of clusters is that they are possibility a remnant of a prior interaction between the A and B galaxies, approximately 1 Gyr ago (see Konstantopoulos et al. (2012) for further discussion).
At the cutoff magnitude of and with the assumption of a GCLF turnover at mag and width mag, we probe of the GCLF of galaxies in this group. Taking the completeness fraction as we estimate and for 59A (; after removing clusters around the irregular 59D that are within the expected 59A GC system extent, but are most likely reddened young star clusters), and and for 59B (). For galaxy 59C, the number of detected GCCs from the 95% completeness sub-catalogue, is on a par with the number of contaminating sources, . That gives us the upper limits for and . We did not estimated and for 59D because the detected objects may well be reddened bluer objects, rather than GCCs.
Being the only elliptical with sufficient number of GCCs in this group, 59B was checked for bimodality in its metallicity distribution. The GMM statistical results do not support the idea of bimodality, rather, it would appear that the distribution is unimodal with a peak at .
In all, the population of old clusters in HCG 59 is intriguing enough
to warrant further study.
| Galaxy | ||||
|---|---|---|---|---|
| (1) | (2) | (3) | (4) | (5) |
| [0pt][0pt]HCG 07A | ||||
| HCG 07BD | ||||
| [0pt][0pt]HCG 07C | ||||
| HCG 31AC | ||||
| [0pt][0pt]HCG 31B | ||||
| HCG 31G | ||||
| [0pt][0pt]HCG 42A | ||||
| HCG 59A | ||||
| [0pt][0pt]HCG 59B | ||||
| HCG 59C | ||||
| [0pt][0pt]HCG 92BD | ||||
| HCG 92C | ||||
| [0pt][0pt]HCG 92E |
Notes. Columns list: (1) galaxy id; (2) number of detected GCCs in the system’s extent. The GCCs presented here are all at or above the 90% completeness level in all three filters. Additionally, -filter magnitude cutoffs were applied at 24.5 mag for HCG 92, 25.0 mag for HCG 42, and 25.5 mag for HCG 07, 31, and 59. The reasons for doing so are explained in §3.5. If the full system extent is not visible, detected numbers of GCCs are scaled to estimate the numbers of the full system extent. Foreground contamination is taken into account, i.e. subtracted from the number of detected GCCs; (3) estimated number of contamination sources from Besançon Milky Way stellar population model (Robin et al., 2003) in the direction of the group up to the distance of 100 kpc, with colours similar to MW GC colours and in the visible area of GC system extent; (4) estimated total number of GC population based on GC luminosity function; (5) specific frequency. ∗ Because GCC extent of 59A overlap sources from 59D (which are, most likely, reddened young star clusters), the predicted number of GCCs for 59A galaxy was obtained by subtraction of 59D sources from all detected sources in that region. ∗∗ For HCG 59, the background contamination is much higher (), due to the close proximity of the Sagittarius dwarf galaxy (Konstantopoulos et al., 2012).
4.5 HCG 92
4.5.1 Star Cluster Candidates
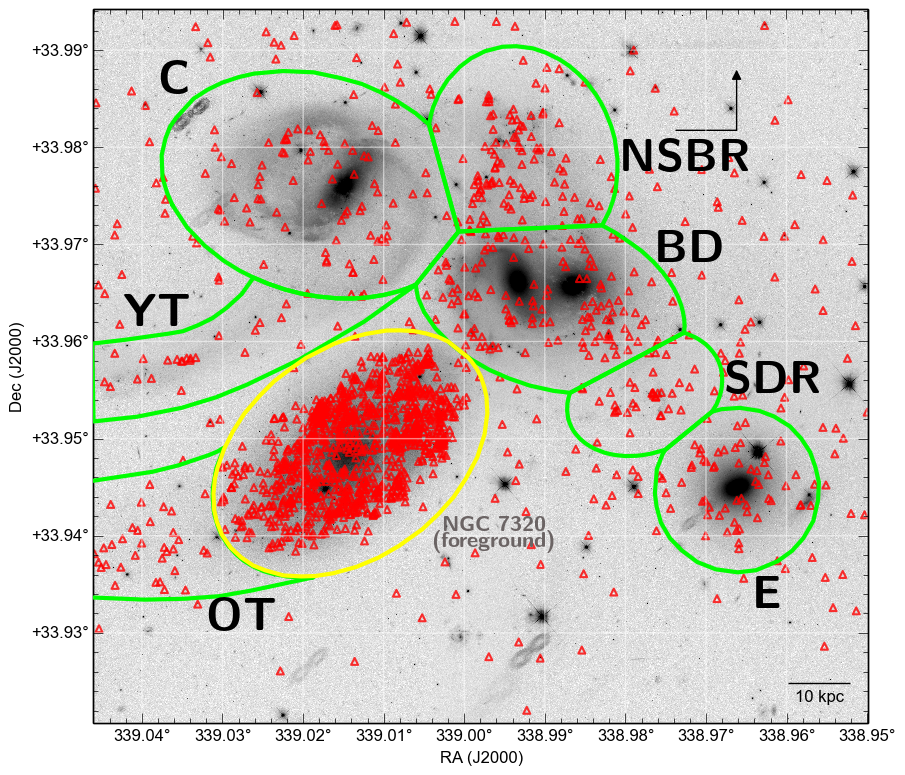
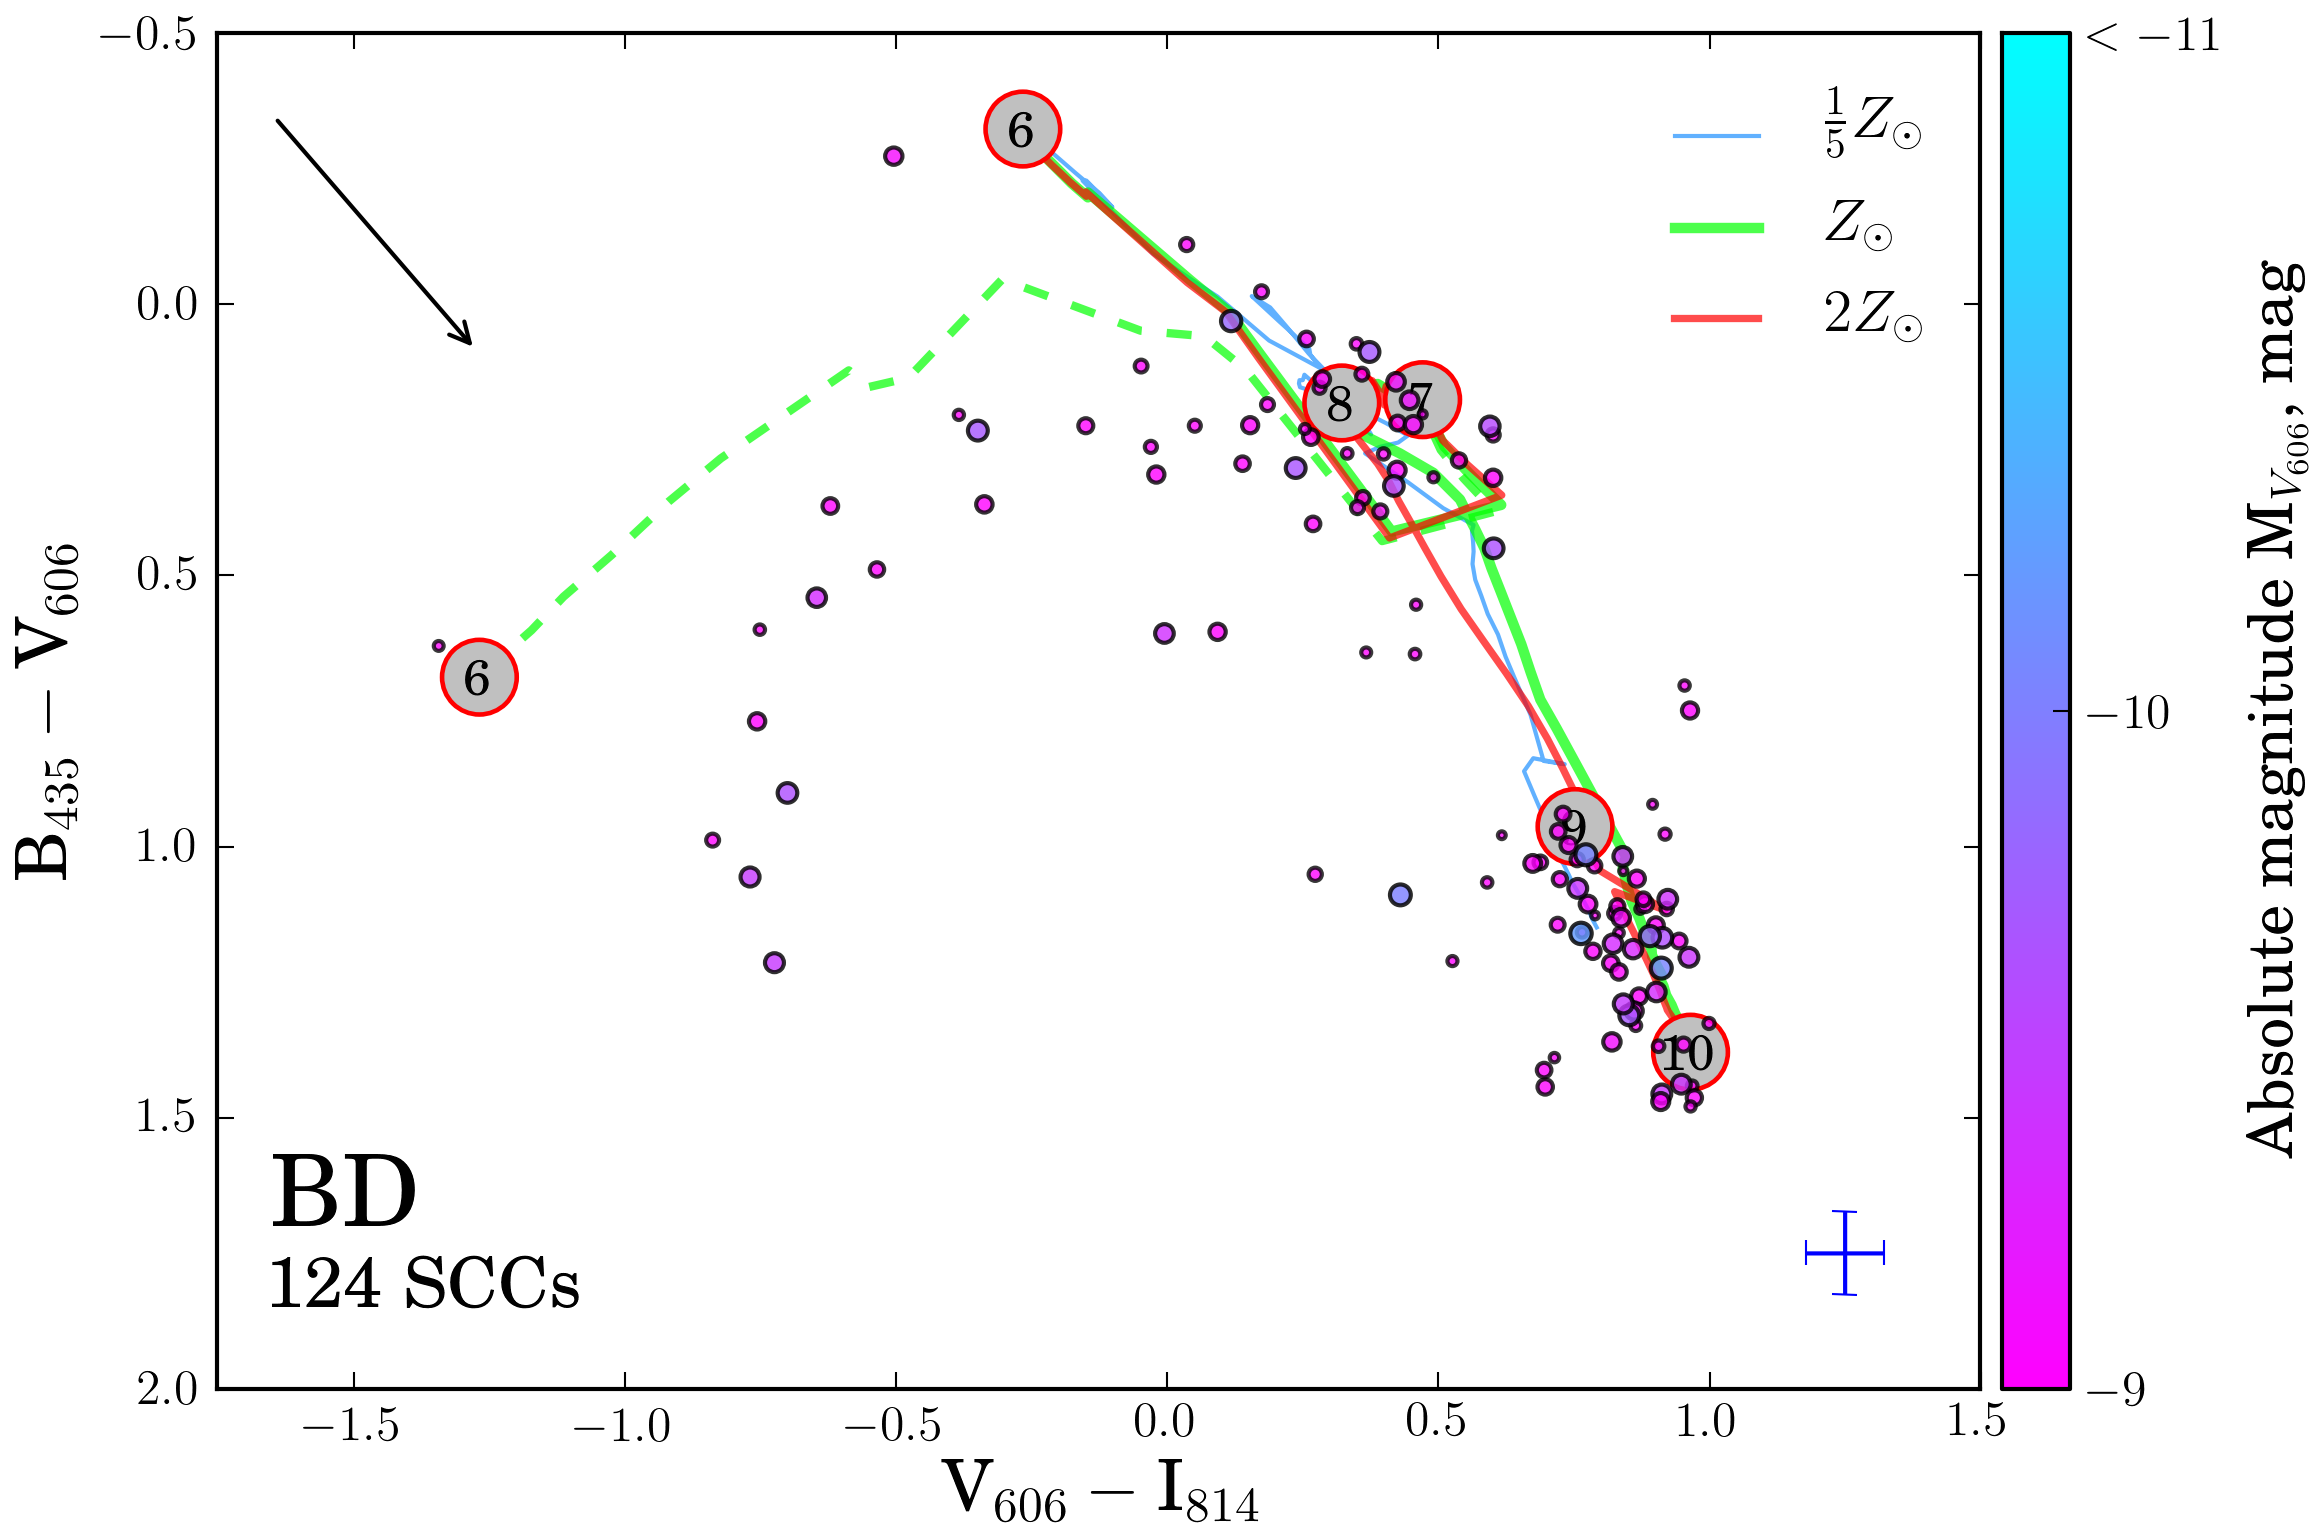
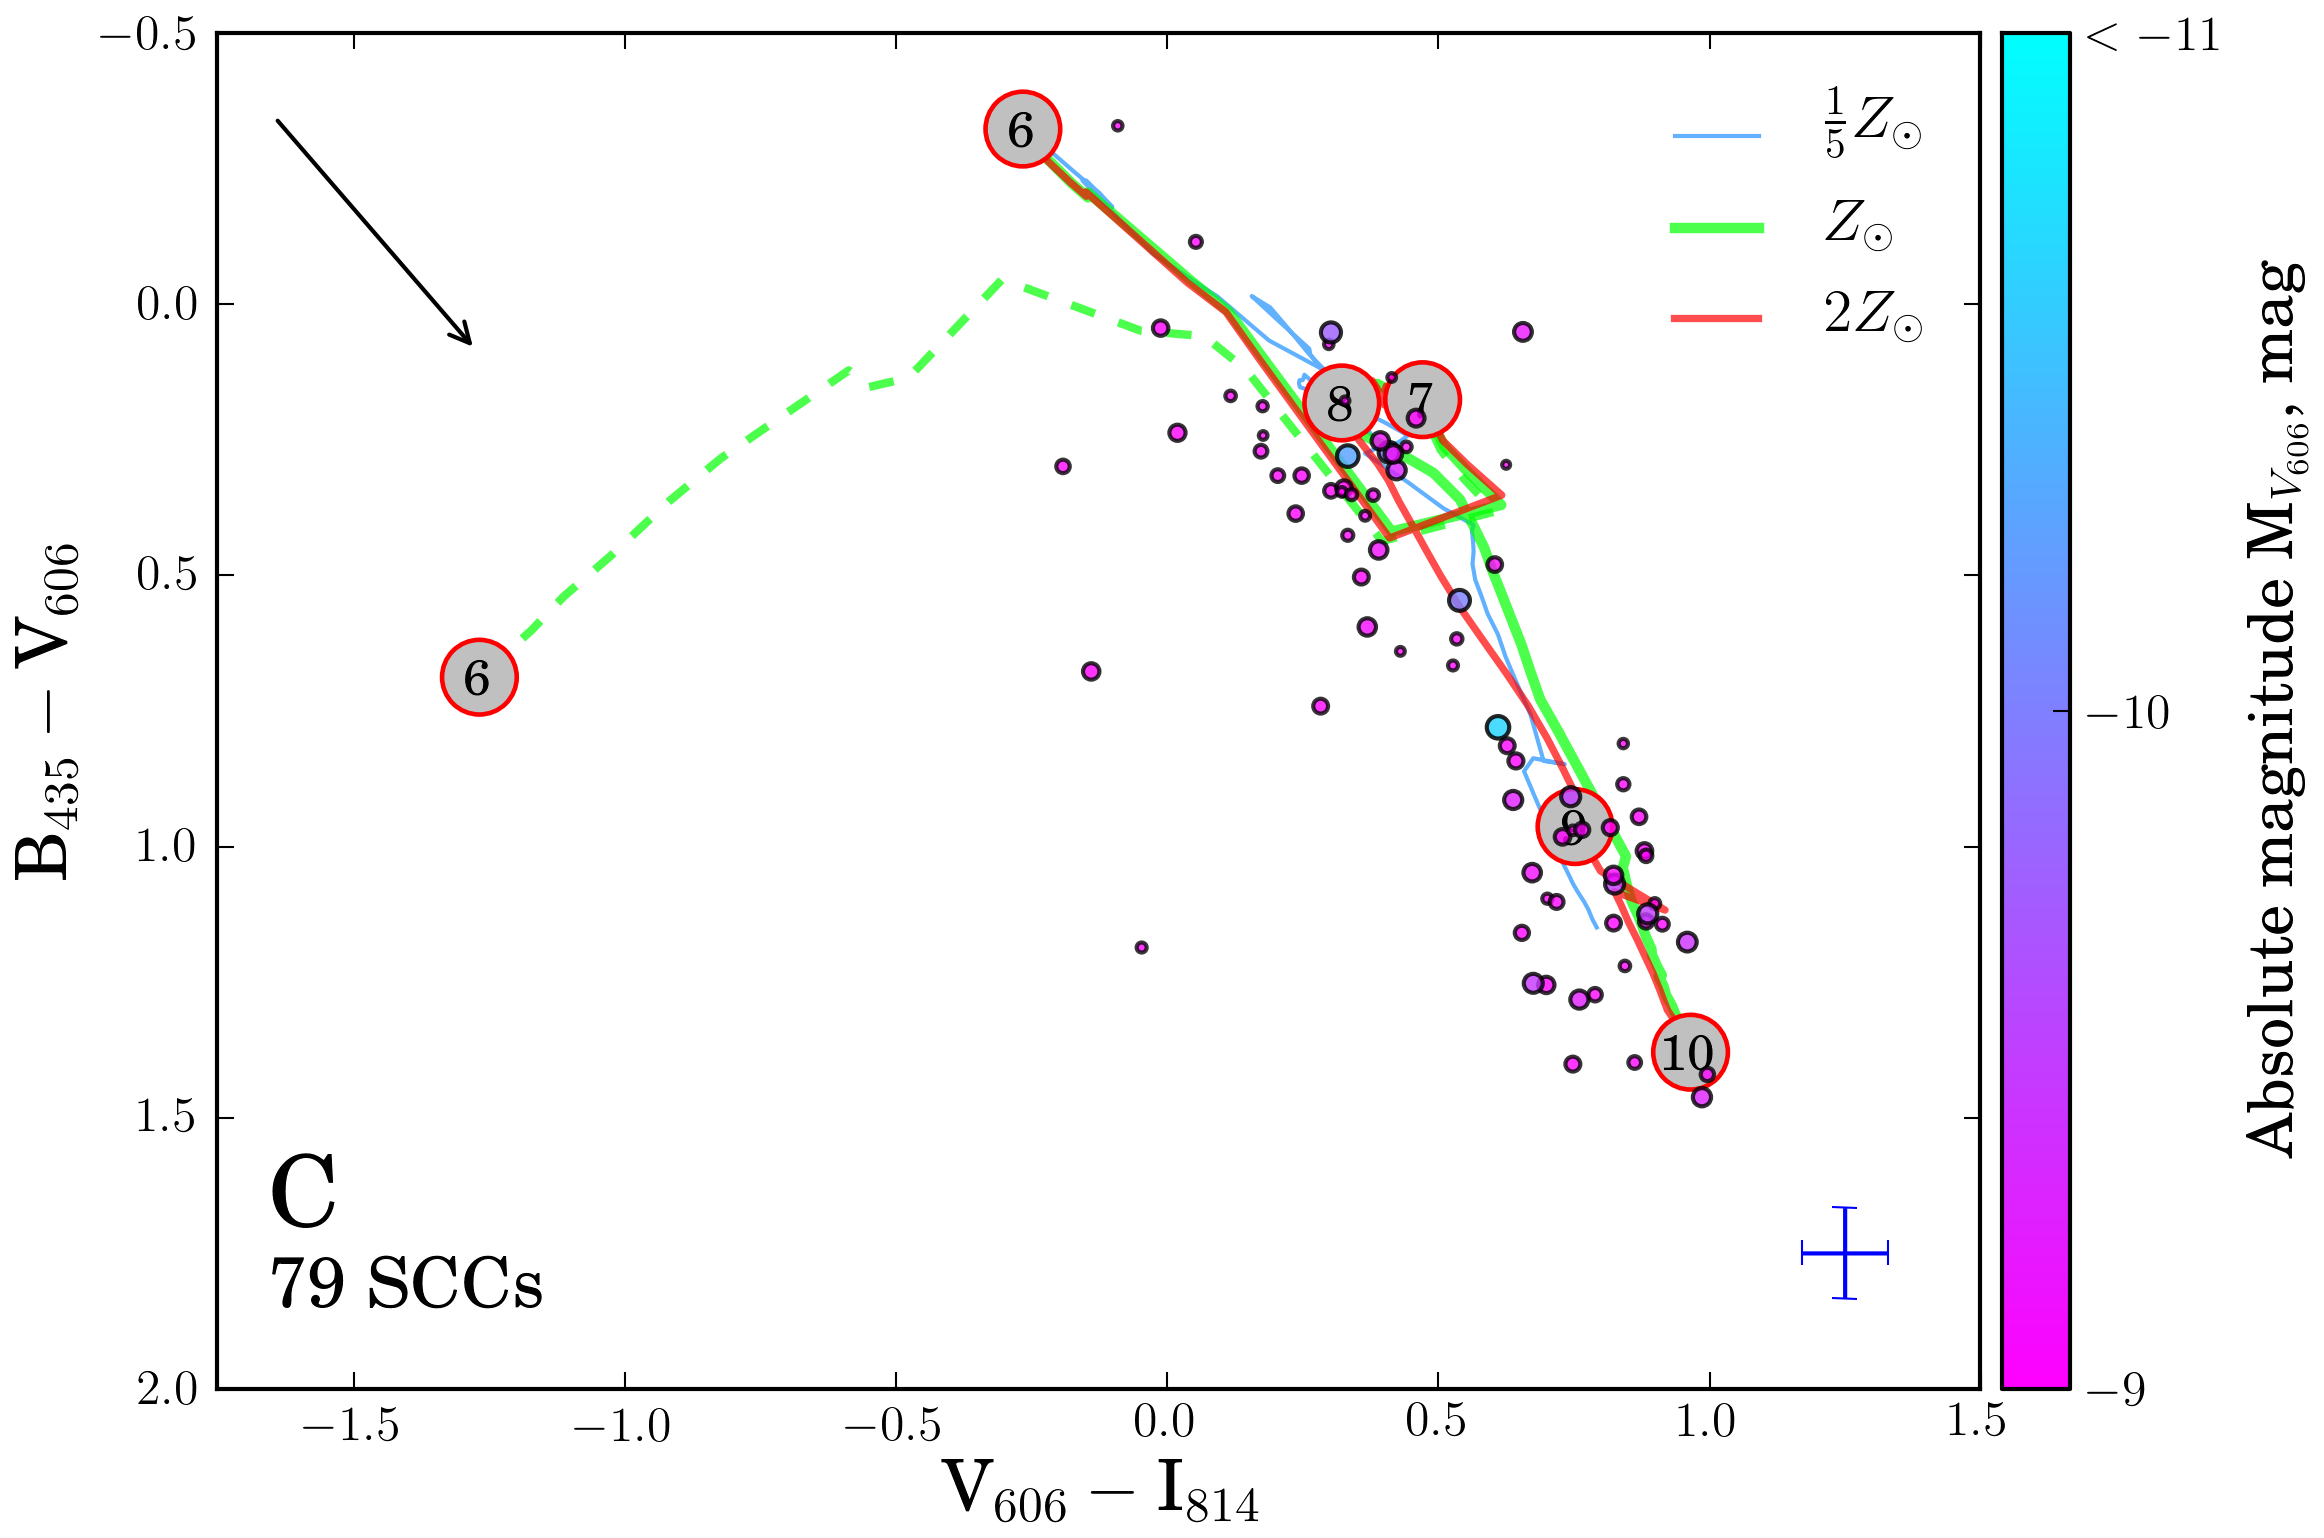
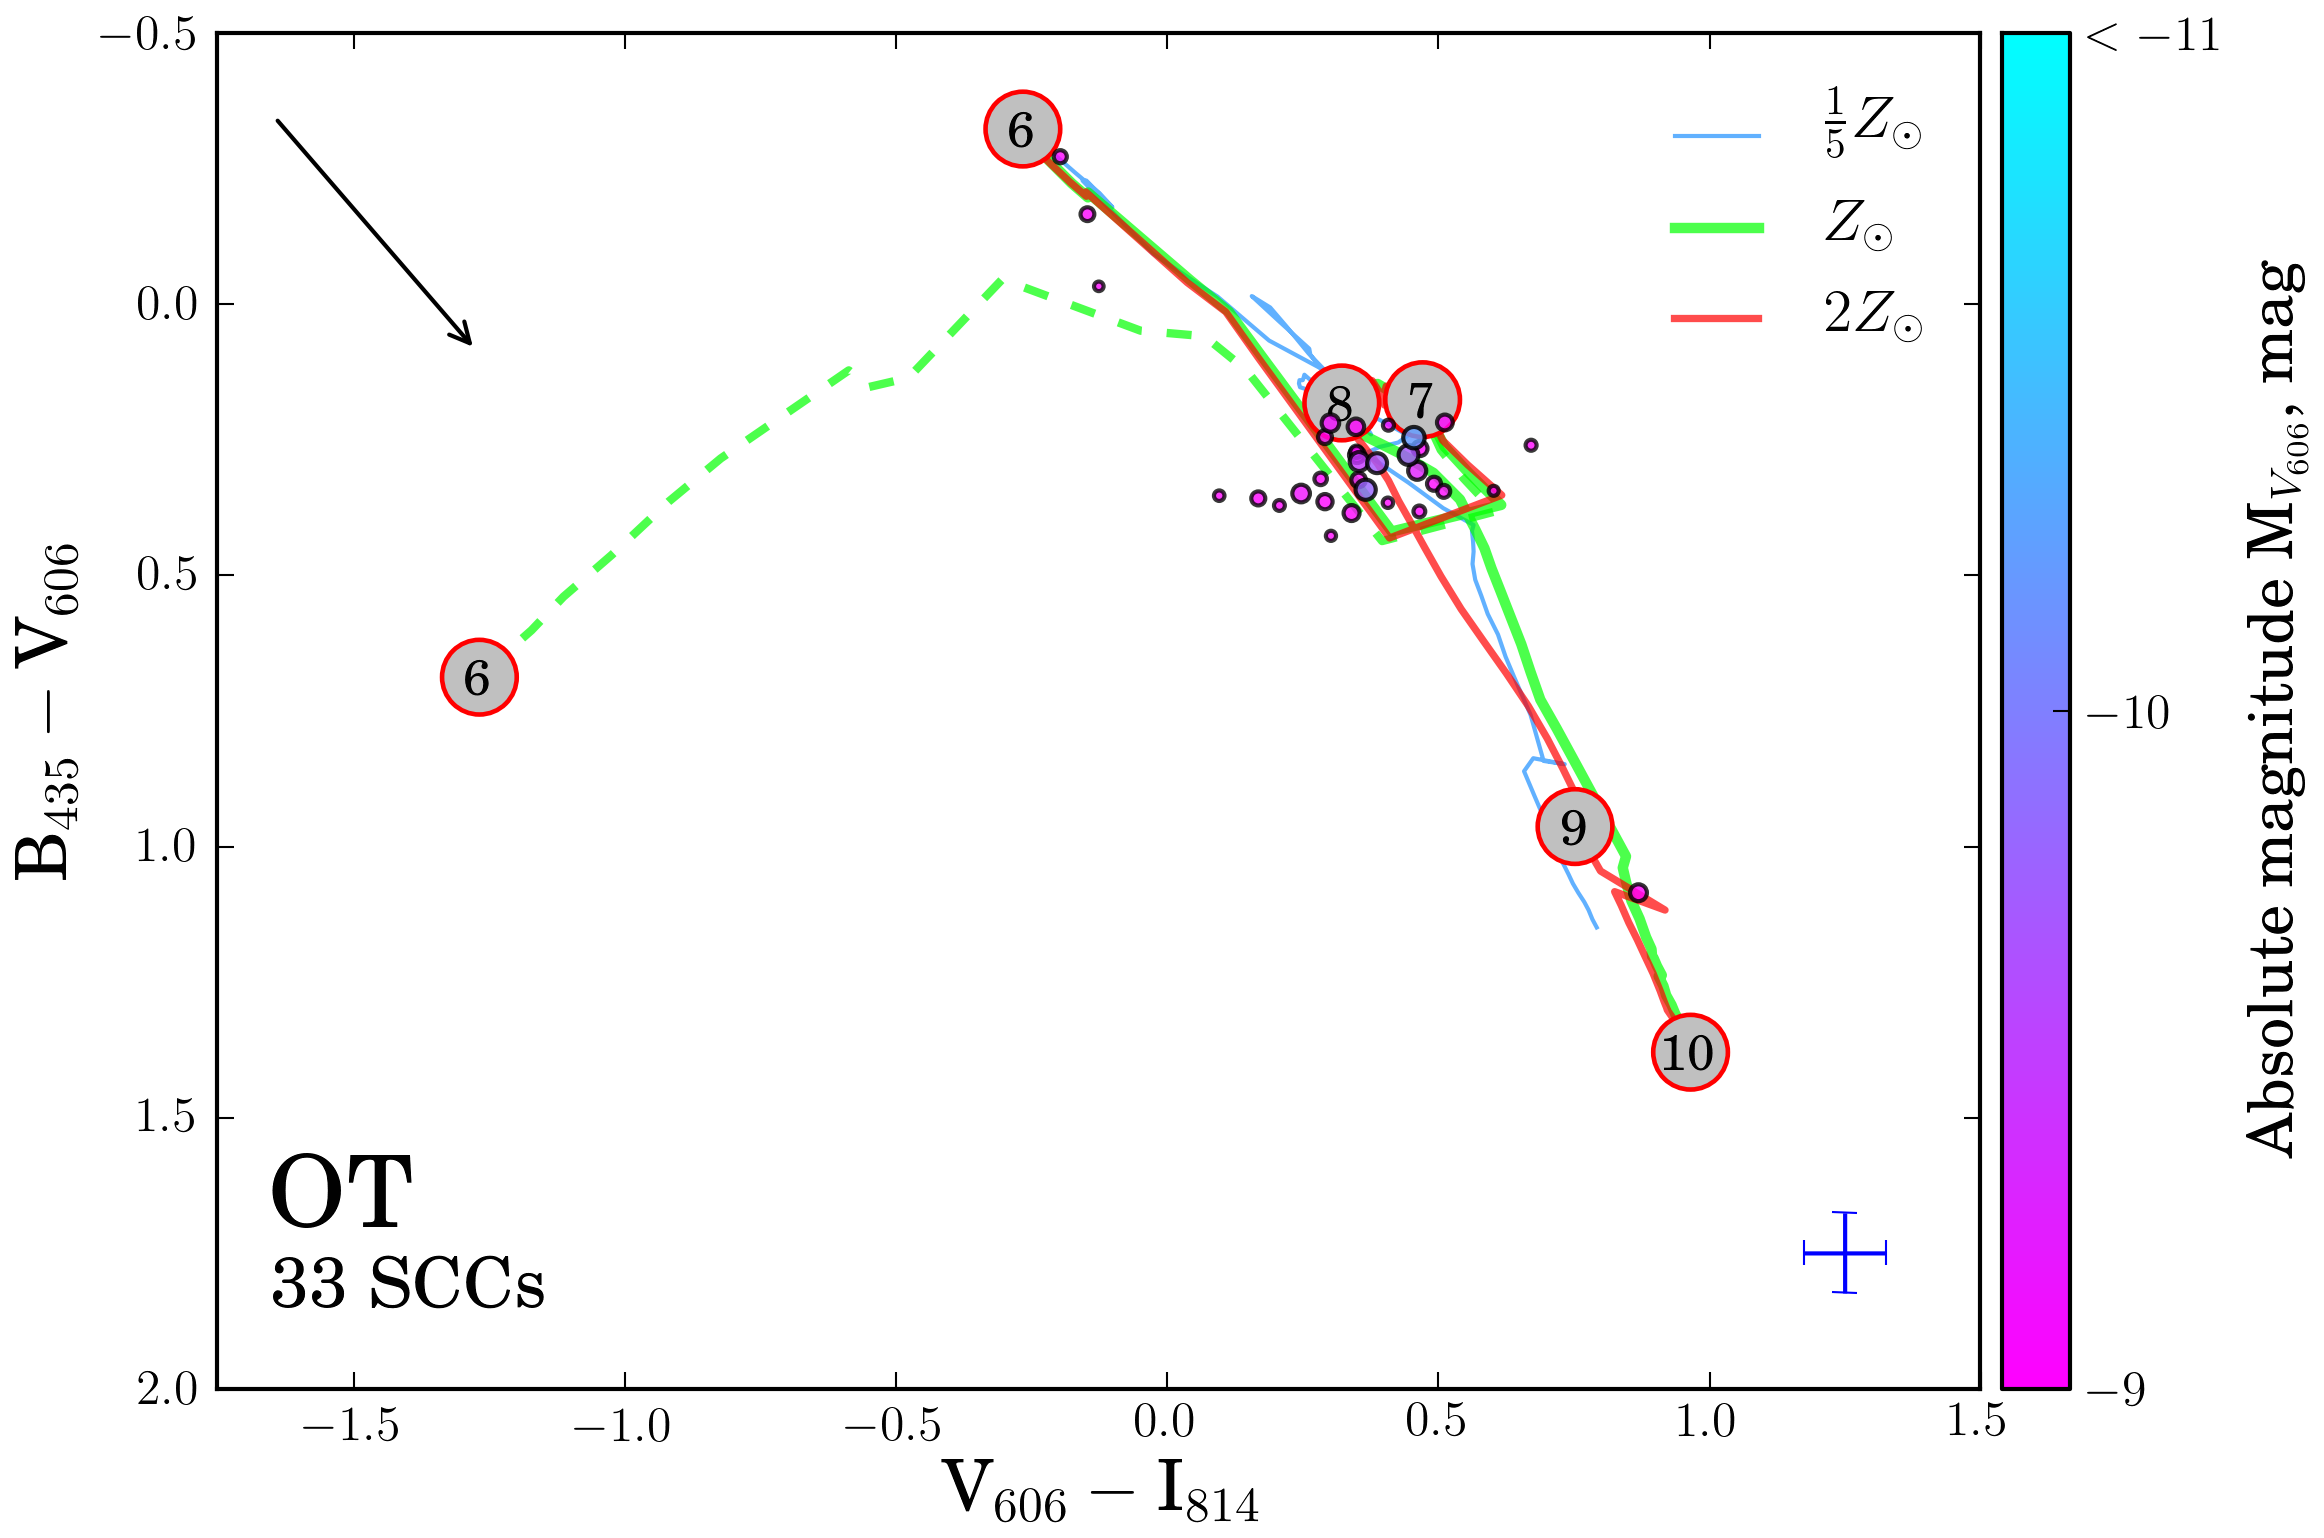
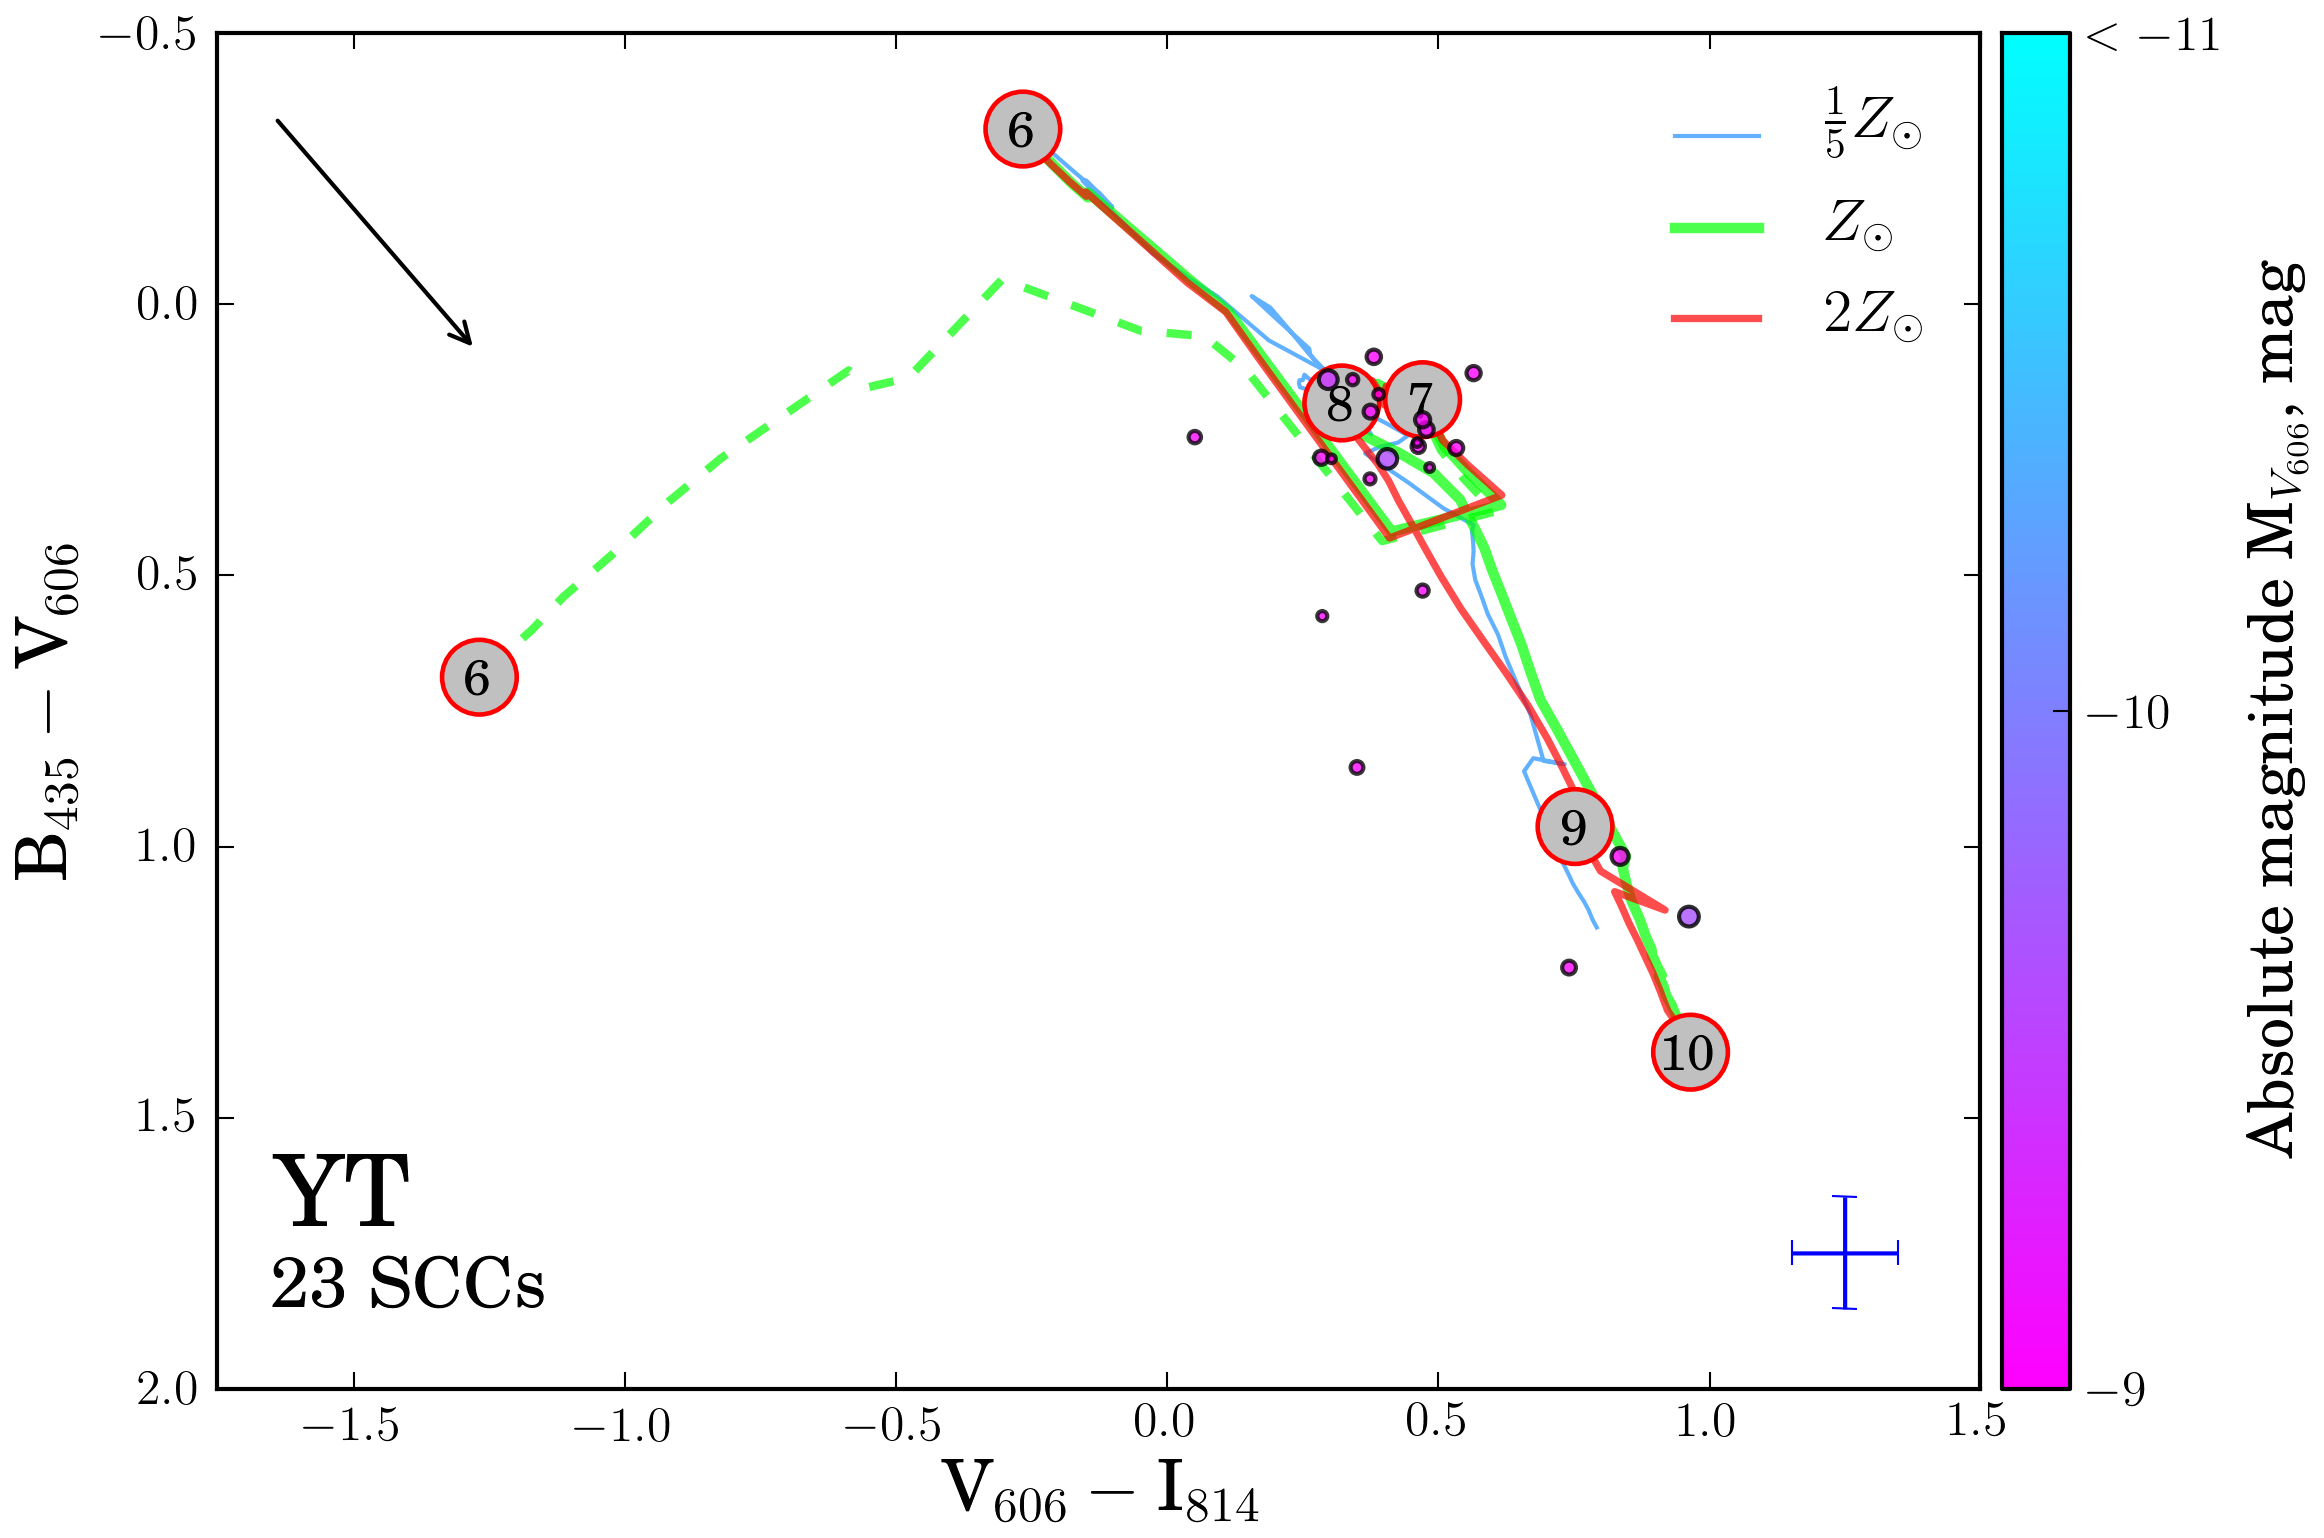
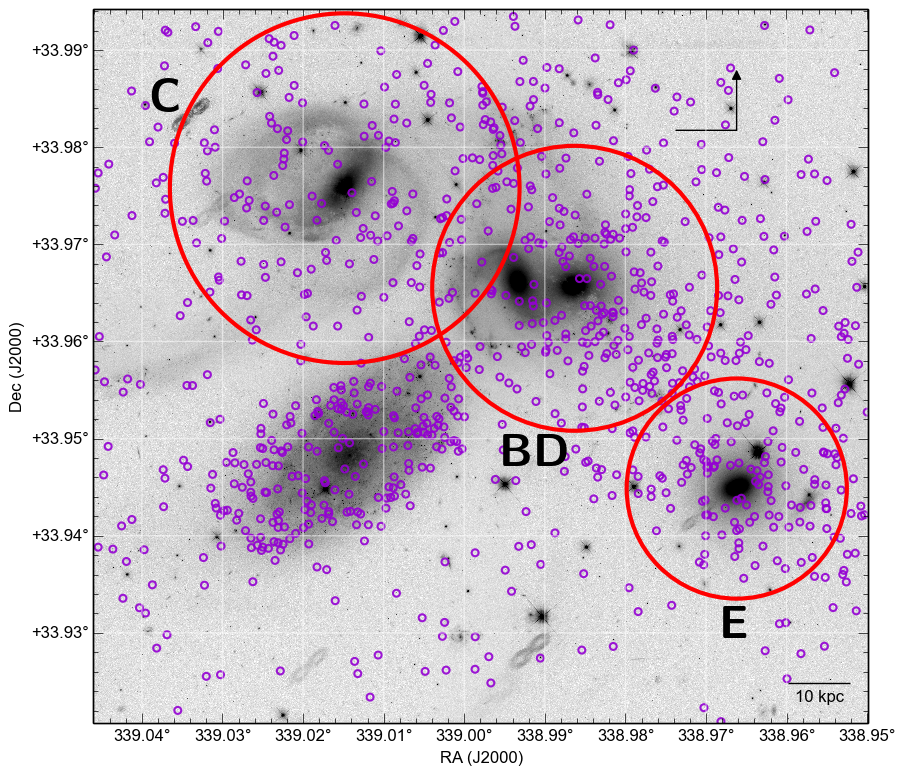
HGC 92, which also known as Stephan’s Quintet and which classified as Type II in the proposed CG evolutionary sequence (Konstantopoulos et al., 2010), is a group of five galaxies (including the foreground interloper NGC 7320) with numerous signs of past and ongoing interactions. Another galaxy associated with the group, NGC 7320C, is not in the HST field-of-view. As a result, this group exhibits the largest number of detected star clusters in our sample. There are a number of interesting features singular to this group which are explored in depth in Fedotov et al. (2011). For example, we were able to detect star clusters in two tidal tails, the Old Tail (OT) and Young Tail (YT) (Fig. 13). Because tidal tails typically have low gas and dust content ( mag; e.g., Temporin et al., 2005), star clusters in tails usually suffer minimal reddening and their ages estimated from colour-colour plots are more accurate than in galaxy discs. In our case, star clusters detected in these tails have compact distributions in the colour-colour plane, supporting the idea that SCCs within each tidal tail were formed coevally (Trancho et al., 2012), presumably during the interactions that caused the formation of those features. Thus, from overdensities of star clusters in colour-colour plots and supplemental information from the literature, we were able to estimate the ages for the young and old tidal tails to be 150–200 Myr and 400–500 Myr, respectively (Fedotov et al., 2011).
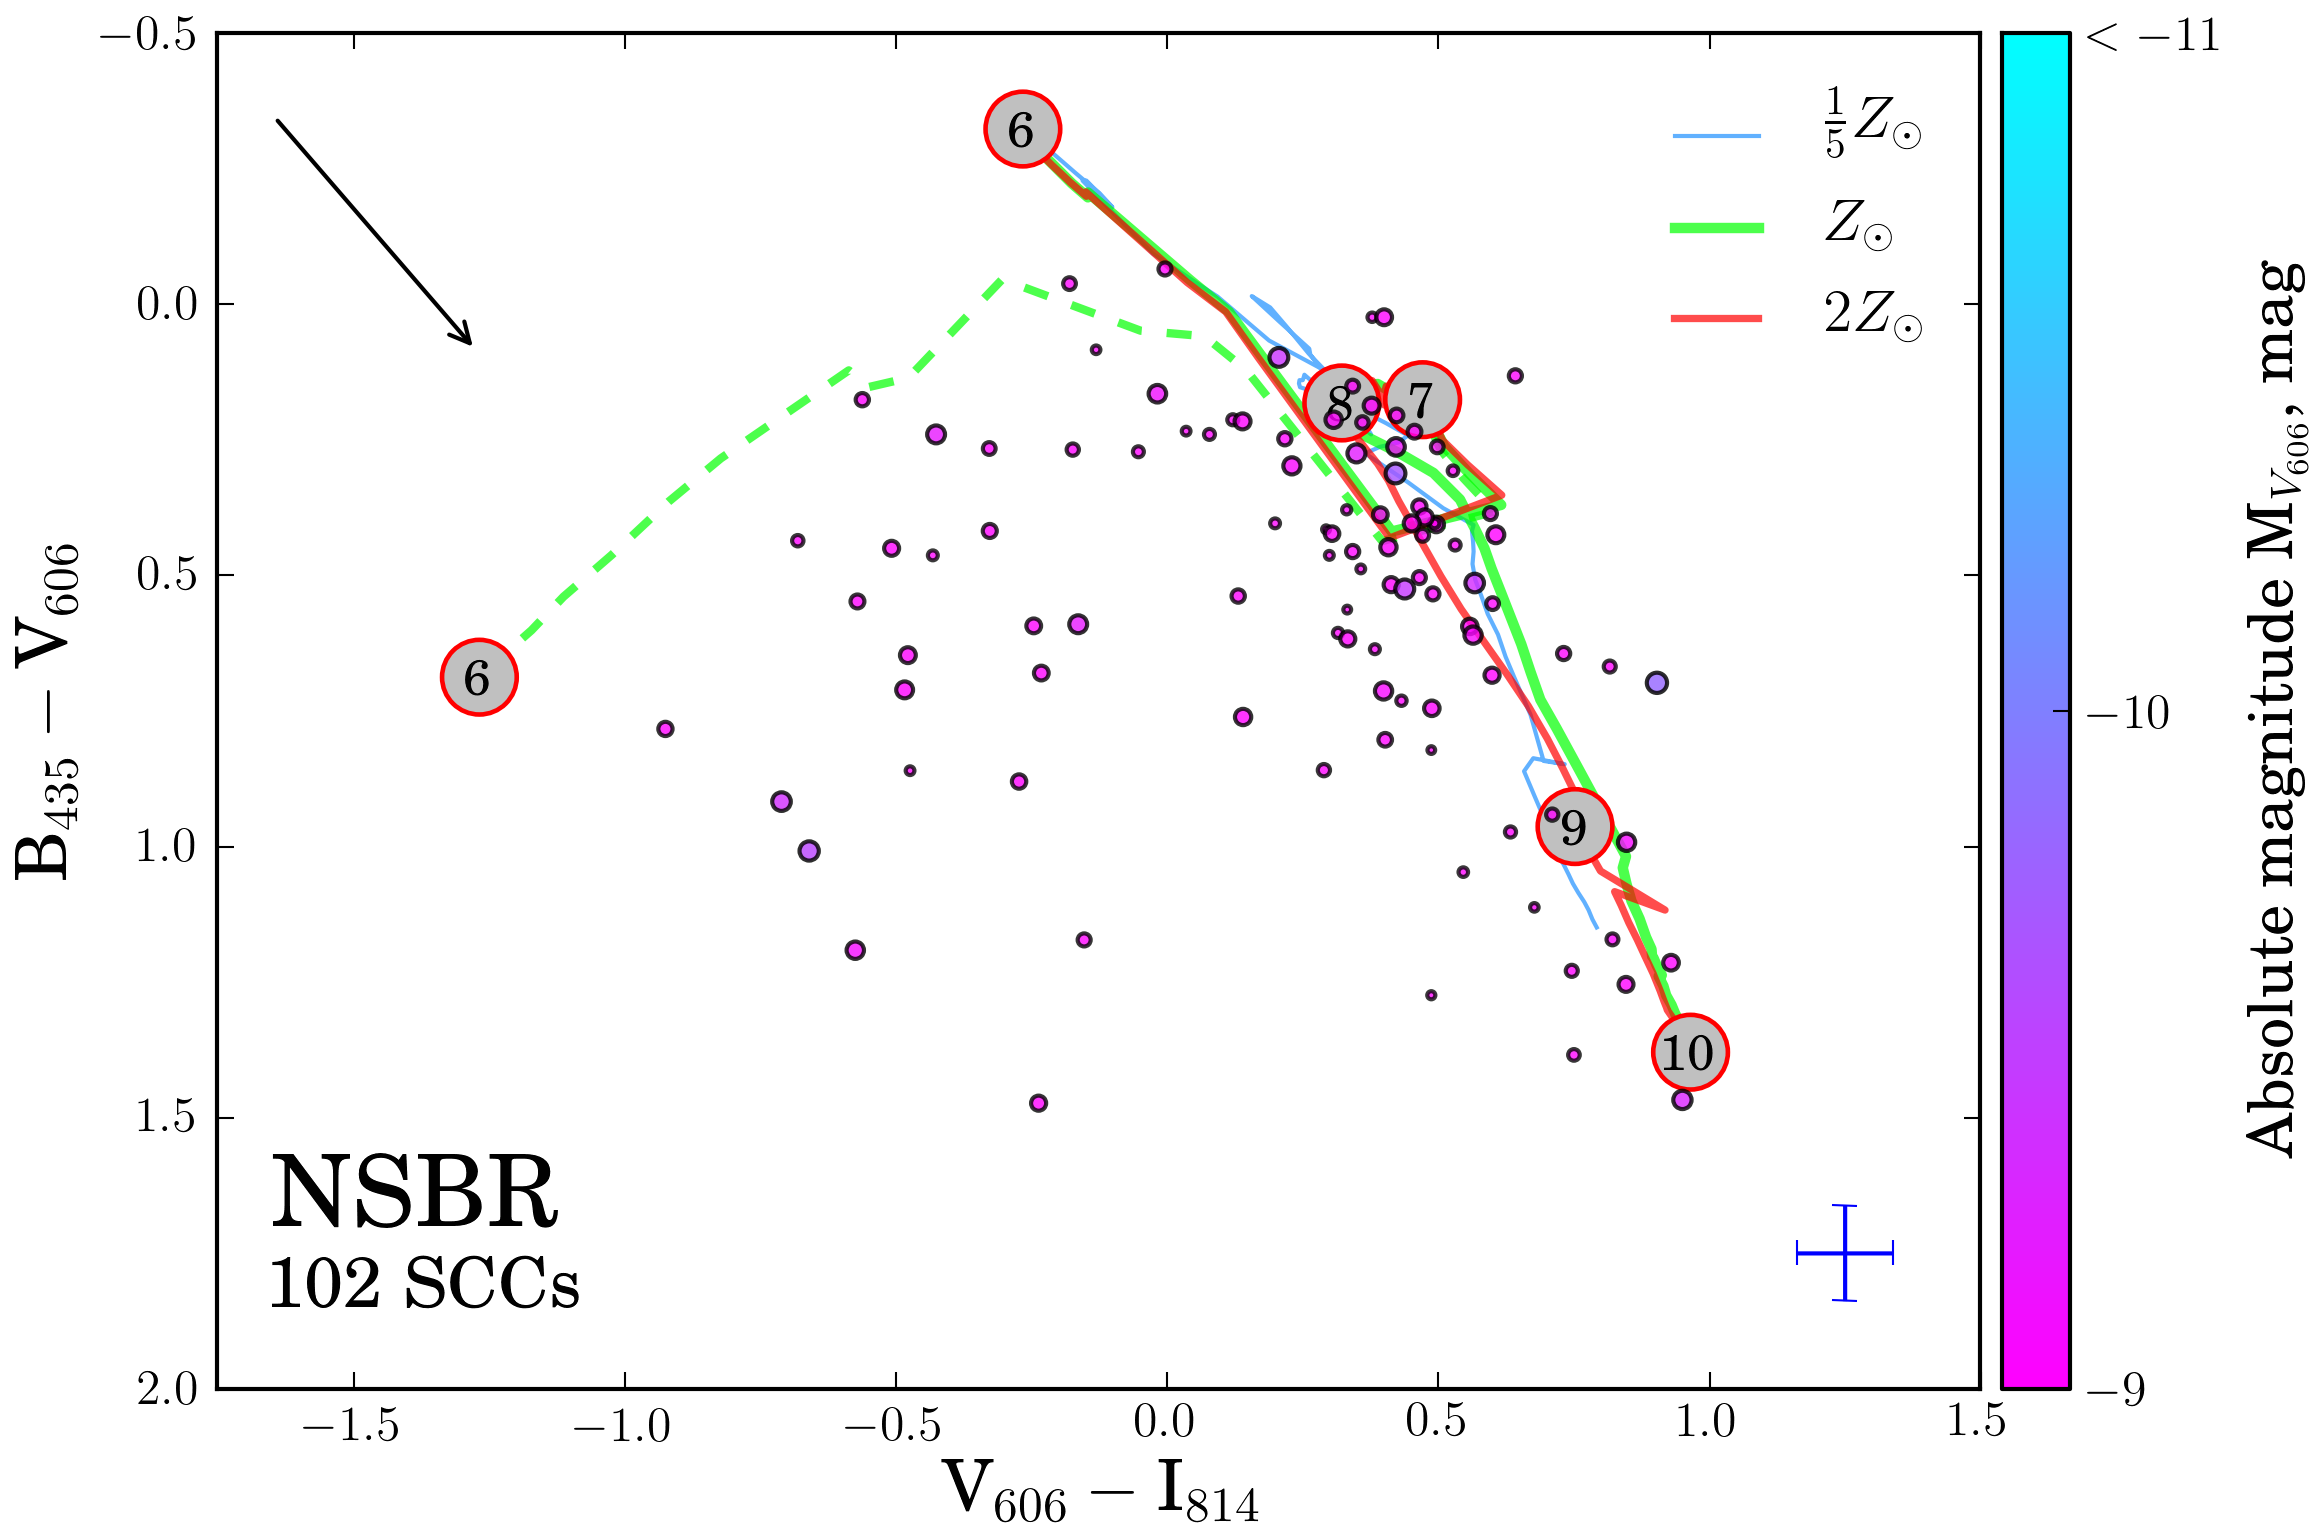
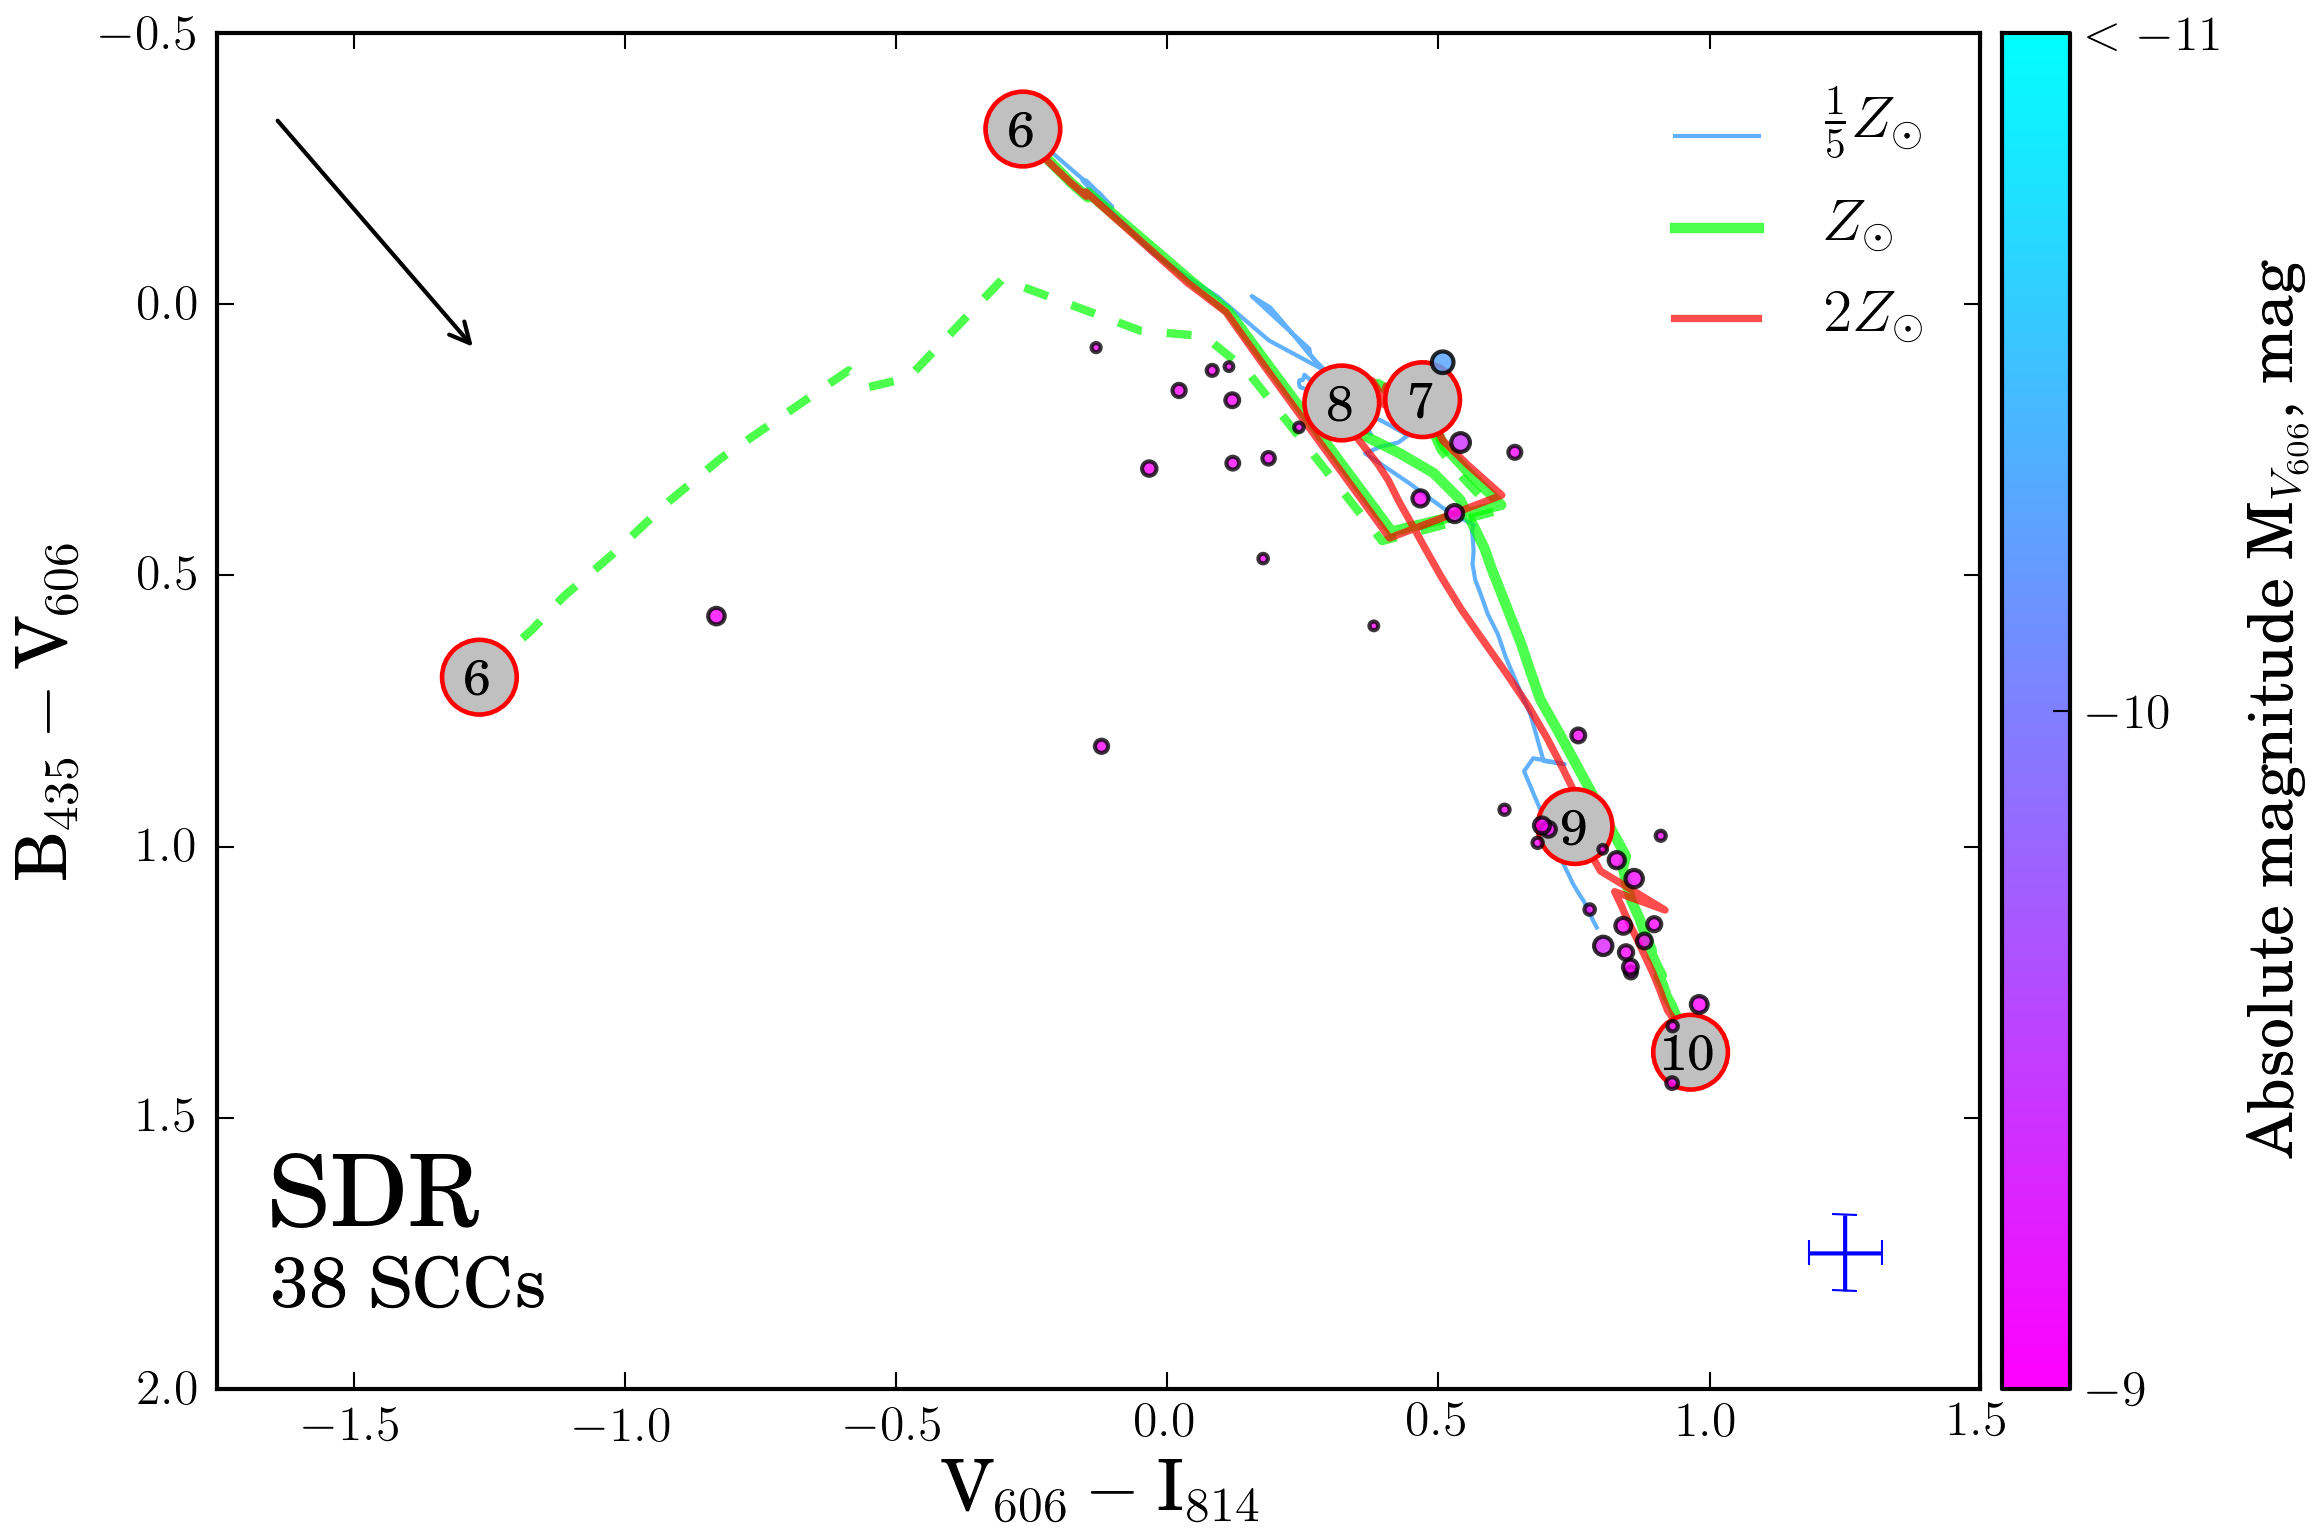
HCG 92 is an ideal system to study populations of star clusters forming outside of galaxies. In particular, there are two areas of extragalactic clusters labelled as the Northern Star Burst Region (NSBR) and the Southern Debris Region (SDR). The NSBR has a SCC population that spans a wide range of ages, from young SCCs of a few Myr to very old globular clusters of over 10 Gyr old. This region includes two intersecting tidal arcs, a byproduct of the interaction between 92B (NGC 7318B) and 92D (NGC 7318A). The young SCs detected in the region were likely formed during that interaction. The presence of a significant number of intermediate-age SCCs (ranging from 100 to 500 Myr old) could be indicative of earlier interactions involving 92C (NGC 7319), NGC 7320C, and perhaps 92D (Moles et al., 1997; Xu et al., 1999). And finally, there are a few old star clusters likely deposited into that region through gravitational interactions between the galaxies.
Consideration of the SCC population of the Southern Debris Region, on the other hand, paints a bit different picture. To begin with, there are not as many very young (1 to 8 Myr) SCs in that region. Also, there is a well-defined separation between two groups of SCCs in the colour-colour plane, one group consists of clusters that are approximately 10 to 100 Myr old (unfortunately, it is impossible to establish more precise ages based only on photometry) and the second group, a collection of older star clusters ranging in age from 1 to 10 Gyr. Interestingly, there appears to be a concentration of clusters with ages between 6 and 8 Gyr. Since it is highly unlikely that a galaxy interaction would specifically launch into this extragalactic region star clusters of such a limited age range, we speculate that these clusters (with ages 6 to 8 Gyr) were formed together at some location, and the population of the younger SCCs is either the latest addition or a chance projection. We consider the former as more likely explanation, and as such, SDR could potentially be the remnants of a dwarf galaxy that used up its last reservoir of gas to form these younger population of clusters. However, there are a few reasons why this might not be true. For example, the SDR region appears to extend over a large area for a dwarf galaxy, and there is no detection of extended, diffuse light consistent with a dwarf galaxy.
The spiral galaxy 92C is the largest galaxy in the group. At the same time, it has no detectable H i (Sulentic et al., 2001), which most likely was stripped during previous interactions among the group members (Moles et al., 1998). Unless the galaxy manages to acquire more cold gas, the intermediate age (100 to 500 Myr) population of SCCs is likely the trace of the last epoch of star formation in that galaxy.
4.5.2 Globular Cluster Candidates
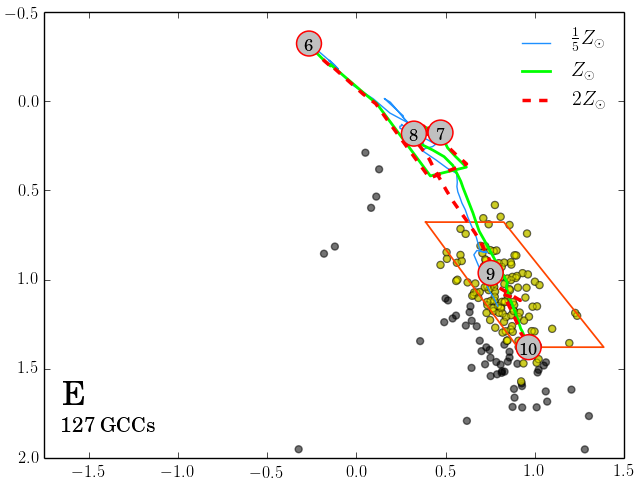
For the GCC population in SQ we focus on three regions (panel (c) of Fig. 18). One region is associated with the elliptical galaxy 92E (NGC 7317), another one with the spiral galaxy 92C (NGC 7319), and the last one with the interacting pair 92B and D (NGC 7318B and A). For the last system, we expect that a large fraction of GCCs belong to 92D: first, because it is an elliptical galaxy, and, secondly, it is more massive than the spiral 92B (Table LABEL:tab:HCG_info). According to our estimates of the GCC system extent, the GCC systems of 92C and 92BD overlap. Moreover, the overlap adds virtually no GCCs to 92BD region, whereas the expected system extent of 92C adds an appreciable part of the eastern tidal feature of 92BD.
According to GMM statistics, the distribution of all GCCs in SQ has detectable bimodality (panel (b) of Fig. 18). However, the individual distributions for each galaxy/region do not have well defined bimodality, with the possible exception in the case of 92C. However, this galaxy does not have a large enough number of GCCs for statistically significant analysis. If we look at the unimodal peaks of , and , for the GCC systems in 92C, 92BD, and 92E, respectively, we notice that these values are a bit larger (less negative) compare to the average value of Galactic GCs, the bulk of which have metallicities around [Fe/H] (Murdin, 2001).
4.6 Bimodality of GCC Population of Elliptical Galaxies
Above we discussed bimodality in the galaxies from our sample and the results are outlined in Table 1. We compare our results with those in the literature, in particular, the bimodality analysis in the sample of 92 elliptical galaxies in the Virgo cluster (Peng et al., 2006). The authors found a relationship between the GCs colour distribution modality and absolute magnitude of the host galaxy. According to their fig. 5, which plots the colour distributions of GCs in seven bins of host galaxy magnitude, for the luminous HCG 42A we expect a well defined bimodality, whereas with the much lower luminosity of HCG 59B, only a weak bimodality is expected. Given that we observe only of the total GC population in that galaxy, it is not surprising that we can not confirm bimodality of GC distribution. Thus, our findings compare well with the conclusions of Peng et al. (2006): HCG 42A has a well defined bimodal distribution and the colour distribution of HCG 59B GCCs is unimodal. The question of the nature of colour distribution for HCG 92E is still open. The luminosity of HCG 92E, according to Peng et al. (2006), corresponds with a relatively well defined bimodality. However, we currently do not posses the required number of GCCs to definitively answer that question. As it is, with the currently observed number of GCCs, HCG 92E has a unimodal distribution.
4.7 Star Cluster Populations in Compact Groups
Here, we relate the star cluster populations to the CG evolutionary sequence proposed by Konstantopoulos et al. (2010, see their fig. 1). Upon inspection, the SCC populations of different group types have qualitative differences. Specifically, the population of HCG 31 (panel (d) of Fig. 6), classified as a Type I group (gas-rich and dynamically young), is distinguished by a large number of young and intermediate-aged SCs. Type II groups, represented in our sample by HCG 07 and 92 (panels (b) and (e), respectively), still have a large number of young and intermediate SCs; however, a population of Myr – 10 Gyr is also well defined. For compact groups of Type III, which predominantly consist of early type galaxies, we can observe the lack of young SCs, and a significant reduction in the numbers of intermediate-aged SCs (HCG 42, panel (f)). Initially, Johnson et al. (2007) classified HCG 59 (panel (c)) as Type II group. The recent work of Konstantopoulos et al. (2013) has associated five additional dwarf galaxies with that group. The updated information on velocity dispersion and H i mass led to a change of the HCG 59 from Type II to Type III. However, based on the observations outlined above, the SC population of HGC 59 would appear to be more consistent with that of Type II groups.

These discrepancies between type classification based on the SC populations and on the ratio of H i to dynamical mass point to the issue of accuracy in measurements of the dynamical masses. In particular, it is quite difficult to accurately measure a dynamical mass of a group given only a handful of radial velocities and the projected separations between galaxies (McConnachie et al., 2008). It may be more appropriate in this case to classify the groups based on the ratio of H i to total stellar mass, which can be much more reliably measured from near-to-mid infrared photometry (Desjardins et al., 2014).
4.8 Cluster Luminosity Function
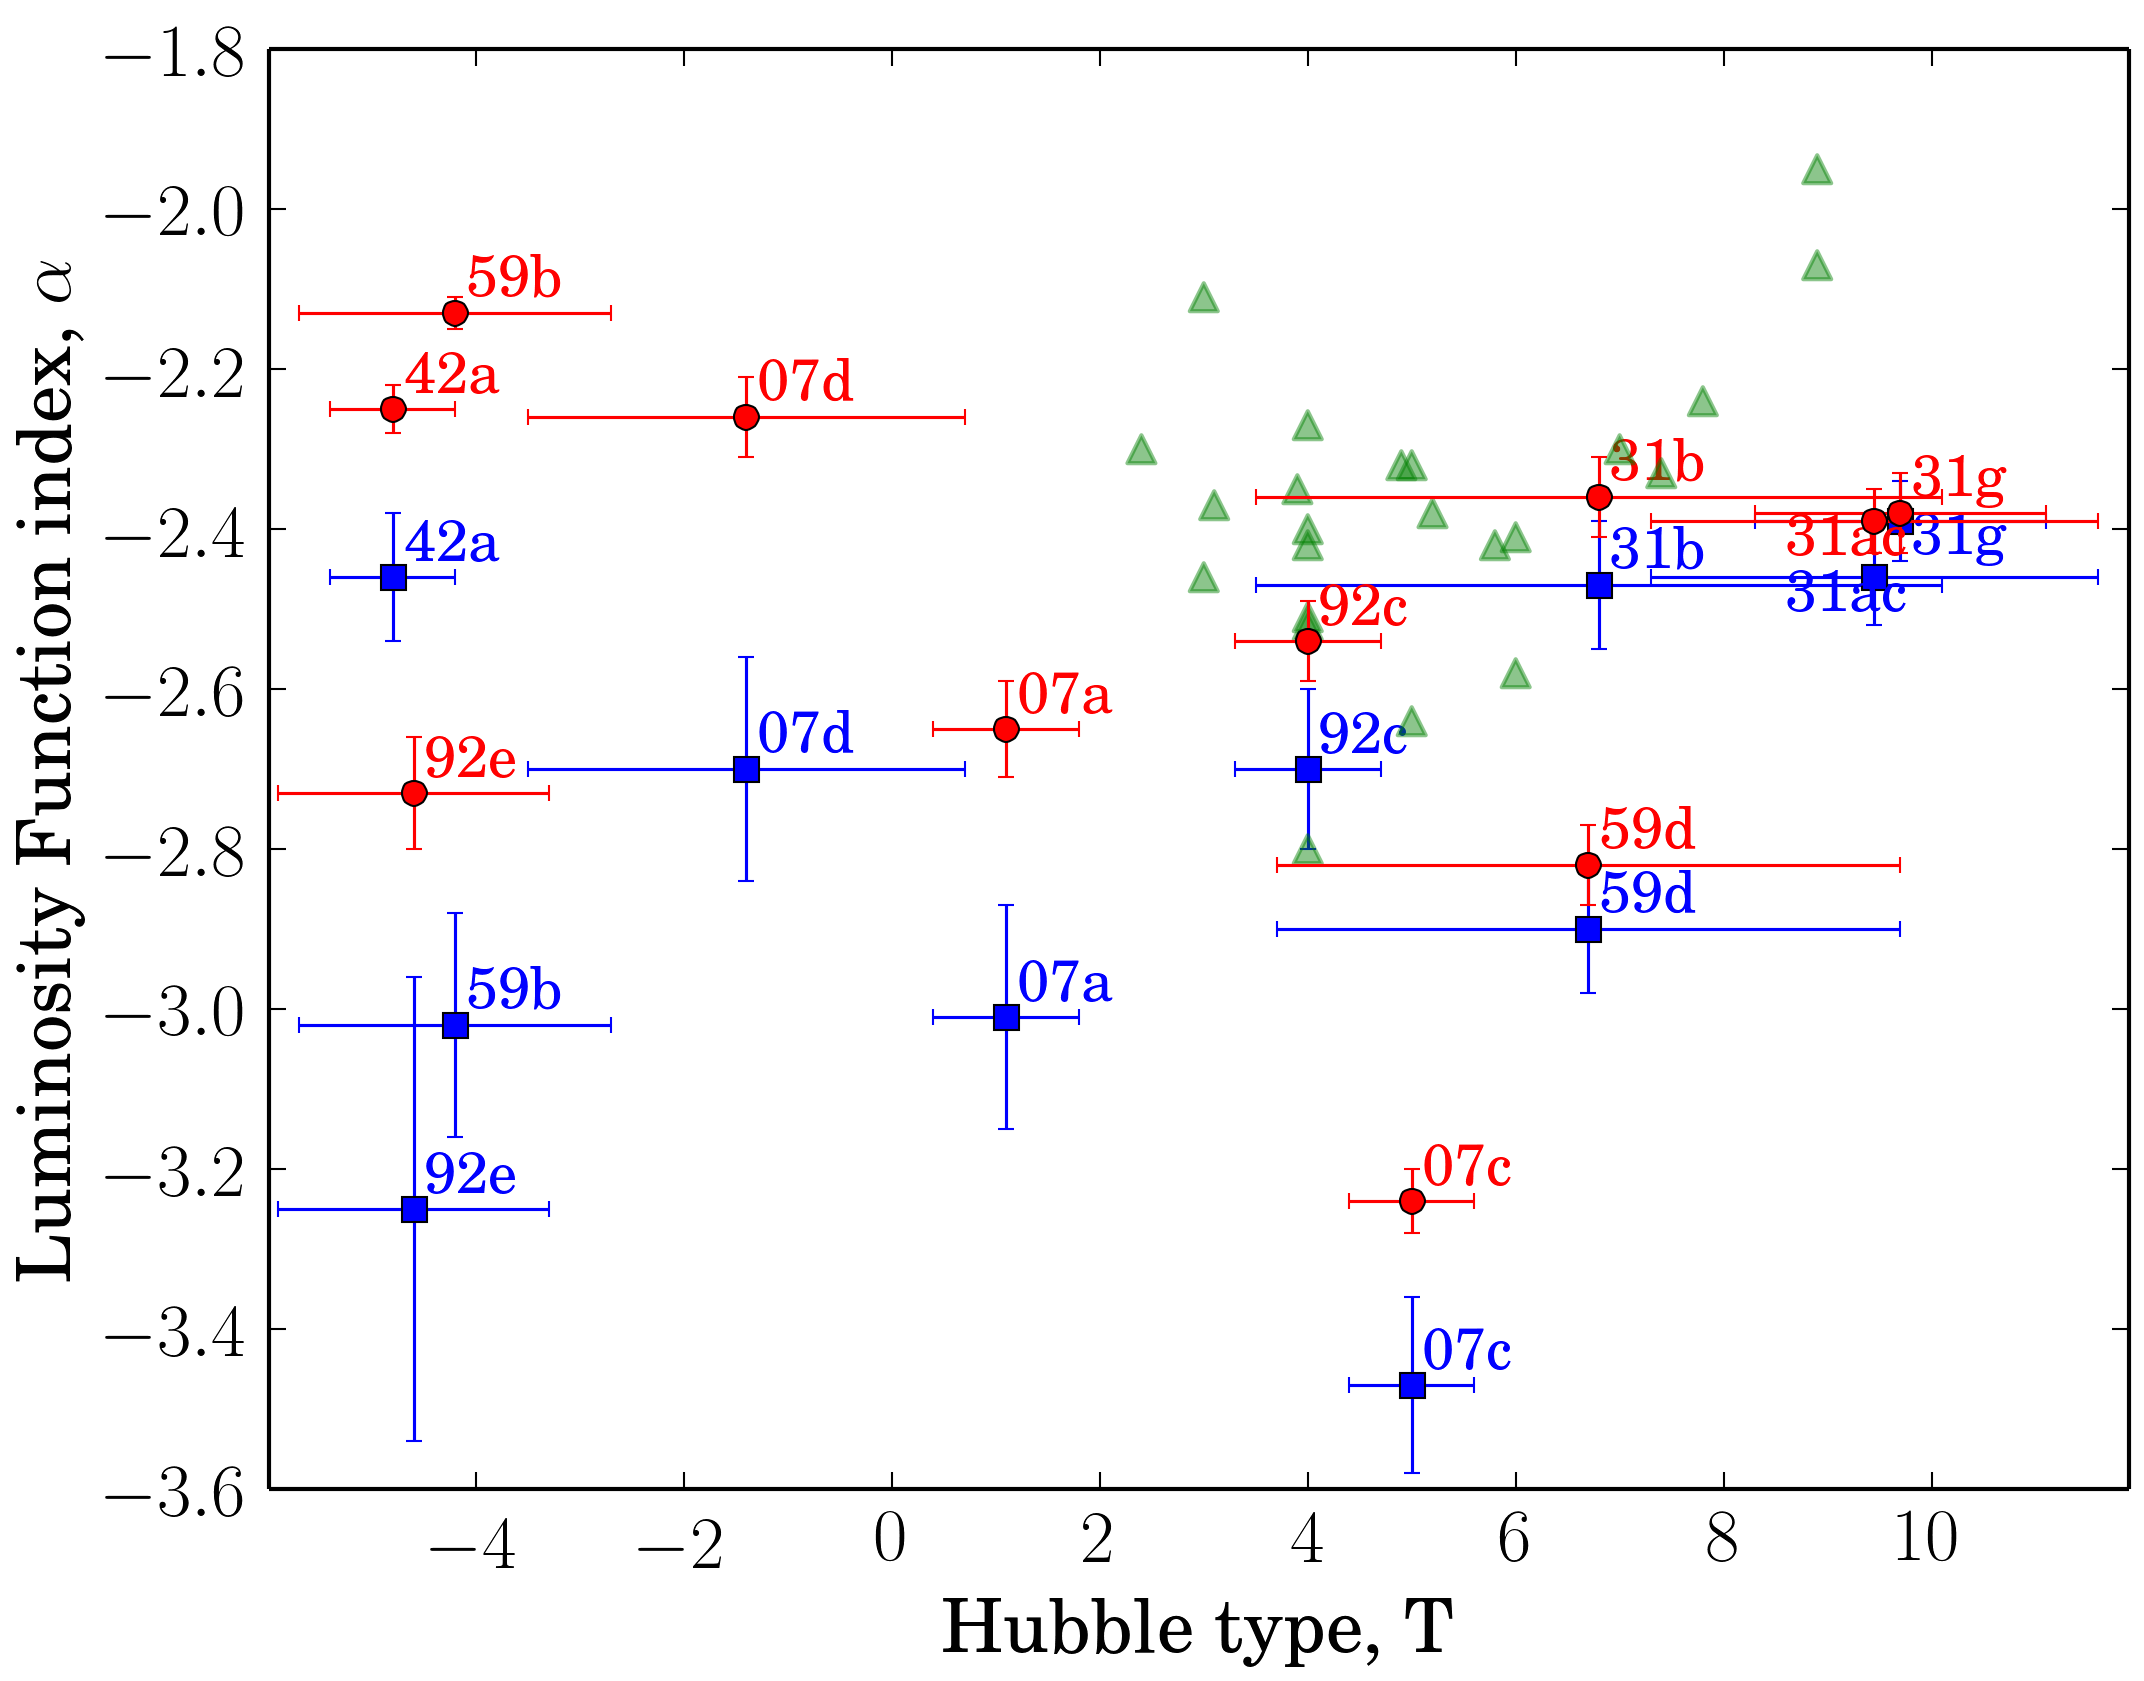
Figure 7 shows the cluster luminosity functions (CLFs) for selected galaxies from our sample. To obtain statistically significant results, only galaxies with more than 40 SCCs were used. In each plot, the CLF is shown as a cumulative distribution function of the absolute magnitude, . The solid line represents the best- fitting slope of the distribution that was determined by the least squares fit over the range covered by the line. This range was chosen manually, based on our assessment of the linear region of each CLF starting at the faint-end cutoff. The dashed line represents the best- fitting slope over a common range for all CLFs, from mag to mag. The slope is for a power-law distribution index from as . The overall range of the indices (from here on we are using slopes fitted to the custom ranges) for CG galaxies in our sample is from to (see Table 2 for all the numbers). Figure 8 represents a plot of the LF index as a function of Hubble T-type. For comparison, on the same figure, we overplot the data for 20 nearby star-forming spiral galaxies, which span Hubble T-types from 2 to 9, obtained from Whitmore et al. (2014). As can be seen, our results do not reproduce the shape of the LF index distribution of Whitmore et al. (2014). Moreover, it appears that no significant correlation between and T can be observed.
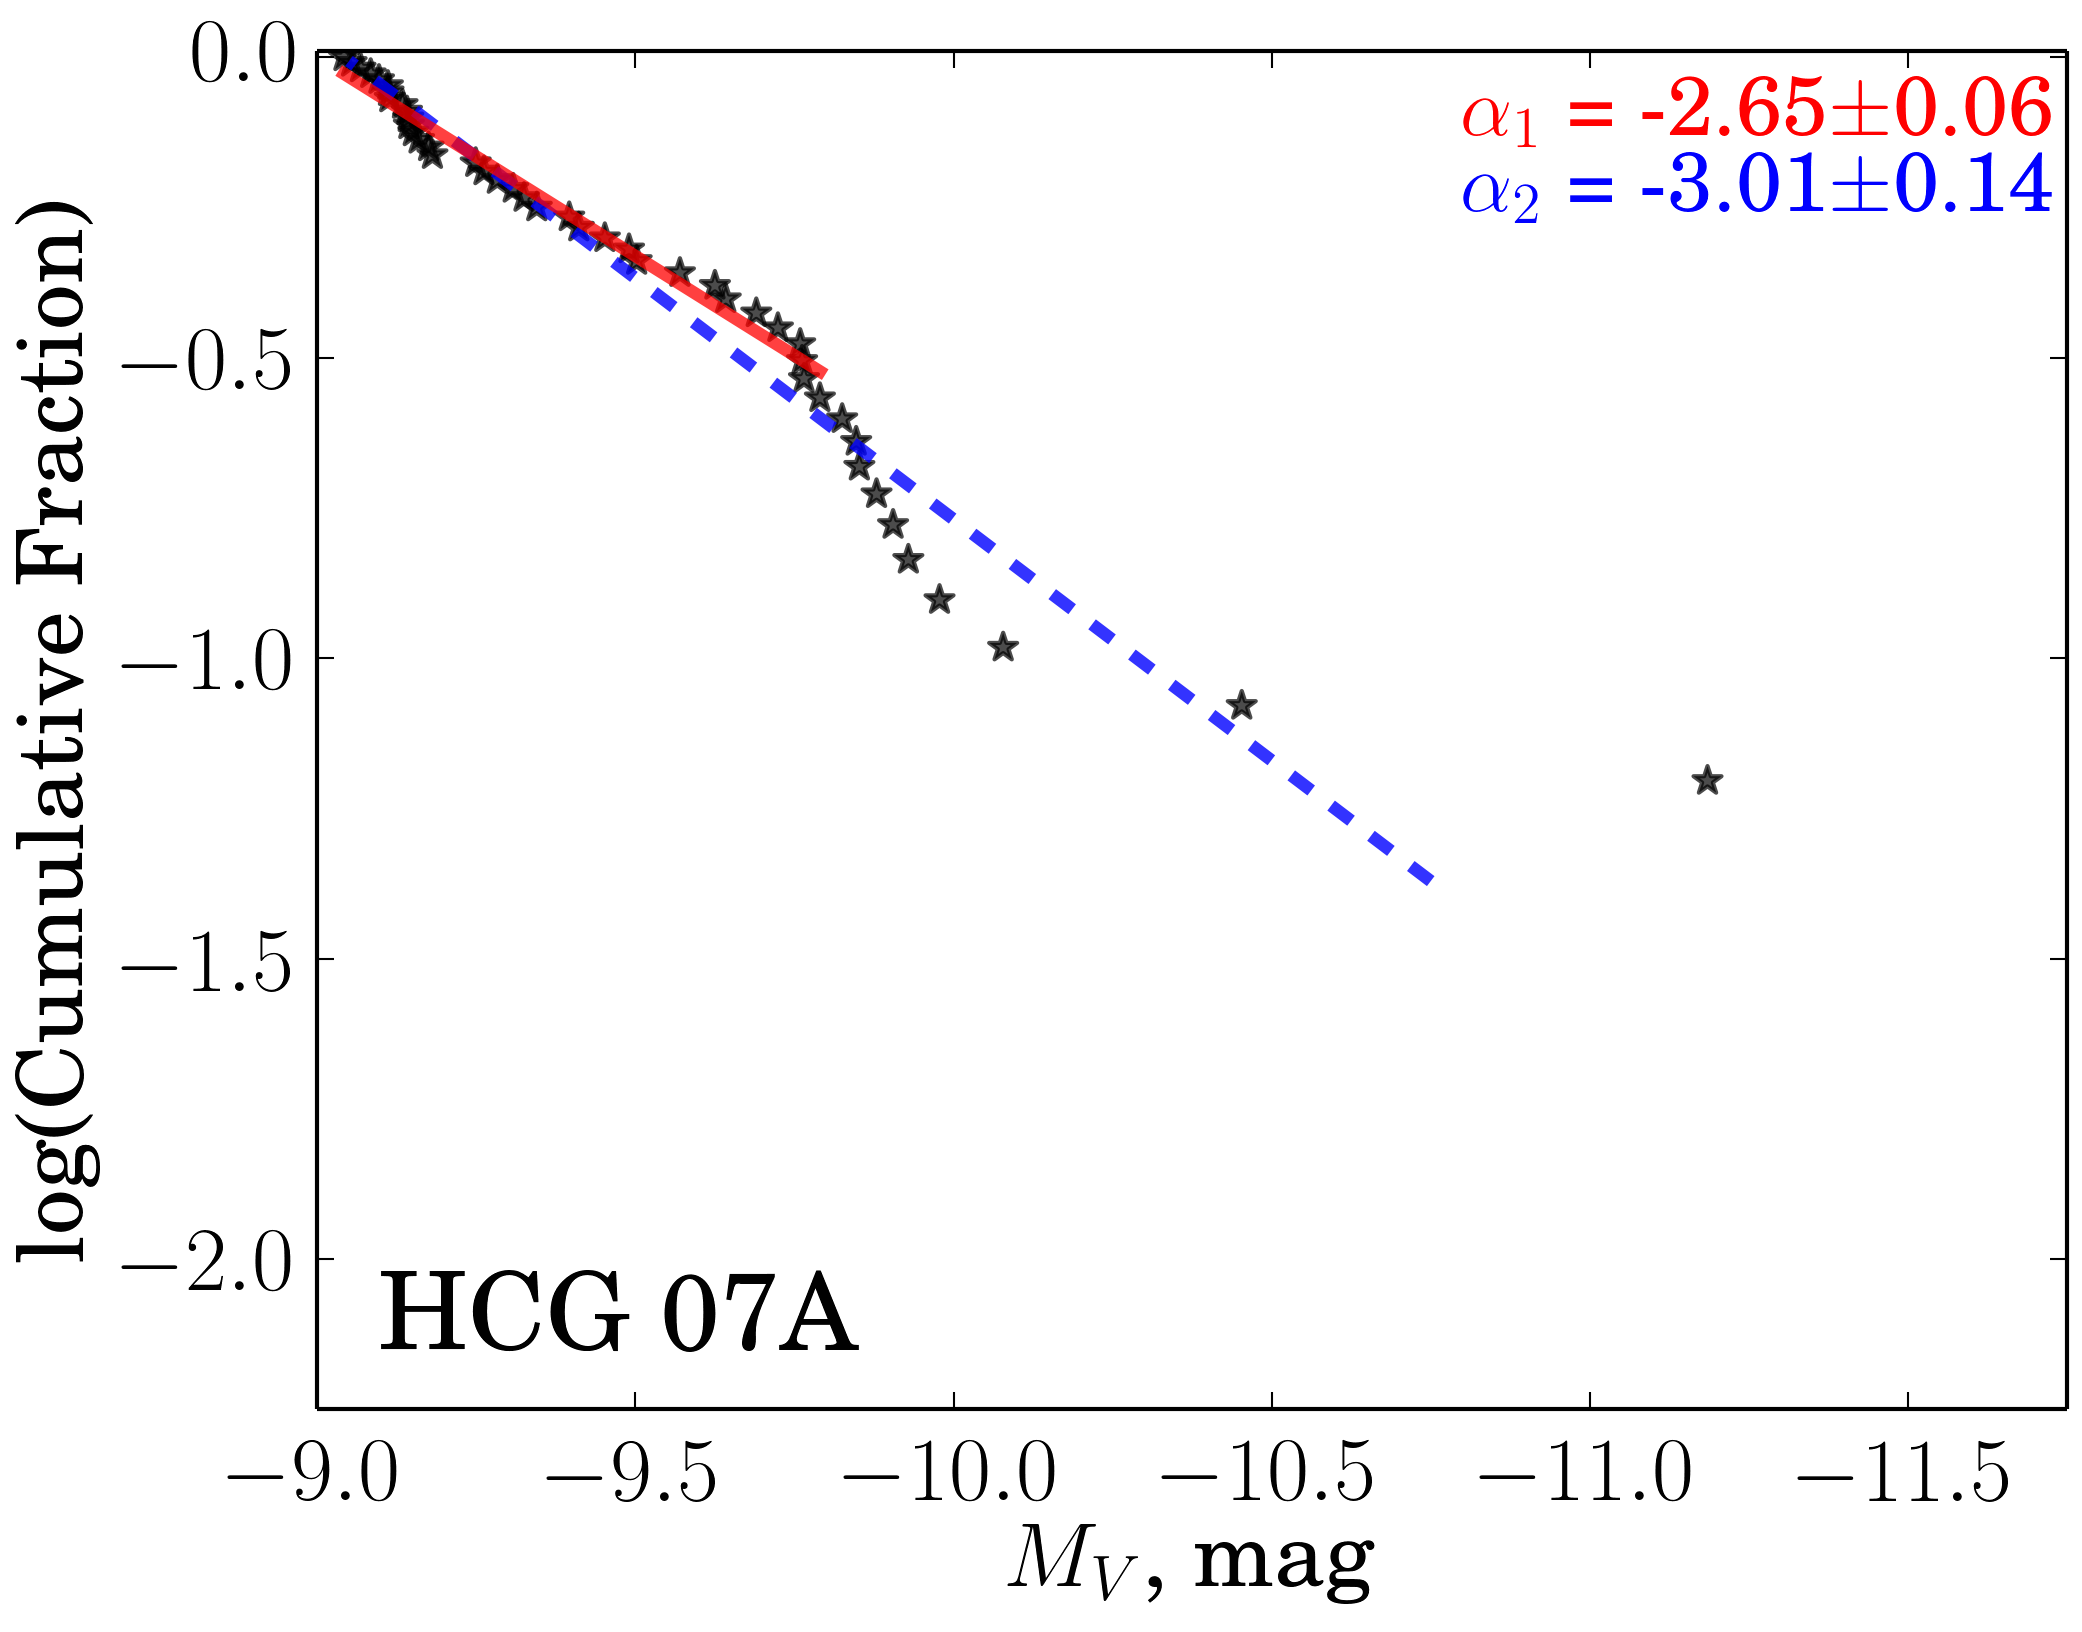
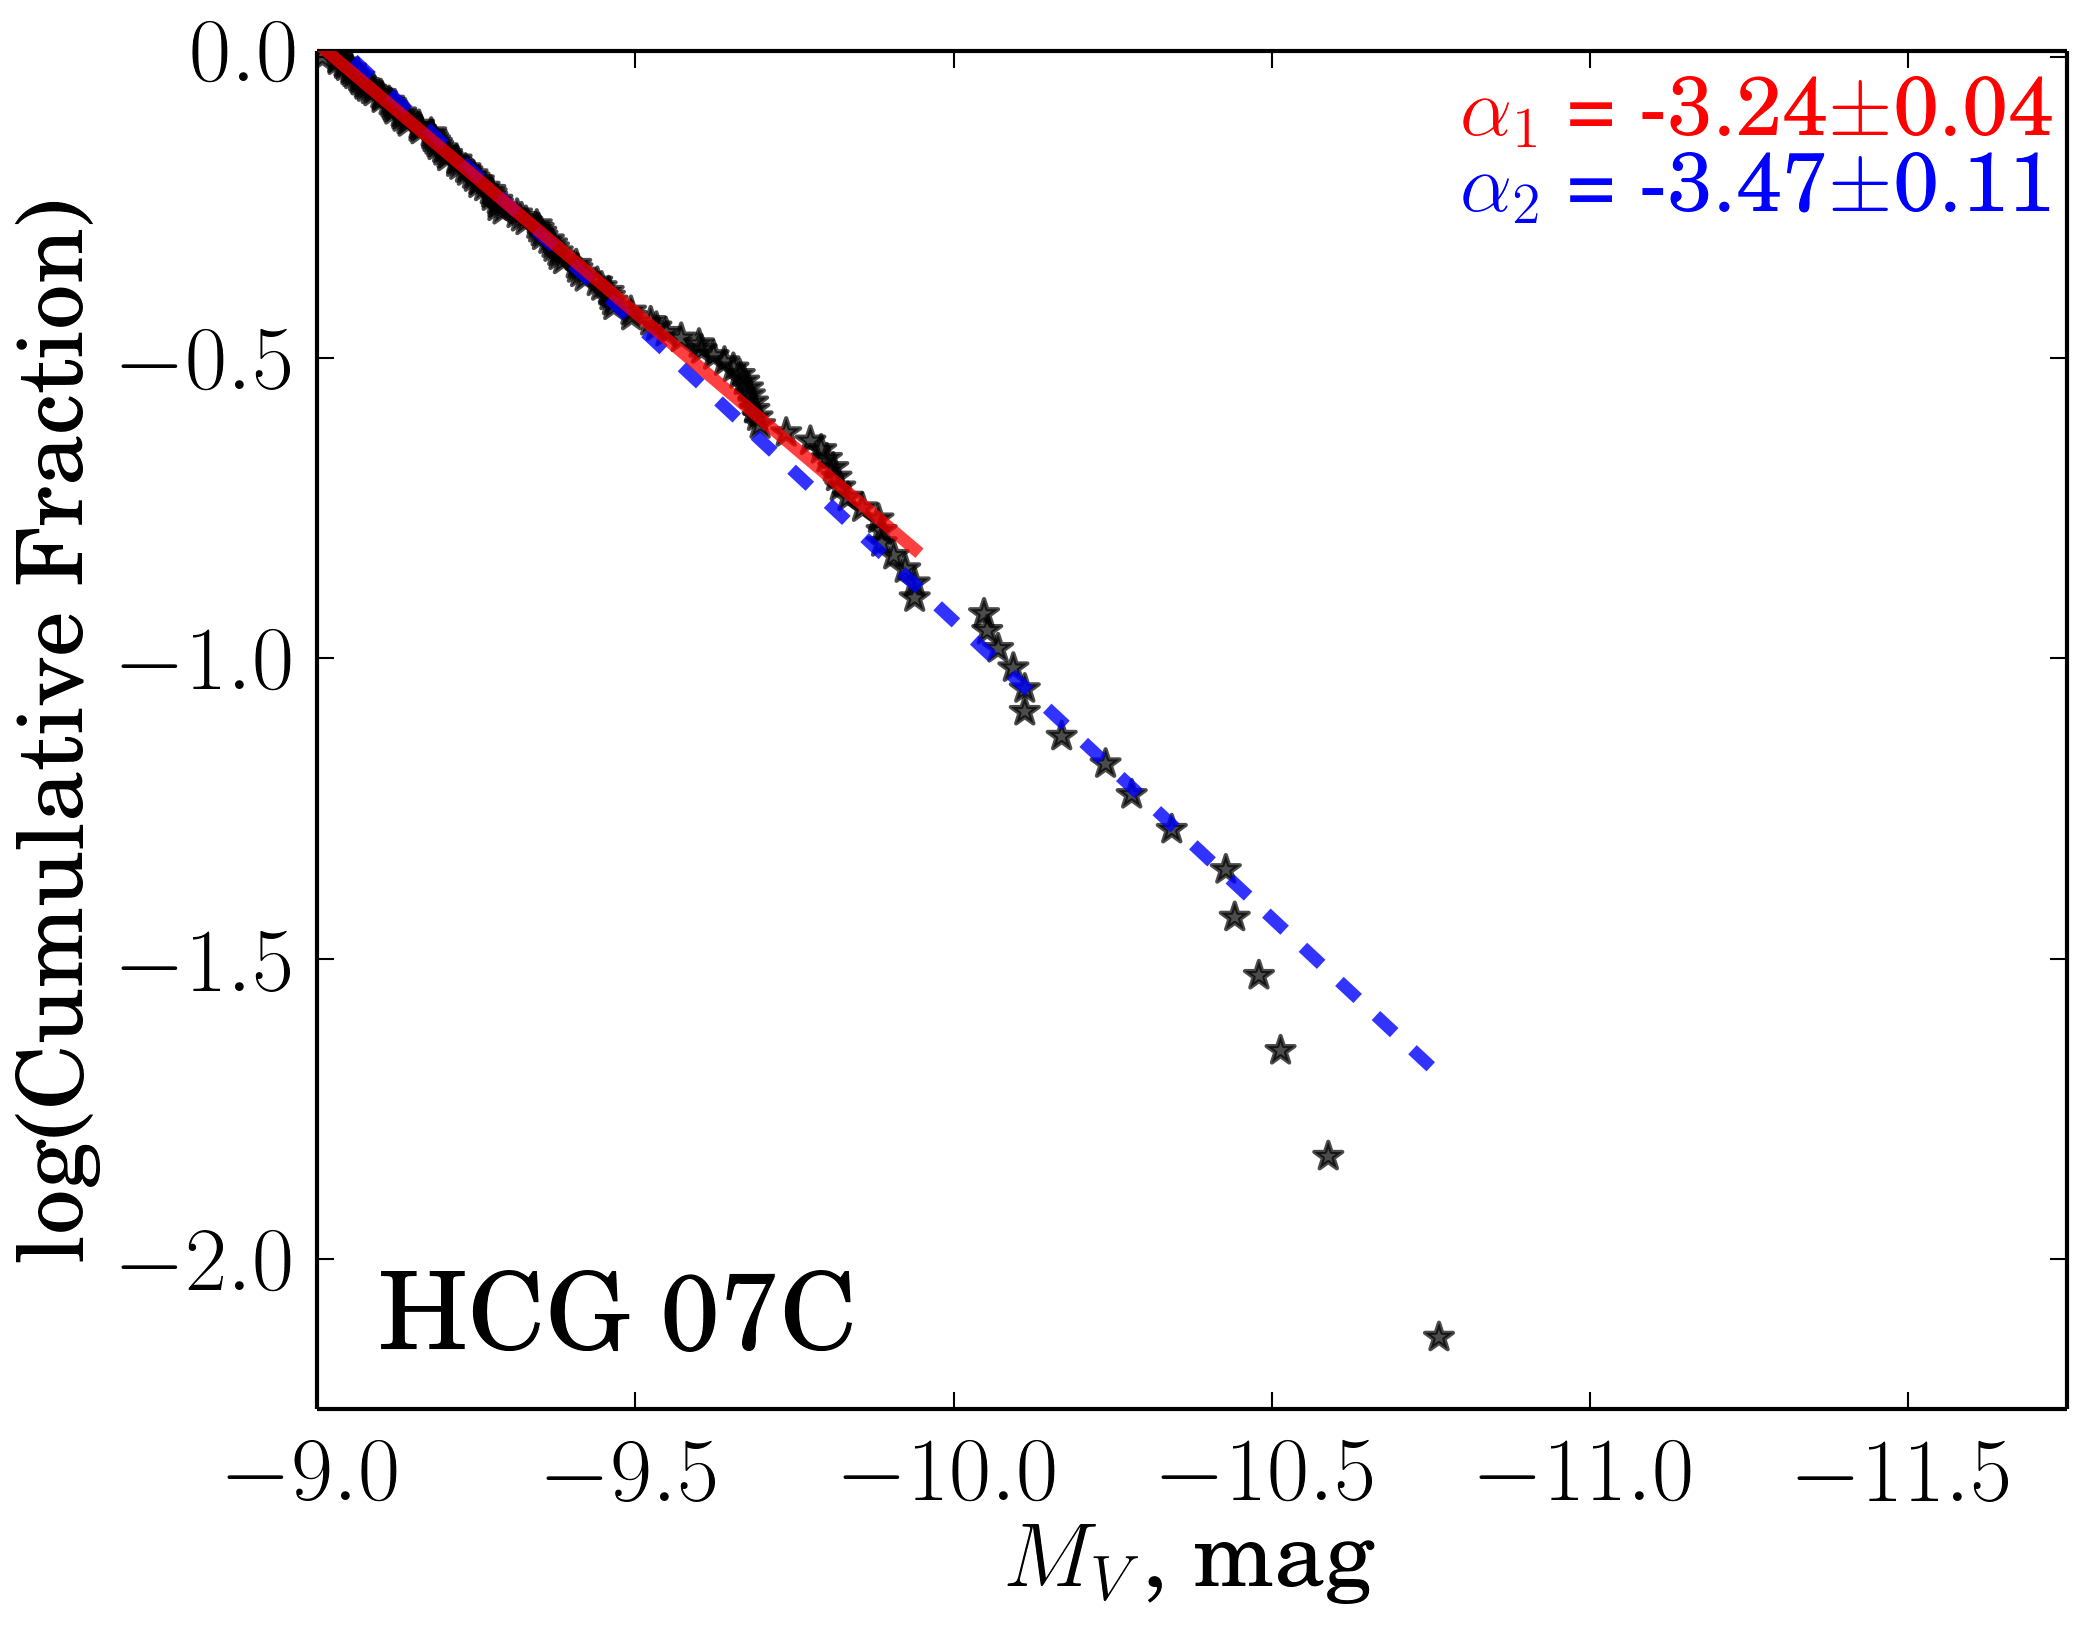
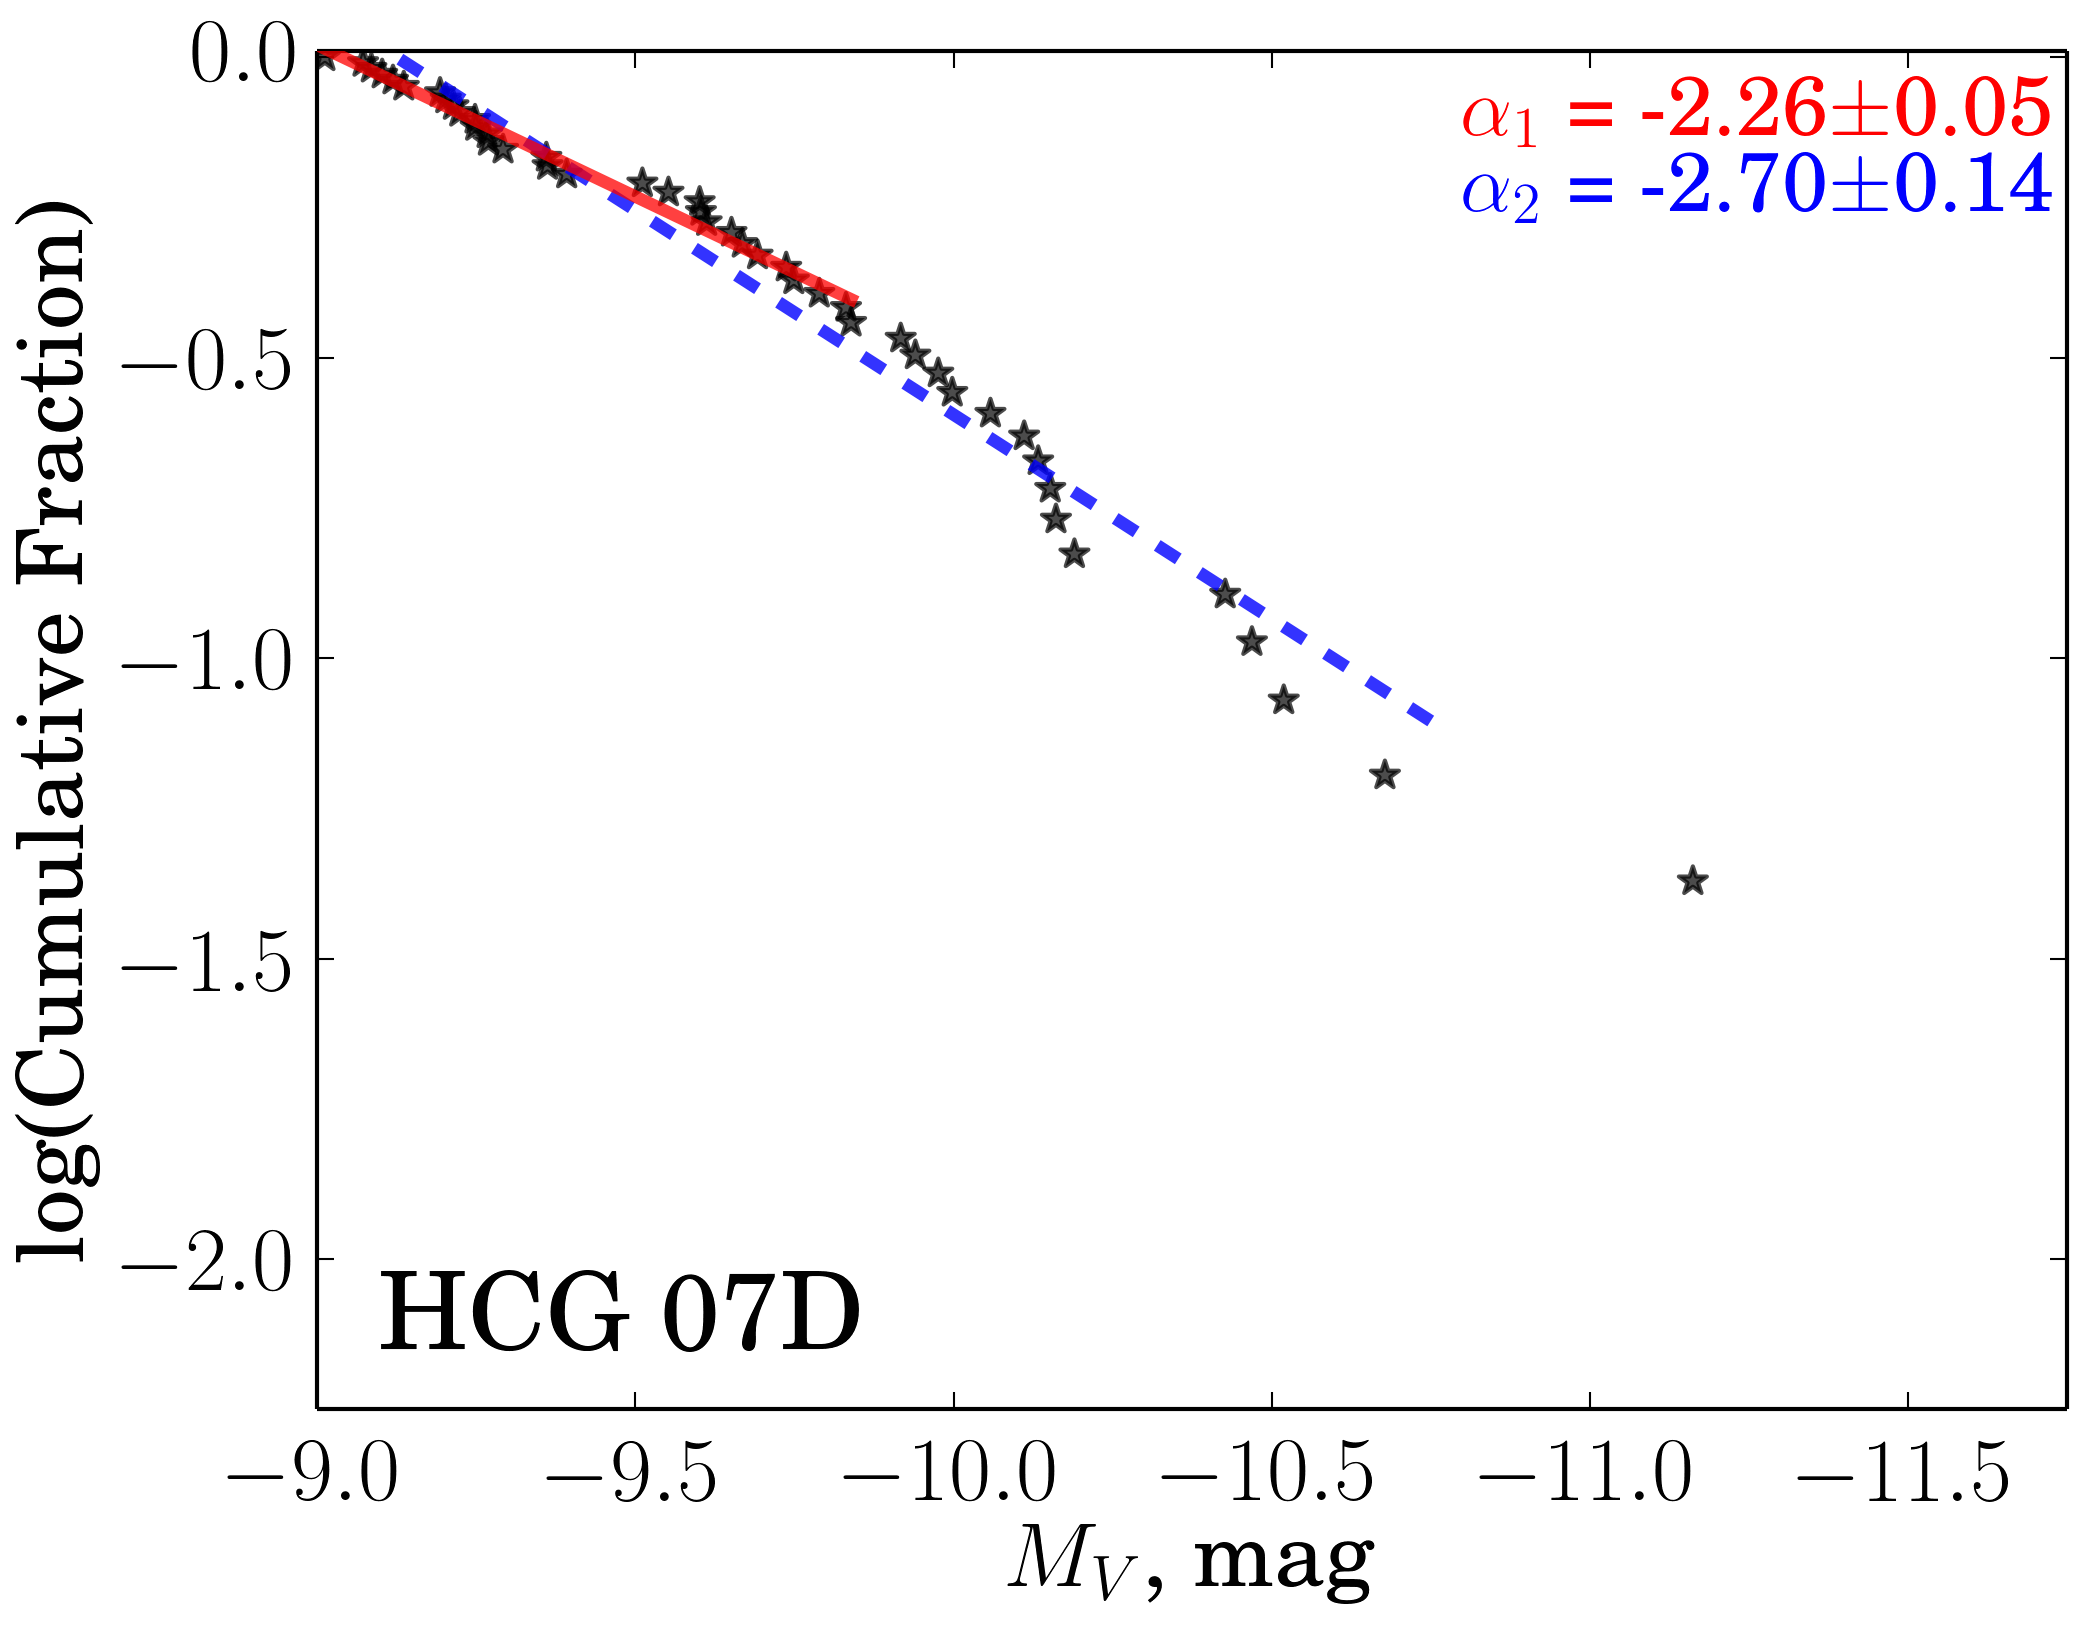
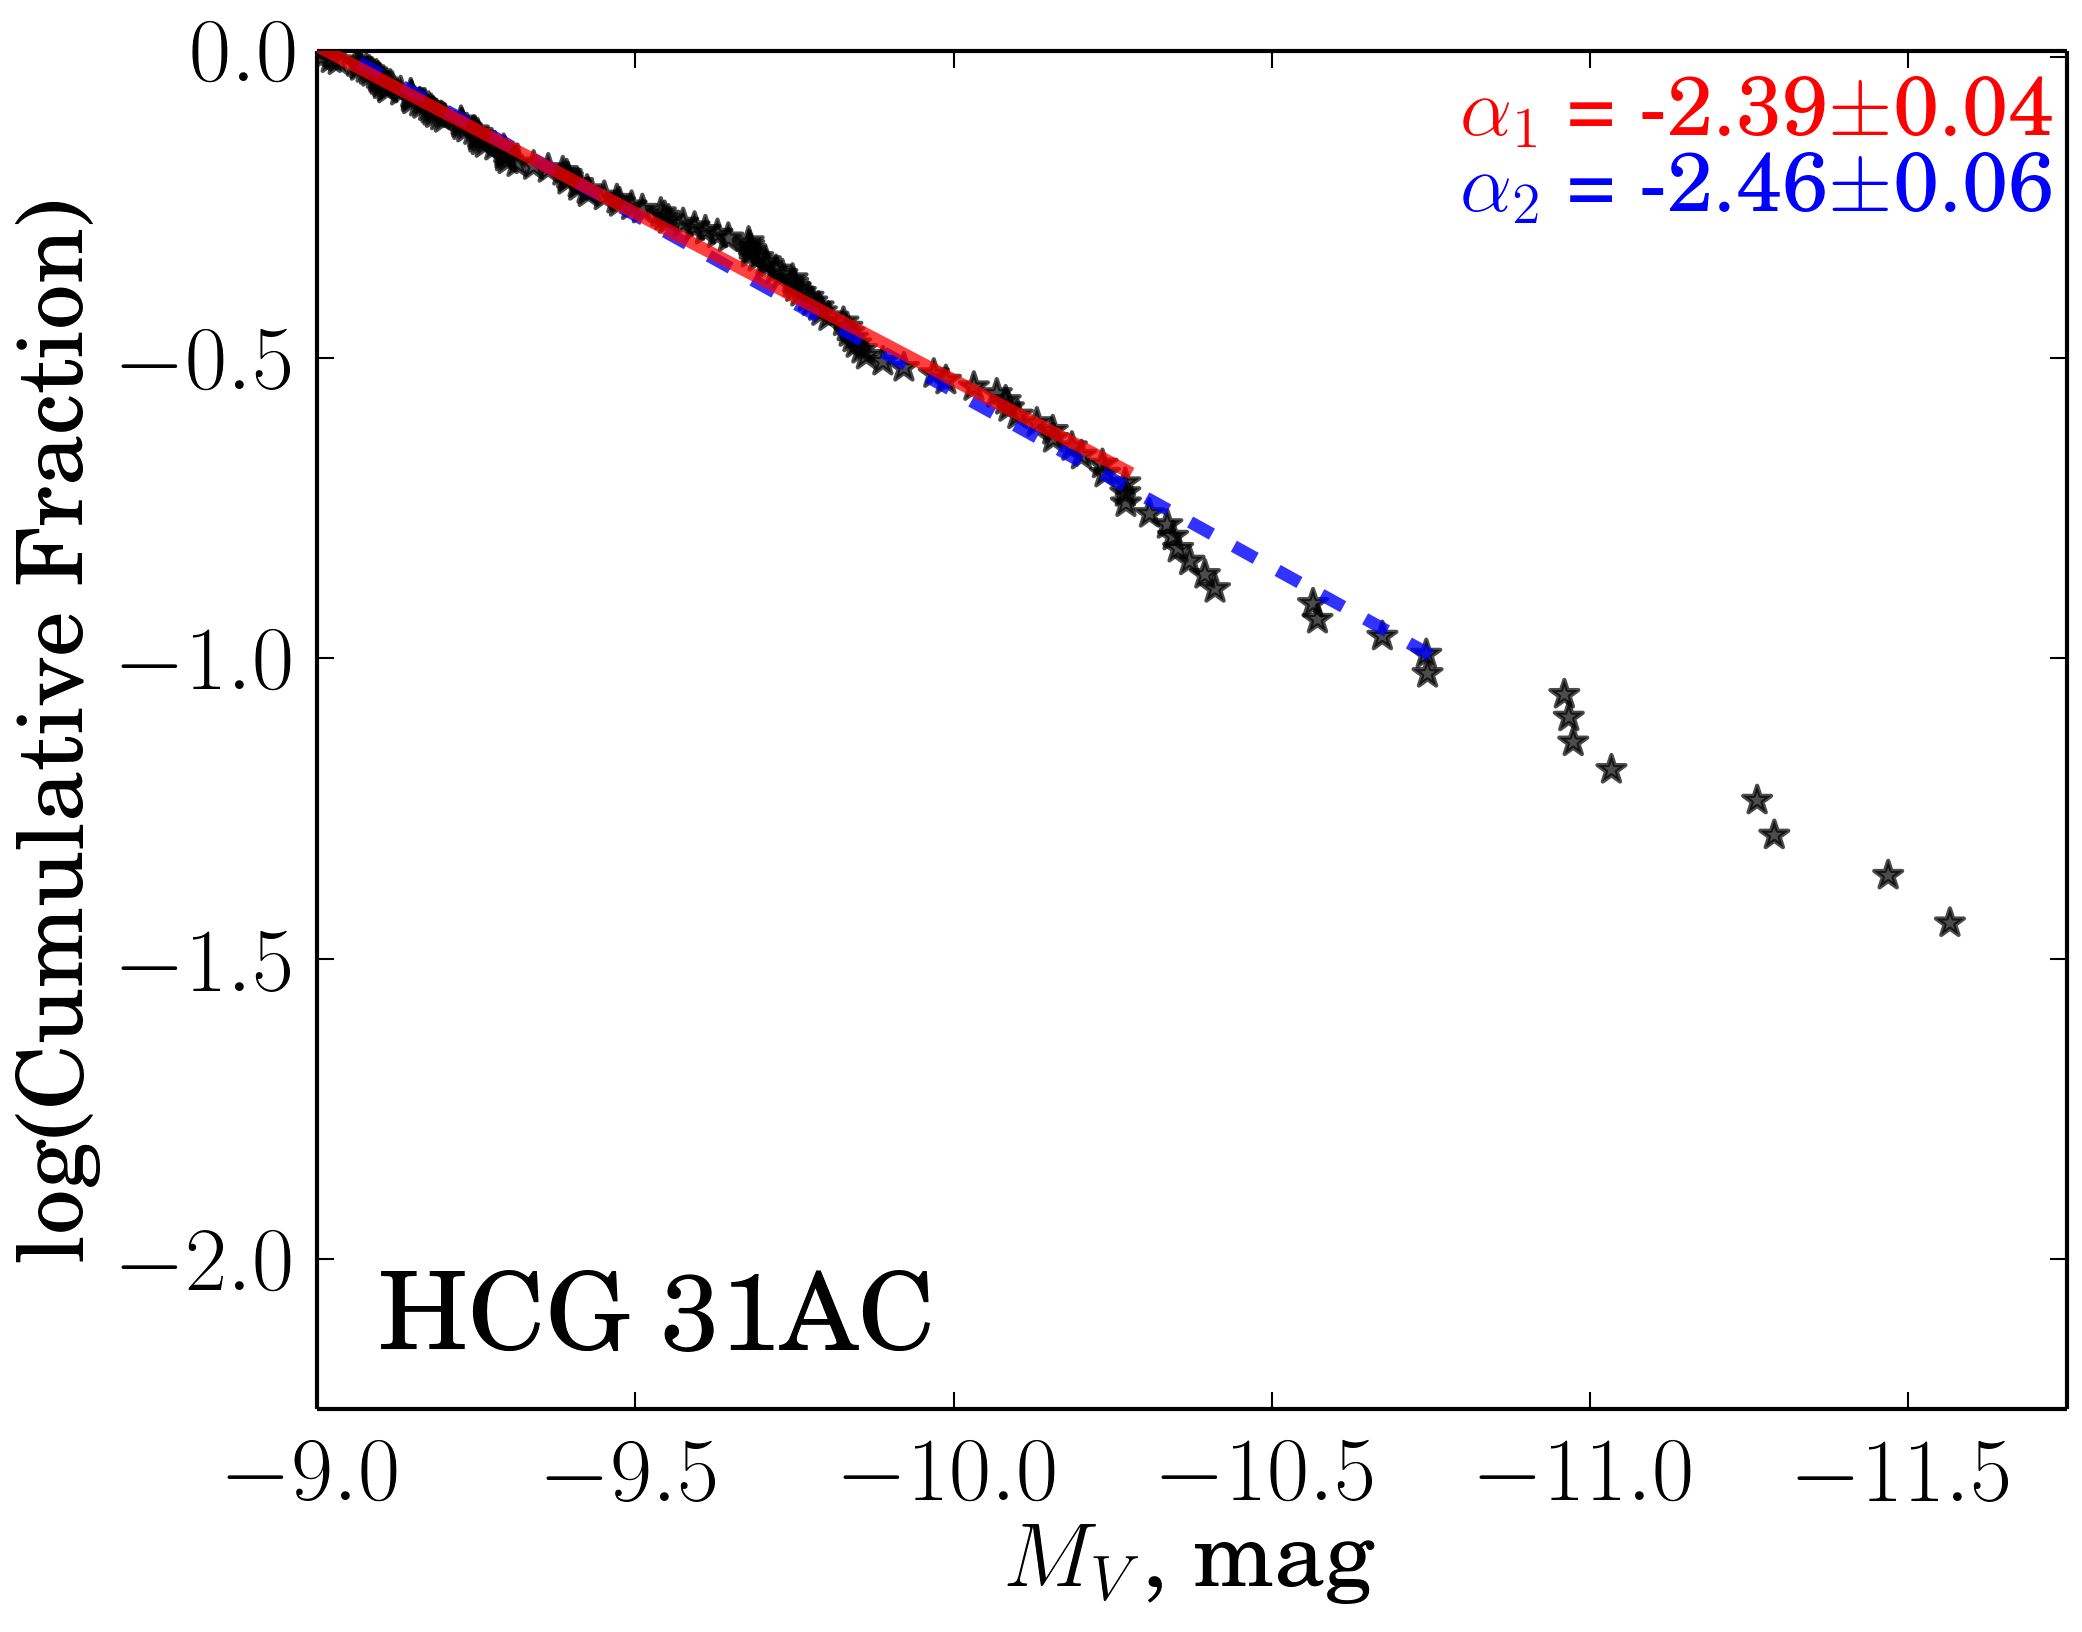
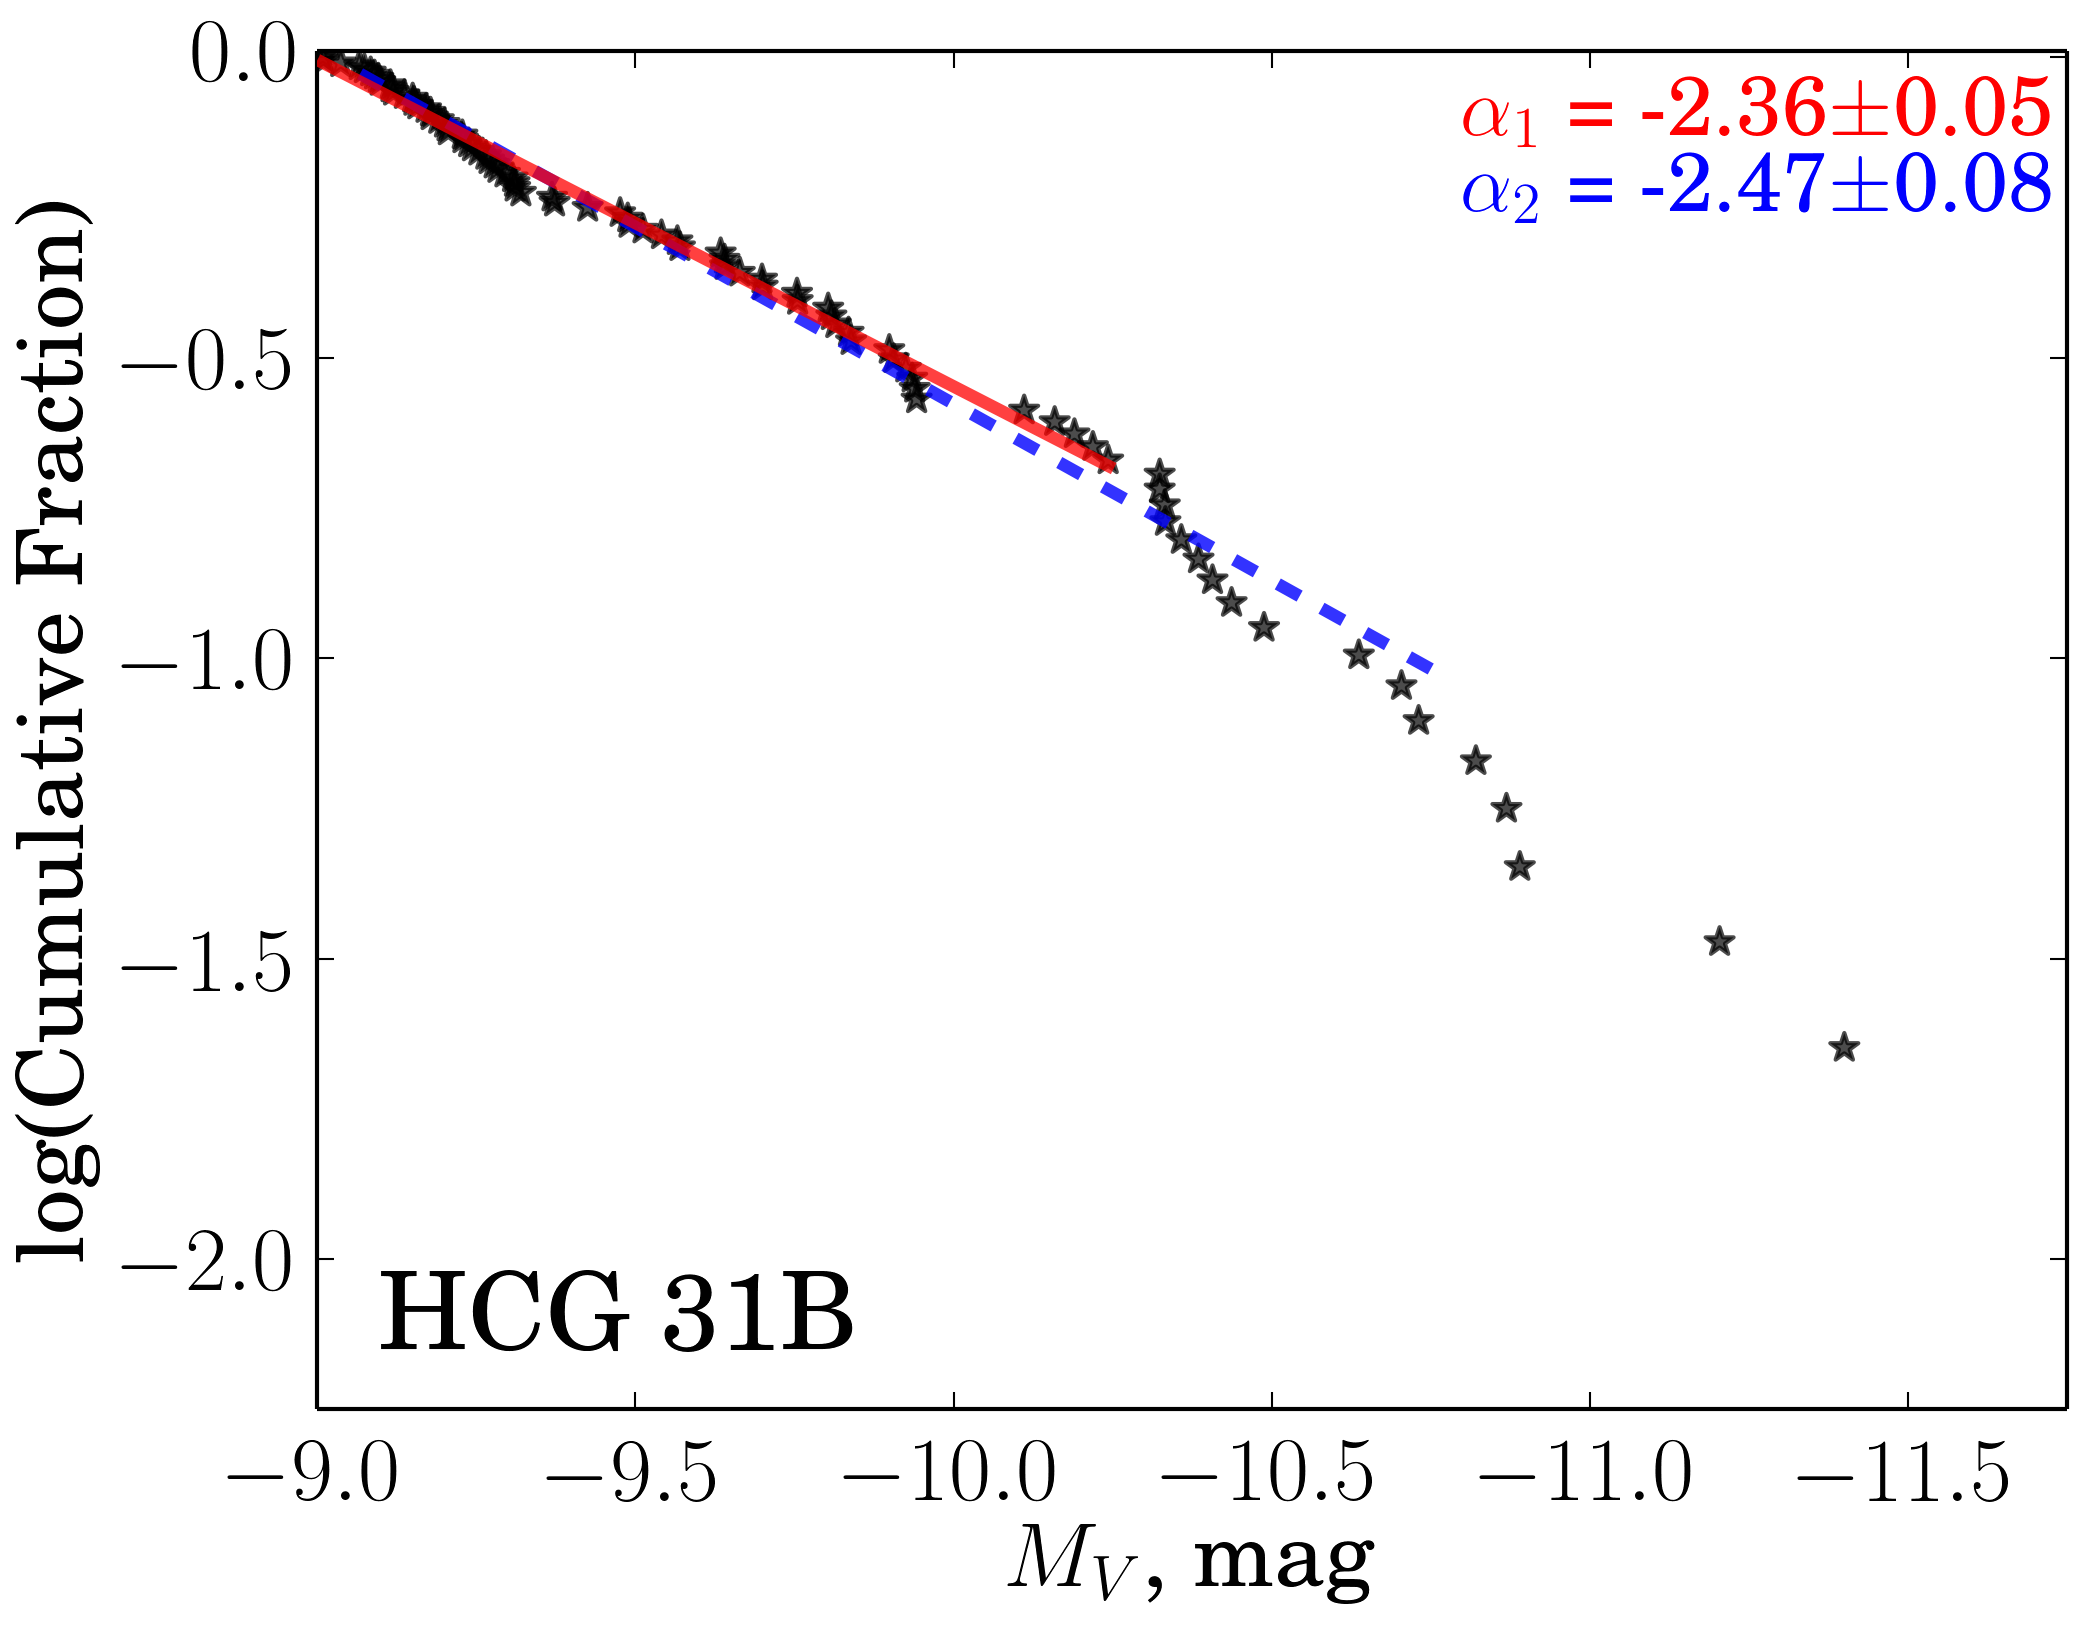
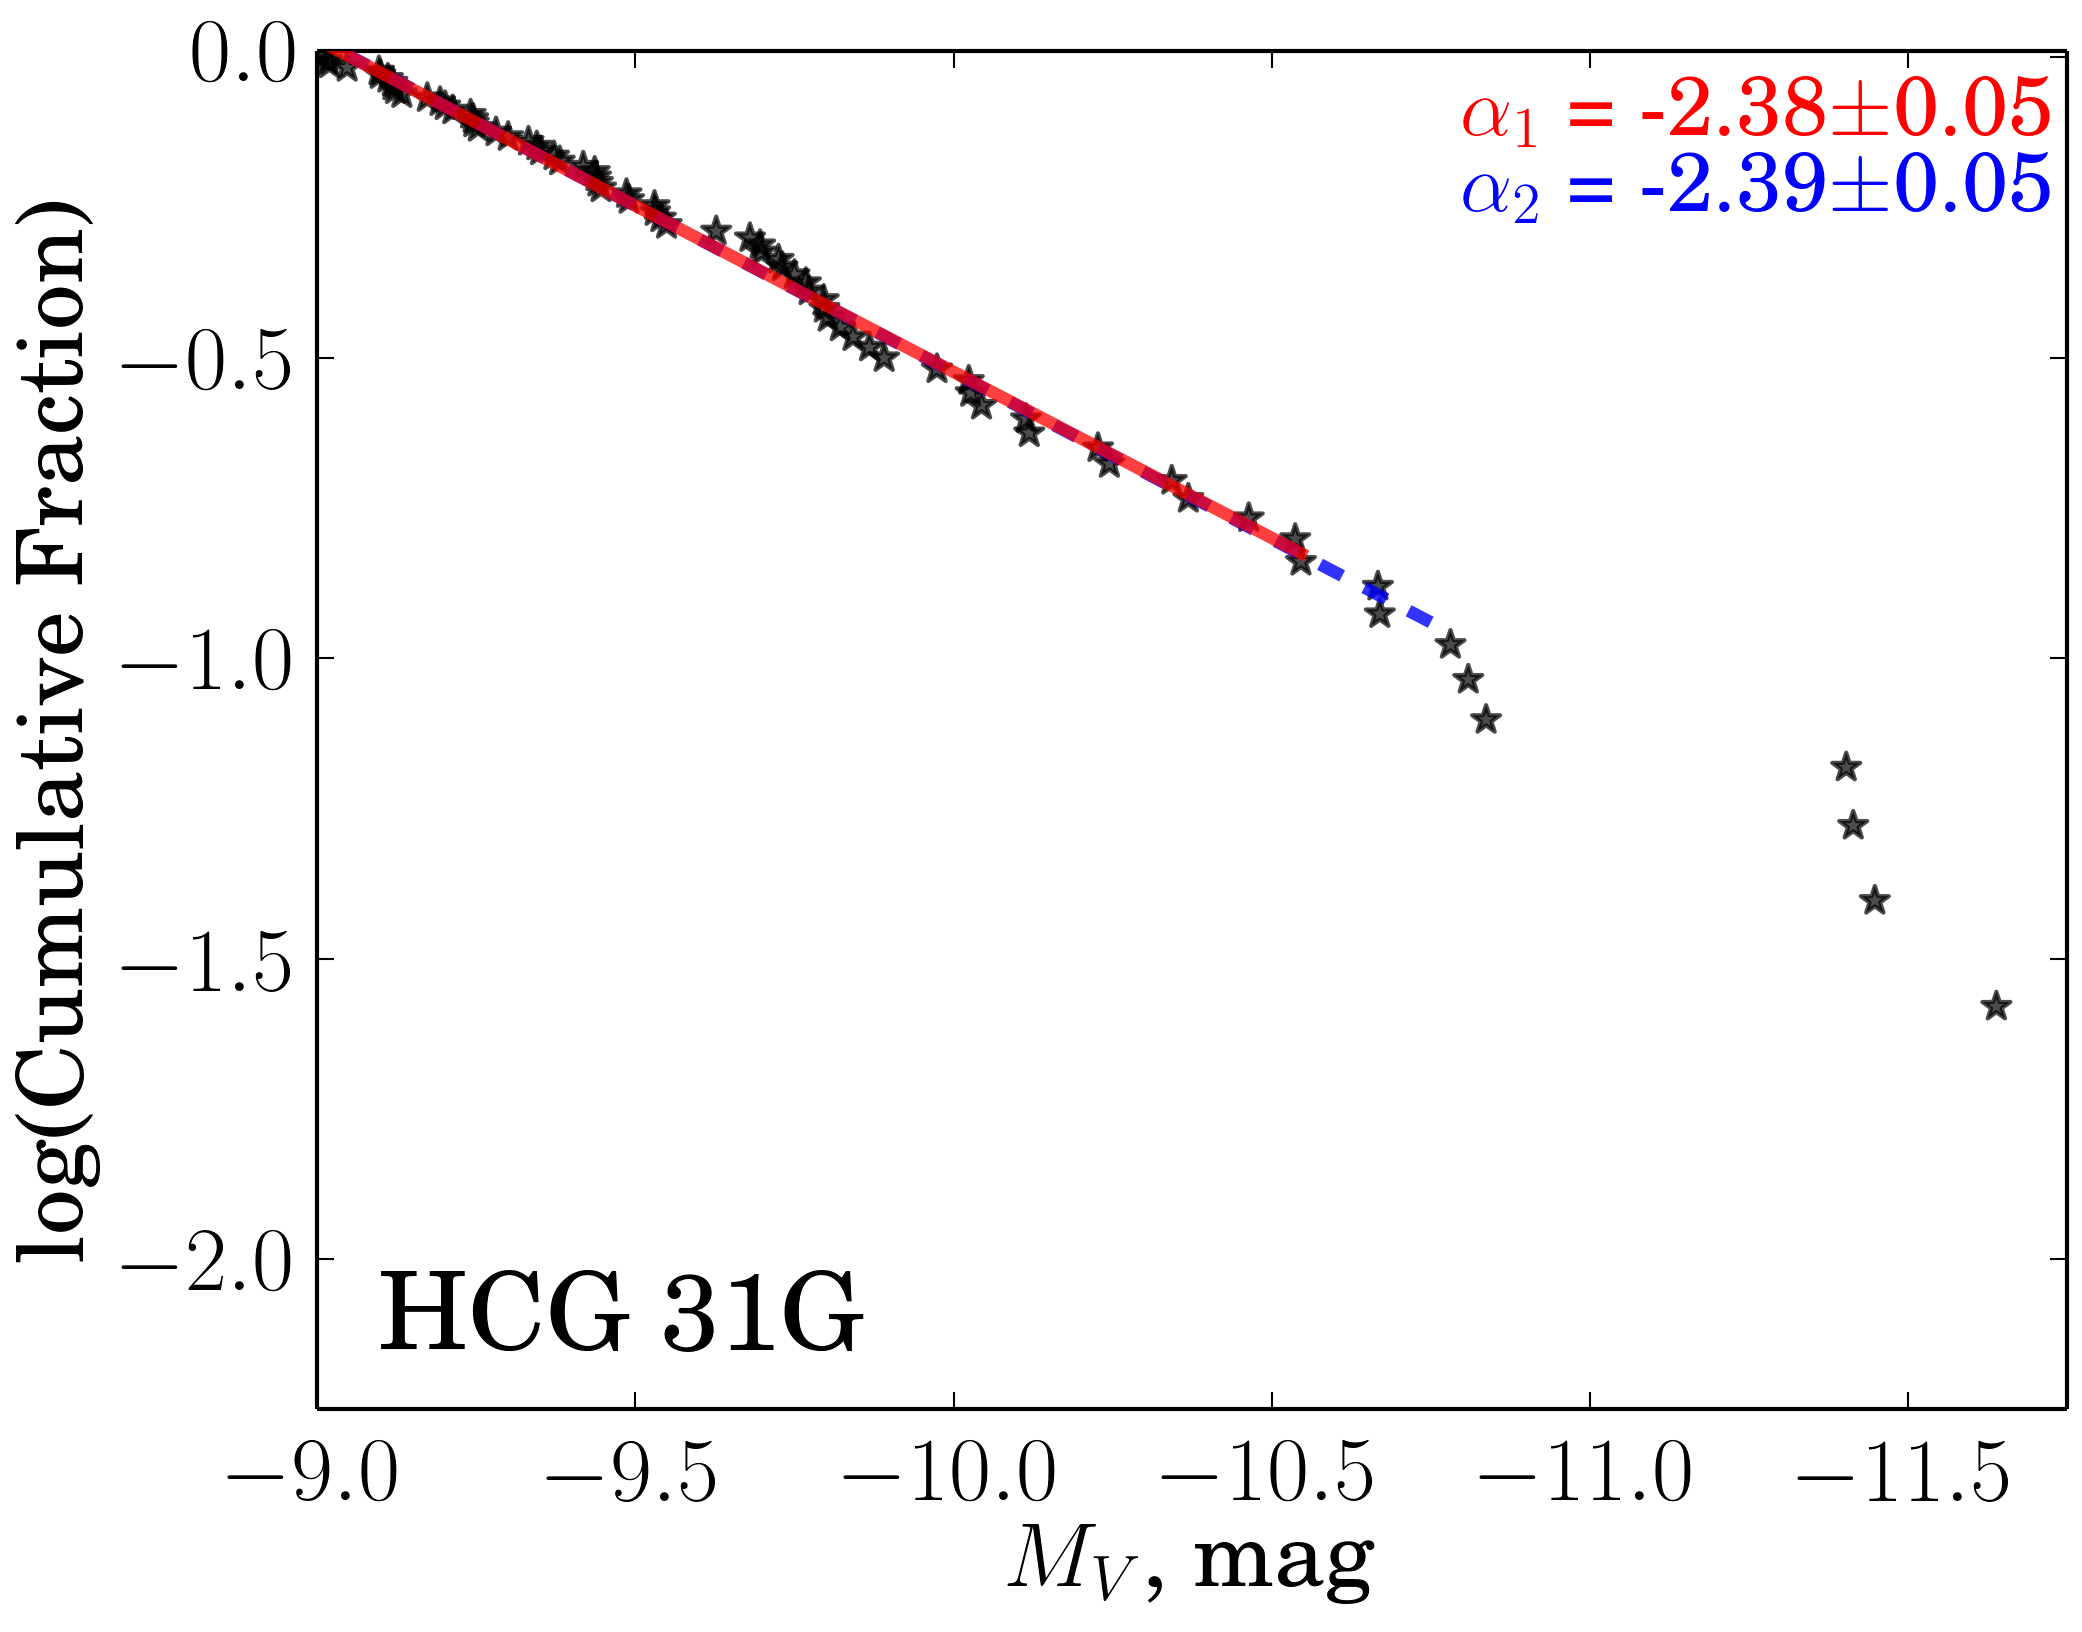
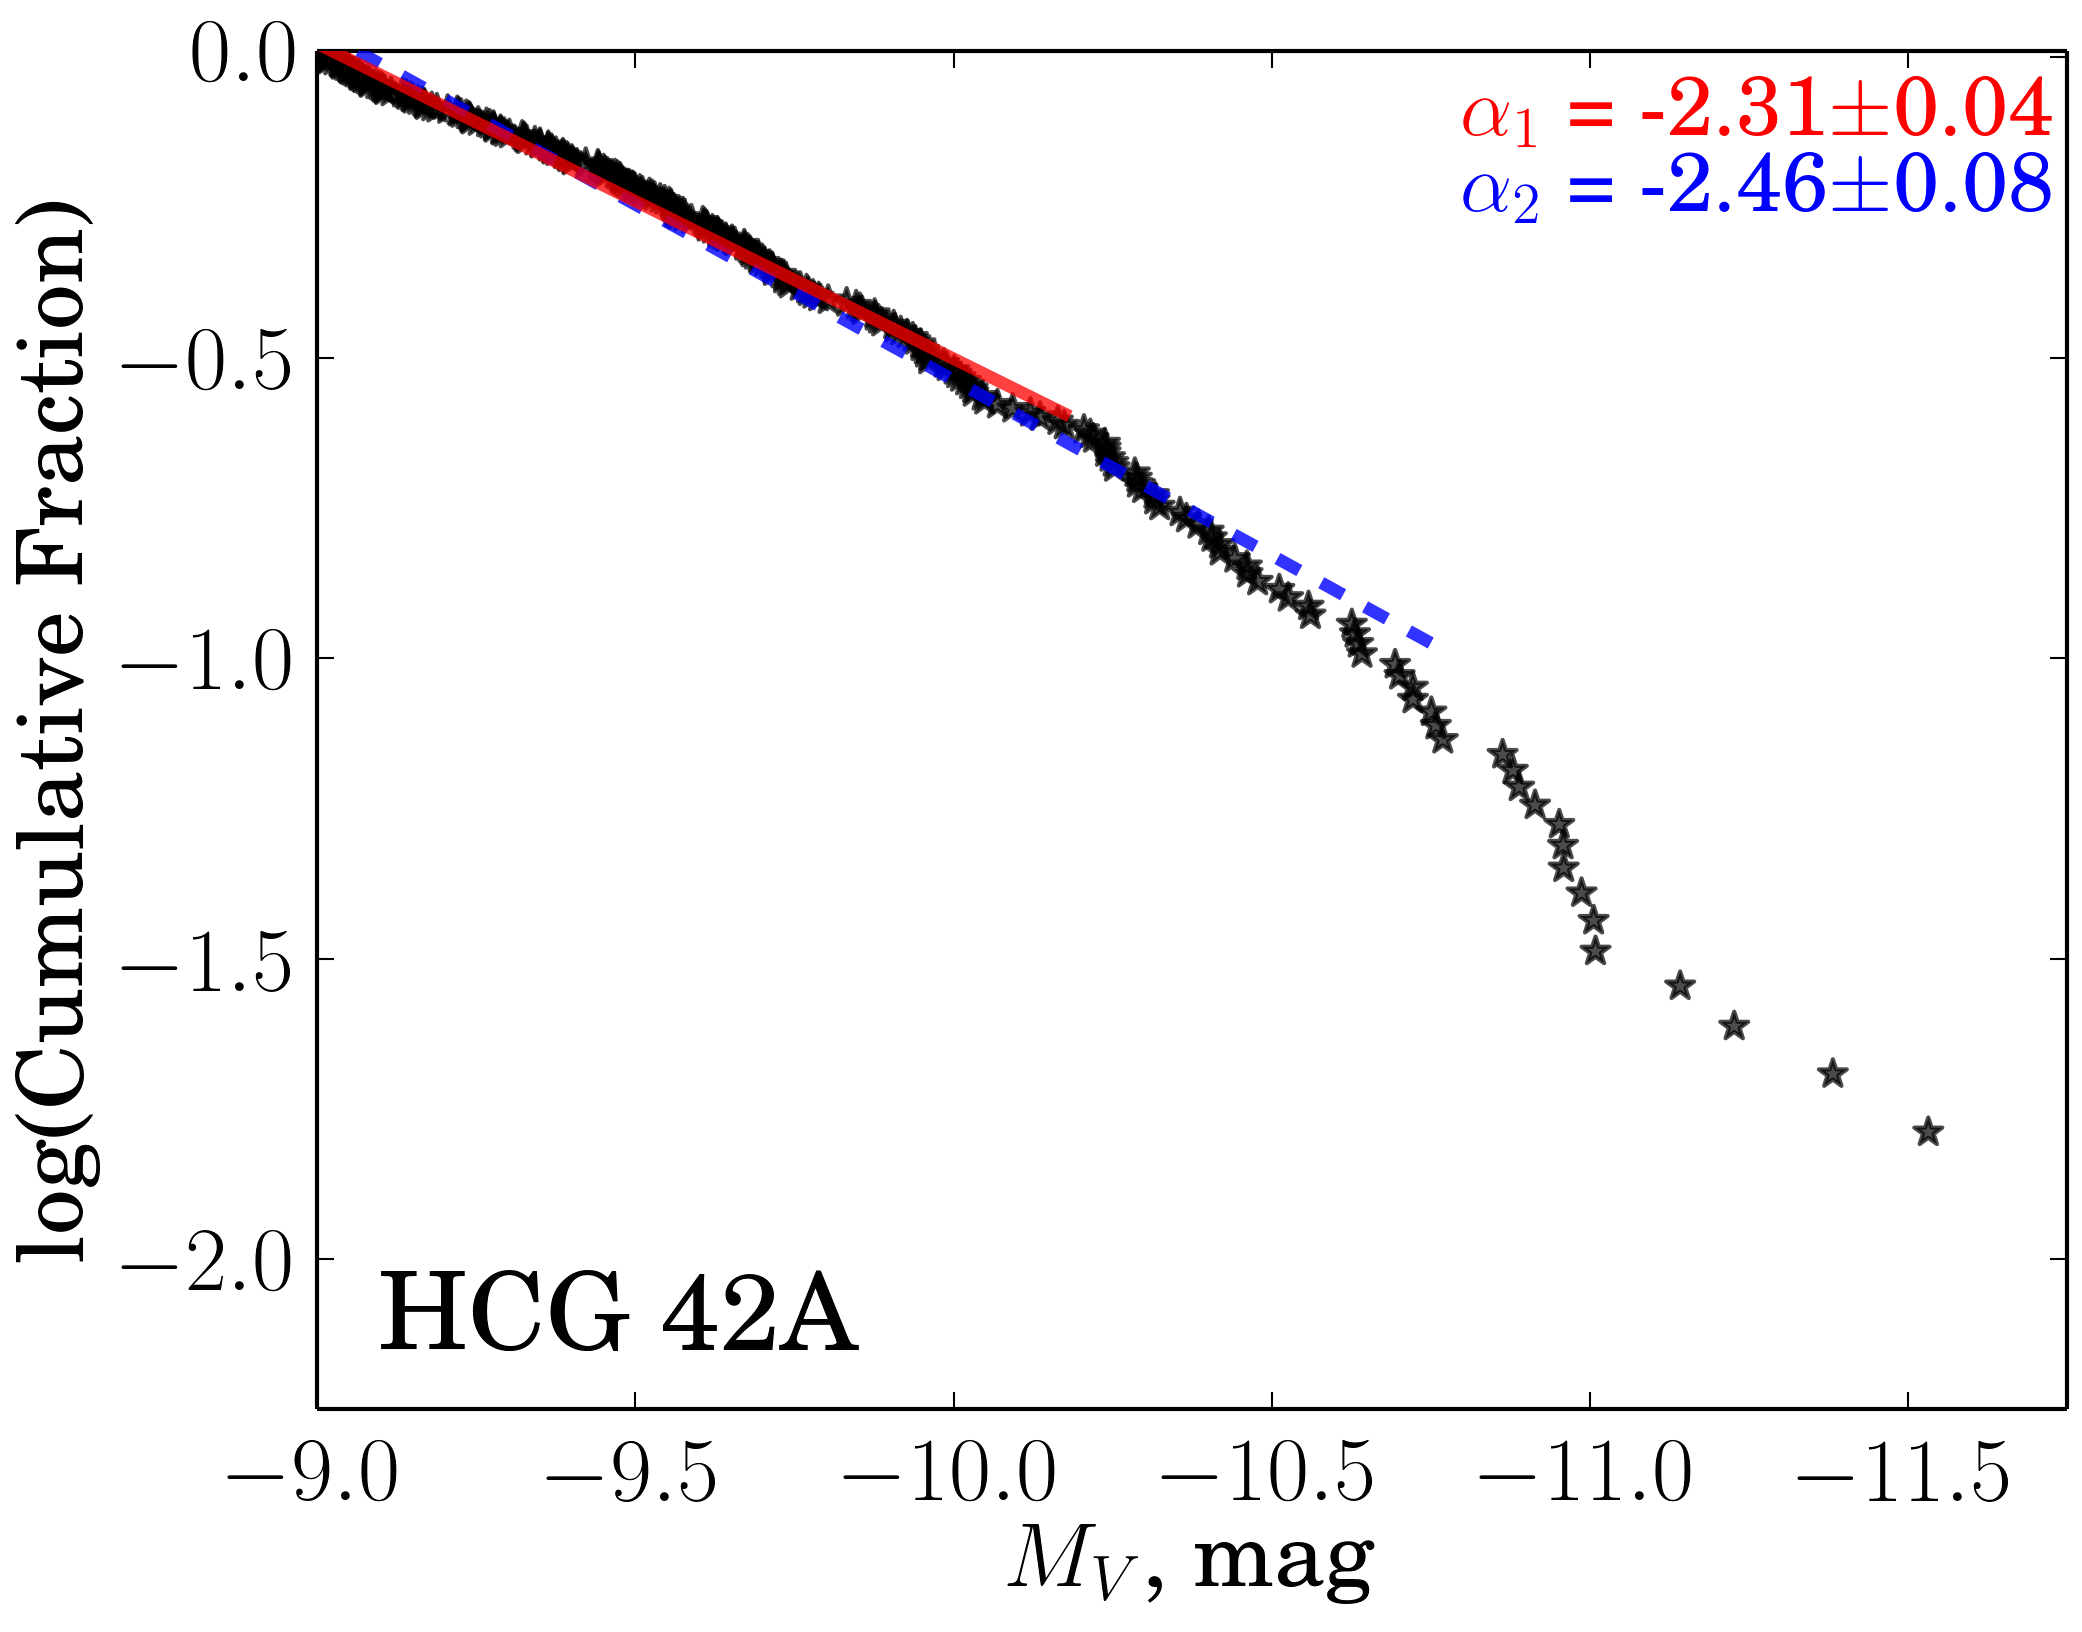
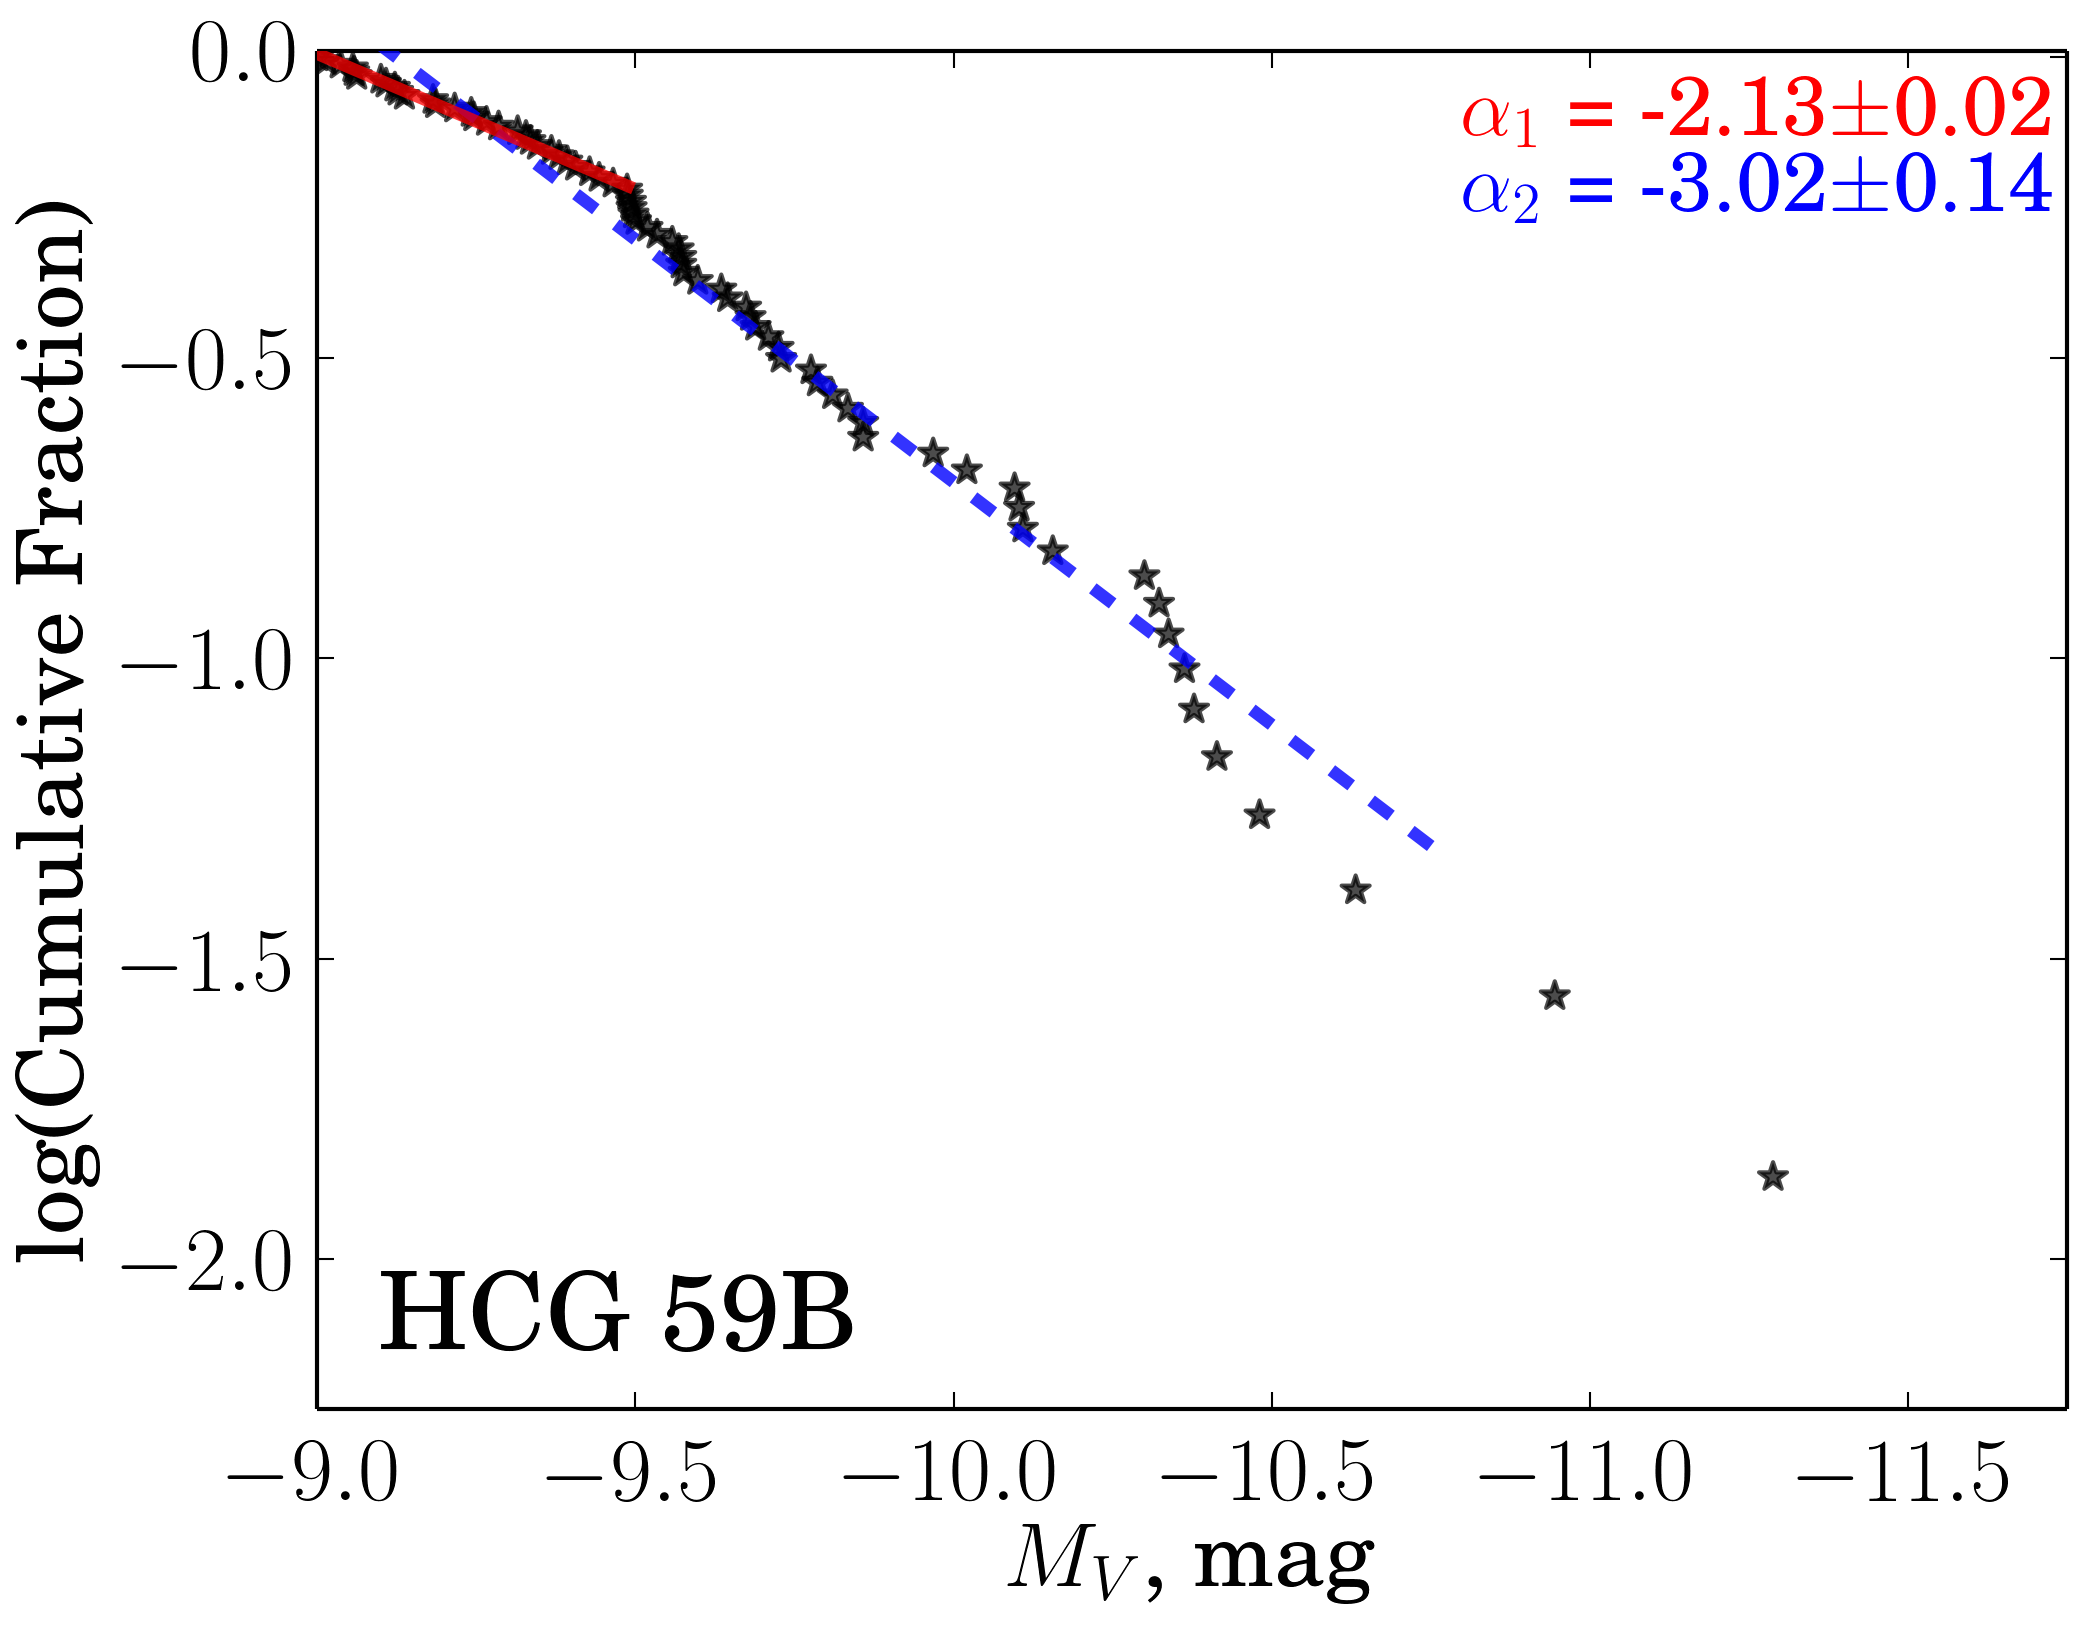
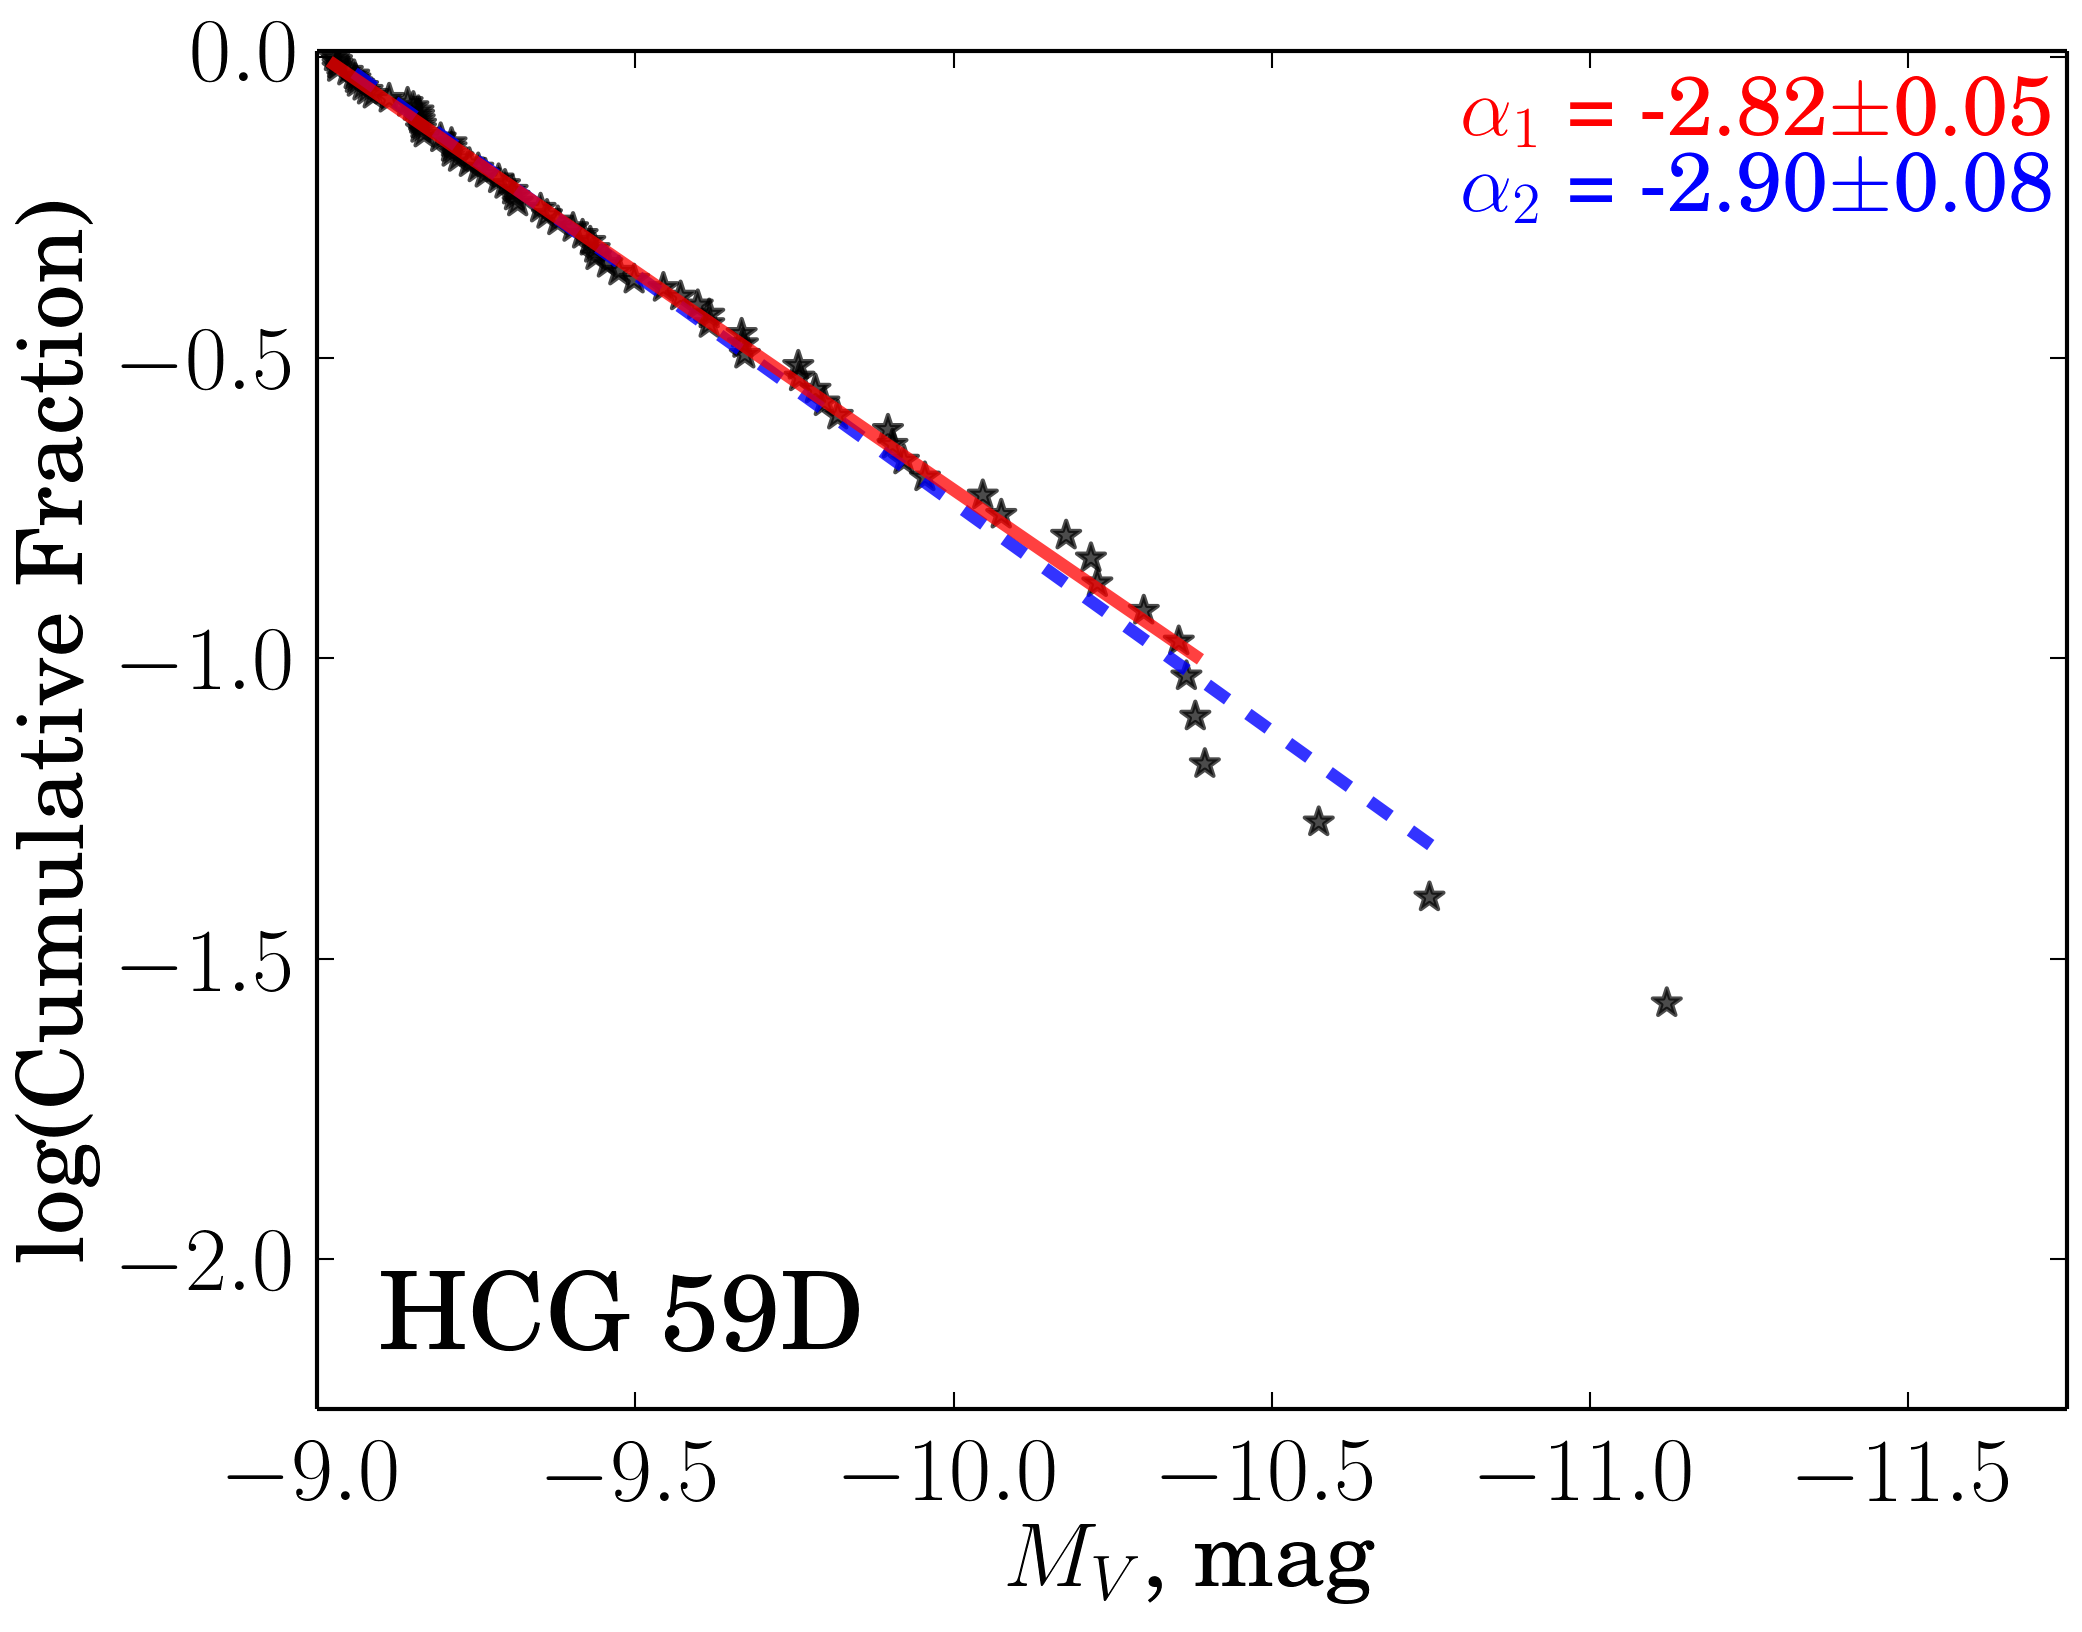
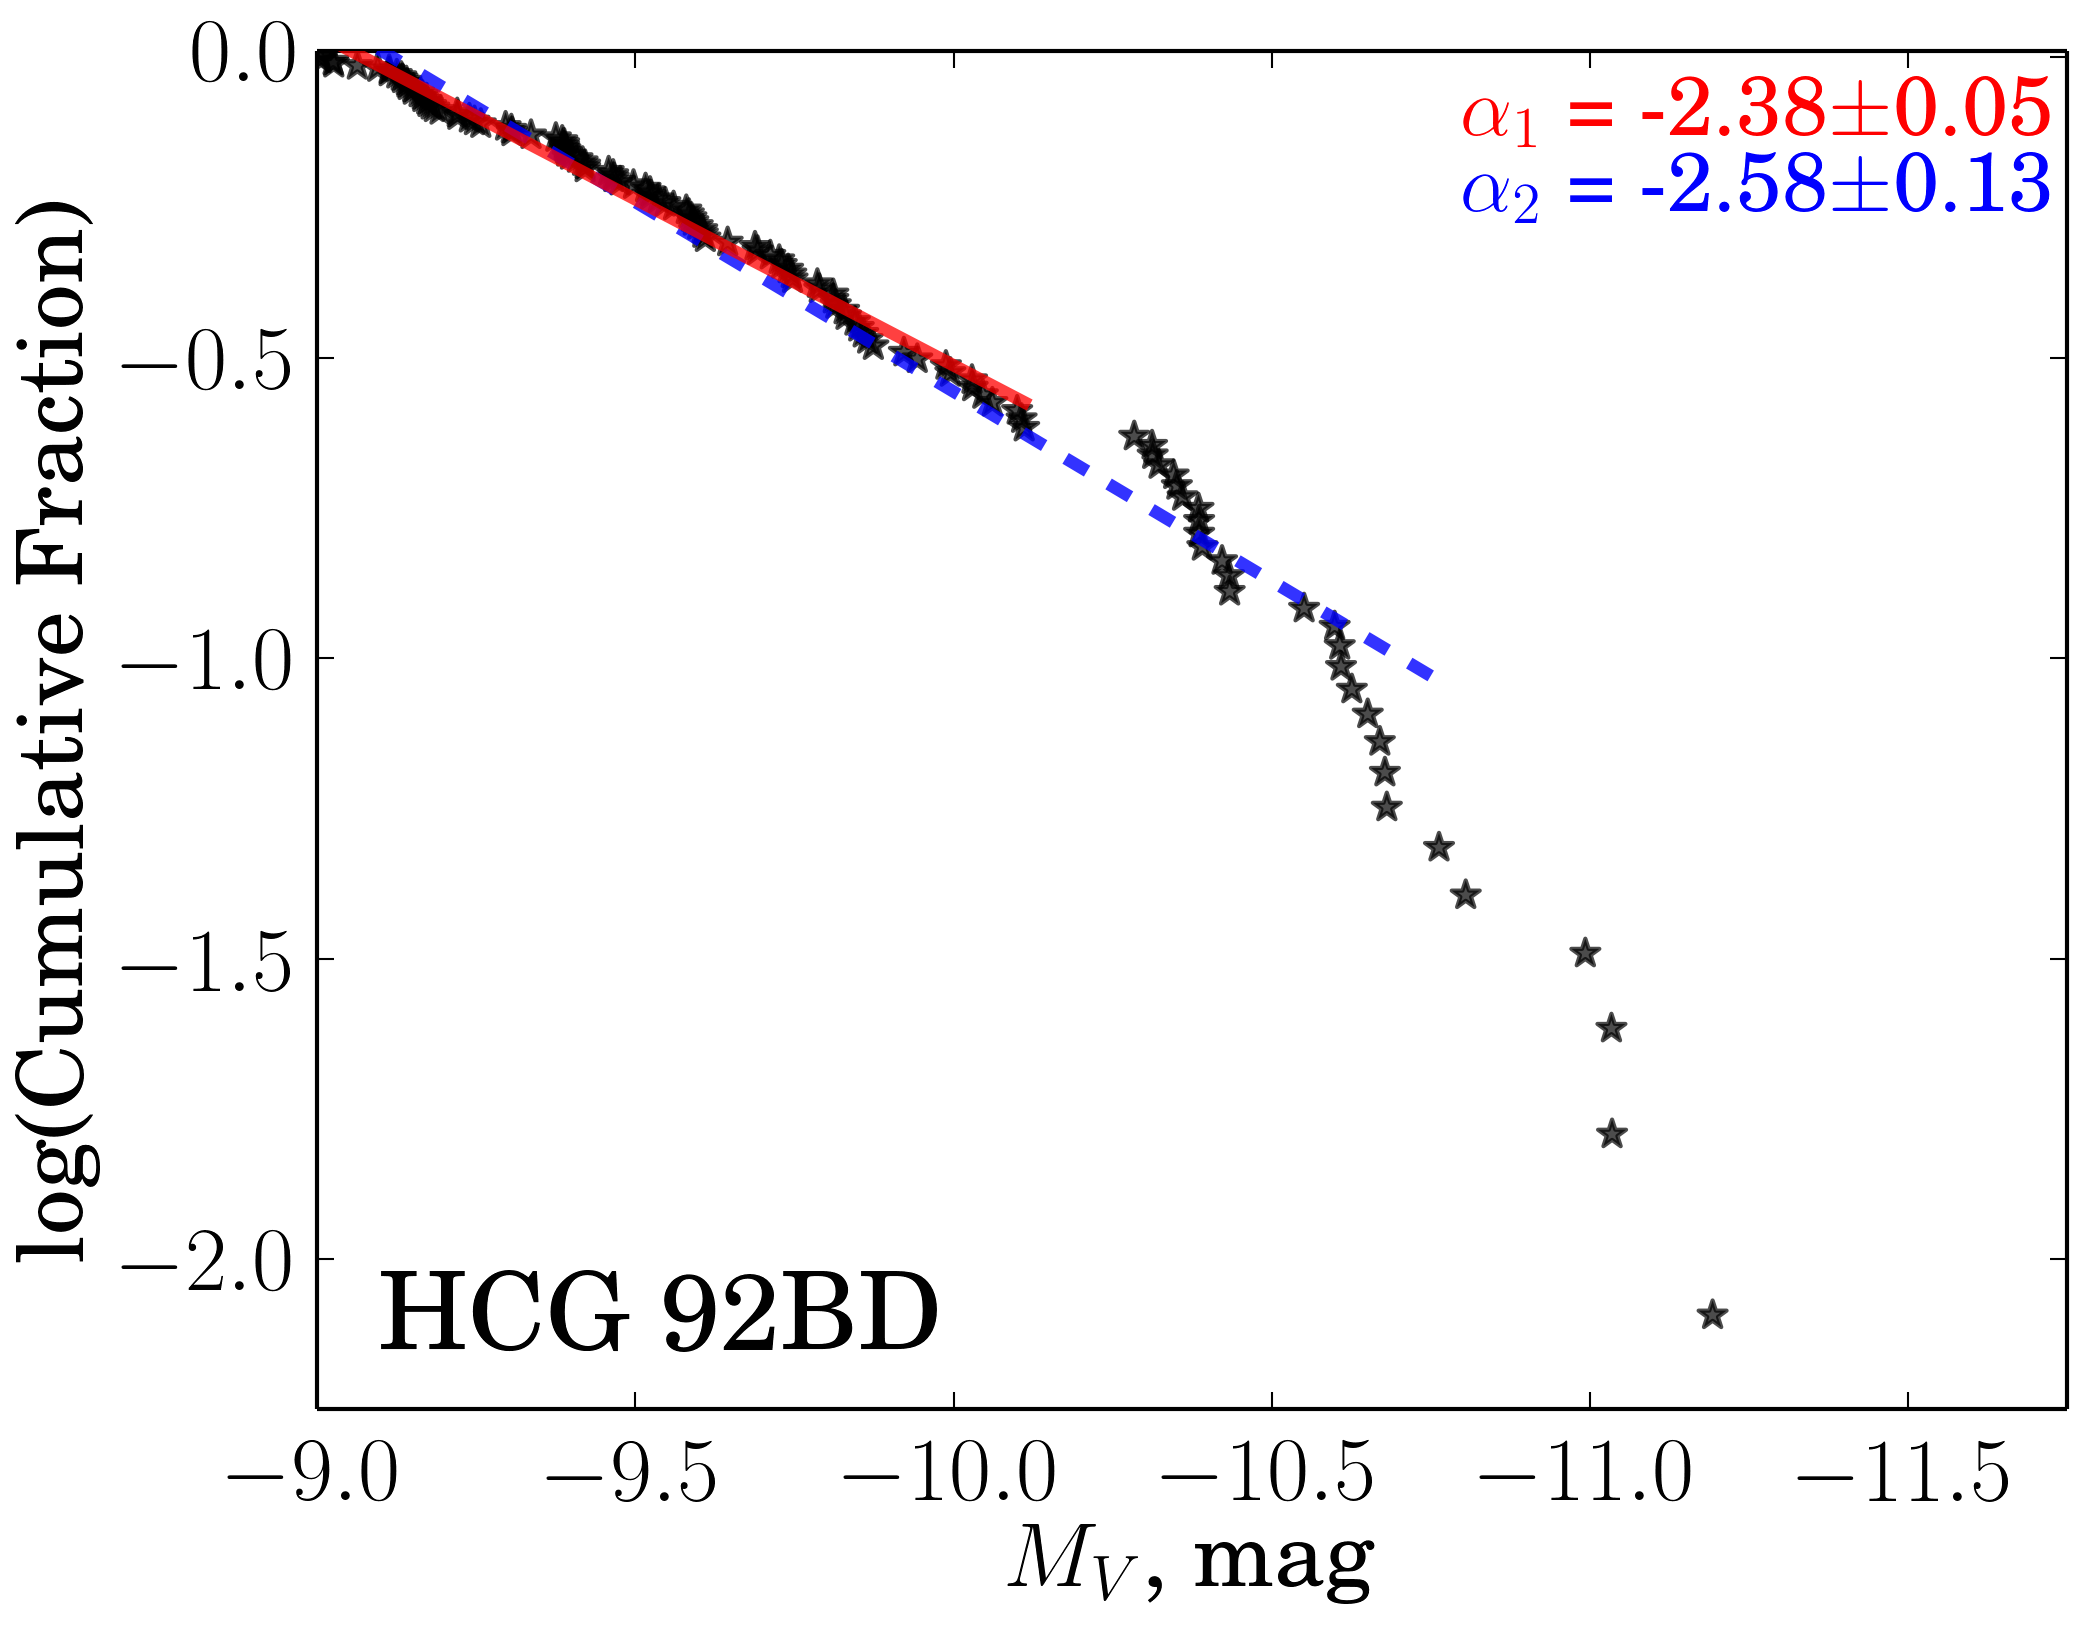
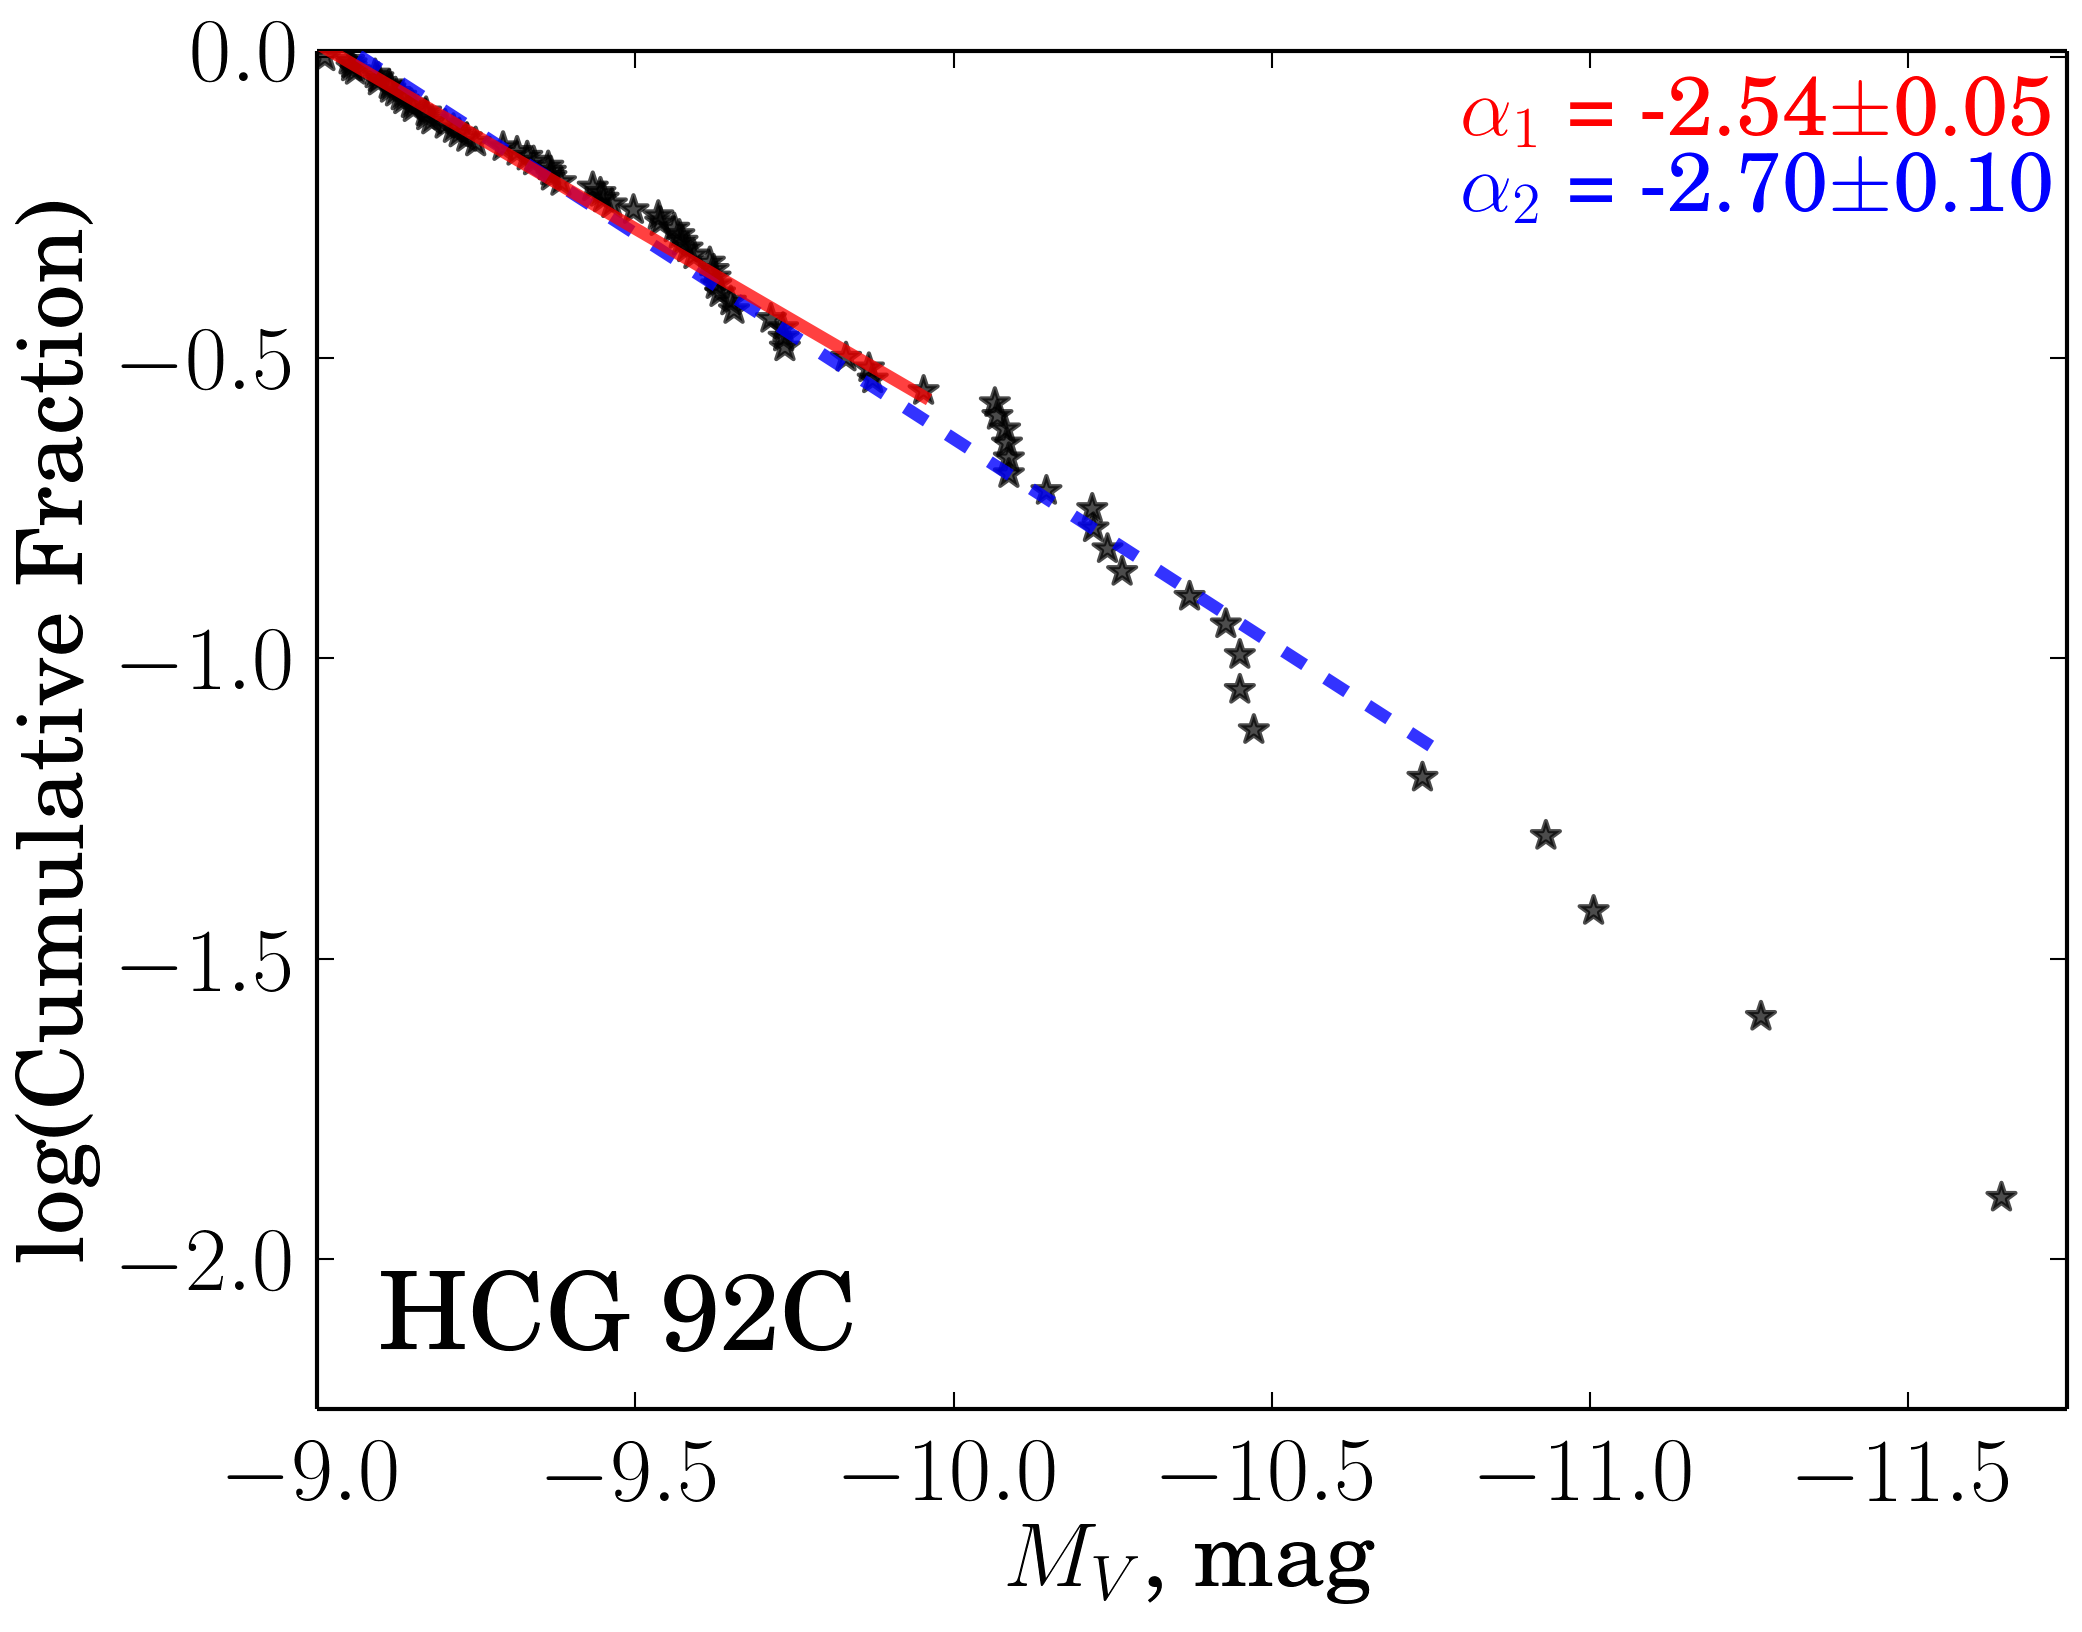
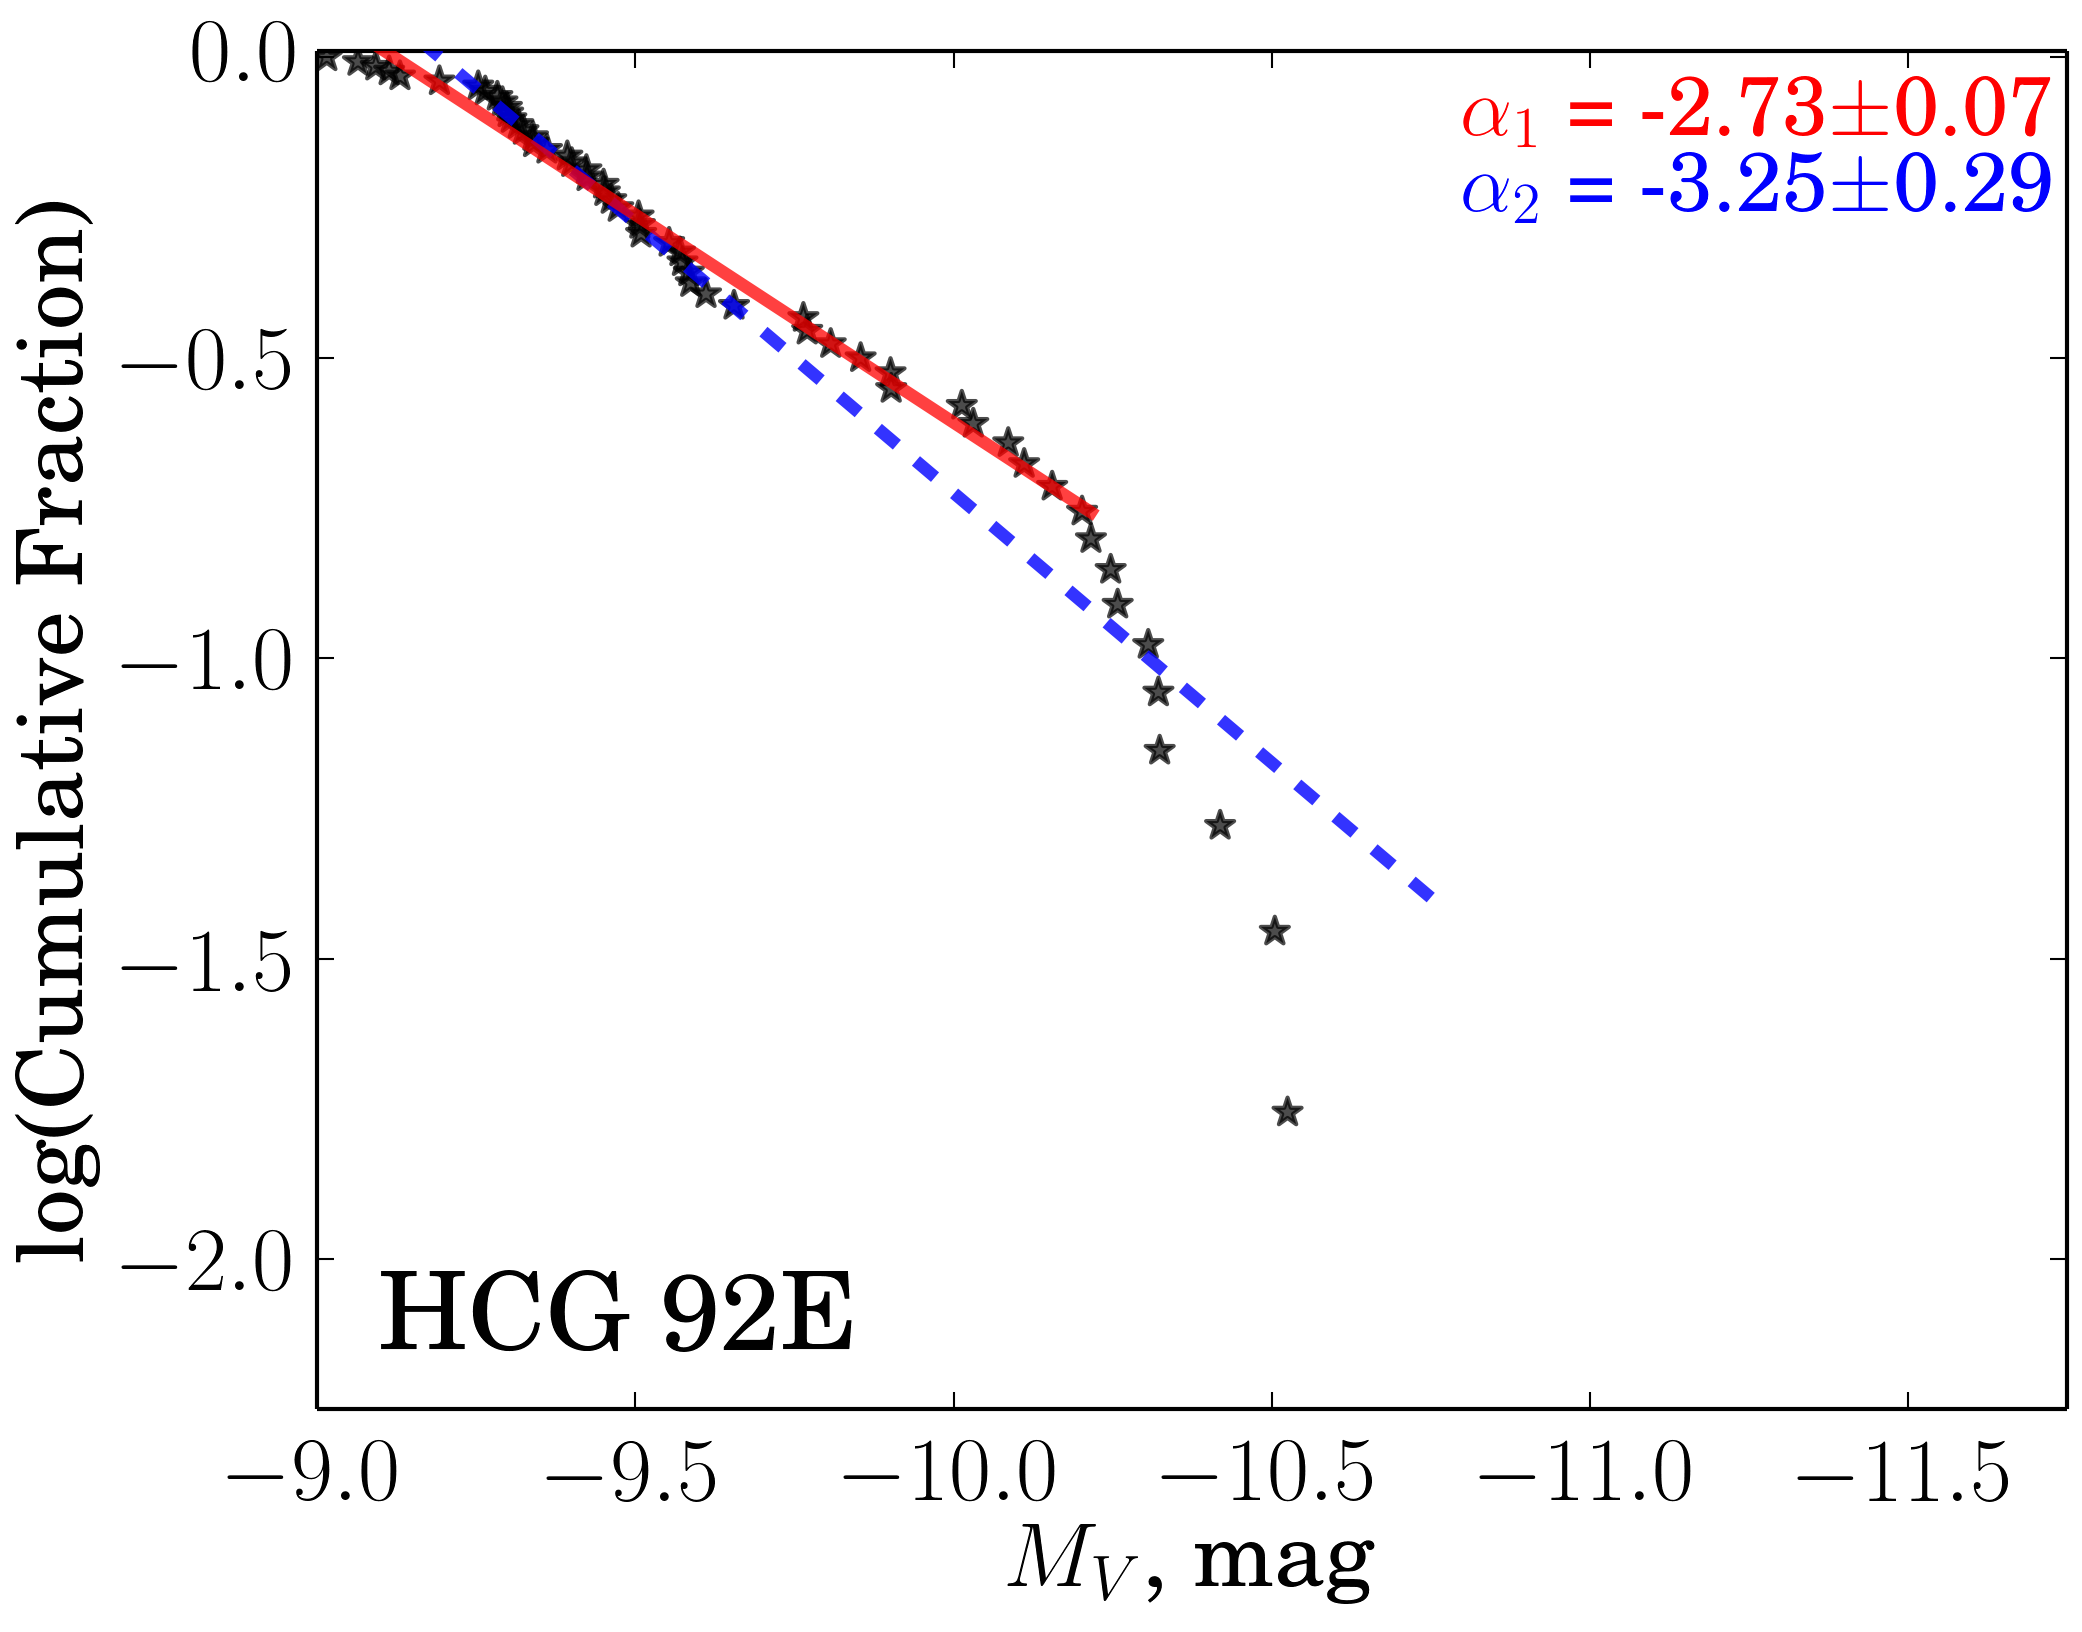
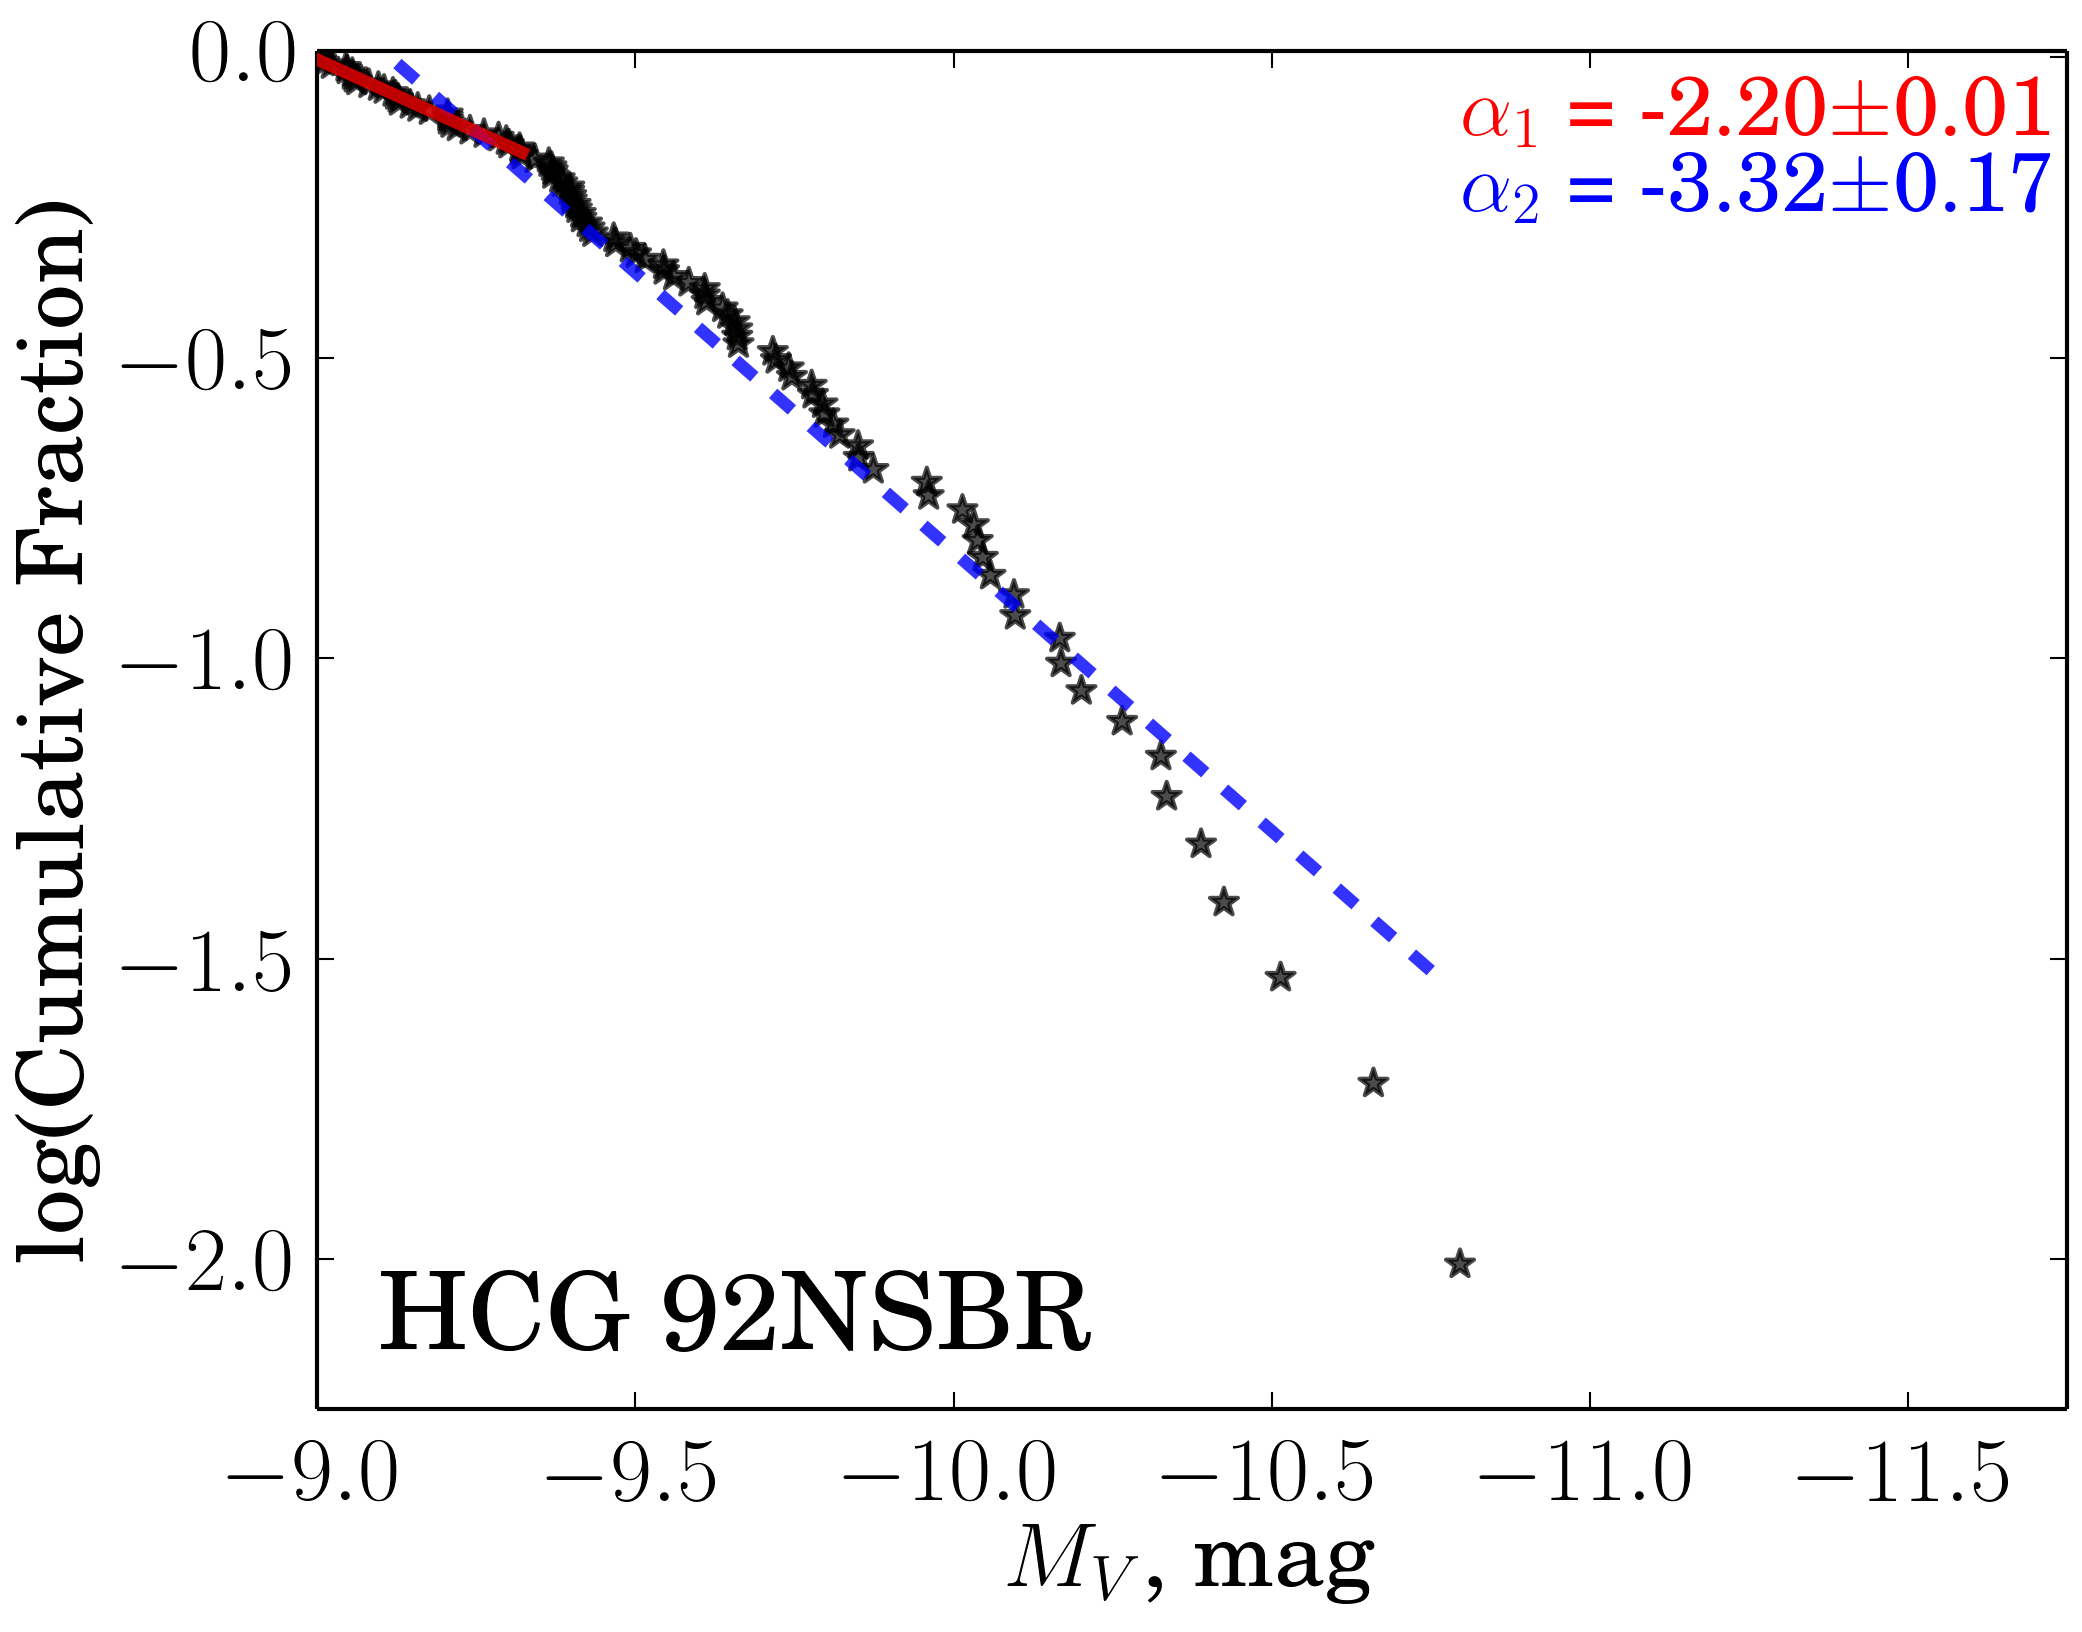
Overall, the CLF indices of spirals in our sample of galaxies are in reasonable agreement with the values reported in other works (e.g., Larsen, 2002; Whitmore et al., 2014; Ryon et al., 2014), except for a noticeable outlier 07C, which is a bit more negative than in Gieles et al. (2006). In addition, the galaxies in HCG 31 have very similar -values (, , and , for galaxies 31AC, 31B, and 31G, respectively); the irregular 59D has a rather high negative -value of . As in the case of 07A and 07C, recent (and on-going) star formation could be responsible for the steeper value of in 59D. A sustained star-formation episode could cause a build-up of clusters near the low-luminosity end of the luminosity function as old clusters fade with age.
Some CLFs for the galaxies in our sample exhibit a bend at the bright part of the distribution, with that part of the distribution being steeper, a trend that was also noticed in the aforementioned studies. Gieles et al. (2006) argues that the bend in the CLF corresponds to the upper mass limit in the cluster initial mass function. For example, their linear fit to the CLF of the Antennae galaxies suggests a bend at , which corresponds to a maximum mass of (with the assumption that the oldest cluster in the CLF is 3 Gyr). In our sample, the galaxies 42A, 92BD, 92E display a bend at magnitudes of approximately , and , respectively. Galaxy 59B exhibits two possible bends, one at and the other one at . Because there is the possibility that the GC system for this galaxy consists of two populations, its own GCs and clusters stripped from 59A (see § 4.4), we speculate that each bend is imprinted on the overall CLF by the two constituent cluster populations. HCG 31B and HCG 92C might also have multiple bends.
Also worth noting is that the galaxies with active star formation according to the cluster colour-colour plots (in particular galaxies C and D in HCG 07; AC, B, and G in HCG 31, and irregular galaxy D in HCG 59) show the most linear CLFs over a broad range of absolute magnitudes.
| Galax/Region | Type | -index | Magnitude range | |||
|---|---|---|---|---|---|---|
| custom | common | |||||
| [0pt][0pt]HCG 07A | 48 | Sb | ||||
| HCG 07C | 135 | SBc | ||||
| [0pt][0pt]HCG 07D | 47 | SBc | ||||
| HCG 31AC | 138 | Sdm + Im | ||||
| [0pt][0pt]HCG 31B | 89 | Sm | ||||
| HCG 31G | 76 | Sbc | ||||
| [0pt][0pt]HCG 42A | 246 | E3 | ||||
| HCG 59B | 73 | E0 | ||||
| [0pt][0pt]HCG 59D | 75 | Im | ||||
| HCG 92BD | 124 | Sbc + E2 | ||||
| [0pt][0pt]HCG 92C | 79 | SBc | ||||
| HCG 92E | 57 | E4 | ||||
| [0pt][0pt]HCG 92NSBR | 102 | – | ||||
Notes. Types of galaxies are taken from Hickson et al. (1989). Region 92NSBR represent a collection of intergroup clusters and as such does not have a morphological type. Magnitude range column specifies the range over which the slope was fitted.
4.9 Spatial Distribution of Globular Clusters in Elliptical Galaxies
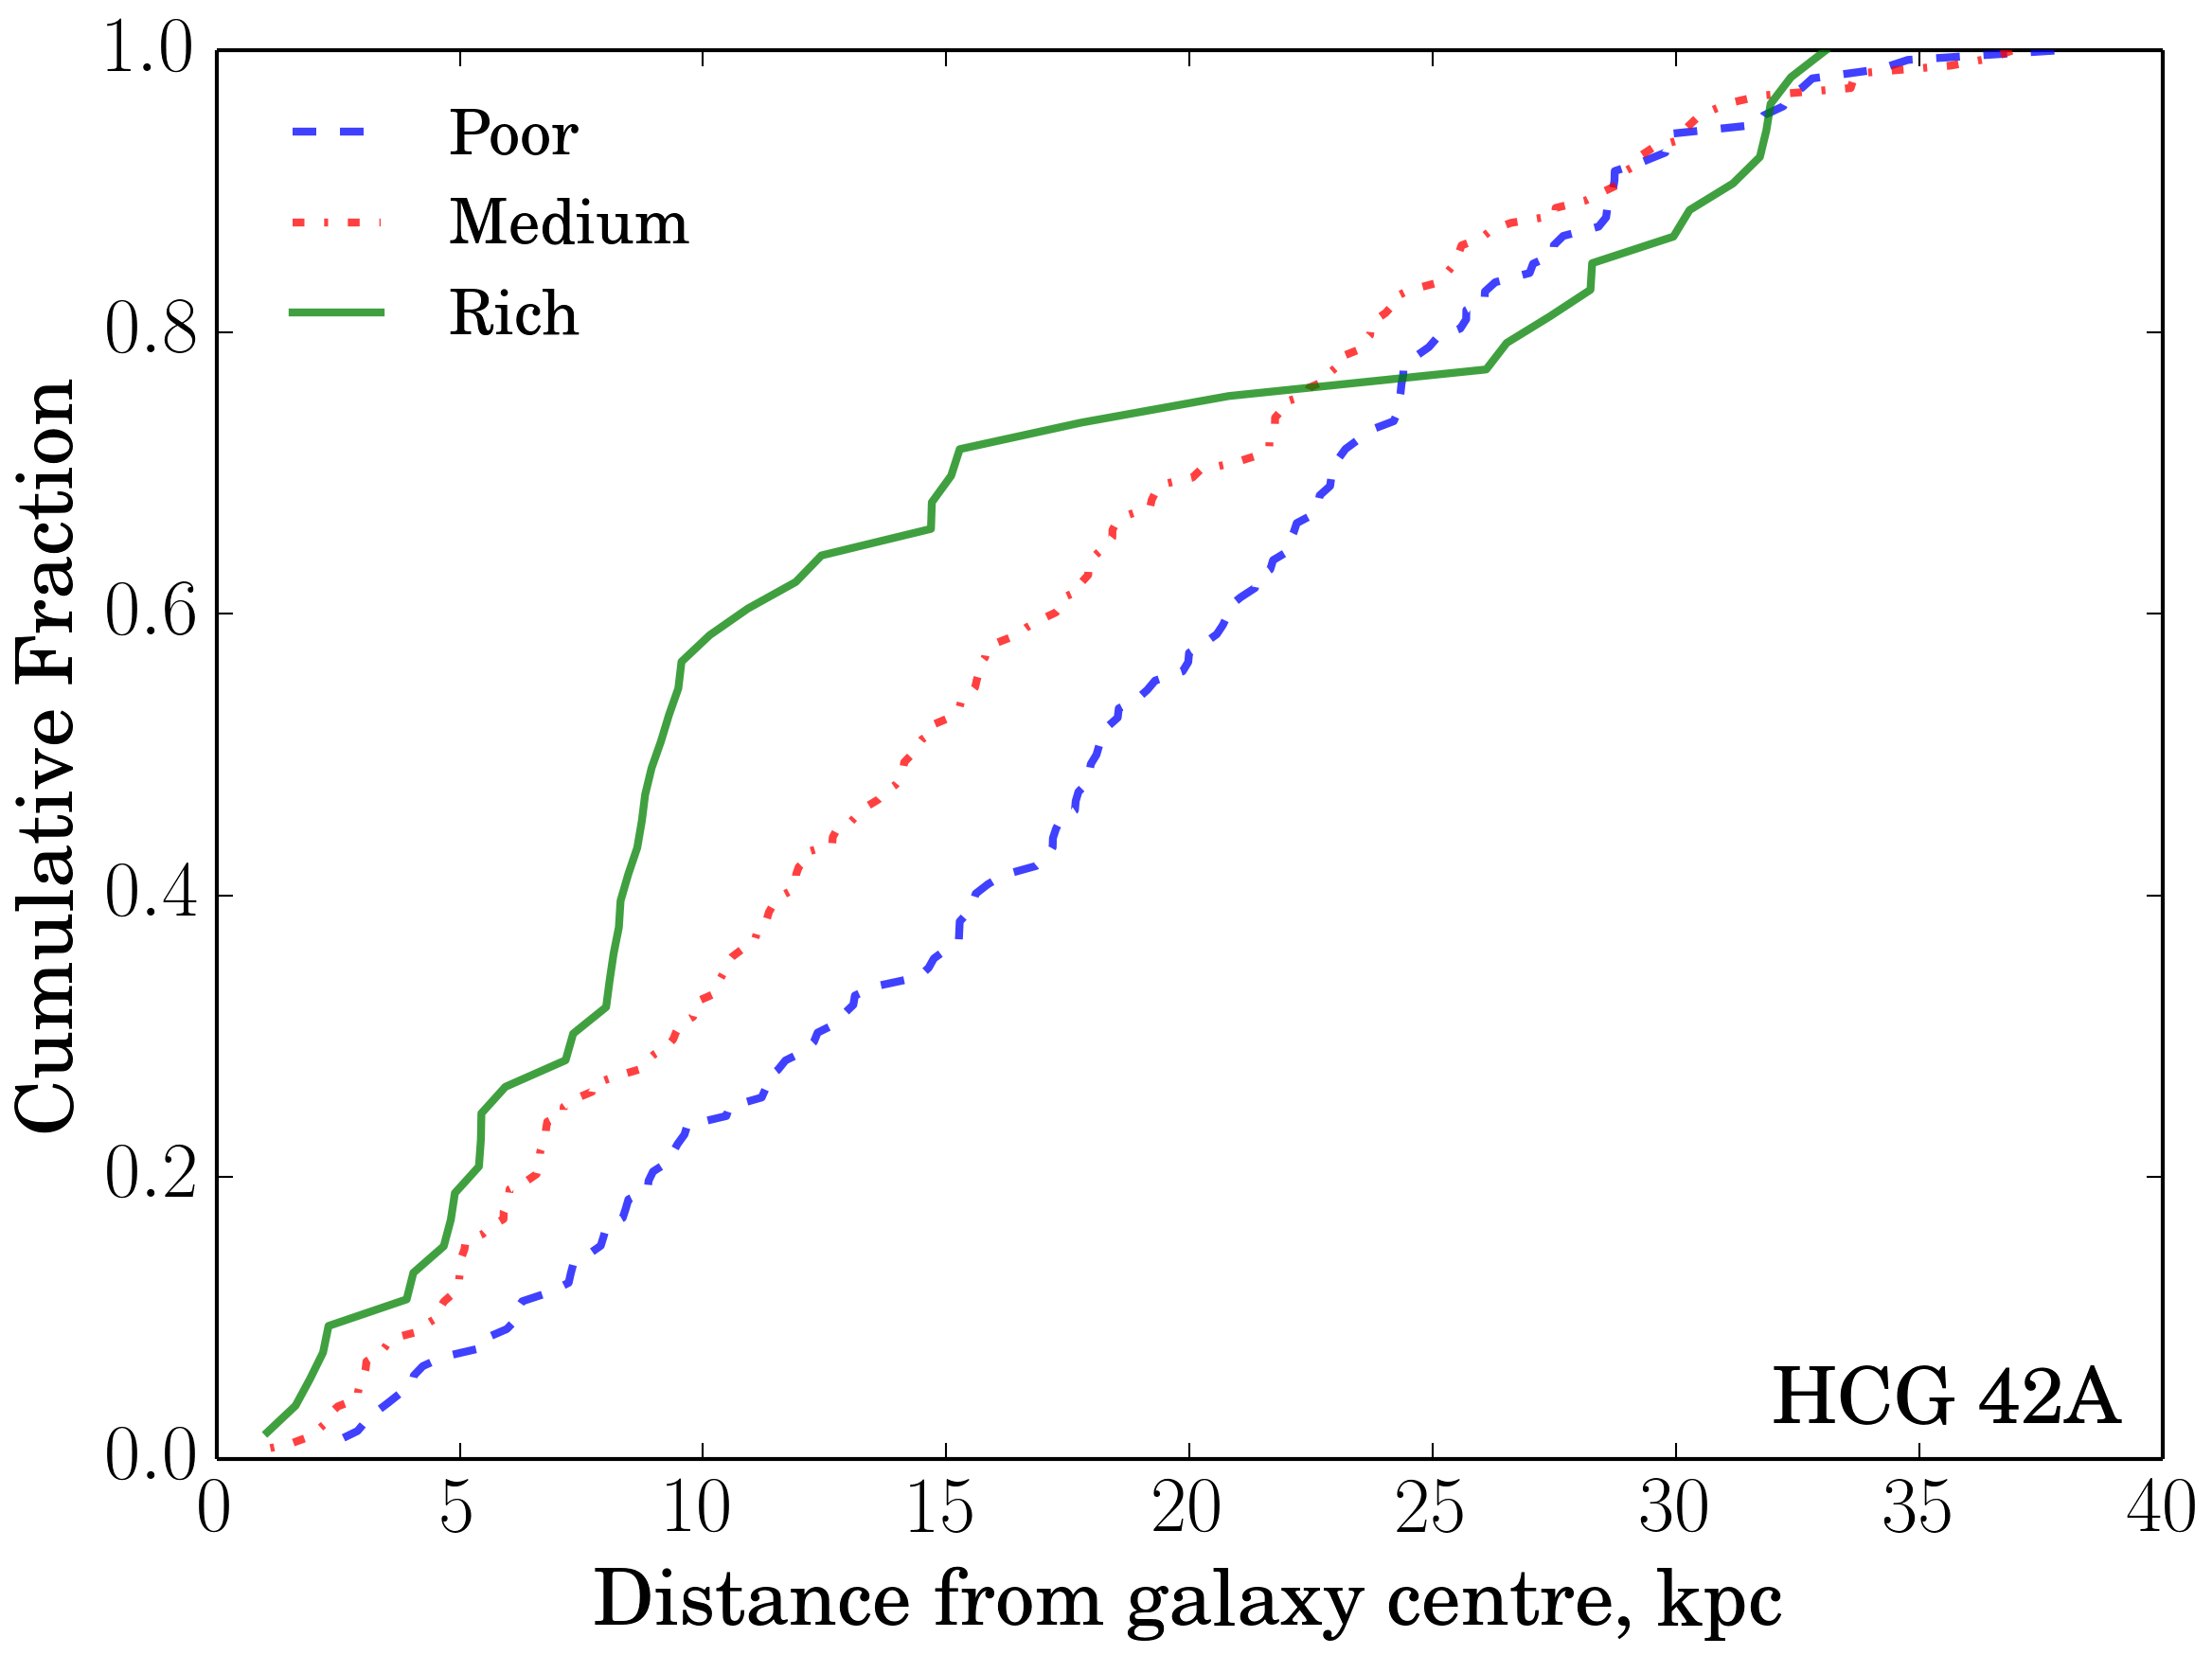
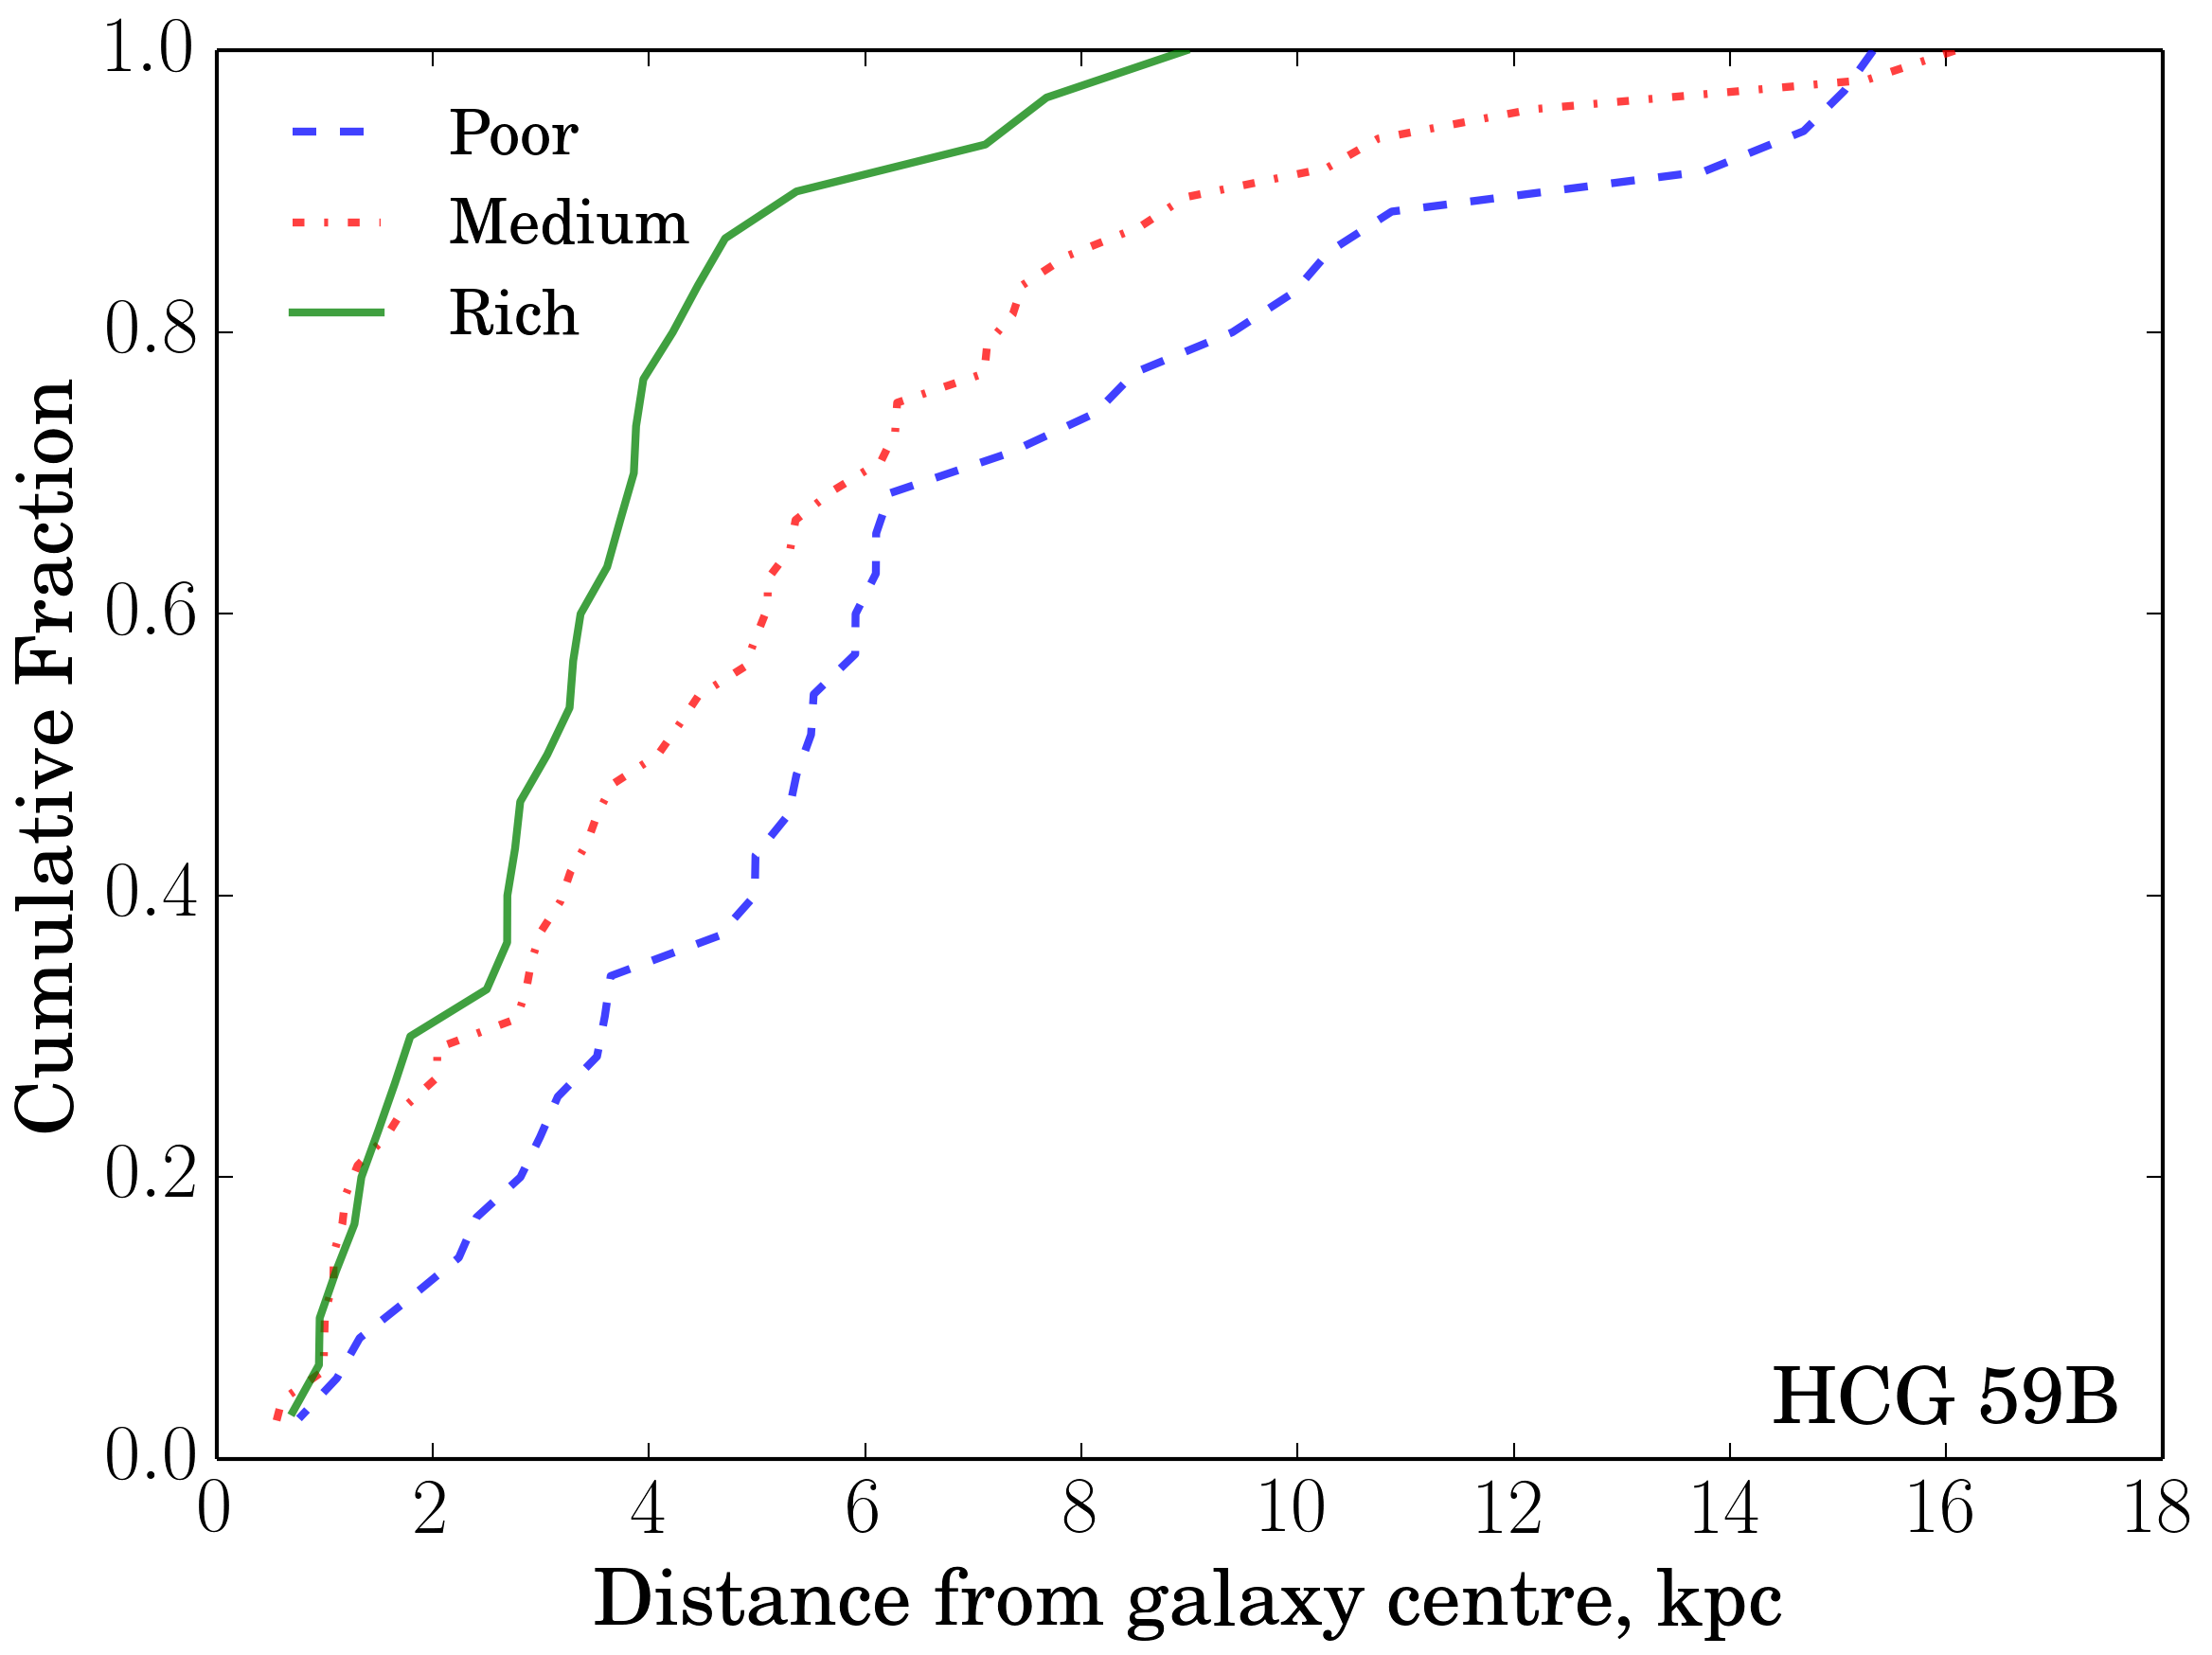
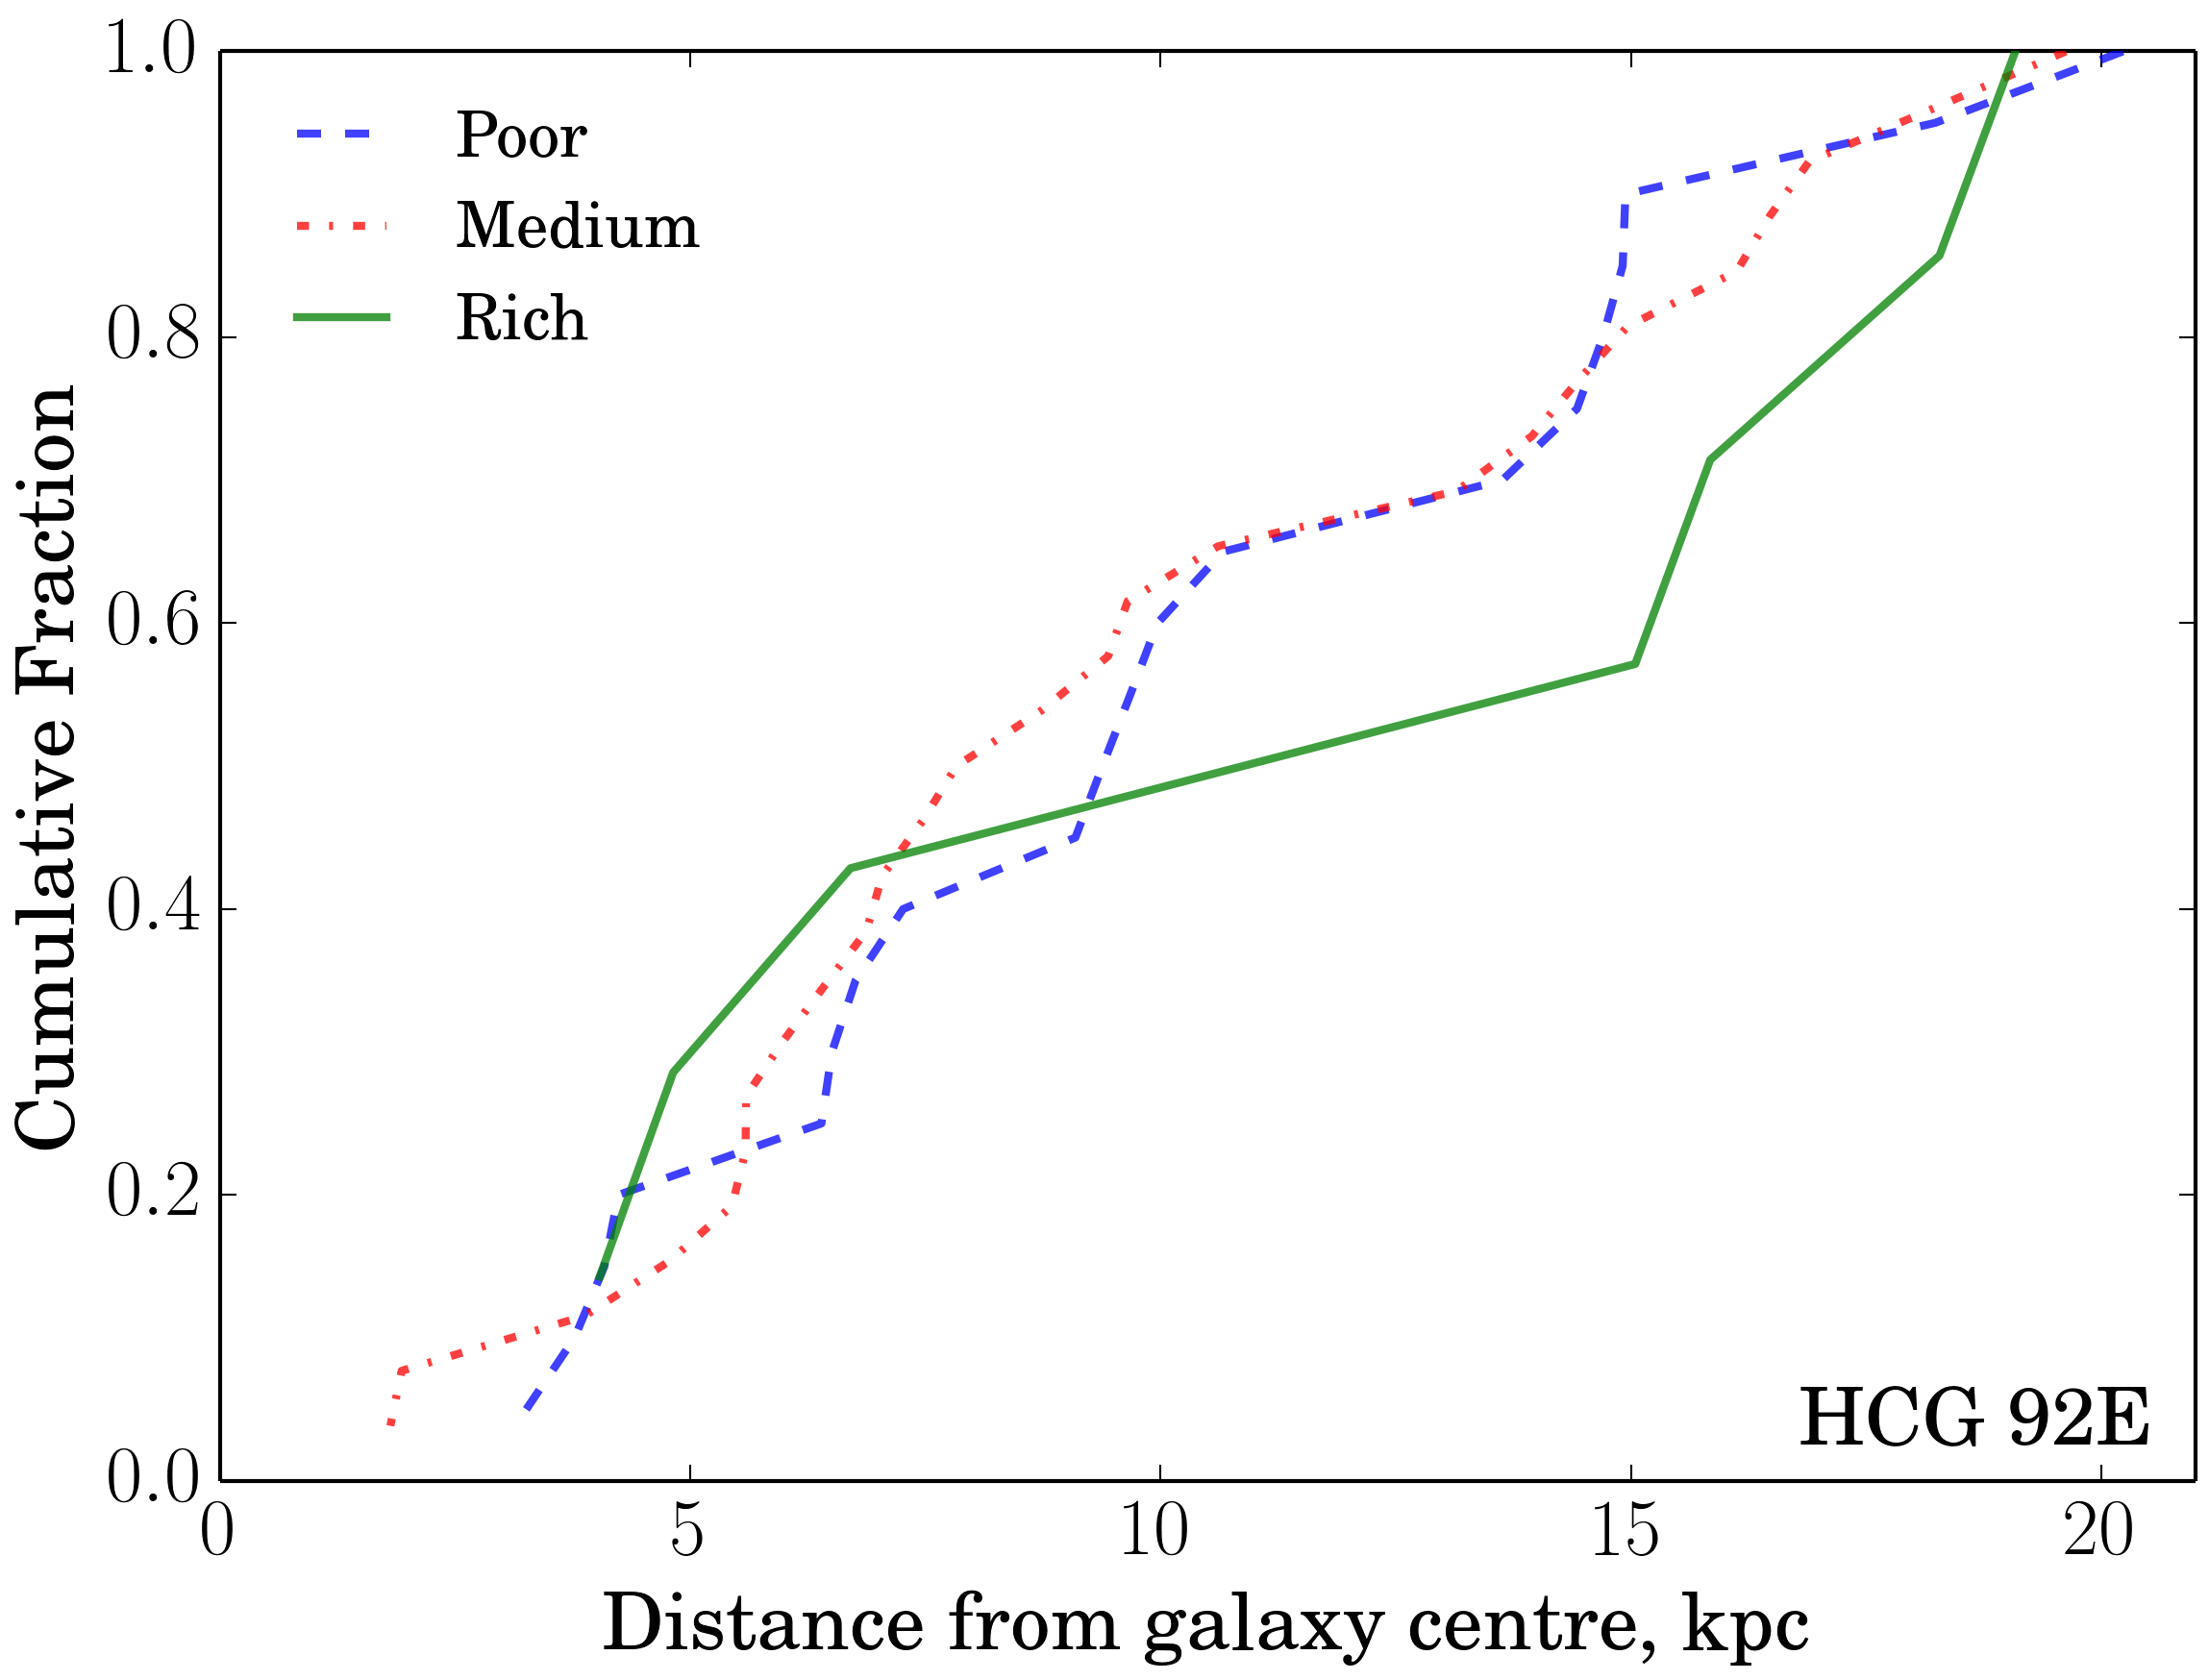
For the three elliptical galaxies in our sample with significant GC systems (HCG 42A, 59B, and 92E), we examined the physical distribution of the globular clusters in those galaxies as a function of metallicity (Fig. 19). We divided the clusters in each system into three groups, based on their metallicity distribution plots (e.g., panel (e) of 16). Specifically, all cluster to the left of the “blue” peak are considered to be relatively metal-poor. Similarly, all clusters rightward of the “red” peak are considered relatively metal-rich. The clusters between the peaks are tagged as having an intermediate metallicity content. Thus, the metal-poor cluster have metallicities below , , and for galaxies HCG 42A, 59B, and 92E, respectively. The metal-rich clusters have metallicities above , , and , for the same galaxies. Accordingly, the intermediate metallicity clusters in these galaxies have metallicities ranging between the values cited above. Then we plot the cumulative distribution of the clusters as a function of projected distance from the center of the galaxy. We find that 42A and 59B have more metal-rich clusters concentrated closer to their galaxy centres, clusters with intermediate metal content are distributed throughout the galaxies, and metal-poor clusters tend to have higher concentrations in the outer regions of the galaxies.
A Kolmogorov-Smirnov (KS) statistical test was used to determine if the cumulative radial distributions of the different metallicity clusters are consistent with each other. The results showed that the -value for comparing the low and high metallicity distributions in 42A was , which allows us to reject the null hypothesis (that they are drawn from the same parent population) with confidence. Similarly, for the rich and poor clusters of 59B, and so their radial distributions are also significantly different. For galaxy 92E the -values for all combinations of distributions are not rejecting the null hypothesis. From the lower panel of Fig. 19 it appears that the GCs of different metallicities are mixed throughout the galaxy. However, we have to note that the statistics of small numbers might be at play here. The way we split the GC population into three groups with the different metallicity content leaves the the metal-rich population of 92E with only 7 GCs (20 and 26 GCs in metal poor and medium metal content populations, respectively). Thus, it is highly speculative to talk about the radial distribution of the metal-rich clusters. To try to avoid this situation, we split GC sample into two roughly equal groups, metal rich and metal poor, at (panel (i), fig. 18). The KS test does not reject the null hypothesis, and so it would appear that GCs do not have a preferential distribution based on their metallicities. One of the possible explanations for this apparently well-mixed distribution would be a dry merger between two galaxies of similar mass. An examination of the unsharp-masked image of 92E to look for signs of recent interaction such as shells or streams did not reveal any such features.
5 Conclusions
We present a catalogue of star clusters detected in five compact galaxy groups (HCG 07, 31, 42, 59, and 92), based on sensitive, high-resolution multi-colour images from the Hubble Space Telescope Advanced Camera for Surveys and Wide Field Camera 3 (in the case of HCG 92) with the goal of examining the properties of the star cluster systems of compact group galaxies overall and further assisting researchers in star cluster-related studies. Altogether, the catalogue consists of 18,292 objects. After applying a number of criteria, we left with 1963 star cluster candidates and 1505 globular cluster candidates detected in 16 galaxies in the high confidence samples. A sample of the photometric data from this catalogue is presented in the electronic Table 3.
| \rowfont RA | Dec | B | V | I | S1 | S2 | S3 | S4 | S5 | G1 | G2 | G3 | G4 | SCC | GCC | [Fe/H] | HCG | |||||||
|---|---|---|---|---|---|---|---|---|---|---|---|---|---|---|---|---|---|---|---|---|---|---|---|---|
| \rowfont deg | deg | mag | err | sharp | mag | err | sharp | mag | err | sharp | ||||||||||||||
| \rowfont (1) | (2) | (3) | (4) | (5) | (6) | (7) | (8) | (9) | (10) | (11) | (12) | (13) | (14) | (15) | (16) | (17) | (18) | (19) | (20) | (21) | (22) | (23) | (24) | (25) |
| \rowfont [0pt][0pt]338.9945 | 33.936701 | 28.921 | 0.502 | -0.122 | 27.844 | 0.203 | -0.67 | 26.716 | 0.107 | 0.143 | 1.35 | 0 | 0 | 1 | 1 | 0 | 1 | 1 | 0 | 1 | - | - | 0.1232 | 92 |
| \rowfont339.04261 | 33.936755 | 25.844 | 0.057 | 0.112 | 25.462 | 0.048 | 0.224 | 24.997 | 0.055 | 0.218 | 1.784 | 1 | 1 | 1 | 1 | 1 | 1 | 1 | 1 | 0 | yes | - | -3.441 | 92 |
| \rowfont [0pt][0pt]339.02544 | 33.936792 | 26.918 | 0.1 | 0.111 | 26.642 | 0.123 | -0.615 | 26.429 | 0.183 | -0.408 | 2.811 | 0 | 1 | 1 | 1 | 1 | 1 | 0 | 1 | 0 | - | - | -4.399 | 92 |
| \rowfont338.96391 | 33.936928 | 27.076 | 0.13 | -0.348 | 25.919 | 0.062 | -0.079 | 25.111 | 0.054 | 0.075 | 1.606 | 0 | 1 | 1 | 1 | 1 | 1 | 1 | 1 | 1 | - | yes | -0.499 | 92 |
| \rowfont [0pt][0pt]338.97734 | 33.937033 | 26.903 | 0.116 | 0.033 | 26.369 | 0.075 | -0.046 | 25.716 | 0.158 | 0.122 | 3.819 | 0 | 1 | 1 | 0 | 1 | 1 | 1 | 1 | 0 | - | - | -2.539 | 92 |
| \rowfont339.0115 | 33.937167 | 28.51 | 0.365 | 0.652 | 27.192 | 0.105 | -0.22 | 27.058 | 0.208 | -0.034 | 2.137 | 0 | 0 | 1 | 1 | 1 | 1 | 1 | 0 | 0 | - | - | -1.840 | 92 |
| \rowfont [0pt][0pt]339.03373 | 33.937201 | 28.678 | 0.388 | -1.17 | 26.171 | 0.075 | 0.168 | 26.308 | 0.128 | 0.439 | 2.171 | 0 | 0 | 1 | 1 | 0 | 1 | 1 | 1 | 0 | - | - | 0.5495 | 92 |
| \rowfont338.95818 | 33.937251 | 27.208 | 0.144 | -0.517 | 26.064 | 0.066 | -0.137 | 25.33 | 0.074 | -0.072 | 2.078 | 0 | 1 | 1 | 1 | 1 | 1 | 1 | 1 | 1 | - | yes | -0.725 | 92 |
| \rowfont [0pt][0pt]339.00239 | 33.93731 | 26.475 | 0.063 | 0.313 | 25.395 | 0.057 | 0.369 | 24.446 | 0.063 | 0.386 | 2.433 | 1 | 1 | 1 | 1 | 1 | 1 | 1 | 1 | 1 | yes | yes | -0.333 | 92 |
| \rowfont338.96115 | 33.93742 | 25.62 | 0.046 | 0.182 | 24.629 | 0.026 | -0.035 | 23.736 | 0.042 | 0.19 | 1.955 | 1 | 1 | 1 | 1 | 1 | 1 | 1 | 1 | 1 | yes | yes | -0.710 | 92 |
| \rowfont [0pt][0pt]339.02347 | 33.93746 | 28.012 | 0.228 | -1.068 | 26.94 | 0.093 | 0.051 | 25.747 | 0.102 | 0.029 | 2.271 | 0 | 1 | 1 | 1 | 0 | 1 | 1 | 1 | 1 | - | yes | 0.2784 | 92 |
| \rowfont338.99922 | 33.937483 | 27.763 | 0.155 | 0.289 | 25.791 | 0.051 | 0.236 | 24.743 | 0.064 | 0.337 | 2.284 | 0 | 1 | 1 | 1 | 0 | 1 | 1 | 1 | 0 | - | - | 2.2147 | 92 |
| … | ||||||||||||||||||||||||
Notes. Columns list: (1) Right Ascension (J2000); (2) Declination (J2000); (3)—(5) Magnitude, error in magnitude, and sharpness values for B-band (F435W; F438W for HCG 92); (6)—(8) Magnitude, error in magnitude, and sharpness values for V-band (F606W); (9)—(11) Magnitude, error in magnitude, and sharpness values for I- band (F814W); (12) Goodness of fit factor from PSF-fitting in I- band; (13)—(17) Star cluster candidates selection criteria, see Section 3.3 for full description. 1 means that a given criterion is satisfied; (18)—(20) Globular cluster candidate selection criteria, see Section 3.4 for full description. 1 means that given criterion is satisfied; (21) Star cluster candidate flag. If ‘yes’, all SCC criteria are satisfied; (22) Globular cluster candidate flag. If ‘yes’, all GCC criteria are satisfied; (23) Metallicity value derived from color, see Section 4 for more details; (24) Hickson Compact group number.
In particular, a detailed examination of our catalogue revealed the following:
-
•
Star clusters are powerful tracers of episodes of star formation activity. Careful study of the distribution of cluster colours can lead to a better understanding of the evolutionary state of their hosts and can help to constrain (and in some cases to reconstruct) the sequence of events in the host groups (e.g. Gallagher et al., 2010; Konstantopoulos et al., 2010; Fedotov et al., 2011; Konstantopoulos et al., 2012, 2013). Thus, the analysis of star cluster populations in CGs allowed us to propose a reclassification of HCG 59 from a Type III to a Type II group. Most galaxies in Type III groups appear to be ‘red’ and ‘dead’ (e.g., HCG 42). However, the galaxy morphologies of HCG 59 do not comply with that statement. Moreover, its population of star clusters is more consistent with Type II groups.
-
•
In general, the cluster luminosity functions of the CG spiral galaxies were consistent with spirals studied in the literature (e.g. Larsen, 2002; Whitmore et al., 2014). In particular, their CLF -values ranged from to . A notable exception were the large negative -values for the spirals HCG 07A and 07C with and , respectively.
-
•
We have examined the metallicity distributions of GCCs in the five groups overall and individually in the elliptical galaxies (nominally elliptical 07BD and 92BD, 42A, 59B, 92C, and 92E) with sufficient numbers of GCCs. Only in galaxy 42A do we detect a metallicity distribution with well-defined bimodality peaking at [Fe/H] and [Fe/H]. The galaxy 92C may also host a bimodal distribution, but the statistical results were not conclusive.
-
•
The number of GCs in each galaxy is proportional to the total stellar masses of galaxies (Fig. 4). Notably, we detect a rather large number of GCs in 59B (and its immediate environs) and a small number of GCs in 59A. It is possible that these two galaxies have interacted before given their morphologies (59B is elliptical, 59A is lenticular) and apparent proximity; the GC population distribution may be the only record of that interaction. A low surface brightness stream of material between galaxies 59A and B, reported in Konstantopoulos et al. (2013), as well as their line-of-sight velocities (within 3% of eachother) also support the idea of previous interactions.
-
•
The number of “blue” clusters (with colour , representing the population of young star clusters) is well correlated with the star formation rate. Two spiral galaxies (92C and 59C) have a large number of “blue” clusters given their relatively lower star formation rates. That likely indicates that a recent bout of star formation triggered by interactions is coming to an end. However, the young star clusters have not been significantly age-dimmed yet, and so a large number of them are still detectable.
-
•
For the three elliptical galaxies in our sample (42A, 59B, and 92E) we looked at the radial distribution of GCs of different metallicities. According to the KS-test, metal rich and metal poor populations of 42A and 59B are drawn from different distributions (with confidence of ). The GCs of different metallicities in 92E appear to be well mixed throughout the galaxy. Dry mergers of galaxies with a similar mass could explain this last observation. However, the characteristic features for such a merger (such as shells and streams) are not detected.
The star cluster populations of Hickson Compact Group galaxies are particularly interesting given their potential to reveal the history of dynamical interactions that have clearly been so important in shaping the evolution of individual groups as a whole and the current state of their member galaxies. The sensitive imaging and photometry presented in this catalogue illustrate this point. However, the advantage of adding -band to photometric studies of star clusters is considerable. It breaks the age-extinction degeneracy of the photometry and allows a shift from a qualitative description of cluster ages to a more quantitative analysis, along with determinations of intrinsic reddening and masses. This additional information adds considerably to the descriptive power of star cluster populations in specific environments.
Our future work on star cluster populations of Stephan’s Quintet (HCG 92; Fedotov et al., in prep.) with photometry will illustrate that.
Acknowledgements
K.F. and S.C.G. thank the Natural Sciences and Engineering Research Council of Canada and the Ontario Early Researcher Award Program for support. This research has made use of the NASA/IPAC Extra- galactic Database (NED) which is operated by the Jet Propulsion Laboratory, California Institute of Technology, under contract with the National Aeronautics and Space Administration. Additional support for this work was provided by NASA through grant No. HST-GO-10787.15-A from the Space Telescope Science Institute which is operated by AURA, Inc., under NASA contract NAS 5-26555. We thank Alan McConnachie, John Blakeslee, Pat Côte, and Ruben Sanchez-Janssen for illuminating discussions on the properties of GCs and Peter Stetson for sharing his insight in aperture and PSF photometries. We also thank Theodoros Bitsakis, the referee for this paper, for the supportive encouragement of our work and for suggestions that improved the manuscript. We thank Robert Corless, Gretchen Harris, John Landstreet, and Aaron Sigut for a careful read of the manuscript and their valuable suggestions.
Facilities: HST
References
- Ashman & Zepf (1998) Ashman, K. M., & Zepf, S. E. 1998, Globular Cluster Systems (Cambridge, U. K. ; New York: Cambridge University Press)
- Barmby et al. (2000) Barmby, P., Huchra, J. P., Brodie, J. P., Forbes, D. A., Schroder, L. L., & Grillmair, C. J. 2000, The Astronomical Journal, 119, 727
- Barmby et al. (2006) Barmby, P., Kuntz, K. D., Huchra, J. P., & Brodie, J. P. 2006, The Astronomical Journal, 132, 883
- Barton Gillespie et al. (2003) Barton Gillespie, E., Geller, M. J., & Kenyon, S. J. 2003, The Astrophysical Journal, 582, 668
- Bastian et al. (2005) Bastian, N., Gieles, M., Lamers, H. J. G. L. M., Scheepmaker, R. A., & de Grijs, R. 2005, Astronomy and Astrophysics, 431, 905
- Bitsakis et al. (2014) Bitsakis, T., Charmandaris, V., Appleton, P. N., Díaz-Santos, T., Le Floc’h, E., da Cunha, E., Alatalo, K., & Cluver, M. 2014, Astronomy and Astrophysics, 565, A25
- Bitsakis et al. (2011) Bitsakis, T., Charmandaris, V., da Cunha, E., Díaz-Santos, T., Le Floc’h, E., & Magdis, G. 2011, Astronomy and Astrophysics, 533, A142
- Blakeslee et al. (2012) Blakeslee, J. P., Cho, H., Peng, E. W., Ferrarese, L., Jordán, A., & Martel, A. R. 2012, The Astrophysical Journal, 746, 88
- Bressert et al. (2010) Bressert, E., et al. 2010, Monthly Notice of the Royal Astronomical Society, 409, L54
- Carrasco et al. (2006) Carrasco, E. R., Mendes de Oliveira, C., & Infante, L. 2006, The Astronomical Journal, 132, 1796
- Chandar et al. (2004) Chandar, R., Whitmore, B., & Lee, M. G. 2004, The Astrophysical Journal, 611, 220
- Conti et al. (1996) Conti, P. S., Leitherer, C., & Vacca, W. D. 1996, The Astrophysical Journal, 461, L87+
- de Vaucouleurs et al. (1991) de Vaucouleurs, G., de Vaucouleurs, A., Corwin, Jr., H. G., Buta, R. J., Paturel, G., & Fouqué, P. 1991, Third Reference Catalogue of Bright Galaxies. Volume I: Explanations and references. Volume II: Data for galaxies between 0h and 12h. Volume III: Data for galaxies between 12h and 24h. (Springer)
- Desjardins et al. (2014) Desjardins, T. D., et al. 2014, The Astrophysical Journal, 790, 132
- Fedotov et al. (2011) Fedotov, K., Gallagher, S. C., Konstantopoulos, I. S., Chandar, R., Bastian, N., Charlton, J. C., Whitmore, B. C., & Trancho, G. 2011, The Astronomical Journal, 142, 42
- Gallagher et al. (2001) Gallagher, S. C., Charlton, J. C., Hunsberger, S. D., Zaritsky, D., & Whitmore, B. C. 2001, The Astronomical Journal, 122, 163
- Gallagher et al. (2010) Gallagher, S. C., et al. 2010, The Astronomical Journal, 139, 545
- Gieles et al. (2006) Gieles, M., Larsen, S. S., Bastian, N., & Stein, I. T. 2006, Astronomy and Astrophysics, 450, 129
- Goudfrooij et al. (2003) Goudfrooij, P., Strader, J., Brenneman, L., Kissler-Patig, M., Minniti, D., & Edwin Huizinga, J. 2003, Monthly Notice of the Royal Astronomical Society, 343, 665
- Harris (1996) Harris, W. E. 1996, The Astronomical Journal, 112, 1487
- Harris (2001) Harris, W. E. 2001, in Saas-Fee Advanced Course 28: Star Clusters, ed. L. Labhardt & B. Binggeli, 223
- Harris (2009) —. 2009, The Astrophysical Journal, 699, 254
- Harris et al. (2013) Harris, W. E., Harris, G. L. H., & Alessi, M. 2013, The Astrophysical Journal, 772, 82
- Harris et al. (2006) Harris, W. E., Whitmore, B. C., Karakla, D., Okoń, W., Baum, W. A., Hanes, D. A., & Kavelaars, J. J. 2006, The Astrophysical Journal, 636, 90
- Hickson (1982) Hickson, P. 1982, The Astrophysical Journal, 255, 382
- Hickson (1997) —. 1997, Annual Review of Astronomy and Astrophysics, 35, 357
- Hickson et al. (1989) Hickson, P., Kindl, E., & Auman, J. 1989, The Astrophysical Journal Supplement Series, 70, 687
- Hickson et al. (1992) Hickson, P., Mendes de Oliveira, C., Huchra, J. P., & Palumbo, G. 1992, The Astrophysical Journal, 399, 353
- Johnson et al. (2007) Johnson, K. E., Hibbard, J. E., Gallagher, S. C., Charlton, J. C., Hornschemeier, A. E., Jarrett, T. H., & Reines, A. E. 2007, Astron. J., 134, 1522
- Jones et al. (2003) Jones, L. R., Ponman, T. J., Horton, A., Babul, A., Ebeling, H., & Burke, D. J. 2003, Monthly Notice of the Royal Astronomical Society, 343, 627
- Kennicutt et al. (1987) Kennicutt, Jr., R. C., Roettiger, K. A., Keel, W. C., van der Hulst, J. M., & Hummel, E. 1987, The Astronomical Journal, 93, 1011
- Konstantopoulos et al. (2010) Konstantopoulos, I. S., et al. 2010, The Astrophysical Journal, 723, 197
- Konstantopoulos et al. (2012) —. 2012, The Astrophysical Journal, 745, 30
- Konstantopoulos et al. (2013) —. 2013, The Astrophysical Journal, 770, 114
- Kundu & Whitmore (2001) Kundu, A., & Whitmore, B. C. 2001, The Astronomical Journal, 122, 1251
- Lada & Lada (2003) Lada, C. J., & Lada, E. A. 2003, Annual Review of Astronomy and Astrophysics, 41, 57
- Larsen (2002) Larsen, S. S. 2002, The Astronomical Journal, 124, 1393
- Larsen (2004) Larsen, S. S. 2004, Astronomy and Astrophysics, 416, 537
- Leitherer et al. (1999) Leitherer, C., et al. 1999, The Astrophysical Journal Supplement Series, 123, 3
- Makarov et al. (2014) Makarov, D., Prugniel, P., Terekhova, N., Courtois, H., & Vauglin, I. 2014, A&A, 570, A13
- Marigo et al. (2008) Marigo, P., Girardi, L., Bressan, A., Groenewegen, M. A. T., Silva, L., & Granato, G. L. 2008, Astronomy and Astrophysics, 482, 883
- McConnachie et al. (2008) McConnachie, A. W., Ellison, S. L., & Patton, D. R. 2008, Monthly Notice of the Royal Astronomical Society, 387, 1281
- Mendes de Oliveira et al. (2006) Mendes de Oliveira, C. L., Temporin, S., Cypriano, E. S., Plana, H., Amram, P., Sodré, Jr., L., & Balkowski, C. 2006, The Astronomical Journal, 132, 570
- Mihos & Hernquist (1996) Mihos, J. C., & Hernquist, L. 1996, The Astrophysical Journal, 464, 641
- Misgeld & Hilker (2011) Misgeld, I., & Hilker, M. 2011, Monthly Notice of the Royal Astronomical Society, 414, 3699
- Moles et al. (1998) Moles, M., Marquez, I., & Sulentic, J. W. 1998, Astronomy & Astrophysics, 334, 8
- Moles et al. (1997) Moles, M., Sulentic, J. W., & Márquez, I. 1997, The Astrophysical Journal, 485, L69
- Mould et al. (2000) Mould, J. R., et al. 2000, The Astrophysical Journal, 529, 786
- Muratov & Gnedin (2010) Muratov, A. L., & Gnedin, O. Y. 2010, The Astrophysical Journal, 718, 1266
- Murdin (2001) Murdin, P. 2001, Encyclopedia of astronomy and astrophysics (Bristol: Nature Publishing)
- Nishiura et al. (2000) Nishiura, S., Shimada, M., Ohyama, Y., Murayama, T., & Taniguchi, Y. 2000, The Astronomical Journal, 120, 1691
- Peng et al. (2006) Peng, E. W., et al. 2006, The Astrophysical Journal, 639, 95
- Rejkuba et al. (2005) Rejkuba, M., Greggio, L., Harris, W. E., Harris, G. L. H., & Peng, E. W. 2005, Astrophys. J., 631, 262
- Rhode et al. (2007) Rhode, K. L., Zepf, S. E., Kundu, A., & Larner, A. N. 2007, The Astronomical Journal, 134, 1403
- Robin et al. (2003) Robin, A. C., Reylé, C., Derrière, S., & Picaud, S. 2003, Astronomy and Astrophysics, 409, 523
- Ryon et al. (2014) Ryon, J. E., et al. 2014, The Astronomical Journal, 148, 33
- Sabater et al. (2012) Sabater, J., Verdes-Montenegro, L., Leon, S., Best, P., & Sulentic, J. 2012, Astronomy and Astrophysics, 545, A15
- Scheepmaker et al. (2007) Scheepmaker, R. A., Haas, M. R., Gieles, M., Bastian, N., Larsen, S. r. S., & Lamers, H. J. G. L. M. 2007, Astronomy and Astrophysics, 469, 925
- Schlafly & Finkbeiner (2011) Schlafly, E. F., & Finkbeiner, D. P. 2011, The Astrophysical Journal, 737, 103
- Schlegel et al. (1998) Schlegel, D. J., Finkbeiner, D. P., & Davis, M. 1998, The Astrophysical Journal, 500, 525
- Sirianni et al. (2005) Sirianni, M., et al. 2005, Publications of the Astronomical Society of the Pacific, 117, 1049
- Springel et al. (2005) Springel, V., Di Matteo, T., & Hernquist, L. 2005, Monthly Notices of the Royal Astronomical Society, 361, 776
- Stetson (1987) Stetson, P. B. 1987, Publications of the Astronomical Society of the Pacific, 99, 191
- Sulentic et al. (2001) Sulentic, J. W., Rosado, M., Dultzin-Hacyan, D., Verdes-Montenegro, L., Trinchieri, G., Xu, C. K., & Pietsch, W. 2001, The Astronomical Journal, 122, 2993
- Temporin et al. (2005) Temporin, S., Staveley-Smith, L., & Kerber, F. 2005, Monthly Notice of the Royal Astronomical Society, 356, 343
- Trancho et al. (2012) Trancho, G., Konstantopoulos, I. S., Bastian, N., Fedotov, K., Gallagher, S., Mullan, B., & Charlton, J. C. 2012, The Astrophysical Journal, 748, 102
- Tzanavaris et al. (2010) Tzanavaris, P., et al. 2010, The Astrophysical Journal, 716, 556
- Vacca & Conti (1992) Vacca, W. D., & Conti, P. S. 1992, The Astrophysical Journal, 401, 543
- VanDalfsen & Harris (2004) VanDalfsen, M. L., & Harris, W. E. 2004, The Astronomical Journal, 127, 368
- Verdes-Montenegro et al. (2001) Verdes-Montenegro, L., Yun, M. S., Williams, B. A., Huchtmeier, W. K., Del Olmo, A., & Perea, J. 2001, Astron. Astrophys., 377, 812
- Whitmore et al. (2014) Whitmore, B. C., Chandar, R., Bowers, A. S., Larsen, S., Lindsay, K., Ansari, A., & Evans, J. 2014, The Astronomical Journal, 147, 78
- Whitmore & Zhang (2002) Whitmore, B. C., & Zhang, Q. 2002, The Astronomical Journal, 124, 1418
- Whitmore et al. (1999) Whitmore, B. C., Zhang, Q., Leitherer, C., Fall, S. M., Schweizer, F., & Miller, B. W. 1999, The Astronomical Journal, 118, 1551
- Wilson et al. (2006) Wilson, C. D., Harris, W. E., Longden, R., & Scoville, N. Z. 2006, The Astrophysical Journal, 641, 763
- Xu et al. (1999) Xu, C. K., Sulentic, J. W., & Tuffs, R. 1999, The Astrophysical Journal, 512, 178
- York et al. (2005) York, D. G., et al. 2005, in IAU Colloq. 199: Probing Galaxies through Quasar Absorption Lines, ed. P. Williams, C.-G. Shu, & B. Menard, 58–64