Broad Iron Emission from Gravitationally Lensed Quasars Observed by Chandra
Abstract
Recent work has demonstrated the potential of gravitationally lensed quasars to extend measurements of black hole spin out to high-redshift with the current generation of X-ray observatories. Here we present an analysis of a large sample of 27 lensed quasars in the redshift range observed with Chandra, utilizing over 1.6 Ms of total observing time, focusing on the rest-frame iron K emission from these sources. Although the X-ray signal-to-noise (S/N) currently available does not permit the detection of iron emission from the inner accretion disk in individual cases in our sample, we find significant structure in the stacked residuals. In addition to the narrow core, seen almost ubiquitously in local AGN, we find evidence for an additional underlying broad component from the inner accretion disk, with a clear red wing to the emission profile. Based on simulations, we find the detection of this broader component to be significant at greater than the level. This implies that iron emission from the inner disk is relatively common in the population of lensed quasars, and in turn further demonstrates that, with additional observations, this population represents an opportunity to significantly extend the sample of AGN spin measurements out to high-redshift.
Subject headings:
Black hole physics – Galaxies: active1. Introduction
Information regarding the manner in which the supermassive black holes (SMBHs) powering active galactic nuclei (AGN) grew is encoded in the distribution of their angular momenta (or more specifically their ‘spin’, ; King & Pringle 2006; Berti & Volonteri 2008; Volonteri et al. 2013). For example, if these black holes grew through prolonged episodes of coherent accretion, we should see a preference for rapidly rotating black holes. In contrast, if they grew through a series of chaotic mergers and accretion events we should instead see a lower value for the average black hole spin.
AGN spin measurements are anchored in X-ray spectroscopy, and rely primarily on measuring the relativistic distortions imprinted on fluorescent line emission from the inner disk (Fabian et al. 1989; Laor 1991), which result in intrinsically narrow emission lines being broadened and skewed into a characteristic ‘diskline’ profile. Although lines from a variety of elements are naturally produced in the resulting ‘reflected’ emission when the optically thick accretion disk is irradiated by high-energy X-rays, the most prominent is the iron line at 6–7 keV (depending on ionisation state), owing to its high cosmic abundance and fluorescent yield (George & Fabian 1991). It is also best suited for measuring these relativistic distortions, being relatively isolated from other strong emission lines. For recent reviews on relativistic disk reflection, see Miller (2007) and Reynolds (2013).
Spin estimates for a growing sample of 20–30 local () AGN have been obtained through study of these features, (e.g. Walton et al. 2013; Fabian et al. 2013; Risaliti et al. 2013), and already suggest that many black holes have high spin, although the sample is not yet well defined in a statistical sense (Brenneman 2013; Reynolds 2013). As models linking the cosmic growth of SMBHs and galaxy formation become more advanced (Dubois, Volonteri & Silk 2014; Sesana et al. 2014), detailed comparison with observation will require knowledge of the spin distribution as a function of redshift, extending out to and beyond the peak of AGN activity (; Richards et al. 2006). However, current X-ray instrumentation does not have the sensitivity required to undertake such measurements for typical AGN at these redshifts.
Recently, however, we have demonstrated that strongly lensed quasars offer a rare opportunity to obtain spin measurements from objects at cosmologically interesting redshifts with current instrumentation, owing to the combination of the multiple images observed and the amplification of the intrinsic emission by the lens. The two cases with sufficient signal-to-noise (S/N), RXJ1131-1231 () and Q2237+0305 (aka the Einstein Cross; ), exhibit relativistic iron disklines similar to those observed in local Seyfert galaxies, allowing us to infer that both sources host rapidly rotating black holes (Reis et al. 2014; Reynolds et al. 2014). Here, we examine the iron emission from a sample of lensed quasars with X-ray observations that currently have lower S/N, to investigate whether such iron disklines are common among this population, and whether it could potentially facilitate further high-redshift spin measurements.
2. Sample Selection and Data Reduction
We selected a sample of strong gravitationally lensed quasars from the publicly available CASTLES database111http://www.cfa.harvard.edu/castles/ (numbering 100 lensed quasars in total as of August 2014). We select all those systems characterized as grade A (i.e., confirmed multiply imaged strong gravitationally lensed quasars222per the CASTLES website: “I’d bet my life on it”.) with redshift determinations for both the lens and the quasar (e.g., there are eight grade A systems with no secure redshift for the lens, which we exclude from our analysis). Additionally, both RXJ1131-1231 (Reis et al. 2014) and Q2237+0305 (Reynolds et al. 2014) are excluded from the sample, having individually been shown to exhibit prominent relativistic lines (see also Dai et al. 2003; Chen et al. 2012). We then searched for sources with imaging observations obtained with the Chandra observatory (Weisskopf et al. 2002), restricting ourselves to observations within of the S3 aimpoint on the ACIS detector (Garmire et al. 2003). This resulted in an initial sample of 35 systems. The majority of this sample are lensed by foreground galaxies, but three sources are lensed by galaxy clusters (Q0957+561, SDSSJ1004+4112 and SDSSJ1029+2623; see Chartas et al. 2002, Ota et al. 2006, and Ota et al. 2012, respectively), and two are lensed by galaxies within faint X-ray emitting galaxy groups (PG1115+080 and B1422+231; Grant et al. 2004). We note however that previous work has shown that the cluster/group emission peaks at 1 keV in the observed frame, and that it makes a negligible contribution to the iron bandpass for the quasars in these cases.
All observations were re-processed in ciao v4.5333http://cxc.harvard.edu/ciao, with the EDSER algorithm enabled and with the latest Chandra calibration files. The resulting event files were re-binned to 1/8th of the native ACIS pixel size before smoothing with a Gaussian of 0.25 (FWHM). In those cases where individual images were resolved, spectra were extracted from 0.5 radius regions centered on each individual sub-pixel image via the specextract script with PSF correction enabled. If this was not possible (e.g. due to the quasar images being too close for even Chandra to resolve, or low count rates precluding centroiding), larger extraction regions encompassing multiple images were utilized. All spectra for each source were subsequently combined using the COMBINE_SPECTRA script before grouping to S/N=3 per spectral bin with DMGROUP; we verified that we obtain consistent results using an initial binning of S/N=4. The spectra and background files for all sources were then exported to XSPEC444http://heasarc.gsfc.nasa.gov/xanadu/xspec/ for spectral analysis (v12.8.0m; Arnaud 1996). In the observed frame, the Chandra data are modeled over the 0.35–8.0 keV bandpass.
3. Stacking Analysis
To investigate the iron K emission from our sample we stacked the 2–10 keV data to produce a single, average spectrum, owing to the low photon statistics currently available for the individual sources in our sample (see Table 1), adopting an approach similar to the residuals-based methodology outlined in Chaudhary et al. (2012), as described below (cf. Nandra et al. 1997; Guainazzi, Bianchi & Dovčiak 2006). We limit ourselves to this method, rather than additionally redshift-correcting and stacking the spectra and instrumental responses directly, as Chaudhary et al. (2012) find in their analysis of 2XMM sources that the two methods return consistent results. Furthermore, this method has the advantage that the extinction towards each source can be treated individually.
| Source | \tmark[a] | Total | 2-10 keV | ||
| exposure\tmark[b] | counts\tmark[c] | ||||
| B 1152+199 | 1.019 | 0.439 | 2 | 27 | 1927 |
| SDSS J1226-0006 | 1.12 | 0.52 | 2 | 5 | 48 |
| FBQ 0951+2535 | 1.24 | 0.26 | 2 | 35 | 132 |
| Q 0158-4325 | 1.29 | 0.317 | 2 | 35 | 550 |
| B 0712+472 | 1.34 | 0.41 | 4 | 99 | 627 |
| SBS 0909+532 | 1.377 | 0.83 | 2 | 20 | 1520 |
| Q 0957+561\tmark[d] | 1.41 | 0.36 | 2 | 37 | 10919 |
| SDSS J0924+0219 | 1.524 | 0.39 | 2 | 128 | 735 |
| B 1600+434 | 1.59 | 0.41 | 2 | 31 | 170 |
| HE 0047-1756 | 1.66 | 0.41 | 2 | 40 | 1017 |
| WFI J2033-4723 | 1.66 | 0.661 | 4 | 30 | 378 |
| HE 0435-1223 | 1.689 | 0.46 | 4 | 110 | 1699 |
| PG 1115+080 | 1.72 | 0.31 | 4 | 156 | 6353 |
| SDSS J1004+4112\tmark[d] | 1.734 | 0.68 | 4/5\tmark[e] | 155 | 7745 |
| HE 0230-2130 | 2.162 | 0.52 | 4 | 45 | 1063 |
| SDSS J1029+2623\tmark[d] | 2.197 | 0.55 | 2 | 57 | 1715 |
| PMN J0134-0931 | 2.216 | 0.77 | 4/5\tmark[e] | 1 | 73 |
| HE 1104-1805 | 2.32 | 0.73 | 2 | 131 | 2192 |
| SDSS J1138+0314 | 2.438 | 0.445 | 4 | 51 | 160 |
| MG J0414+0534 | 2.639 | 0.9854 | 4 | 200 | 8696 |
| QSO J1004+1229 | 2.65 | 0.95 | 2 | 19 | 36 |
| Q 0142-100 | 2.72 | 0.49 | 2 | 14 | 407 |
| LBQS 1009-0252 | 2.74 | 0.87 | 2 | 10 | 94 |
| RX J0911.4+0551 | 2.80 | 0.77 | 4 | 65 | 347 |
| HS 0818+1227 | 3.115 | 0.39 | 2 | 20 | 197 |
| B 1422+231 | 3.62 | 0.34 | 4 | 125 | 9509 |
| BRI 0952-0115 | 4.5 | 0.632 | 2 | 20 | 42 |
| Total | 1666 | 58351 | |||
| a The number of lensed images of each quasar included in our sample | |||||
| b Total Chandra exposure in ks | |||||
| c Assessed in the quasar rest-frame | |||||
| d Lensed by a cluster of galaxies | |||||
| e Although there are five lensed images in the optical, only four have | |||||
| robust X-ray detections. | |||||
For each individual source we fit a simple absorbed powerlaw continuum to the full observed bandpass, excluding the rest-frame 3.5–7.5 keV energy range where the iron emission may contribute, and then determined the data/model ratio for the 2–10 keV rest-frame bandpass. This model includes both a fixed Galactic absorption component (Kalberla et al. 2005) and a second neutral absorption component at the redshift of the source that was free to vary, and we limited the photon index to . Of the 35 sources in our initial sample, 8 did not have sufficient data to fit the continuum above and below the iron bandpass. These were subsequently excluded from our analysis, resulting in a final sample of 27 lensed QSOs; the basic details of this sample are presented in Table 1.
We then corrected the ratio spectra obtained for the source redshift, and re-sampled to a common rest-frame energy binning. When re-sampling the ratio spectra, we assumed the counts included in each of the original bins to be evenly distributed across the energy range covered by that bin, and present the results with this analysis. However, identical results are obtained if we instead assume a powerlaw distribution, adopting the photon index obtained from our initial continuum fits for each source respectively. To determine the data/model ratio for each of the new bins, the ratios in each of the overlapping original bins were weighted by the fraction of the energy range of the new bin that they contribute, and then averaged. The fractional uncertainties were determined from the counts in each new bin, assuming Poisson statistics. We re-sampled the 2–10 keV bandpass into 50 evenly spaced energy bins of width 160 eV, slightly broader than the ACIS spectral resolution at the observed iron energies, given the redshift range probed. Finally, we stacked the re-sampled ratio spectra by calculating the weighted average of the individual ratios in each of the new bins. The total number of counts contributing to each of our re-sampled energy bins is always greater than 200. In order to test our re-sampling/stacking analysis, we simulated a series of spectra at different redshifts with a common model, consisting of a powerlaw continuum and a diskline emission line profile, applied our analysis to these simulated spectra, and verified that the stacked residuals reproduced the input line profile. We also confirmed that the results presented below do not depend on our re-sampling, again obtaining consistent results with an analysis re-sampling to 40 bins (200 eV width) instead.
4. Iron Emission
The profile of the stacked iron residuals obtained with our analysis is shown in Figure 1. It reveals a combination of a narrow core, seen almost ubiquitously in local AGN (Nandra et al. 2007), on top of a broader diskline-like component. In order to analyse the stacked iron emission profile, we followed Chaudhary et al. (2012) and generated a powerlaw continuum with the same energy binning as used above, then multiplied this continuum by the observed ratio spectrum. We adopted a photon index of for the continuum, the median of the distribution obtained from our powerlaw fits to the observed sample. This was then imported into XSPEC using FLX2XSP (part of the HEASOFT distribution).
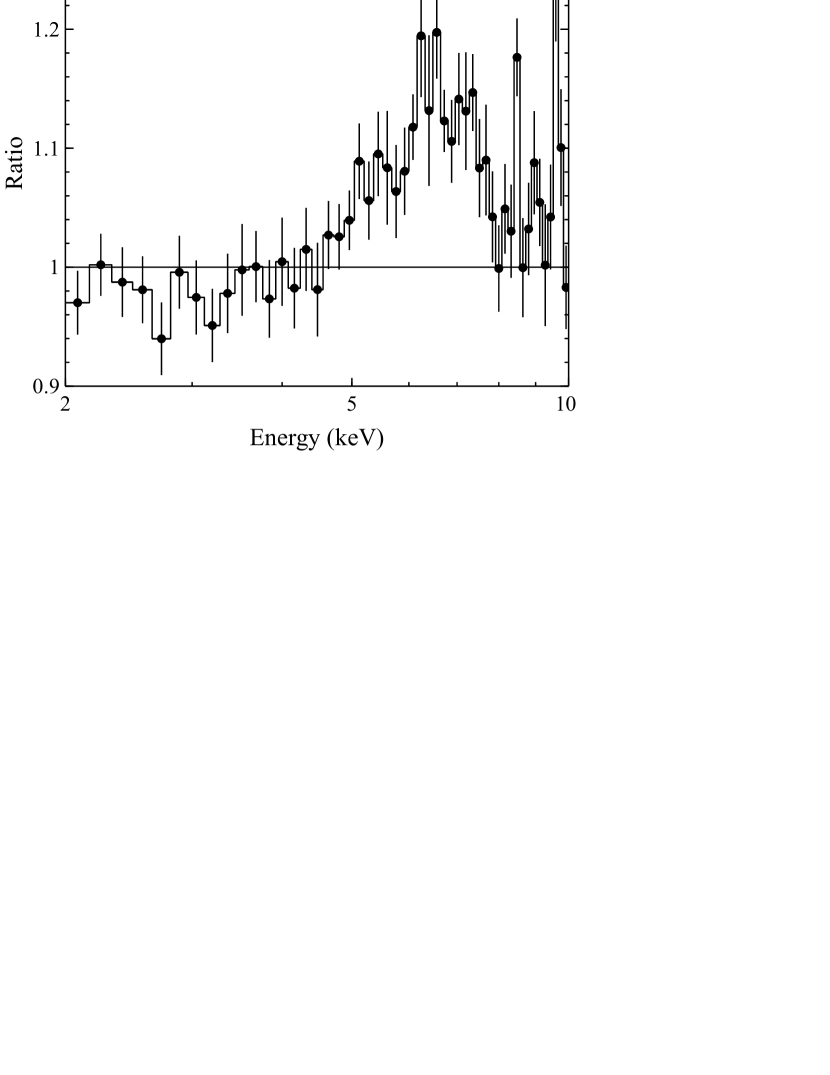
A simple powerlaw continuum provides a poor fit to the resulting spectrum (). We next include a narrow emission line from neutral iron. However, given the range of redshifts, the rest-frame iron lines occur at a range of observed energies. Differences in the spectral resolution of the ACIS detectors at these energies will result in some apparent broadening of narrow features beyond the instrumental resolution at 6 keV when stacking spectra from different redshifts (Iwasawa et al. 2012). Furthermore, our binning of the individual spectra, along with our assumption that photons within these bins are evenly distributed as a function of energy may also result in some broadening of narrow features. In order to assess the combination of these effects we performed a series of simulations (see section 5), and find that our analysis procedure should cause an intrinsically narrow iron emission line to have a width of keV in the stacked spectrum. We therefore fix the width of the narrow line to 0.165 keV in our analysis, and we also fix the energy to that of neutral iron (6.4 keV). The addition of this line improves the fit () and successfully accounts for the narrow core of the observed emission profile. However, broad residuals still remain (see Figure 2).
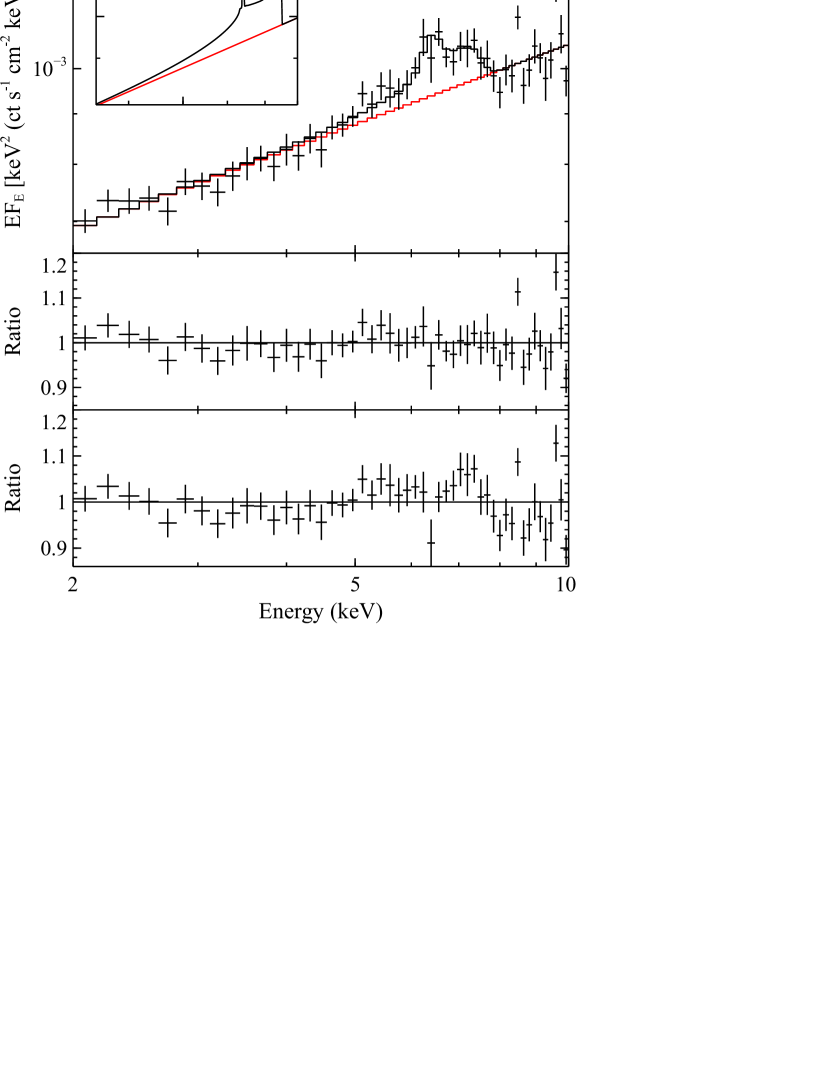
We therefore include a second, broad Gaussian line, which further improves the fit (). The broad component has keV and keV (errors are 90% confidence), significantly larger than the combined broadening of the instrument and our analysis. We also construct a model in which the broad Gaussian line is replaced by a relativistic emission line from the innermost accretion disk, using the RELLINE model (Dauser et al. 2010). Although we are adopting a simplistic approach, modeling what would in reality be a combination of direct continuum and a full reflection spectrum from the inner disk with a powerlaw continuum and a single relativistic emission line, given the S/N more detailed treatments are not warranted, but it is worth noting that the former will also incorporate some contribution from the blurred reflection continuum that would naturally accompany the line. For consistency, the RELLINE component is smoothed with a keV Gaussian, as per the broadening of narrow features in our stacked spectrum. In this model, the details of the line profile are determined by several parameters, and given the signal we are not able to independently constrain them all. We therefore fix several of these parameters to physically motivated values in our analysis, but we stress that the results obtained do not strongly depend on our adopted parameter values.
The parameters we fix are the black hole spin, and the inclination and emissivity profile of the accretion disk. We set the spin to be , motivated by both our previous results for high-redshift lensed quasars (Reis et al. 2014; Reynolds et al. 2014), and the spin implied from the relation between BH spin and radiative efficiency (Thorne 1974) and the average quasar radiative efficiency of found by Soltan (1982). We further assume that the disk extends into the innermost stable circular orbit. The inclination is set to 45∘, roughly similar to that expected for luminous, unobscured quasars. Finally, we adopt a broken powerlaw profile for the radial emissivity of the disk, with an inner index of , an outer index of , and a break radius of . This is motivated by both the compact X-ray source sizes inferred for lensed quasars (Dai et al. 2010; Mosquera et al. 2013; Reis & Miller 2013; MacLeod et al. 2015) and the relativistic ray-tracing work of Wilkins & Fabian (2012). The line energy and normalisation are free to vary, although the energy is constrained to the range of iron transitions (6.4–6.97 keV). The inclusion of this RELLINE component formally provides the best fit of all the models (), and the line energy obtained is keV. The equivalent widths of the relativistic line and the narrow core in our redshift-corrected stacked spectrum are eV and eV. The strength of the relativistic emission is very similar to that expected for reflection from a standard accretion disk (George & Fabian 1991). In addition to testing different spectral binning and re-sampling methods, as discussed above, we have also systematically excluded each source and repeated the analysis on the reduced sample, and find that these results are robust to the exclusion of any individual source.
5. Simulations
In order to interpret these results, we also performed a series of simulations to assess the detection significance of the broad component of the iron emission. Using the Chandra responses, we simulated the spectra for 10,000 samples of 27 sources using FAKEIT in XSPEC, and performed the same stacking analysis outlined above. We simulated an absorbed powerlaw continuum with a narrow ( eV) iron line for each source, using the continuum parameters obtained in our initial analysis of the real sample, an equivalent width of 80 eV and the accompanying Chandra exposure. No broad iron emission component was included. We included counting statistics in our simulations, and rebinned the individual simulated spectra to the same level as the real data before performing the stacking analysis described above. For each of the 10,000 stacked ratio spectra obtained, we analyzed the simulated data in the same manner as above, applying them to a powerlaw continuum and modeling the result in XSPEC. We first model the stacked spectra with a powerlaw continuum and a Gaussian emission line at 6.4 keV. The line width is free to vary, in order to determine the combined broadening introduced by our analysis procedure and the range of instrumental resolutions at the observed Fe K energies (owing to the different source redshifts). As discussed previously, we find the average width for the narrow line in the stacked spectra to be keV. We then add a RELLINE component with the parameters used above, smoothed by a Gaussian with the width linked to that found for the narrow line, and note the improvement in , in order to assess the chance probability of obtaining the observed improvement in the instance that no broad line is actually present. Of the 10,000 samples simulated, only 7 show a chance improvement equivalent to or greater than that observed, implying that the detection significance of the broad feature detected in the real data exceeds the 3 level.
6. Discussion and Conclusions
Following our recent detection of relativistic disk reflection features in two lensed quasars beyond the local universe, RXJ1131-1231 (; Reis et al. 2014) and Q2237+0305 (; Reynolds et al. 2014), we have presented an analysis of a large sample of 27 lensed quasars in the redshift range observed with Chandra, with a combined exposure of over 1.6 Ms. These do not currently have the archival S/N of the two individual cases presented to date. While iron emission has been detected from a few of the sources in our sample individually (e.g. Page et al. 2004), and there have previously been low-significance claims of complexity in the iron bandpass for SDSS J0924+0219 and SDSS J1004+4112 (Ota et al. 2006; Chen et al. 2012), none have robust relativistic line detections, so we focus on stacking the residuals in the iron K bandpass to simple powerlaw AGN continuum models, similar to previous analyses (Nandra et al. 1997; Guainazzi, Bianchi & Dovčiak 2006; Chaudhary et al. 2012). We find that the stacked iron emission from this sample shows both a narrow core and an underlying broad diskline-like component, with a clear red wing to the emission profile (see Figure 1).
The presence of this broad component is robust to the various aspects of our analysis, and is not dominated by the contribution from any one source. This is an important point, as some of the sample may also individually exhibit additional spectral complexities. For example, some Chandra observations of PG1115+080 may show evidence for an X-ray outflow via high-energy iron absorption lines at 7.4 and 8.5 keV (rest-frame; Chartas, Brandt & Gallagher 2003). Five sources are lensed by either galaxy clusters or groups rather than individual galaxies (Chartas et al. 2002; Grant et al. 2004; Ota et al. 2006, 2012), although in all these cases the cluster/group emission is known to be negligible in the quasars iron bandpass. Repeating the analysis excluding these five sources, we find including RELLINE still gives a similar statistical improvement, but the data at the highest energies has much lower S/N. The robustness of the detection of the broad component to the exclusion of any individual source in turn implies it is also robust to such details, and is genuinely representative of the average properties of our sample.
We interpret this broad emission component as iron emission originating from the inner accretion disks of these high-redshift sources. Although the S/N is still low and other interpretations can almost certainly reproduce the data, for example the right combination of complex absorption components could mimic a diskline-like profile (Miller, Turner & Reeves 2009), our interpretation is motivated by several recent results regarding local AGN. With the launch of the NuSTAR observatory (Harrison et al. 2013), high S/N broadband X-ray studies of local AGN are now possible, and have demonstrated the presence of reflection from the inner accretion disk in the Seyfert galaxy NGC1365 (Risaliti et al. 2013; Walton et al. 2014). For the highest S/N local AGN, reverberation of the broad iron emission has also now been detected (Zoghbi et al. 2012; Cackett et al. 2014; Kara et al. 2015), unambiguously demonstrating this emission arises through reprocessing of the continuum close to the black hole. In addition, features consistent with relativistic line emission are observed in both local active galaxies and Galactic black hole binaries (Walton et al. 2012), as expected if they arise from the inner disk. Finally, one of the key advantages of lensed quasars is that the size of the X-ray emitting region can be determined independently through microlensing studies. These typically find the X-ray source to be compact (Chartas et al. 2009; Dai et al. 2010; Morgan et al. 2012; Mosquera et al. 2013), broadly consistent with the sizes inferred from disk reflection/reverberation from local sources. We stress that while microlensing could potentially influence the precise details of the iron emission profile, in particular the radial emissivity, it cannot artificially broaden the line, as it only serves to magnify the intrinsic emission. Regardless, by averaging both over time and over the sample, such effects should naturally be reduced.
Other stacking studies of moderate/high-redshift AGN in the iron bandpass have also shown hints of broad emission (Brusa, Gilli & Comastri 2005; Chaudhary et al. 2012; Iwasawa et al. 2012; Falocco et al. 2013), although typically only at low significance. However, these studies did not focus on lensed quasars, and were not able to take advantage of the magnification of the intrinsic AGN emission. Additionally, this lensing may preferentially enhance the iron emission (Chen et al. 2012), further aiding detection. Our analysis implies that relativistic reflection from the inner disk may be relatively common in this lensed population. This is a key point, as it demonstrates that with further observations this population genuinely provides an opportunity to extend the sample of AGN spin measurements out to high redshift with current instrumentation, beyond the two cases presented to date (Reis et al. 2014; Reynolds et al. 2014). Such measurements would allow us to begin providing observational tests of the basic coherent vs chaotic growth scenarios, and ultimately of the more sophisticated models for SMBH growth and galaxy formation (Dubois, Volonteri & Silk 2014; Sesana et al. 2014).
ACKNOWLEDGEMENTS
The authors would like to thank the reviewer for providing feedback which helped improve this paper, and Julian Merten for useful discussions. The work of DJW/DS was performed at JPL/Caltech, under contract with NASA.
Facilites: Chandra
References
- Arnaud (1996) Arnaud K. A., 1996, in Astronomical Society of the Pacific Conference Series, Vol. 101, Astronomical Data Analysis Software and Systems V, G. H. Jacoby & J. Barnes, ed., p. 17
- Berti & Volonteri (2008) Berti E., Volonteri M., 2008, ApJ, 684, 822
- Brenneman (2013) Brenneman L., 2013, Measuring the Angular Momentum of Supermassive Black Holes, SpringerBriefs in Astronomy, New York: Springer
- Brusa, Gilli & Comastri (2005) Brusa M., Gilli R., Comastri A., 2005, ApJ, 621, L5
- Cackett et al. (2014) Cackett E. M., Zoghbi A., Reynolds C., Fabian A. C., Kara E., Uttley P., Wilkins D. R., 2014, MNRAS, 438, 2980
- Chartas, Brandt & Gallagher (2003) Chartas G., Brandt W. N., Gallagher S. C., 2003, ApJ, 595, 85
- Chartas et al. (2002) Chartas G., Gupta V., Garmire G., Jones C., Falco E. E., Shapiro I. I., Tavecchio F., 2002, ApJ, 565, 96
- Chartas et al. (2009) Chartas G., Kochanek C. S., Dai X., Poindexter S., Garmire G., 2009, ApJ, 693, 174
- Chaudhary et al. (2012) Chaudhary P., Brusa M., Hasinger G., Merloni A., Comastri A., Nandra K., 2012, A&A, 537, A6
- Chen et al. (2012) Chen B., Dai X., Kochanek C. S., Chartas G., Blackburne J. A., Morgan C. W., 2012, ApJ, 755, 24
- Dai et al. (2003) Dai X., Chartas G., Agol E., Bautz M. W., Garmire G. P., 2003, ApJ, 589, 100
- Dai et al. (2010) Dai X., Kochanek C. S., Chartas G., Kozłowski S., Morgan C. W., Garmire G., Agol E., 2010, ApJ, 709, 278
- Dauser et al. (2010) Dauser T., Wilms J., Reynolds C. S., Brenneman L. W., 2010, MNRAS, 409, 1534
- Dubois, Volonteri & Silk (2014) Dubois Y., Volonteri M., Silk J., 2014, MNRAS, 440, 1590
- Fabian et al. (2013) Fabian A. C. et al., 2013, MNRAS, 429, 2917
- Fabian et al. (1989) Fabian A. C., Rees M. J., Stella L., White N. E., 1989, MNRAS, 238, 729
- Falocco et al. (2013) Falocco S. et al., 2013, A&A, 555, A79
- Garmire et al. (2003) Garmire G. P., Bautz M. W., Ford P. G., Nousek J. A., Ricker, Jr. G. R., 2003, in SPIE Conference Series, Vol. 4851, SPIE Conference Series, Truemper J. E., Tananbaum H. D., eds., pp. 28–44
- George & Fabian (1991) George I. M., Fabian A. C., 1991, MNRAS, 249, 352
- Grant et al. (2004) Grant C. E., Bautz M. W., Chartas G., Garmire G. P., 2004, ApJ, 610, 686
- Guainazzi, Bianchi & Dovčiak (2006) Guainazzi M., Bianchi S., Dovčiak M., 2006, Astronomische Nachrichten, 327, 1032
- Harrison et al. (2013) Harrison F. A. et al., 2013, ApJ, 770, 103
- Iwasawa et al. (2012) Iwasawa K. et al., 2012, A&A, 537, A86
- Kalberla et al. (2005) Kalberla P. M. W., Burton W. B., Hartmann D., Arnal E. M., Bajaja E., Morras R., Pöppel W. G. L., 2005, A&A, 440, 775
- Kara et al. (2015) Kara E. et al., 2015, MNRAS, 446, 737
- King & Pringle (2006) King A. R., Pringle J. E., 2006, MNRAS, 373, L90
- Laor (1991) Laor A., 1991, ApJ, 376, 90
- MacLeod et al. (2015) MacLeod C. L. et al., 2015, ArXiv 1501.07533
- Miller (2007) Miller J. M., 2007, ARA&A, 45, 441
- Miller, Turner & Reeves (2009) Miller L., Turner T. J., Reeves J. N., 2009, MNRAS, 399, L69
- Morgan et al. (2012) Morgan C. W. et al., 2012, ApJ, 756, 52
- Mosquera et al. (2013) Mosquera A. M., Kochanek C. S., Chen B., Dai X., Blackburne J. A., Chartas G., 2013, ApJ, 769, 53
- Nandra et al. (1997) Nandra K., George I. M., Mushotzky R. F., Turner T. J., Yaqoob T., 1997, ApJ, 477, 602
- Nandra et al. (2007) Nandra K., O’Neill P. M., George I. M., Reeves J. N., 2007, MNRAS, 382, 194
- Ota et al. (2006) Ota N. et al., 2006, ApJ, 647, 215
- Ota et al. (2012) Ota N. et al., 2012, ApJ, 758, 26
- Page et al. (2004) Page K. L., Reeves J. N., O’Brien P. T., Turner M. J. L., Worrall D. M., 2004, MNRAS, 353, 133
- Reis & Miller (2013) Reis R. C., Miller J. M., 2013, ApJ, 769, L7
- Reis et al. (2014) Reis R. C., Reynolds M. T., Miller J. M., Walton D. J., 2014, Nat, 507, 207
- Reynolds (2013) Reynolds C. S., 2013, Space Sci. Rev.
- Reynolds et al. (2014) Reynolds M. T., Walton D. J., Miller J. M., Reis R. C., 2014, ApJ, 792, L19
- Richards et al. (2006) Richards G. T. et al., 2006, AJ, 131, 2766
- Risaliti et al. (2013) Risaliti G. et al., 2013, Nat, 494, 449
- Sesana et al. (2014) Sesana A., Barausse E., Dotti M., Rossi E. M., 2014, ArXiv e-prints
- Soltan (1982) Soltan A., 1982, MNRAS, 200, 115
- Thorne (1974) Thorne K. S., 1974, ApJ, 191, 507
- Volonteri et al. (2013) Volonteri M., Sikora M., Lasota J.-P., Merloni A., 2013, ApJ, 775, 94
- Walton et al. (2013) Walton D. J., Nardini E., Fabian A. C., Gallo L. C., Reis R. C., 2013, MNRAS, 428, 2901
- Walton et al. (2012) Walton D. J., Reis R. C., Cackett E. M., Fabian A. C., Miller J. M., 2012, MNRAS, 422, 2510
- Walton et al. (2014) Walton D. J. et al., 2014, ApJ, 788, 76
- Weisskopf et al. (2002) Weisskopf M. C., Brinkman B., Canizares C., Garmire G., Murray S., Van Speybroeck L. P., 2002, PASP, 114, 1
- Wilkins & Fabian (2012) Wilkins D. R., Fabian A. C., 2012, MNRAS, 424, 1284
- Zoghbi et al. (2012) Zoghbi A., Fabian A. C., Reynolds C. S., Cackett E. M., 2012, MNRAS, 422, 129