Entanglement modes and topological phase transitions in superconductors
Abstract
Topological insulators and topological superconductors (TSC) display various topological phases that are characterized by different Chern numbers or by gapless edge states. In this work we show that various quantum information methods such as the von Neumann entropy, entanglement spectrum, fidelity and fidelity spectrum, may be used to detect and distinguish topological phases and their transitions. As an example we consider a two-dimensional -wave superconductor, with Rashba spin-orbit coupling and a Zeeman term. The nature of the phases and their changes are clarified by the eigenvectors of the -space reduced density matrix. We show that in the topologically non-trivial phases the highest weight eigenvector is fully aligned with the triplet pairing state. A signature of the various phase transitions between two points on the parameter space is encoded in the -space fidelity operator.
pacs:
03.65.Ud, 03.67.Mn, 74.40.Kb, 03.65.VfI Introduction
Topological phases are non-trivial phases of matter characterized by global entanglement and correlations. Various examples have received increased attention such as the traditional quantum Hall phases, spin liquids, topological insulators and topological superconductors. Due to their nature, topological phases are robust to local perturbations and have received wide attention as possible elements for error-free quantum computation.
In two dimensions, time reversal breaking topological insulators exhibit a charge Hall conductivity that is quantized and proportional to the Chern number of the occupied bands TKNN . Time reversal invariant topological insulators have also been proposed and found experimentally Hasan ; Zhang ; Konig ; Hsieh ; Xia . Such nontrivial topological phases are also characterized by the presence of gapless edge modes Halperin ; Hatsugai .
Superconductivity with non-trivial topology may also be obtained Zhang . It can be due to the pairing symmetry, as is the case of -wave SCs ReadGreen . In semiconductors with Rashba SO coupling it arises when -wave superconductivity is induced and a Zeeman term is added SatoPRL09 ; SauPRL10 . In case the normal phase is already topologically non-trivial, a TSC may be obtained if -wave superconductivity is induced by proximity effect Fu ; QHZ10 . Topological phases and their phase transitions in topological superconductors may be detected through the existence of zero bias peaks in tunneling spectroscopy experiments Mourik ; Das ; Deng ; Fan due to Majorana end states, including spatially resolved peaks Yazdani , or through anomalous Fraunhofer patterns or fractional Josephson effects Veldhorst ; Williams ; Rokhinson . Multiple Andreev reflection current in voltage-biased junctions has also been proposed as a signature of topological order Pablo , in particular, in the derivative of the current and in the zero-bias conductance of nodal noncentrosymmetric SCs Schnyder . The imaginary part of at finite frequency may also be used to signal topological phases Ojanen , as well as the Hall conductivity and its derivatives us3 .
On the other hand, the interplay between quantum information and condensed matter physics has been extensively considered, such as the use of entanglement amico in the study of zero-temperature quantum phase transitions sachdev . This interrelation has been explored in the reanalysis of several non-trivial exactly solvable models, using different information measures to better understand the underlying physics latorre-2004-4 ; gu-2005-71 ; gu_pra_68 ; gu ; goteborg ; vidal-2006-73 ; vidal-2006 ; gu_prl_93 . For a bipartite system, besides the von Neumann entropy and related quantitiesnielsen.chuang , other information measures like the concurrencewooters , the mutual informationvedral_njp6 ; gu_qp_1 ; gu_qp_2 , the negativityvidal , or the Meyer-Wallachmeyer and the generalized global entanglement measuresoliveira_pra_73 ; miranda have been considered. The effect of the quantum statistics has been analyzed for free electronslunkes05-2 and bosonsheaney06 , and for electrons in a BCS superconductoroh04 .
The distinguishability between states through the fidelity, has also been used as a possible criterion to detect quantum phase transitions. By its own nature, fidelity between pure ground states signals a change of state as one approaches a quantum phase transition Gu ; zanardi-first ; zanardi-free_fermion ; buonsante-prl ; oelkers ; chen-excited ; min ; zhou ; zanardi-differential ; zanardi-scaling ; wen-long-thermal . The fidelity between mixed states has also been used as a signature of quantum phase transitions Zhou ; us and to distinguish between different states of matter at finite temperatures BCS ; Zanardi_t1 ; Zanardi_t2 .
As argued in Ref. Haldane, , a more detailed information about a mixed state may be obtained if the entanglement spectrum is analyzed. Considering reduced density matrices, where part of the degrees of freedom are integrated over, it was shown, in the context of the quantum Hall effect Haldane ; Bernevig and in the context of coupled spin chains Poilblanc , that the ground partitioning state entanglement spectrum of a subsystem contains information about excited energy states, of the frontier of the subsystem with the complementary subsystem . Other partitioning of the system have been proposed that lead to further information Bernevig2 . Considering a partitioning in momentum space, it was shown that information about energy excitations of a single Heisenberg chain is contained in the groundstate wave function, through the entanglement spectrum Arovas .
One may also consider us2 ; guafter the spectrum of the fidelity operator between two density matrices, and . Its set of eigenvalues , which is denoted fidelity operator spectrum, and , called the fidelity spectrum, provide more information as compared to the fidelity (its trace). This parallels the extra information provided by the entanglement spectrum Haldane , as compared to the von Neumann entropy. In the case of two equal mixed states, the operator has a set of eigenvalues, , such that reduces to the entanglement spectrum.
Quantum information methods have also been used to detect the more elusive topological phases and transitions. Kosterlitz-Thouless transitions were successfully detected calculating the fidelity susceptibility of the spin chain min ; chen77 . A study of the one-dimensional asymmetric Hubbard model showed that, different scaling regimes of the fidelity susceptibility may be used to distinguish the two phases gu77 . Other systems that display topological phases were also studied, like spin- particles on a torus hamma77 , the toric code model and the quantum eight-vertex model abasto78 and the spin honeycomb Kitaev model yang78 . In the case of the Hubbard model it was shown that the fidelity metric satisfies an hyper scaling campus78 and in the Kitaev honeycomb model it was found a different temperature scaling behavior in the different phases abasto79 and a divergent fidelity per lattice site, showing that a local measure is also able to detect the global entanglement regime zhao80 , as in other systems eriksson ; castelnovo ; trebst ; wang10 .
In this work we will be interested in applying various quantum information measures to study the topological phases and phase transitions in a topological superconductor. In particular, we will consider the entropy, entanglement spectrum, fidelity and fidelity spectrum, focusing on global properties. We consider a momentum space partitioning, since the Hamiltonian factorizes. In general, the groundstate is a singlet and the entropy vanishes. At the transitions between the various phases the spectrum is gapless and degenerate leading to a finite entropy. The opposite result is obtained for the fidelity between two density matrices, defined close by in parameter space; when both density matrices are defined in the same phase the fidelity approaches one and when the transition is reached the fidelity has a minimum. However, the momentum space contributions to both the entropy and fidelity, or the entanglement spectrum and fidelity spectrum contain a richer structure. Also, the eigenvectors of the reduced density matrix reveal the nature of the state in a given phase and, in particular, the change across a topological transition from a trivial to a non-trivial phase. A recent use of the fidelity and fidelity susceptibility was carried out to study a one-dimensional spinless superconductor with end Majorana fermions wang2013 . Here we consider a two-dimensional superconductor with a parity breaking Rashba spin-orbit term that, in general, mixes singlet and triplet pairings Gorkov . Also, a Zeemann term is added leading to a rich phase diagram sato with different topological phases, that can be characterized by the Chern number, gapless edge states and winding number sato ; us3 .

In section II we present the model studied and the entities used to detect the quantum transitions. In section III we present the calculation method and our results for the entropy. In section IV we present results for the entropy spectrum and the analysis of the band structure of the system. Also, we show how the eingenvectors of the system can be useful for a better understanding of the transitions. The eigenvalues and eigenvectors of k-subspace reduced density matrices are considered in subsection IV.1. In section V we present the calculation method and our results for the fidelity, and show how it clearly detects the quantum transitions. In section VI we present our main conclusions. Finally, in the appendices we show in detail the results for the eigenvector of the largest eigenvalue of the density matrix and the reduced density matrix.
II Topological superconductor
We consider a two-dimensional triplet superconductor with -wave symmetry. This model was studied in Refs. sato, ; us3, . We write the Hamiltonian as
| (5) |
where and
| (6) |
Here, is the kinetic part, denotes the hopping parameter set in the following as the energy scale, is the chemical potential, is a wave vector in the plane, and we have taken the lattice constant to be unity. Furthermore, is the Zeeman splitting term responsible for the magnetization, in energy units. The Rashba spin-orbit term is written as
| (7) |
where is measured in the energy units and . The matrices are the Pauli matrices acting on the spin sector, and is the identity.
The pairing matrix reads
| (8) |
We consider a situation where the spin-orbit coupling is such that the pairing is aligned Sigrist2 along the spin-orbit vector as and is a scale parameter. This is a situation expected if the spin-orbit is strong (other cases were considered in ahe ; us3 ).
The energy eigenvalues and eigenfunction may be obtained solving the Bogoliubov-de Gennes equations
| (9) |
The 4-component spinor can be written as
| (10) |
The energy eigenvalues can be written as
| (11) |
where and
| (12) |
and
| (13) | |||||
The gap of the lowest band closes when .
Since a topological transition may occur when a gap closes, the gapless points may indicate the presence of topological transitions. One way to characterize various topological phases is through the Chern number, obtainable as an integral over the Brillouin zone of the Berry curvature xiao ; Fukui . The locations of the gapless points may also be detected by the Berry curvature of the bands. When two bands become close there is a peak in the Berry curvature. It can be shown that for the lowest band, there are sharp peaks at the time-reversal momenta (as defined in Ref. sato, ) , and . The second band shows peaks at the various characteristic momenta, as discussed above for the entropy. Summing over the occupied bands the Chern number has been calculated sato ; us3 . The results in the parameter space are shown in Fig. 1 using the typical parameters , , and . From now on all figures use the same set of parameters, unless stated otherwise.
Non-trivial topological order for non-interacting Hamiltonians can be related with the presence or absence of time-reversal symmetry (TRS), particle-hole symmetry and chiral symmetry Ludwig ; LudwigAIP ; LudwigNJP . In Bogoliubov-de Gennes systems, particle-hole symmetry is always present, and TRS is determinant to the nature of possible topological phases in two dimensions. The superconductor we consider here is time-reversal invariant if the Zeeman term is absent. The system then belongs to the symmetry class DIII where the topological invariant is a index (the TRS operator is such that ). If the Zeeman term is finite, TRS is broken and the system belongs to the symmetry class D (the TRS operator is such that ). The topological invariant that characterizes this phase is the first Chern number , and the system is said to be a topological superconductor.
Due to the bulk-edge correspondence, complementary information on the topological phases and transitions may be obtained analyzing the edge states. If and the pairing is -wave, the system is in a topologically trivial phase: there is only the bulk gap and no gapless (edge) states. In the case of p-wave or when there is a mixture of s- and p-wave components, and the amplitude of the p-wave pairing is larger than the corresponding amplitude of the s-wave case, there are two counter-propagating edge modes that give opposite contributions to the total Chern number, ( phase) sato .
As the magnetization is turned on, TRS is broken. For small magnetization, the superconductor is in a trivial phase with Chern number . A finite magnetization is then necessary to cause a topological phase transition to a phase with non-zero Chern number sato . This happens both for the p-wave case and the s-wave case. The sequence of Chern numbers is clearly correlated with the number of pairs of edge states as shown in Ref. sato, . It is interesting to note that even though the system is in a phase the number of edge states is two; the same as that in the parent phase, when sato . The presence of edge modes induced by bulk topology can also be shown using dimensional reduction and thereby calculating the winding number Wen . The calculation of the winding number gives the number of gapless edge modes both when the Chern number vanishes and when the Chern number is finite sato .

III von Neumann entropy
Since the Hamiltonian is separable in momentum space, the density matrix operator for a momentum may be defined as usual as
| (14) |
with , defined from equation (5). In the diagonal basis it is written as
| (15) |
It is convenient to introduce a basis representation for the density matrix in terms of the occupation numbers for a given momentum (and its symmetric) and the two spin projections. The eigenvalues of the density matrix are obtained if we diagonalize the Hamiltonian in the same basis. We consider the representation
| (16) |
The diagonalization of the Hamiltonian matrix in this enlarged basis is written as
| (17) |
note that here is just an index number and should not be confused with the occupation number of equation (16).
In the same basis the density matrix may be written as
| (18) |
Therefore the eigenvalues of the density matrix may be written as where
| (19) |
The entropy for each momentum can be obtained using that
| (20) |
and the total entropy is obtained summing over the Brillouin zone
| (21) |


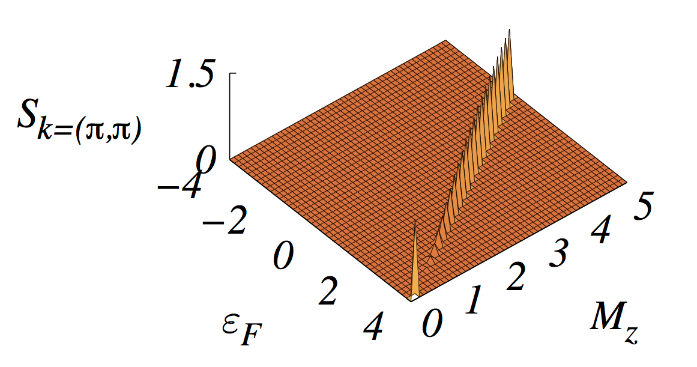
The results for the entropy as a function of chemical potential and magnetization (Zeeman term) are shown in Fig. 2, for a temperature parameter , where (). At very low temperature the entropy is of the type , where is the degeneracy of the lowest state. In general, the lowest state is non-degenerate and the entropy vanishes. At the transition points the system becomes gapless and, at some points in momentum space, the lowest state becomes degenerate and the entropy is finite. Integrating over momentum we sum over the various gapless points. As can be seen comparing Fig. 1 and Fig. 2 the entropy tracks very well the topological phase transitions. Except at the transitions, the entropy is featureless and does not distinguish between the various topological phases.
Further insight is obtained if we analise the entropy as a function of momentum, in order to understand the origin of the peaks in Fig. 2. At there are three peaks in Fig. 2 at chemical potentials . Those are special points, degenerate at absolute zero temperature, with values , and , respectively. The fact that those points occur at has to do with the choice of (for those peaks occur at ). These peaks are due to singularities at momenta , respectively, and their equivalent points in the Brillouin zone. At very low temperature the peaks get very sharp. Therefore, a small finite temperature is used for better visualization.
The energy spectrum degenerate gapless points are also seen in the bands of the matrix representation of the hamiltonian . These are shown in Fig. 3, where we have considered the same special points, , in the phase diagram. Their relevance also extends beyond those particular chemical potential values. As shown in Fig. 4 the momenta responsible for the various transition lines is the same set. The lines that emerge from are associated with , the lines that emerge from are associated with and those from with .


IV Entanglement spectrum and eigenvectors
The entanglement spectrum of a bipartite system with a real space partition, provides interesting information about the states along the interface between the two subsystems, as discussed in the introduction. The momentum space partition carried out in this work, originating in the Fourier partial diagonalization of the Hamiltonian, provides information about the spectrum in each momentum separately. Even though this partition is trivial, a detailed analysis reveals interesting information about the entanglement of the system, through the entanglement spectrum and the eigenvectors of the reduced density matrix. The entanglement spectrum can be seen from Fig. 3 since it is simply the spectrum of the hamiltonian matrix , once both are diagonal in the same basis states. At low temperatures, this translates to a spectrum of the -space density matrix where the lowest band has an eigenvalue close to unity and all others close to zero (except at the degenerate points where the lowest state has an eigenvalue which is the inverse of the degeneracy).
The eigenvectors provide additional information about the phases of the system, and in particular provide interesting information about the transitions. In general, each eigenvector is written as a linear combination of the 16 basis states used, . It turns out that in most cases, out of the 16 coefficients, only a few are non-zero, for each eigenvector. Their physical interpretation is in several cases clear, and it is possible to understand the physical content of the dominant eigenstates, and what changes as a transition occurs.
The dominant states are: i) the states and corresponding to the spin triplet pairing, ii) the state corresponding to an empty state in momentum and spin spaces, iii) the state corresponding to a basis state fully occupied with 4 electrons (for a given momentum and its symmetric and both spin components), iv) the states corresponding to the spin singlet pairing. Other states are also present but their coefficients are typically quite small.
In Figs. 5,6,7 we show results for the absolute value of the coefficients of the most important contributions to the eigenvector, corresponding to the highest eigenvalue of the - density matrix (corresponding to the lowest band of the hamiltonian matrix). In Fig. 5 the magnetization is fixed, the chemical potential is changing and each panel corresponds to the three singular momenta values. The set of chemical potential values are those corresponding to the horizontal dashed line in Fig. 1. In Fig. 6 the chemical potential is fixed at and the magnetization is varied tracing the vertical dashed line of Fig. 1. In Fig. 7 we consider similar plots but for arbitrary momenta values not corresponding to any of the singular momenta.
Along the dashed horizontal line the Chern number changes from . The symmetry in the sequence of the Chern numbers around half-filling () is however not directly manifested, neither in the results for the coefficients, nor for the momenta where the transitions are detected. But the symmetry comes out if we group the coefficients by similar spin pairing states, as shown in the appendix. The transitions crossed by the dashed line are detected considering , respectively. This is understood from the results of Fig. 4.
The most important contribution of the coefficients analysis is that they reveal the nature of the states in each phase. An individual special analysis shows that, for small chemical potential values, the empty state has the highest coefficient. As a transition occurs, the spin triplet basis state becomes the dominant until the next transition occurs, when the fully occupied state becomes the dominant one. This sequence happens at different chemical potentials: those corresponding to the specific transition line for which, at given momentum value, the lowest band becomes gapless. Close to the various transitions the spin singlet states and also contribute.
Similar results are obtained crossing the transitions by the vertical dashed line, shown in Fig. 6, where the sequence of transitions is now observed as a function of varying magnetization, at fixed chemical potential. However, it is shown that, after a given transition, the spin triplet state becomes the dominant one and prevails until large values of the magnetization. Also, for low and before the transition, depending on the momenta considered, the dominant state is either the empty state or the fully occupied state. It turns out that, counter-intuitively, for chemical potential the dominant state is the fully occupied state for momenta close to the origin of the Brillouin zone, while the empty state is the dominant contribution close to the edges of the Brillouin zone.
The sharpness of the contribution of the various coefficients is lost, as shown in Fig. 7, if the momenta are not the singular points. In this case no transitions are observed but their effect is still seen in broad features.

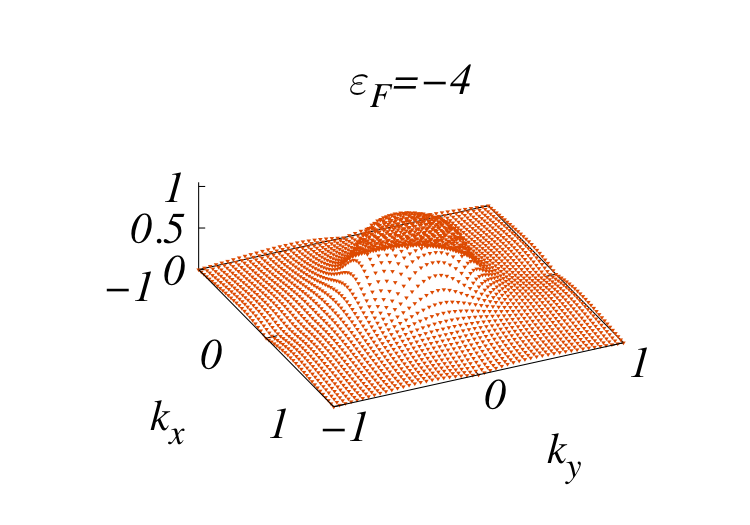

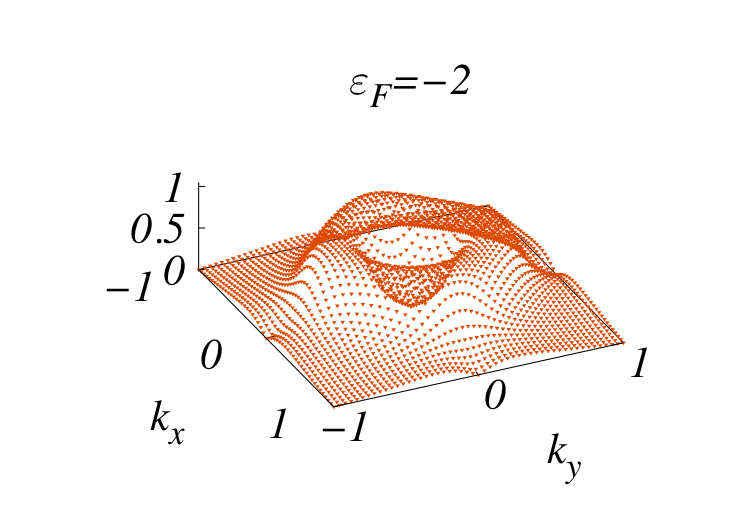
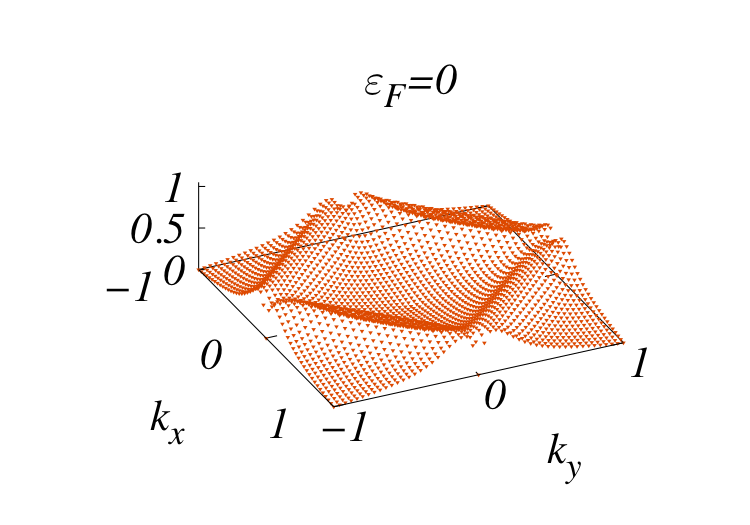
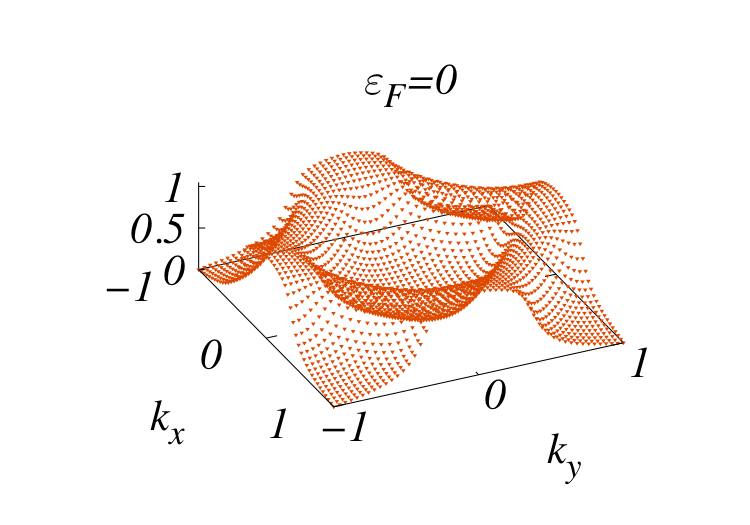
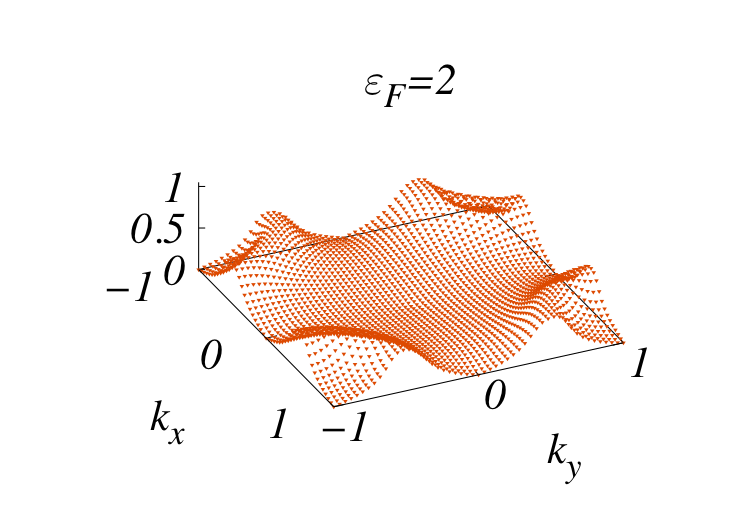
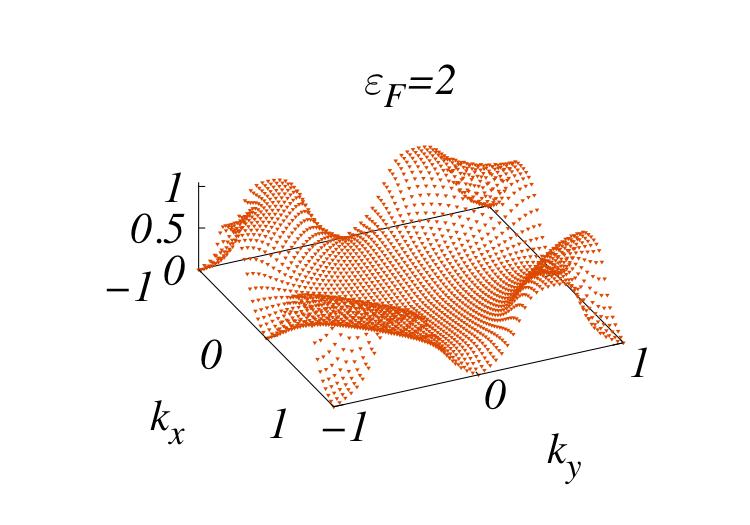
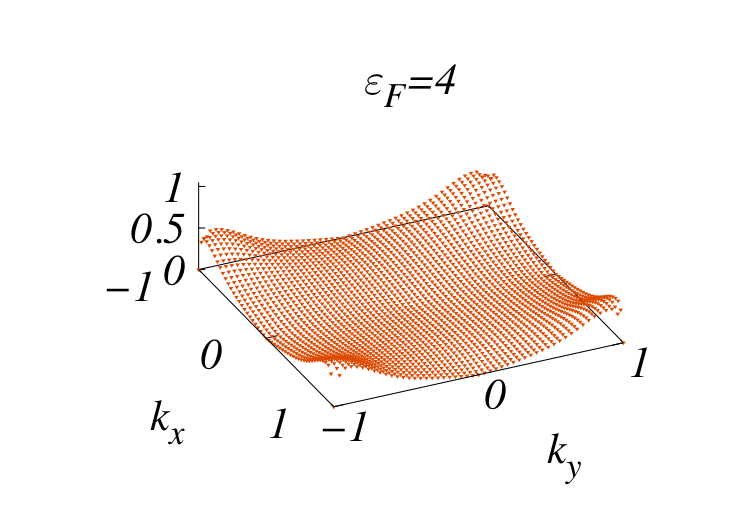
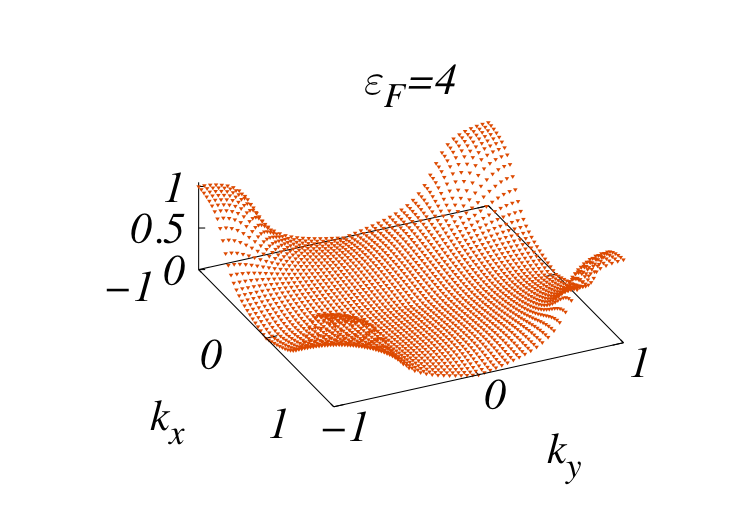
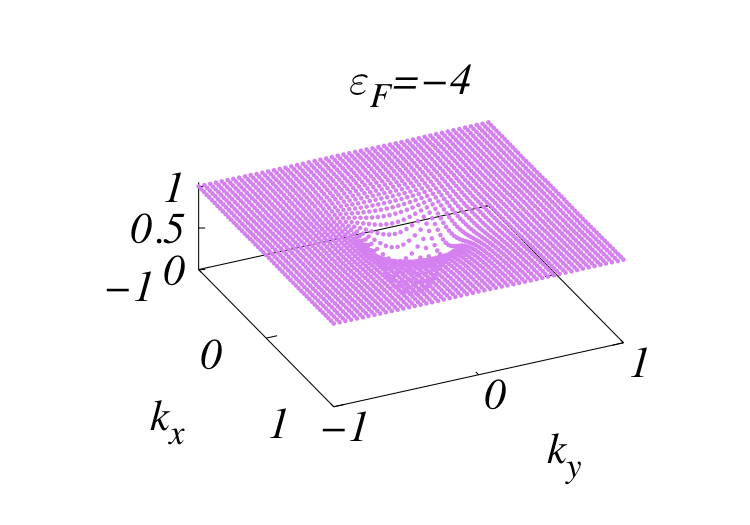
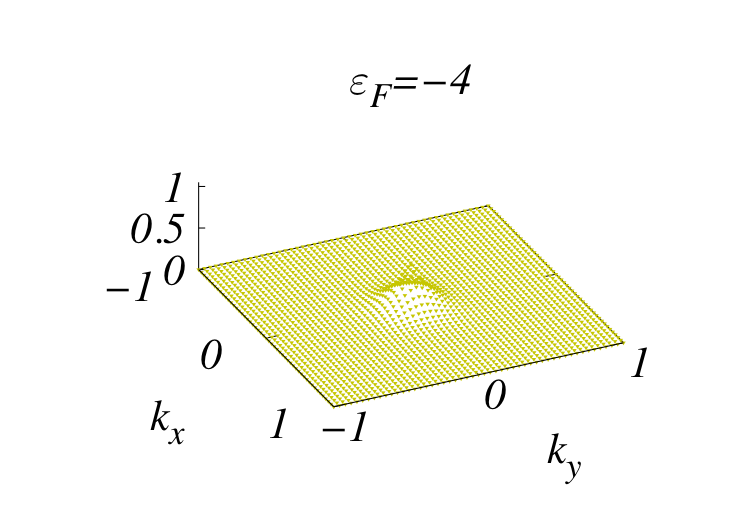
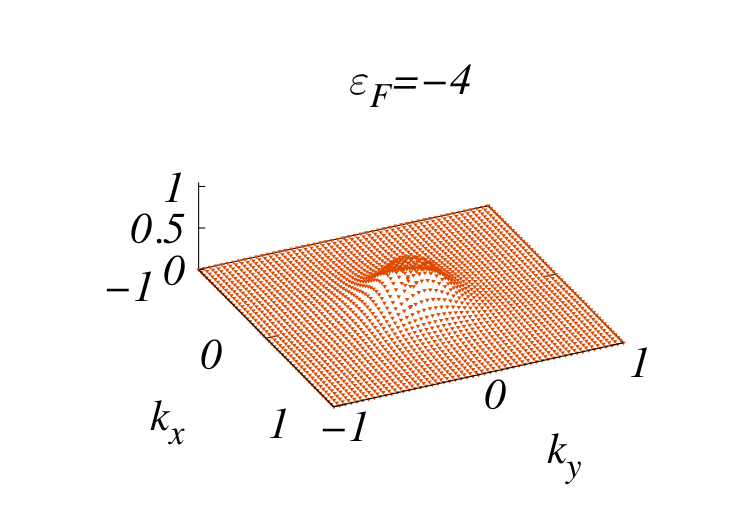
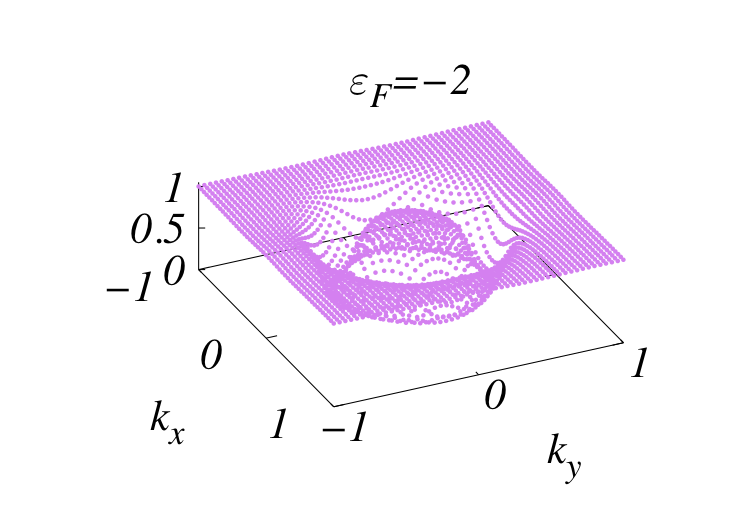
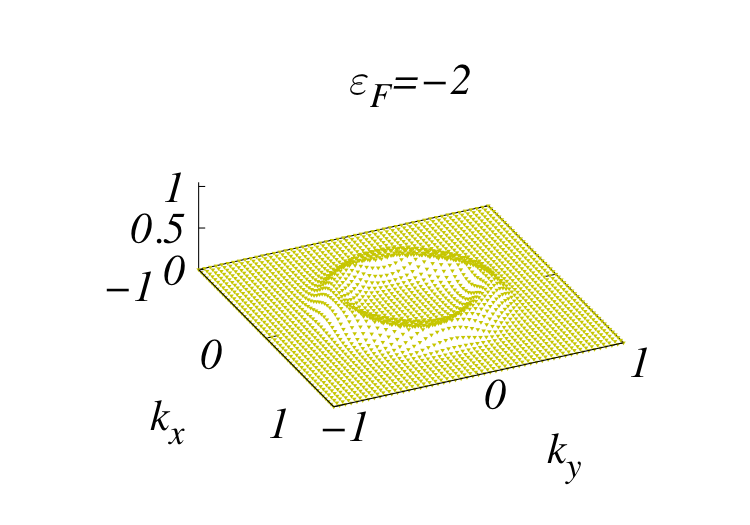
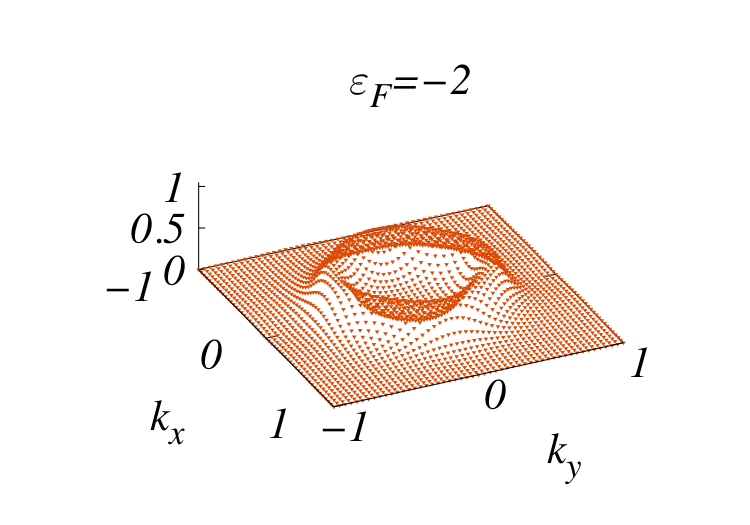
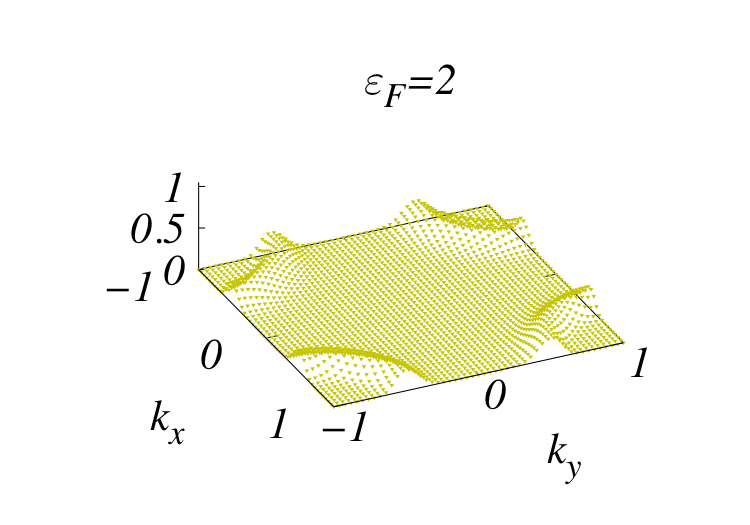
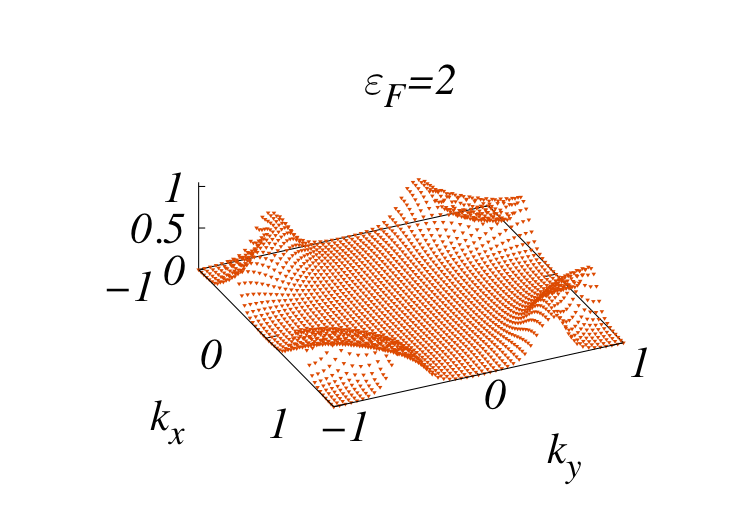
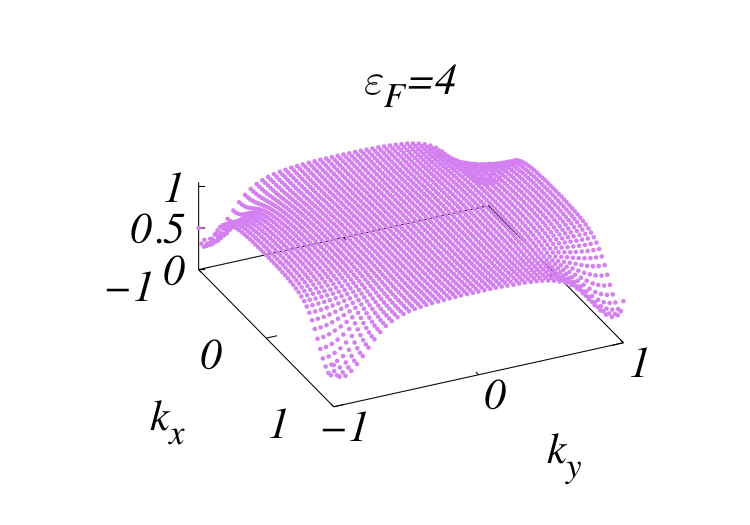
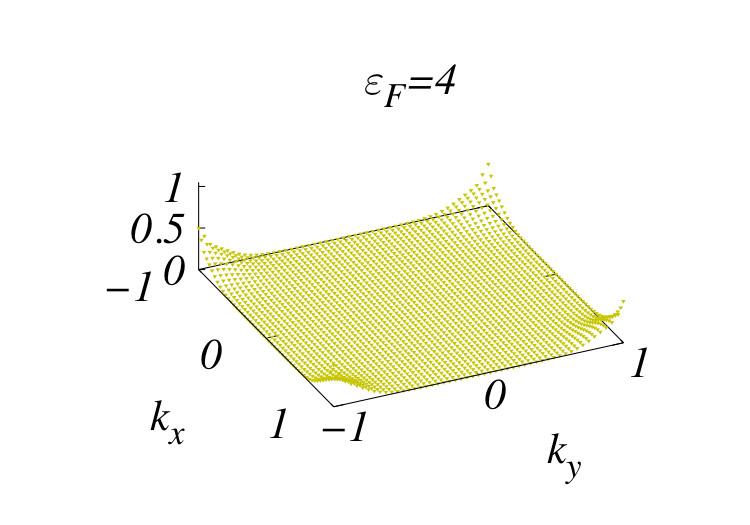
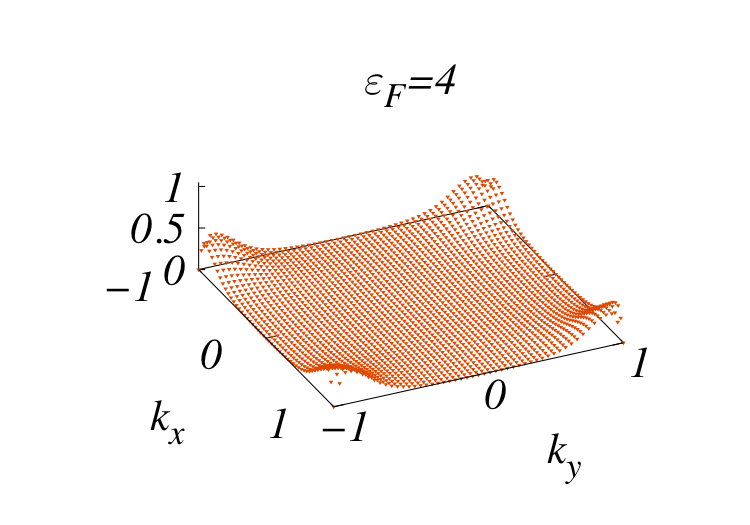
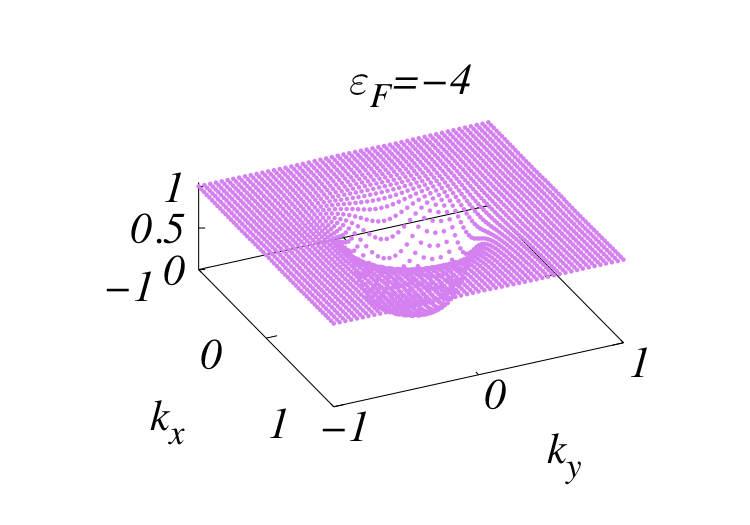
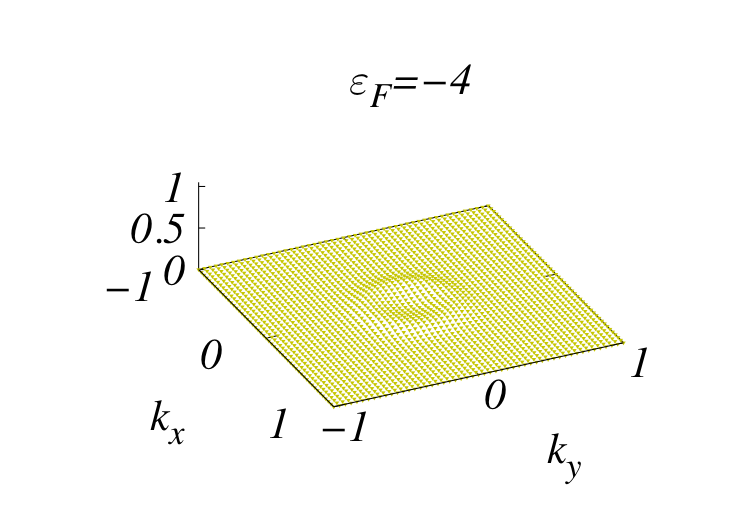
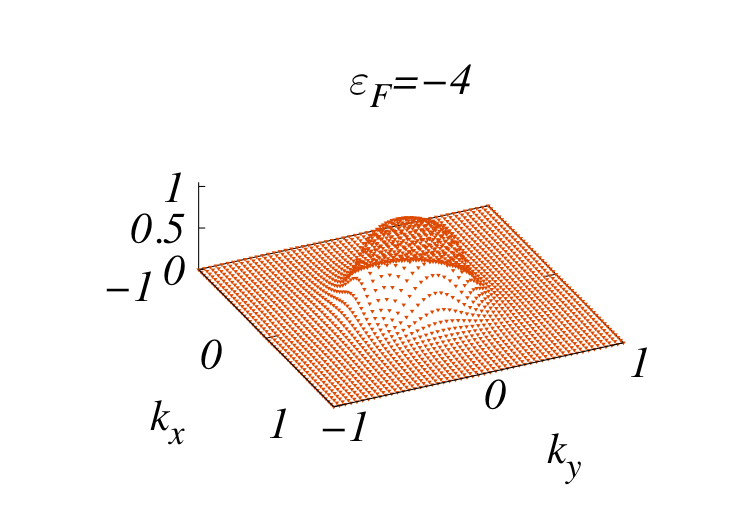
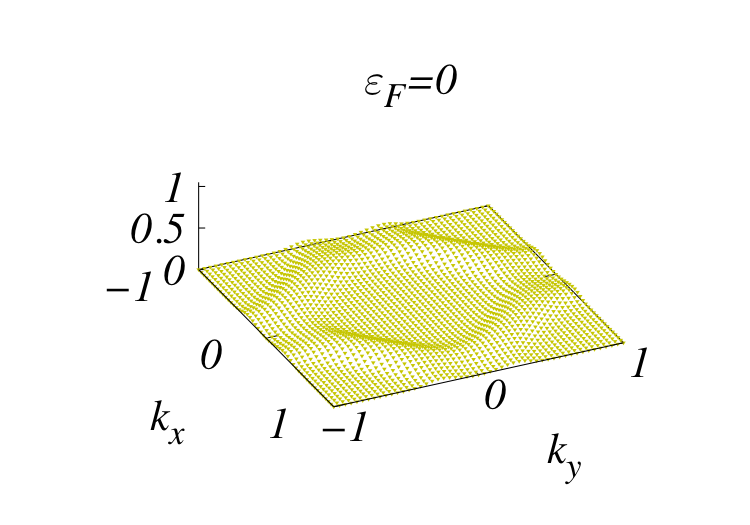
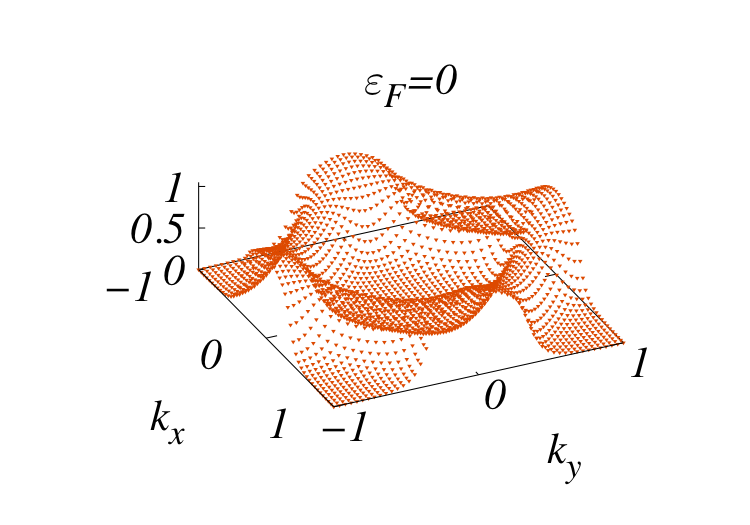
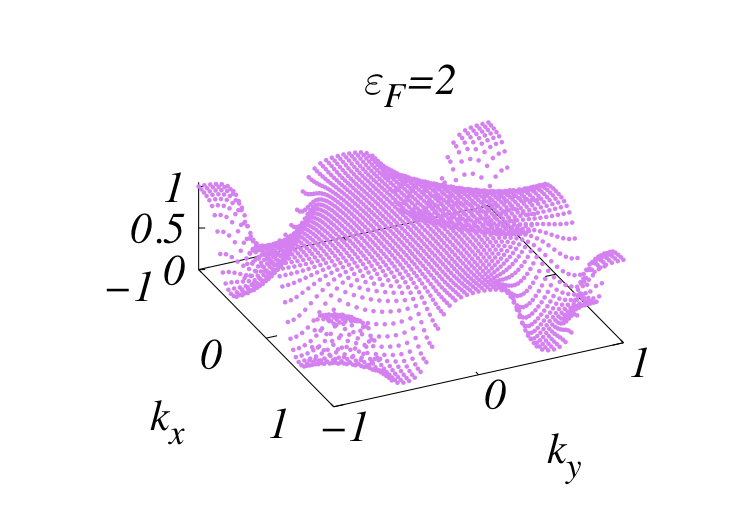
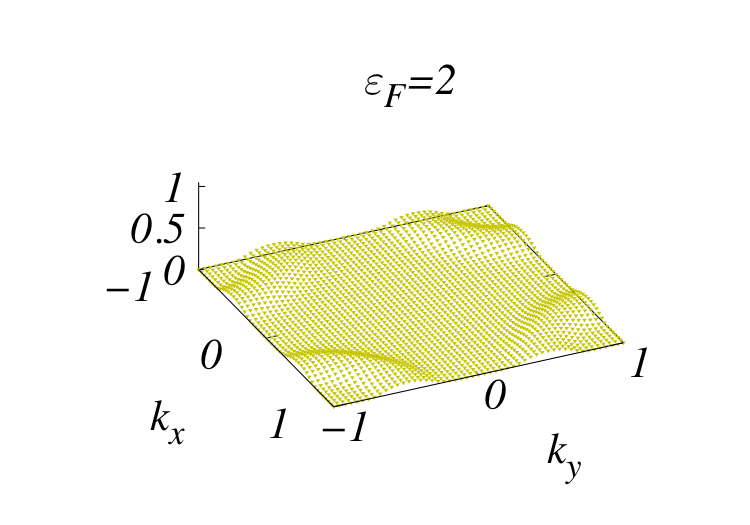
As Figs. 5, 6 indicate, the topological phases with finite Chern number, are associated with a large coefficient of the triplet contribution. In Fig. 8 we show the momentum dependence of the absolute value of the triplet pairing coefficient for (left column) and (right column). Note that for the system is in a phase in the region where . For finite magnetization the system is in a phase with either finite or vanishing Chern number. For both values of the magnetization, there is a clear correlation between the absolute value of the triplet coefficient and the location of the Fermi surface which expands as the chemical potential is increased. At small chemical potential the Fermi surface is centered around zero momentum. Increasing the chemical potential the Fermi surface will approach the point and equivalent, and as the chemical potential increases further the Fermi surface will approach the point and equivalents. The amplitude of the coefficient is larger in the case of . For the two spin orientations of the triplet state are degenerate and it can be seen that the amplitude is fairly constant along the Fermi surface. When the magnetization is finite, there is a larger amplitude in the neighborhood of the singular points previously found for the entanglement entropy and fidelity. In this case, near these points, and depending on the chemical potential, the coefficient is close to saturation, which implies that the triplet state is dominant over all other basis states.
In Appendix A further detailed results for the eigenvector structure are presented. The results show that the topological phases may be identified by the saturation of the spin triplet contribution. The empty and doubly occupied states usually dominate over the Brillouin zone, except near the Fermi surface, where the main contribution comes from the triplet and singlet pairing states.
IV.1 -subspace reduced density matrix


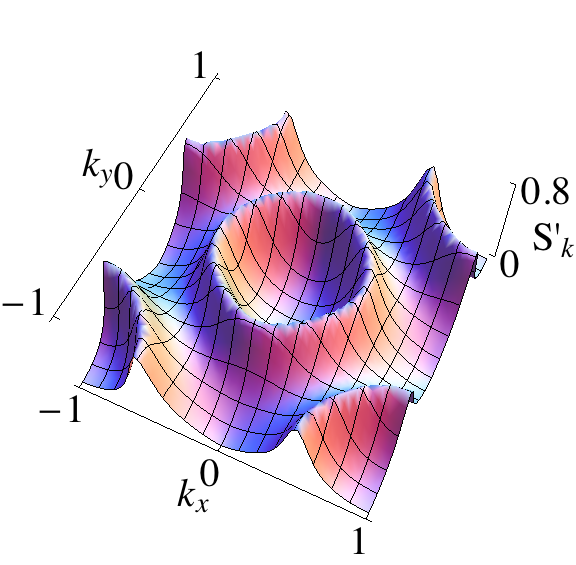
Since the Hamiltonian is additive in momentum space the density matrix is factorizable leading to a density matrix as expressed in eq. (11). We have diagonalized using the number occupation basis shown in the same equation. This leads to a matrix both for the Hamiltonian and the density matrix (this density matrix may be understood as a reduced density matrix by integrating over all other momenta). Even though the many-body system is highly entangled in terms of wave functions (Slater determinant), at zero temperature this entanglement is hidden by the occupation number representation. We may however, consider a subspace within each momentum value.


The basis states lead to a density matrix expressed as
where each number operator takes the values . The diagonalization of the Hamiltonian was obtained through a unitary transformation in the way
| (22) |
This transformation also diagonalizes the density matrix, which allows us to calculate the diagonal form of it, , through eq. (19). Therefore, having diagonalized the Hamiltonian we can obtain the density matrix
| (23) |
We may now construct a -subspace density matrix with dimension in a reduced space by tracing out part of the degrees of freedom. If we define as part A the momenta (with up and down spin) and a part B with momenta (with up and down spin), the reduced density matrix is obtained tracing out the degrees of freedom, for instance, of part B, and we are left with a density matrix for part A. This choice gives the entanglement between A and B which is the entanglement between electrons with momentum and momentum , characteristic of superconductivity, including the singlet and the triplet pairings.
Let us call the reduced density matrix of dimension . It can be obtained element by element as
This density matrix gives information on the entanglement between electrons of opposite momenta.
Alternatively, we may also define
and now, this density matrix gives information on the entanglement between electrons of opposite spins.
The diagonalization of these reduced density matrices leads to 4 eigenvalues. Typically the two smaller eigenvalues take very small values and, since they are normalized to one, the second largest eigenvalue is basically the difference to one of the largest eigenvalue. As shown before us2 the largest eigenvalue takes values close to unity in most of the Brillouin zone, except near the Fermi surface, where it decreases in value. This is shown in Fig. 9: in the first panel we plot the lowest positive energy band obtained from the solution of the Hamiltonian, eq. (11) and in the second panel we plot the largest eigenvalue of the reduced density matrix . Further information may be obtained calculating the entropy of this -subspace reduced density matrix, defined as
| (26) |
The results for the entropy are shown in the third panel of Fig. 9 for the same set of parameters, . The decrease of the largest eigenvalue is matched by the increase of the entropy, which therefore locates the region of the transition in momentum space between the occupied states and the unoccupied states defining the Fermi surface.
In Fig. 10 we compare the entropy between the reduced density matrices and at another point in the phase diagram, (). The entropy is clearly larger in the case of the entanglement between opposite momenta, as expected from a superconductor.
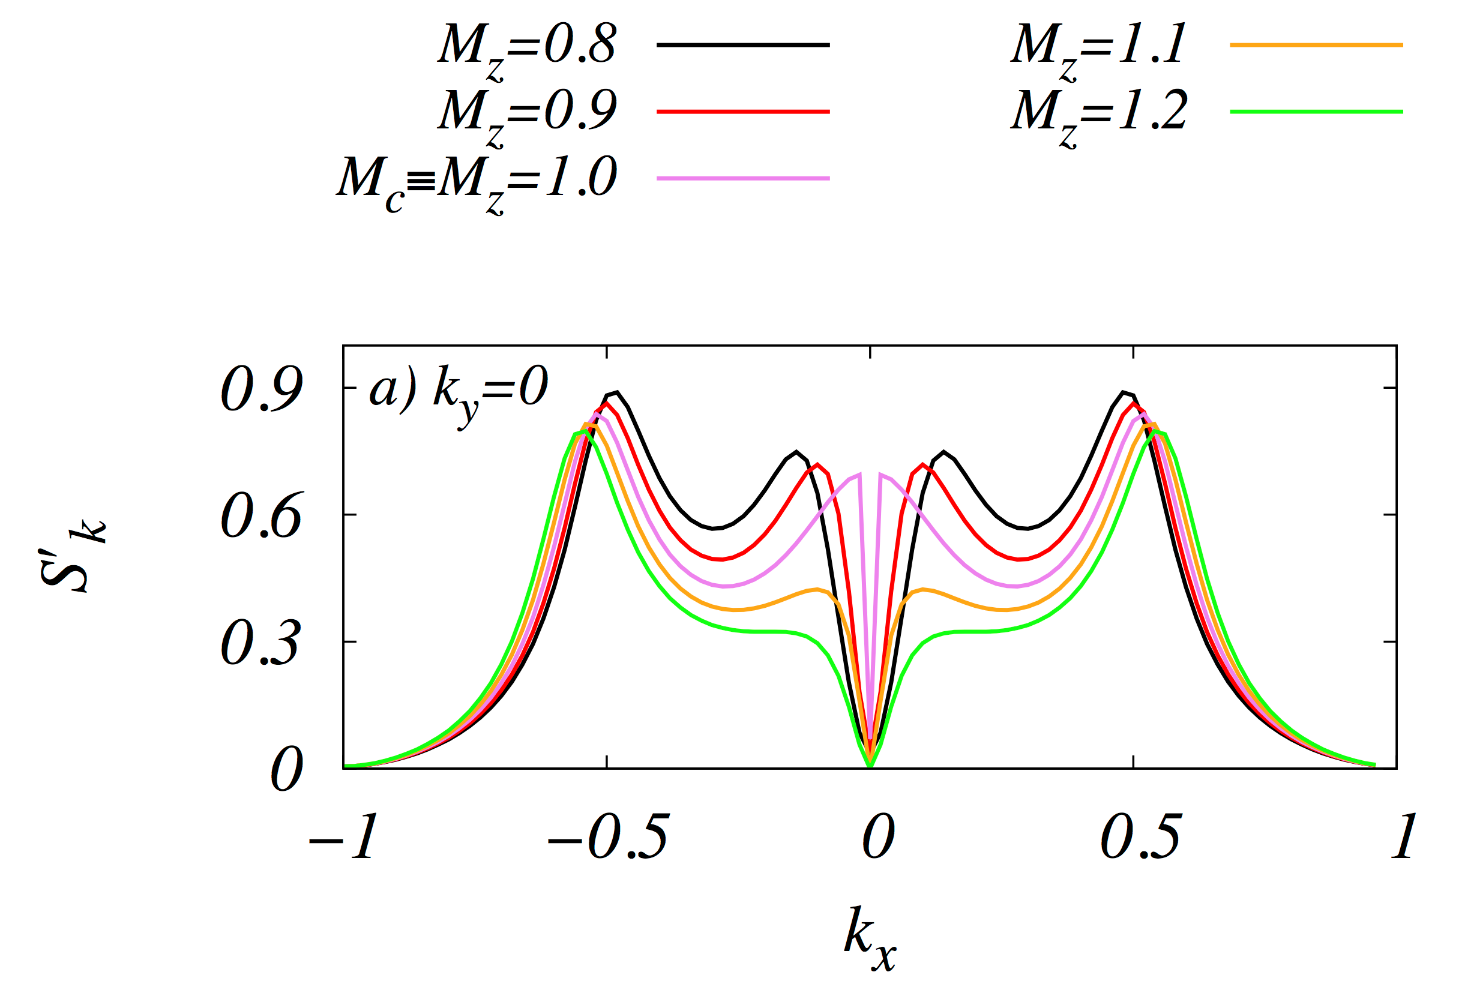
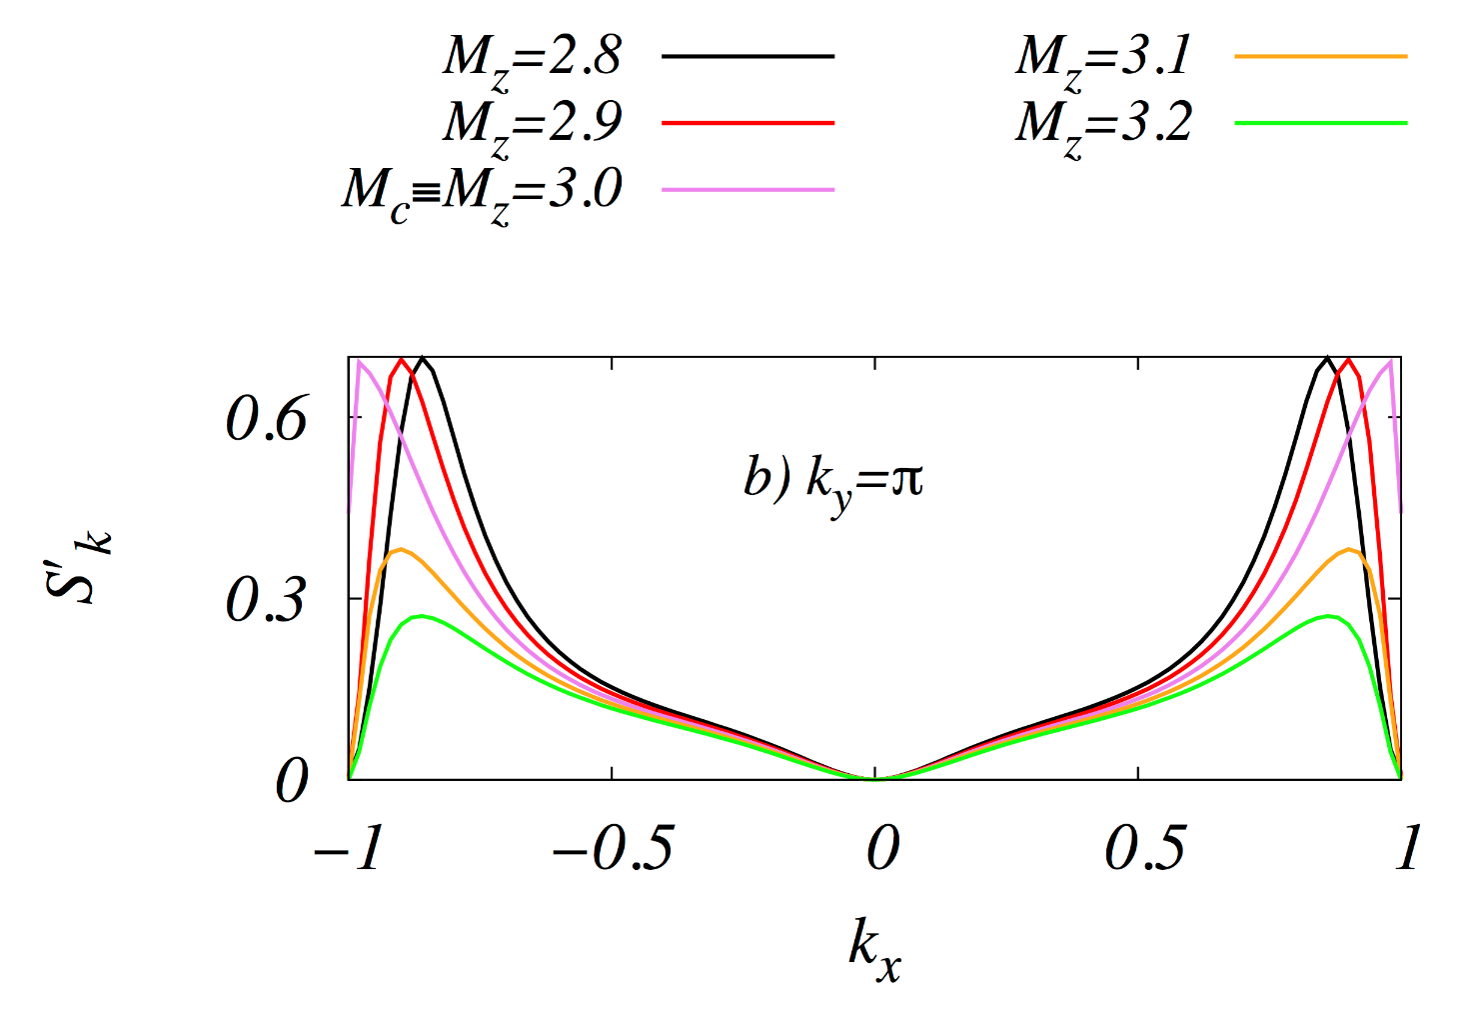
It is however, more interesting to study the entropy associated with the reduced density matrix as one approaches a topological transition. In Fig. 11 we consider the dependence of the entropy with momentum for different values of the chemical potential, , for different values of the magnetization, , as one crosses the transition lines between a phase and a phase and between a and a phases. As with other signatures the time-reversal momentum values play a special role associated with the transition lines. In the top panel of Fig. 11 there is a change of behavior around momentum and in the lower panel around momentum . From the data analysis, we can say that in the phase the entropy has a small, fixed but finite value, at zero momentum. As one crosses the transition to the phase the entropy vanishes at this momentum. Also, as one approaches the transition line the entropy slope increases around zero momentum. After the transition the slope decreases considerably and the entropy is smaller than in the phase with zero Chern number. The lower panel shows a similar behavior but around momentum , the slope becomes quite large at the transition and then decreases. Before the transition, as the magnetization is increasing, the entropy is also finite (but rather small) and after the transition it vanishes at that momentum. Also, the magnitude of the entropy is smaller after the transition, since the magnetic field is larger.
In Appendix B we present results for the eigenvector of the largest eigenvalue of the -subspace reduced density matrix.

V Fidelity and fidelity spectrum
The quantum fidelity between two pure states (for two sets of parameters) is the absolute value of the overlap between the ground states for the two sets of parameters. In general, the quantum fidelity Jozsa between two states characterized by two density matrices and , may be defined as the trace of the fidelity operator, , as .
The fidelity operator can be studied using different basis states, associated with different representations, such as position, momentum, energy or charge and spin. Rewriting the fidelity operator in these different representations, allows us to look more directly at the specific relevant modes that participate more actively in the critical phenomena accompanying the phase transition. In this way, we can obtain a more complete and physical characterization of the phase transition and of its underlying physics mechanisms. While the entanglement spectrum has some relation to the energy spectrum of the edge states or even bulk states, the fidelity spectrum contains information about which eigenvalues have a larger contribution to the distinguishability between quantum states us2 .
Considering two density matrices, that result from the momentum space partition, for two points in parameter space, we can write that
| (27) |
As mentioned above, the fidelity between two states, characterized by two density matrices and , may then be defined as the trace of the fidelity operator, ,
| (28) |
The square root of the density matrix can be written as
| (29) |
and
| (30) |
Diagonalizing
| (31) |
we write that
| (32) |
Therefore the -fidelity is obtained as
| (33) |
and the total fidelity is finally obtained as
| (34) |
We begin by considering that the two density matrices, , are for two points nearby in parameter space. As the fidelity measures the distinguishability between different states, as one approaches a transition one of the density matrices is calculated on one side of transition and the other is either at the transition point or in the other phase (depending on the step in parameter space) and the fidelity shows a minimum.

In Fig. 12 we present results for the total fidelity as a function of the chemical potential and the magnetization. Far from the transition points the fidelity is close to one, as the two states described by the two density matrices are very similar. The minima in the fidelity faithfully track the transitions previously described (note that the vertical axis is upside down). As for the entropy, fixing the magnetization at the -fidelity faithfully singles out the singular momenta values.
The transitions may also be signaled by the decrease of the highest eigenvalue of the -fidelity spectrum at the transition point, when the two density matrices are calculated at points in parameter space surrounding the transition. This is shown in Fig. 13 for a particular example, , for which the transition line is associated with the singular points , and equivalent points in the Brillouin zone.
Complementary, interesting information, can be obtained taking the two density matrices in the fidelity expression, corresponding to points in parameter space that are far apart. This allows to compare different phases, and not specifically to detect the locations of the phase transitions. It provides interesting information about the nature and momenta values responsible for the transitions. Also, it describes the distinguishability between two phases in momentum space.
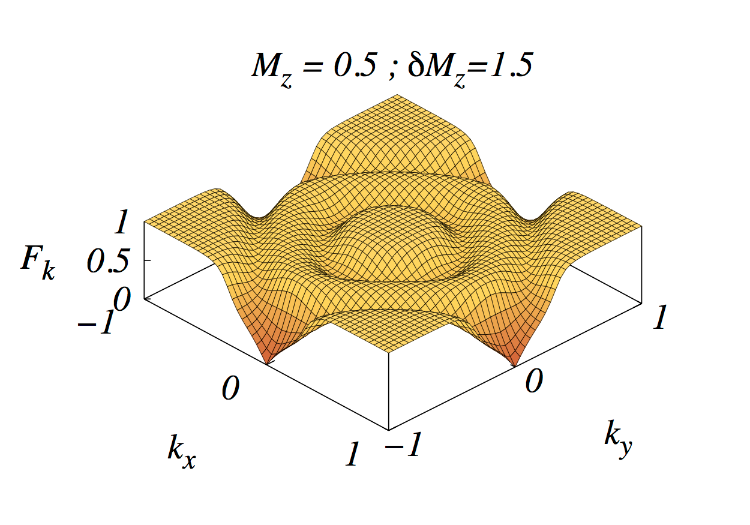
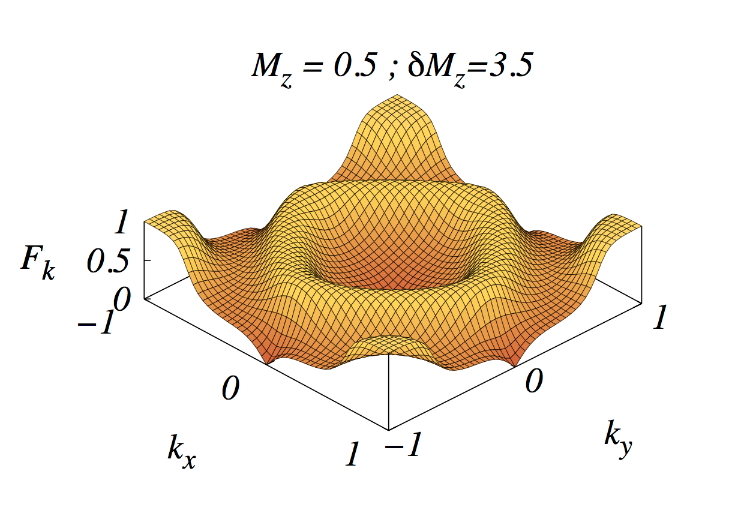
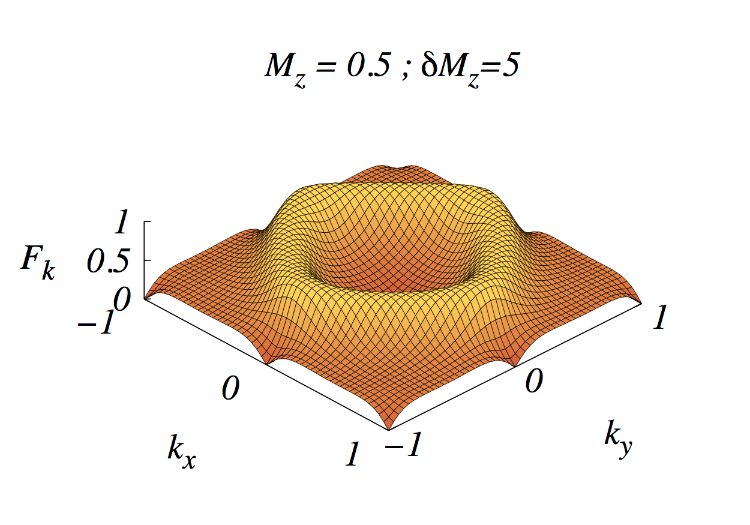
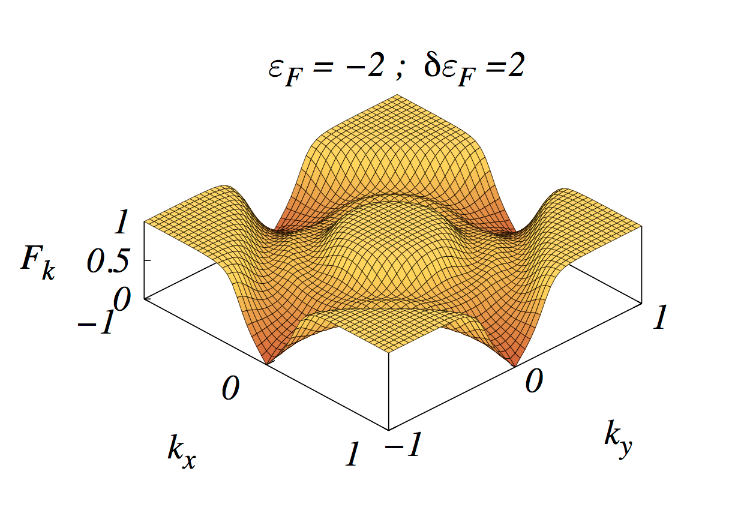
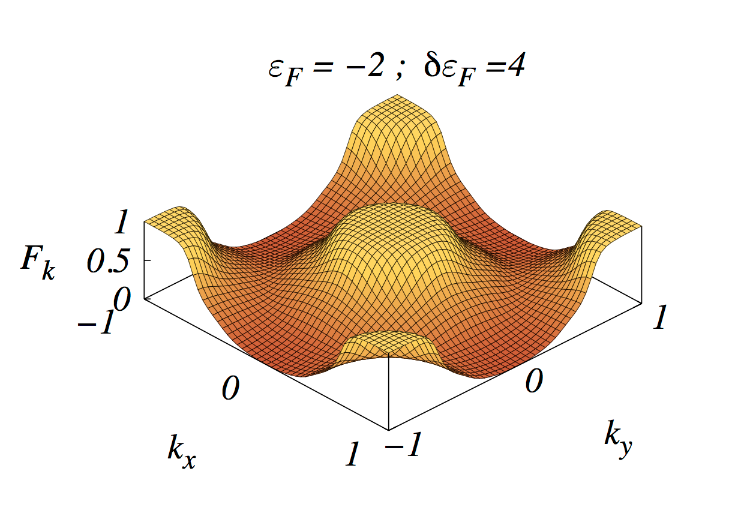
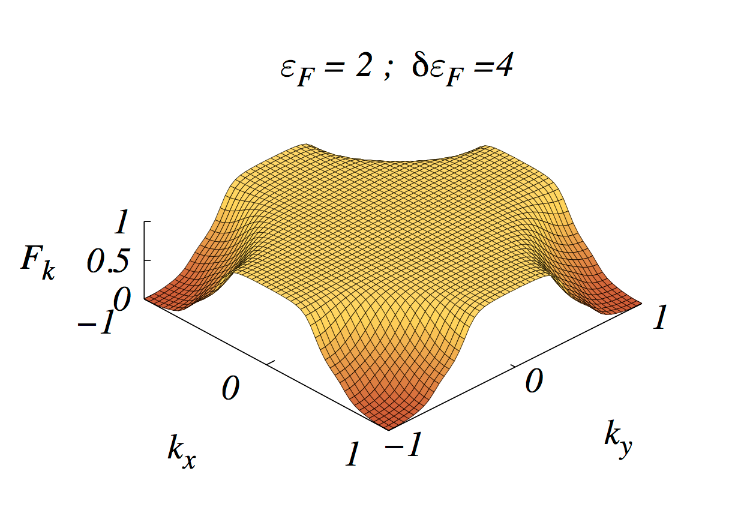
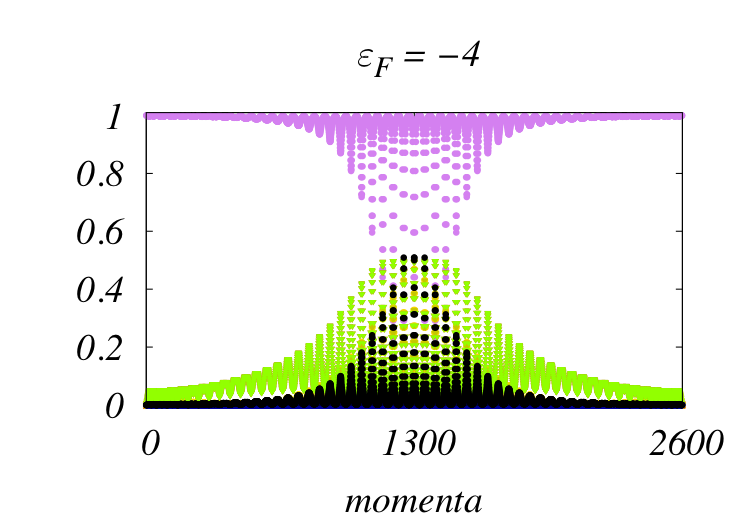
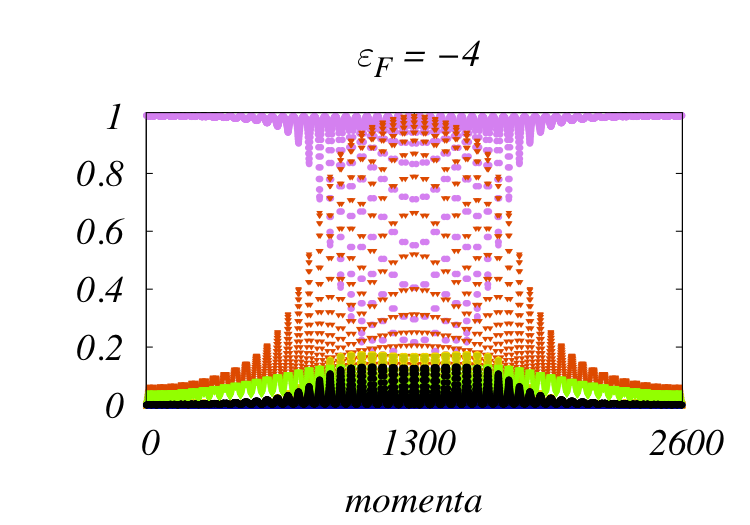
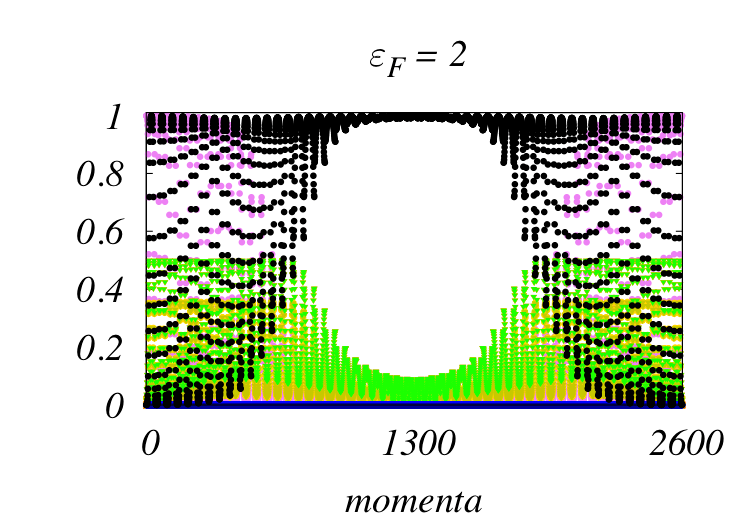
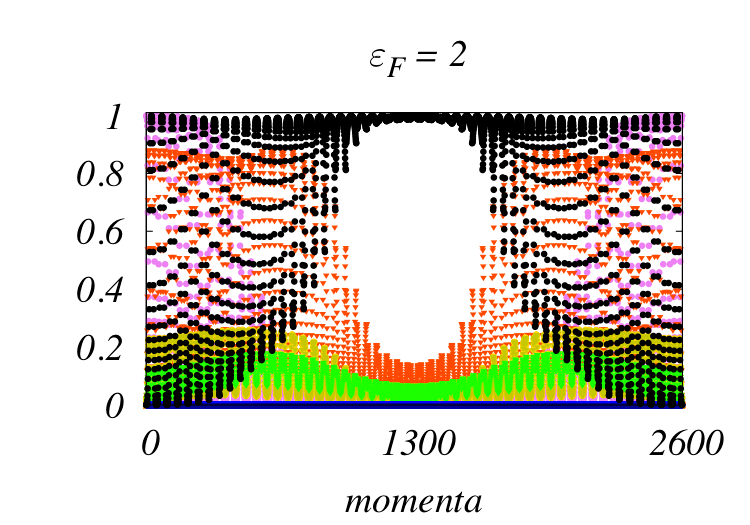
In Figs. 14,15 we present results for the -fidelity operator spectrum, where the two density matrices define two states in parameter space that are deep inside different topological phases. In Fig. 14 we consider one density matrix at a state specified by a point in a trivial phase with (specifically ) and the other density matrix corresponds to states at various magnetizations, along the vertical dashed line of Fig. 1, for which the Chern numbers are and the magnetization is , respectively. As we move along that line in parameter space, we cross, in sequential order, lines characterized by momenta , respectively. The -space fidelity highlights the differences between the various phases. Its deviations from unity throughout the Brillouin zone are significant, even when the phases have the same Chern number, as a consequence of the different band-fillings. Singular transition points translate to zeros in the -fidelity operator spectrum. As the top panel shows, the -fidelity operator spectrum vanishes at the momenta and equivalent points (two of them are independent). The middle panel shows in addition a zero at the center of the Brillouin zone . Consequently the last panel shows zeros at all singular momentum locations. The -fidelity operator therefore signals the minimum number of transitions that must occur when going from one trivial phase to the other trivial phase.
Similar results are shown in Fig. 15. In this case we also start from the same trivial phase with () and consider a sequence of density matrices, associated with states along the horizontal dashed line of Fig. 1. In this instance we consider in the top panel that the second density matrix corresponds to , . A line associated with is crossed. In the middle panel we consider that the second density matrix is at point , . A second transition line at the same momentum is now crossed, which implies a zero of quadratic order, since the same momentum becomes gapless twice. A similar result occurs if we consider a density matrix at and the other at the same magnetization and . In this case the momentum contributes twice with a gapless spectrum and the dispersion is now quadratic around that momentum (the corners of the Brillouin zone), as shown in the bottom panel of this figure.
VI Conclusions
Various quantum information techniques have been used in this work to detect and distinguish topological phase transitions in superconductors. In particular, the entanglement von Neumann entropy, entanglement spectrum, fidelity and the recently introduced fidelity spectrum. In addition to a faithful identification of the transitions, these methods clearly signal the relevant modes responsible for the transitions. The analysis of the highest weight eigenvector components clarifies the nature of each phase and the contents associated with a transition between two phases. Also, allows to distinguish between a trivial and a topological phase and between the and topological phases. Specifically, for the p-wave superconductor considered here, the spin triplet basis state has a particular role in the non-trivial topological phases reaching saturation. A detailed analysis of the momentum dependence of the coefficients of the basis states of the highest state eigenvector was carried out. The analysis of the -fidelity operator spectrum allows a characterization of the sequence of the minimal number of transitions that have to occur between two arbitrary points in the phase diagram.
Acknowledgements
We thank discussions with Vítor Rocha Vieira, Pedro Ribeiro, Miguel Araújo and Eduardo Castro and partial support by the Portuguese FCT under grant PEST-OE/FIS/UI0091/2011. T.P.O. would like to thank the Brazilian agency Coordenação de Aperfeiçoamento de Pessoal de Nível Superior (CAPES) the financial aid for study abroad. P.D.S. acknowledges the hospitality and partial support from the Beijing Computational Science Research Center where part of this work was carried out.
Appendix A Highest weight density matrix eigenvector
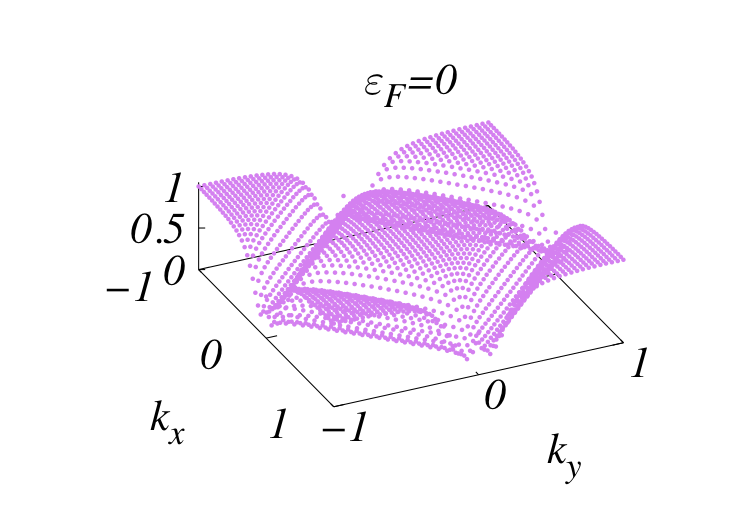
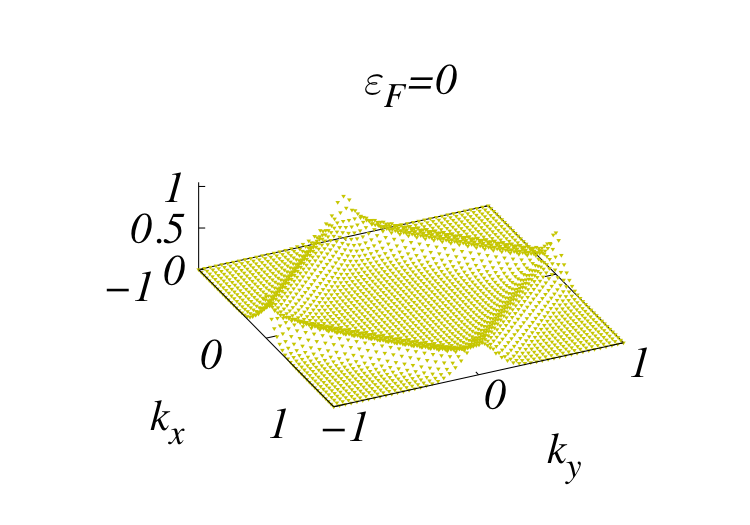
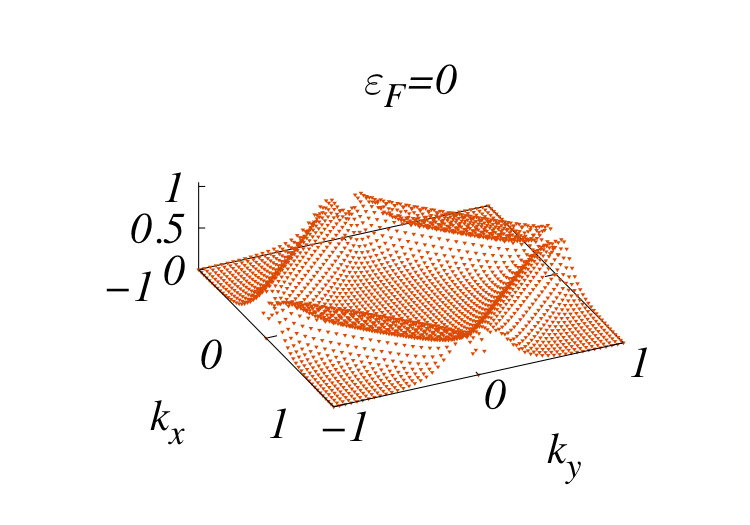
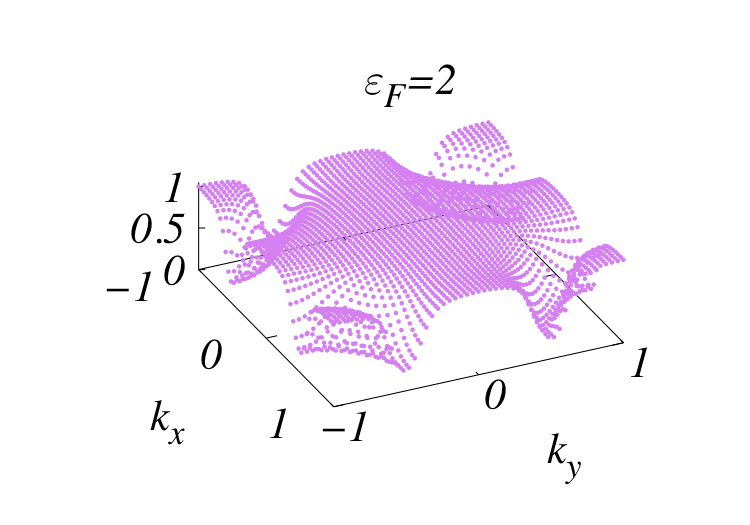
In this appendix we study in detail the coefficients of the highest weight eigenvector. We consider a sequence of states as a function of the chemical potential, , for different values of the magnetization . We compare the results for and for , typically. Along these sets of values the Chern number changes from topological phases with to phases with finite Chern number. As discussed in the main text, even though some phases have no Chern number, there are edge states except in the phases with small magnetization and , and large magnetization around , indicated in Fig. 1. For instance, considering and changing the chemical potential, the Chern goes through a sequence of values, , from non-trivial to trivial phases, crossing in sequence lines that are singular at the momentum values .
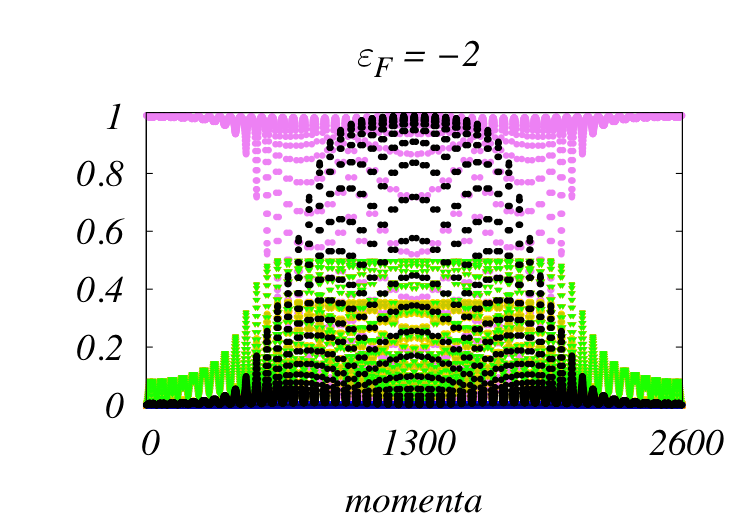
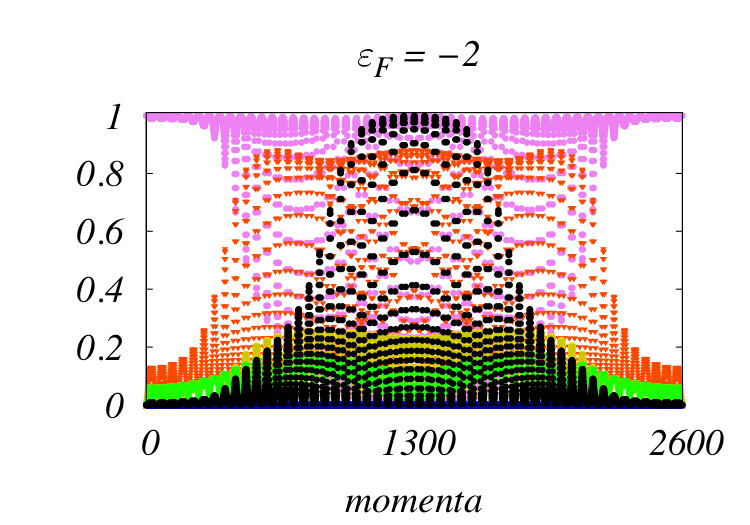
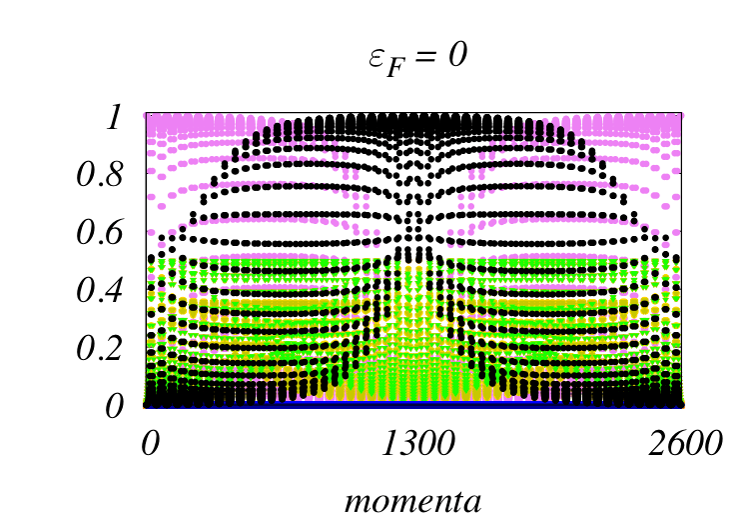
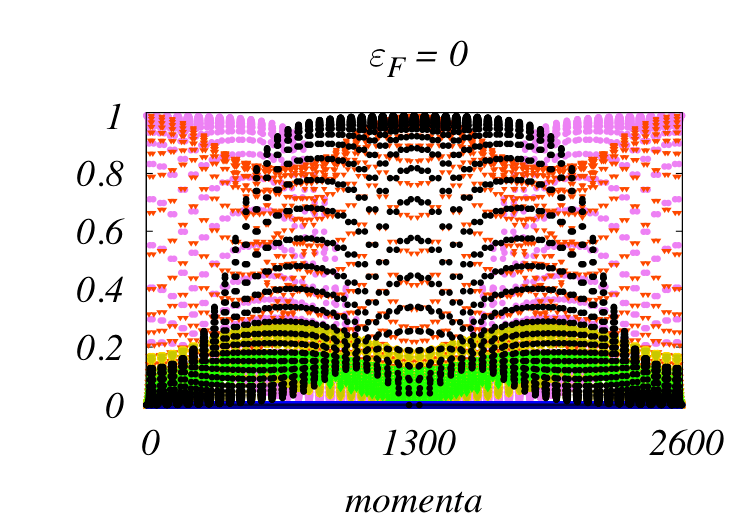
In Fig. 16 we present, in a rather compact way, the absolute values of the coefficients of the 16 basis states, for the highest weight eigenvector, as a function of momentum, ordered sequentially in the two-dimensional plane. We compare the results for and for different chemical potentials. The color codes of the coefficients is the same as in Fig. 7. Clear differences can be seen between the phases and the phases. For and the system is in a phase with but for the system is at the frontier between a completely trivial phase with and no edge states and a phase also with but edge states. The dominant state is the state in most of momentum space. For the two spin orientations of the triplet state, and , are degenerate and are superimposed. The other state that gives a significant contribution is the fully occupied state .
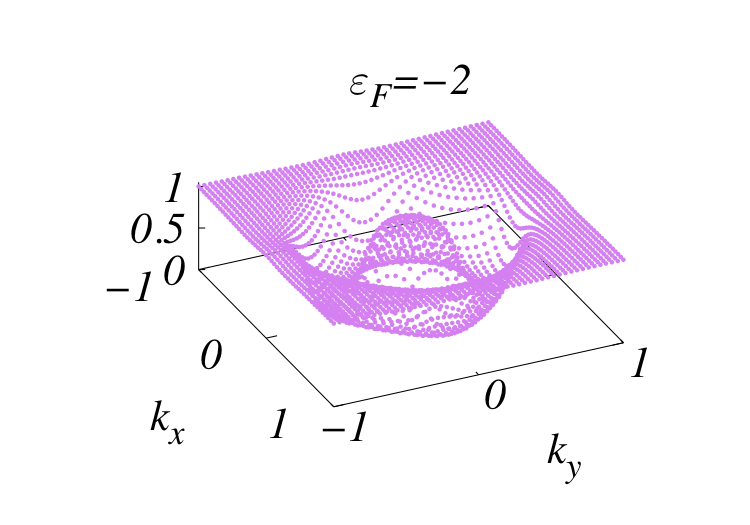
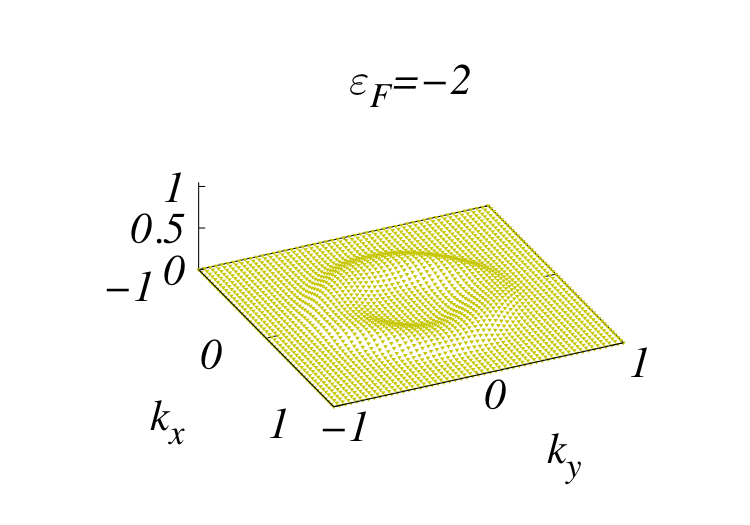
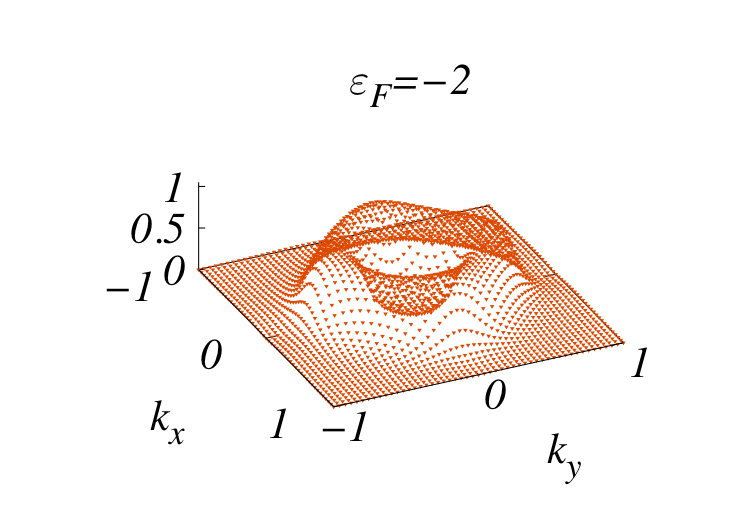
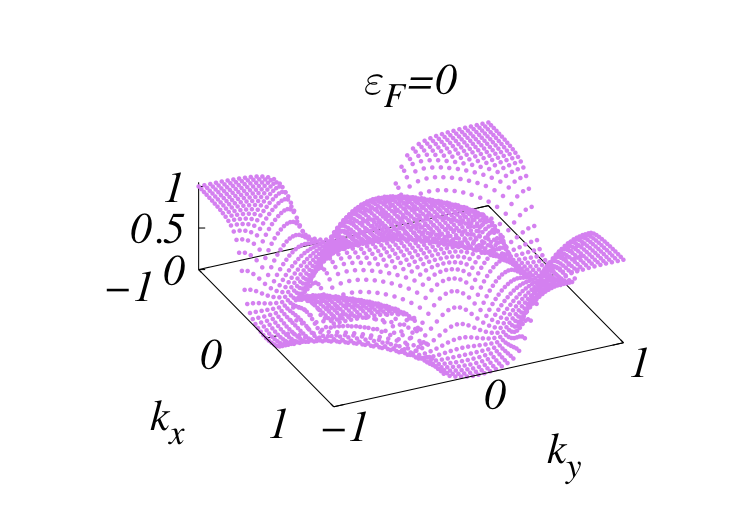
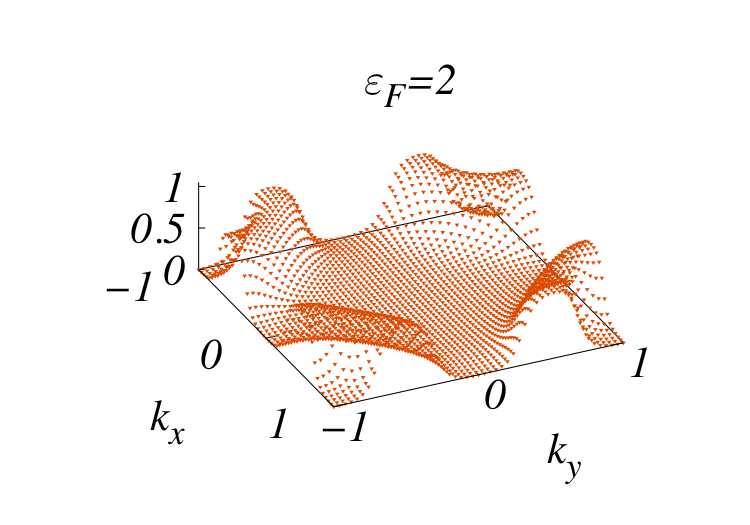
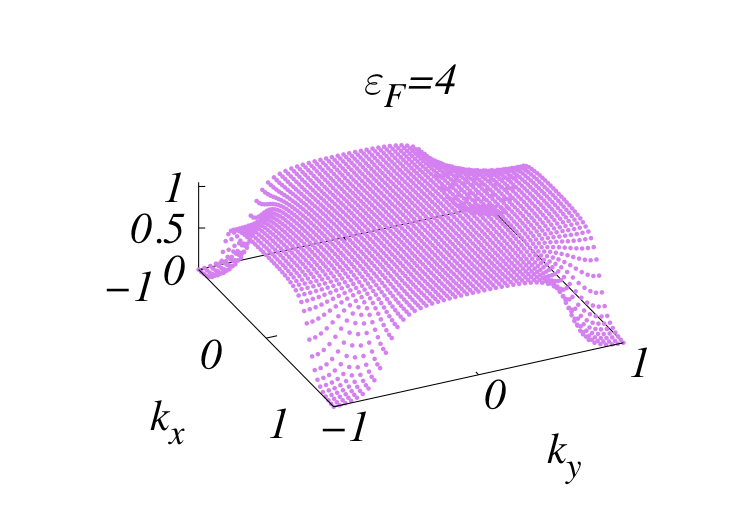
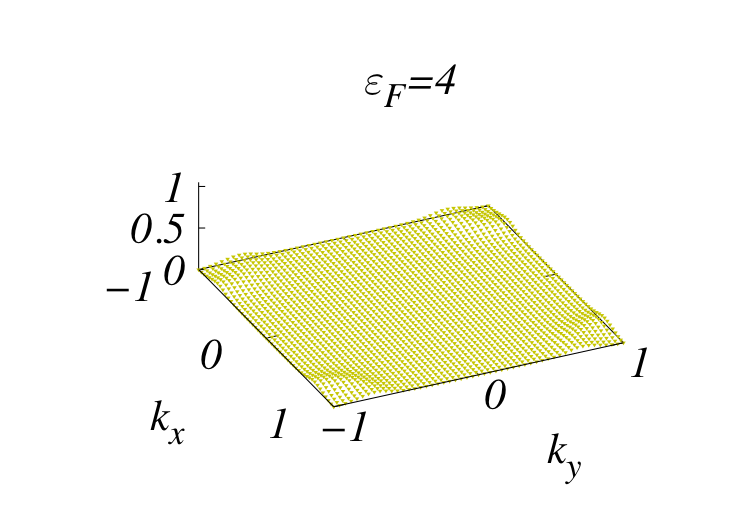
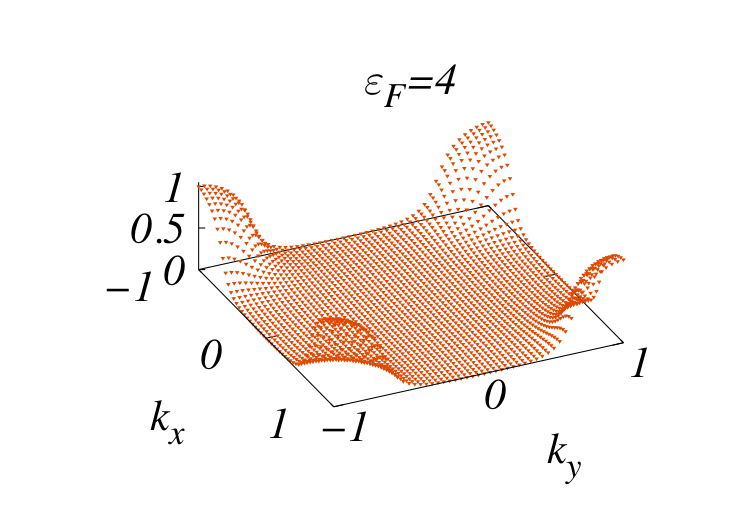
For values of the chemical potential, , there is a clear gap between the dominant empty state and all others that is particularly large when (these results are not shown). At the transition to the phase the gap closes at some momentum values. The absolute value of both triplet components saturates at . This is to be contrasted with the case when there is a finite magnetization. First, in this case the degeneracy between the two triplet states is lifted. Inside the phase with finite Chern number, the triplet component saturates to one at the appropriate singular momentum value (zero momentum in the case of ). This saturation is characteristic of the phases with finite Chern number. Increasing the chemical potential, for instance , the weight of the state increases and the weight of the spin triplet state decreases. For there is a slight decrease but a clear difference is noted when . In the topological phase the triplet state is dominant at some momentum values while in the trivial phases (with ) the contribution from other states is also important. At () there is also a saturation of the triplet component, but at different momenta. It is also clear that, as the chemical potential increases, the weight of the fully occupied state increases, until it becomes dominant over the Brillouin zone. The roles of the states and , are naturally reversed as the chemical potential changes form the bottom to the top of the tight-binding band.
To further understand the relative weights of the basis states we show in Figs. 17, 18 the momentum dependence of the sum of the absolute squares of i) empty and doubly occupied states, ii) singlet pairing states and iii) triplet pairing states. As mentioned before, these are all the states that give significant contributions. This allows to better compare the cases and because the spin orientations become degenerate. (Also we stress that previous results were presented for the absolute value of the coefficients, while here we consider the absolute values squared). In Fig. 17 we consider and in Fig, 18 we consider . The various rows correspond to different chemical potentials. In the left column we plot the sum of the (square of the) empty and doubly occupied states, in the middle column the singlet pairing and in the right column the triplet pairing states.
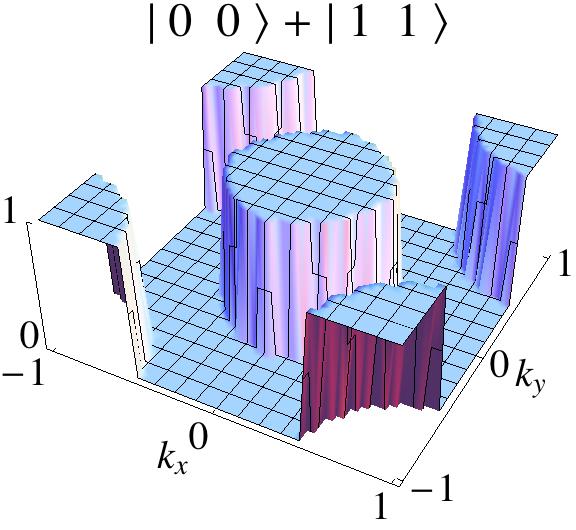
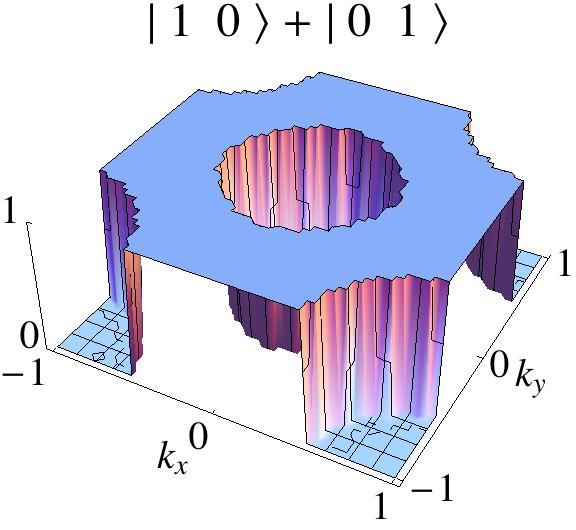


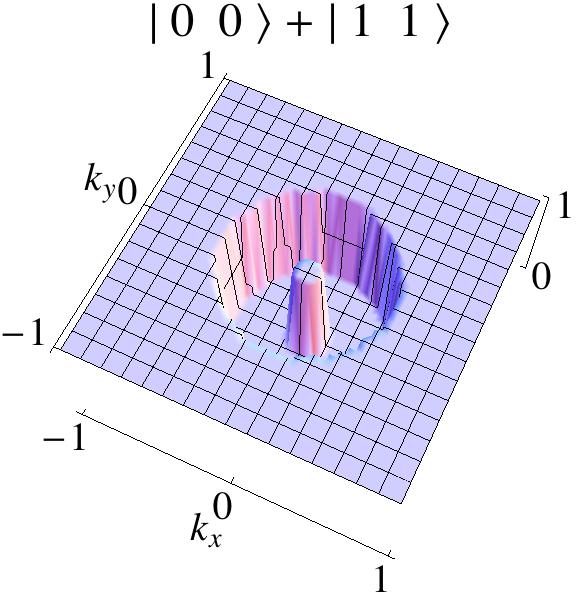
The results shown in these figures summarize the various aspects found previously and further clarify new aspects. a) The empty and doubly occupied states usually dominate over the Brillouin zone, for all parameter values, except near the Fermi surface. b) Near the Fermi surface the main contribution comes from the triplet and singlet pairing states. c) Since we choose the amplitude of the s-wave gap parameter smaller than the triplet amplitude, the singlet pairing coefficient is smaller than the triplet. For the amplitudes of the singlet and triplet states are similar. For the singlet states contribution is considerably smaller than the triplet one. d) In the case the maximal amplitude of both the singlet and triplet states is quite uniform along the Fermi surface with small peaks near the singular momenta. e) In the case of finite magnetization, the triplet coefficient saturates near the singular points. Therefore, the dependence on momentum along the Fermi surface is stronger. f) As for the entanglement measures, the significance of the singular momenta is quite clear in the various topological phases.
Appendix B Eigenvectors of -subspace reduced density matrix
The -subspace reduced density matrix is defined in a basis of the occupation numbers . The states are therefore of the type . The diagonalization of this matrix leads to the eigenvalues and eigenvectors expressed in this basis.
In the first two panels of Fig. 19 we present results for the eigenvector of the largest eigenvalue for the point in parameter space (). We plot the sum of the absolute coefficients along the states and , in the top panel and along the states and , in the lower panel. We see that the contributions from the states with empty or double occupancy and the states with single occupancy, are exclusive which implies a very sharp separation in the Brillouin zone between the two sets of states. This rather sharp separation occurs around the phase diagram.
However, a detailed analysis near a transition between the various topological phases shows that, focusing on the special moments involved in a given transition these provide a clear signature of the crossing. As an example we consider in the last three panels of Fig. 19 the eigenvector components along the states and of the highest eigenvalue of the reduced density matrix for and , respectively. This transition is associated with the gapless point at momentum . As Fig. 19 shows there is a clear signature at this momentum value as the transition occurs. In the regime when there is a peak of the eigenvector components at which vanishes in the phase with , a typical behavior of the time-reversal momenta at the transition points. We have checked that in the components of the singly occupied states the same (complementar) feature occurs.
References
- (1) D. J. Thouless, M. Kohmoto, M. P. Nightingale, and M. den Nijs, Phys. Rev. Lett. 49, 405 (1982).
- (2) M. Z. Hasan and C. L. Kane, Rev. Mod. Phys. 82, 3045 (2010)
- (3) X.-L. Qi and S.-C Zhang, Rev. Mod. Phys. 83, 1057 (2011).
- (4) M. König, S. Wiedmann, C. Brüne, A. Roth, H. Buhmann, L. W. Molenkamp, X. L. Qi, and S. C. Zhang, Science 318, 766 (2007).
- (5) D. Hsieh, D. Qian, L. Wray, Y. Xia, Y. S. Hor, R. J. Cava, and M. Z. Hasan, Nature (London) 452, 970 (2008).
- (6) Y. Xia, D. Qian, D. Hsieh, L. Wray, A. Pal, H. Lin, A. Bansil, D. Grauer, Y. S. Hor, R. J. Cava, and M. Z. Hasan, Nat. Phys. 5, 398 (2009).
- (7) B. I. Halperin, Phys. Rev. B 25, 2185 (1982).
- (8) Y. Hatsugai, Phys. Rev. Lett. 71, 3697 (1993).
- (9) N. Read and D. Green, Phys. Rev. B 61, 10267 (2000).
- (10) M. Sato, Y. Takahashi, S. Fujimoto, Phys. Rev. Lett. 103, 020401 (2009).
- (11) J. D. Sau, R. M. Lutchyn, S. Tewari, S. Das Sarma, Phys. Rev. Lett. 104, 040502 (2010).
- (12) L. Fu and C. L. Kane, Phys. Rev. Lett. 100, 096407 (2008).
- (13) X.-L. Qi, T. L. Hughes, S.-C. Zhang, Phys. Rev. B 82, 184516 (2010).
- (14) V. Mourik, K. Zuo, S. M. Frolov, S. R. Plissard, E. P. A. M. Bakkers, and L. P. Kouwenhoven, Science 336, 1003 (2012).
- (15) A. Das, Y. Ronen, Y. Most, Y. Oreg, M. Heiblum, and H. Shtrikman, Nat. Phys. 8, 887 (2012).
- (16) M. T. Deng, C. L. Yu, G. Y. Huang, M. Larsson, P. Caroff, and H. Q. Xu, Nano Letters 12, 6414 (2012).
- (17) Fan Zhang, C.L. Kane and E.J. Mele, arXiv:1212.4232.
- (18) S. Nadj-Perge, I. K. Drozdov, B. A. Bernevig, and Ali Yazdani, arXiv:1303.6363
- (19) M. Veldhorst, M. Snelder, M. Hoek, T. Gang, V. K. Guduru, X. L. Wang, U. Zeitler, W. G. van der Wiel, A. A. Golubov, H. Hilgenkamp, and A. Brinkman, Nature Materials 11, 417 (2012).
- (20) J. R. Williams, A. J. Bestwick, P. Gallagher, S. S. Hong, Y. Cui, A. S. Bleich, J. G. Analytis, I. R. Fisher and D. Goldhaber-Gordon, Phys. Rev. Lett. 109, 056803 (2012).
- (21) L. P. Rokhinson, X. Liu, and J. K. Furdyna, Nature Physics 8, 795 (2012).
- (22) Pablo San-José, Jorge Cayao, Elsa Prada and Ramón Aguado, arXiv:1301.4408.
- (23) A. P. Schnyder, P. M. R. Brydon and C. Timm, Phys. Rev. B 85, 024522 (2012).
- (24) T. Ojanen and T. Kitagawa, Phys. Rev. B 87, 014512 (2013).
- (25) P.D. Sacramento, M.A.N. Araújo and E.V. Castro, Europhys. Lett. (2014); arxiv:1302.3122.
- (26) L. Amico, R. Fazio, A. Osterloh and V. Vedral, Rev. Mod. Phys. 80, 517 (2008).
- (27) S. Sachdev, Quantum Phase Transitions, Cambridge University Press (1999).
- (28) J.I. Latorre, E. Rico and G. Vidal, Quantum Inf. Comput. 4, 48 (2004).
- (29) S.-J. Gu, G.-S. Tian and H.-Q. Lin, Phys. Rev. A 71, 052322 (2005).
- (30) S.-J. Gu, H.-Q. Lin, and Y.-Q. Li, Phys. Rev. A 68, 042330 (2003).
- (31) S.-J. Gu, S.-S. Deng, Y.-Q. Li and H.-Q. Lin, Phys. Rev. Lett. 93, 086402 (2004).
- (32) D. Larsson and H. Johannesson, Phys. Rev. Lett. 95, 196406 (2005).
- (33) J. Vidal, Phys. Rev. A 73, 062318 (2006).
- (34) J. Vidal, S. Dusuel and T. Barthel, J. Stat. Mech. 0701, 01015 (2007).
- (35) S.-J. Gu, S.-S. Deng Y.-Q. Li and H.-Q. Lin, Phys. Rev. Lett. 93, 086402 (2004).
- (36) M.A. Nielsen and I.L. Chuang, Quantum Computation and Quantum Information, Cambridge University Press, 2000.
- (37) W.K. Wootters, Phys. Rev. Lett. 80, 2245 (1998).
- (38) V. Vedral, New. J. Phys. 6, 22 (2004).
- (39) S.-J. Gu, C.-P. Sun and H.-Q. Lin, J. Phys. A 41, 025002 (2008).
- (40) W.-L. Chan, J.-P. Cao, D. Yang and S.-J. Gu, J. Phys. A 40, 12143 (2007).
- (41) G. Vidal and R.F. Werner, Phys. Rev. A 65, 032314 (2002).
- (42) A.D. Meyer and N.R. Wallach, J. Math. Phys. 43, 4273 (2002).
- (43) T.R. de Oliveira, G. Rigolin and M.C. de Oliveira Phys. Rev. A 73, 010305(R) (2006).
- (44) T.R. de Oliveira, G. Rigolin, M.C. de Oliveira and E. Miranda, Phys. Rev. Lett. 97, 170401 (2006).
- (45) C. Lunkes, Č. Brukner and V. Vedral, Phys. Rev. Lett. 95, 030503 (2005).
- (46) L. Heaney, J. Anders and V. Vedral, quant-ph/0607069.
- (47) S. Oh and J. Kim, Phys. Rev. B 71, 144523 (2005).
- (48) S.J. Gu, Int. J. Mod. Phys. B 24, 4371 (2010).
- (49) P. Zanardi and N. Paunković, Phys. Rev. E 74, 031123 (2006).
- (50) P. Zanardi, M. Cozzini and P. Giorda, J. Stat. Mech.: Theory Exp. (2007), L02002; M. Cozzini, P. Giorda and P. Zanardi, Phys. Rev. B 75, 014439 (2007).
- (51) P. Buonsante and A. Vezzani, Phys. Rev. Lett. 98, 110601 (2007).
- (52) N. Oelkers and J. Links, Phys. Rev. B 75, 115119 (2007).
- (53) S. Chen, L. Wang, S.-J. Gu and Y. Wang, Phys. Rev. E 76, 061108 (2007).
- (54) M.-F. Yang, Phys. Rev. B 76, 180403(R) (2007).
- (55) H.-Q. Zhou and J. P. Barjaktarevic, e-print arXiv:cond-mat/0701608; H.-Q. Zhou, J.-H. Zhao and B. Li, J. Phys. A 41, 492002 (2008).
- (56) P. Zanardi, P. Giorda and M. Cozzini, Phys. Rev. Lett. 99, 100603 (2007).
- (57) L. CamposVenuti, and P. Zanardi, Phys. Rev. Lett. 99, 095701 (2007).
- (58) W.-L. You, Y.-W. Li and S.-J. Gu, Phys. Rev. E 76, 022101 (2007).
- (59) H.Q. Zhou, arxiv:0704.2945.
- (60) N. Paunković, P.D. Sacramento, P. Nogueira, V.R. Vieira and V.K. Dugaev, Phys. Rev. A 77, 052302 (2008).
- (61) N. Paunković and V.R. Vieira, Phys. Rev. E 77, 011129 (2008).
- (62) P. Zanardi, H. T. Quan, X. Wang and. C. P. Sun, Phys. Rev. A 75, 032109 (2007).
- (63) P. Zanardi, L. C. Venuti and P. Giorda, Phys. Rev. A 76, 062318 (2007).
- (64) H. Li and F.D.M. Haldane, Phys. Rev. Lett. 101, 010504 (2008).
- (65) N. Regnault, B. A. Bernevig, and F. D. M. Haldane, Phys. Rev. Lett. 103, 016801 (2009).
- (66) D. Poilblanc, Phys. Rev. Lett. 105, 077202 (2010).
- (67) A. Sterdyniak, N. Regnault, and B. A. Bernevig, Phys. Rev. Lett. 106, 100405 (2011).
- (68) R. Thomale, D.P. Arovas and B.A. Bernevig, Phys. Rev. Lett. 105, 116805 (2010).
- (69) P.D. Sacramento, N. Paunkovic and V.R. Vieira, Phys. Rev. A 84, 062318 (2011).
- (70) S.-J. Gu, W.-C. Yu and H.-Q. Lin, arXiv:1108.2832.
- (71) S. Chen, L. Wang, Y. Hao and Y. Wang, Phys. Rev. A 77, 032111 (2008).
- (72) S.-J. Gu, H.-M. Kwok, W.-Q. Ning and H.-Q. Lin, Phys. Rev. B 77, 245109 (2008).
- (73) A. Hamma, W. Zhang, S. Haas and D.A. Lidar, Phys. Rev. B 77, 155111 (2008).
- (74) D.F. Abasto, A. Hamma and P. Zanardi, Phys. Rev. A 78, 010301 (2008).
- (75) S. Yang, S.-J. Gu, C.-P. Sun and H.-Q. Lin, Phys. Rev. A 78, 012304 (2008).
- (76) L. Campus Venuti, M. Cozzini, P. Buonsante, F. Massel, N. Bray-Ali and P. Zanardi, Phys. Rev. B 78, 115410 (2008).
- (77) D.F. Abasto and P. Zanardi, Phys. Rev. A 79, 012321 (2009).
- (78) J.-H. Zhao and H.-Q. Zhou, Phys. Rev. B 80, 014403 (2009).
- (79) E. Eriksson and H. Johannesson, Phys. Rev. A 79, 060301(R) (2009).
- (80) C. Castelnovo and C. Chamon, Phys. Rev. B 77, 054433 (2008).
- (81) S. Trebst et al., Phys. Rev. Lett. 98, 070602 (2007).
- (82) Z. Wang, T. Ma, S.-J. Gu and H.-Q. Lin, Phys. Rev. A 81, 062350 (2010).
- (83) Z. Wang, Q.F. Liang and D.X. Yao, arXiv:1302.5492.
- (84) L. P. Gor’kov and E. I. Rashba, Phys. Rev. Lett. 87, 037004 (2001).
- (85) M. Sato and S. Fujimoto, Phys. Rev. B 79, 094504 (2009).
- (86) P. A. Frigeri, D. F. Agterberg, A. Koga and M. Sigrist, Phys. Rev. Lett. 92, 097001 (2004).
- (87) P.D. Sacramento, M.A.N. Araújo, V.R. Vieira, V.K. Dugaev and J. Barnas Phys. Rev. B 85, 014518 (2012).
- (88) D. Xiao, M.-C. Chang and Q. Niu, Rev. Mod. Phys. 82, 1959 (2010).
- (89) T. Fukui, Y. Hatsugai and H. Suzuki, J. Phys. Soc. Jpn. 74, 1674 (2005).
- (90) A.P. Schnyder, S. Ryu, A. Furusaki and A.W.W. Ludwig, Phys. Rev. B 78, 195125 (2008)
- (91) A.P. Schnyder, S. Ryu, A. Furusaki and A.W.W. Ludwig, in Advances in Theoretical Physics, edited by Vladimir Lebedev and Mikhail Feigel’man, AIP Conf. Proc. No. 1134 (AIP, Melville, NY, 2009), p. 10.
- (92) S. Ryu, A.P. Schnyder, A. Furusaki and A.W.W. Ludwig, New J. Phys. 12, 065010 (2010).
- (93) X. G. Wen and A. Zee, Nucl. Phys. B 316, 641 (1989).
- (94) R. Jozsa, J. Mod. Opt. 41, 2315 (1994).