Generation of anomalously energetic suprathermal electrons by an electron beam interacting with a nonuniform plasma
Abstract
Generation of anomalously energetic suprathermal electrons was observed in simulation of a high-voltage dc discharge with electron emission from the cathode. An electron beam produced by the emission interacts with the nonuniform plasma in the discharge via a two-stream instability. Efficient energy transfer from the beam to the plasma electrons is ensured by the plasma nonuniformity. The electron beam excites plasma waves whose wavelength and phase speed gradually decrease towards anode. The short waves near the anode accelerate plasma bulk electrons to suprathermal energies. The sheath near the anode reflects some of the accelerated electrons back into the plasma. These electrons travel through the plasma, reflect near the cathode, and enter the accelerating area again but with a higher energy than before. Such particles are accelerated to energies much higher than after the first acceleration. This mechanism plays a role in explaining earlier experimental observations of energetic suprathermal electrons in similar discharges.
pacs:
52.35.Qz, 52.40.Mj, 52.65.-y, 52.77.-jThe collisionless relaxation of high-current electron beams and plasma jets is important for many applications: solar disruptions Melrose (1986), collective stopping of intense electron beams for inertial fusion applications Malkin and Fisch (2002); Kemp et al. (2006), collisionless shocks and collision of flowing plasmas in astrophysics Kelogg (2003); Treumann (2009); Balogh and Treumann (2011); et al. (2010, 2012), generation of suprathermal electrons Yoon et al. (2005). Such beams are common in laboratory plasmas. Electrons emitted by electrodes surrounding or immersed in the plasma are accelerated by the sheath electric field and become the electron beams penetrating the plasma. In plasma applications where controlling the electron velocity distribution function (EVDF) is crucial Kaganovich et al. (2009), these beams are an important factor capable of modifying the EVDF and affecting the discharge properties.
Recently, Xu et al. Xu et al. (2008) and Chen and Funk Chen and Funk (2010) reported an EVDF measured in a dc-rf discharge with 800 V dc voltage which has not only a peak at 800 eV corresponding to the electrons emitted from the dc-biased electrode, but also a significant fraction of accelerated electrons with energy up to several hundreds eV. In Refs. Xu et al. (2008); Chen and Funk (2010), the acceleration is explained invoking nonlinear wave-particle interactions Tsytovich (1970); Shapiro and Shevchenko (1984); Porkolab and Chang (1978); Robinson (1997); Cairns and Robinson (1999); Golovanov et al. (1977); et al. (1999). It is suggested that the 800 eV beam excites fast long plasma waves which decay parametrically into ion acoustic waves and short plasma waves with much lower phase velocity, then the short waves accelerate slow electrons of the low-temperature plasma bulk. A similar mechanism may explain enhanced energetic tails in the energy spectrum of electrons in aurora Papadopoulos and Coffey (1974); Rowland (1988); Yoon et al. (2005). Other mechanisms invoked to explain the EVDF structure include phase-bunching, kinematic effect of electrons being trapped between rf and dc potentials and released towards the rf electrode during short period of time when rf voltage is small compared to the dc voltage Khrabrov et al. (2015).
In order to further understand the mechanism of acceleration in the experiment of Refs. Xu et al. (2008); Chen and Funk (2010), a beam-plasma system was simulated using a 1D3V particle-in-cell code EDIPIC Sydorenko (2006). The EDIPIC was extensively benchmarked against available analytical predictions for two stream instability in linear and nonlinear regimes. Simulation results discussed below show that the acceleration may be caused not only by the nonlinear effects, but by the effects related to the plasma nonuniformity as well. Note that profiling the background plasma density is a method to control the beam energy deposition in plasma et al. (1998); Malkin and Fisch (2002). In particular, one can excite the instability and achieve beam energy deposition in desirable regions while suppressing the instability in undesirable regions by employing convective stabilization effects Ryutov (1970); Golovanov et al. (1977). In Refs. Malkin and Fisch (2002); Gunell et al. (1996); McFarland and Wong (1998); Wendt et al. (2001) an experimental study and particle-in-cell simulations of interaction of a strong, warm electron beam with an inhomogeneous, bounded plasma showed that the trapped Langmuir waves can determine the frequencies and areas of localization of the wave field. In those studies the beam energy was relatively low (40 eV) and the acceleration of plasma electrons was not observed.
The present paper discusses the mechanism of generation of suprathermal electrons found in the simulation. In this process, the beam excites long plasma waves in the plasma body, the long plasma waves are converted into short plasma waves at the plasma periphery where the plasma density decreases, and the short waves accelerate bulk electrons. Some of these electrons return into the acceleration area again due to reflections from the sheath regions near the plasma boundaries. The second interaction with the short plasma waves yields electrons with anomalously high energies. Repeating the acceleration for the same particle is more efficient than a one-time interaction between particles and plasma waves in density gradient areas considered e.g. in Melrose (1986); Malkin and Fisch (2002); Golovanov et al. (1977); Wendt et al. (2001); Gunell et al. (1996); McFarland and Wong (1998).
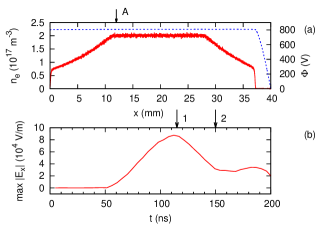
The simulated collisionless argon plasma is bounded between anode (x=0) and cathode (x=40 mm). The cathode potential is zero, the anode potential is . The cathode can emit electrons with a constant flux and a temperature of . The initial state of the system shown in Fig. 1 is the result of a preliminary simulation which starts with uniform plasma density , the emission from the cathode turned off, the electron temperature , the ion temperature . The preliminary simulation lasts for . During this time, wide areas with plasma density gradients form as shown in Fig. 1a. The time counter in the simulations with the beam starts at and the electron emission starts at . The emission current is , the relative beam density in the plasma density plateau area () is .
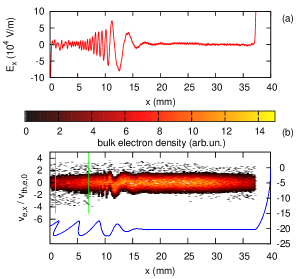
In the density plateau area, the plasma waves exited by the beam have the wavelength close to where and the amplitude growing along the beam propagation towards anode Kaganovich and Sydorenko (2015), see Figs. 2a and 3a. In the density gradient area, , the profile of the electric field drastically changes: the amplitude and the wavelength decrease towards anode. Phase plots in Figs. 2b and 3b show that bulk plasma and beam electrons perform strong oscillations in the electric field of the plasma waves. Suprathermal electrons (STEs) are clearly seen in the EVDF near the anode, see Fig. 4. The electrons are accelerated from the initial Maxwellian EVDF with the electron temperature to energies up to 60 eV.
The process of acceleration is demonstrated in Figs. 5 and 6 where the color map of the electric field E(t,x) is presented along with the trajectories of few electrons. The change of the slope of field pattern seen in the color map (Figs. 5a and 6a) corresponds to the decrease of the phase velocity towards the anode due to the plasma density inhomogeneity. The frequency of the wave excited by the beam is the same everywhere, including the density gradient regions, and is very close to the plasma frequency in the density plateau . Assuming that the plasma wave satisfies the dispersion relation and setting in the density plateau, the wave frequency is . Substituting this frequency into the dispersion equation and using , one can obtain the phase velocity of the wave as a function of coordinate
| (1) |
where and are the electron temperature and mass, is the plasma density which depends on coordinate , and is the beam velocity. The analytical expression for the phase velocity (1) is in good agreement with the results of the numerical simulation, compare the blue curve with the red markers in Fig. 5b.
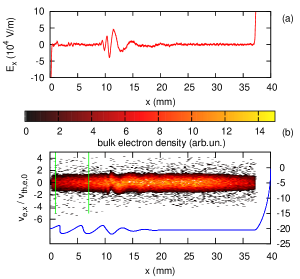
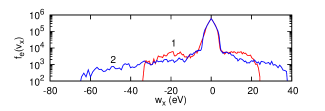
After the emission from the cathode started, STEs moving towards the anode appear first downstream of the area with the strongest oscillations, see Fig. 2b for . At the peak of the instability (arrow 1 in Fig. 1b), maximal energy of these electrons reaches about , see curve 1 in Fig. 4. While the accelerated electrons escape to the anode, the plasma potential relative to the anode increases. Some STEs are reflected by the enhanced potential barrier of the anode sheath and, after a round trip through the plasma with another reflection near the cathode, they return into the area with intense plasma oscillations. When it happens, the energies of STEs moving towards the anode downstream of the instability maximum increase even more, see Fig. 3b and curve 2 in Fig. 4. The maximal energy of STEs (registered at ) is about . At the first minimum of the electric field amplitude as a function of time (arrow 2 in Fig. 1b), the maximal energy is lower, about , but still almost twice the maximal energy of the one-stage acceleration, compare curves 2 and 1 in Fig. 4.
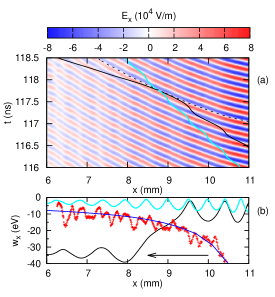
Acceleration of bulk electrons by the short waves is studied with test particles which move in the electric field provided by the simulation. A test particle with low initial energy () does not get net acceleration, its energy only oscillates along the particle trajectory, see cyan curves in Fig. 5. A particle with higher initial energy (), however, is accelerated by these waves, see the black curves in Fig. 5. Note that before and after the acceleration, the energy of the test particle in the wave field oscillates, see the black curve in Fig. 5b. The acceleration occurs if at the moment when the energy of the particle is maximal, the velocity of the particle is equal to the local phase speed of the wave, compare the black energy-vs-coordinate curve of the test particle and the blue curve corresponding to the wave phase velocity in Fig. 5b.
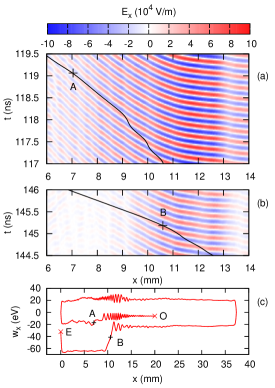
The average energy of the test particle after the acceleration is about which is sufficient to penetrate through the sheath potential barrier (about ). Another test particle with initial energy of after the first acceleration (point A in Figs. 6a and 6c) has only . This particle is reflected by the anode sheath, travels through the whole plasma, reflects near the cathode, and approaches the instability area with the energy of about , see Fig. 6c. The particle is accelerated again at the segment between and , see point B in Figs. 6b and 6c. The energy of the particle after the acceleration is about , which is more than ten times the initial particle energy. The first acceleration occurs similar to the case described in the previous paragraph except that due to the lower initial particle speed the acceleration occurs closer to the anode where the wave amplitude is lower, compare Figs. 6b and 5a.
The second acceleration occurs in the area immediately adjacent to the density plateau where the wave phase speed and, in general, amplitude are higher. It is necessary to mention, however, that by this time the short waves in the majority of the density slope area decayed because they were involved in intense acceleration of plasma particles, see Figs. 6b and 3a for , and the instability amplitude is also noticeably lower than during the first acceleration, compare wave fields in Figs. 6a and 6b. The decay of the plasma waves is a significant limiting factor for the observed two-stage accelerating mechanism.
Summarizing, in a dc plasma-beam system with nonuniform density, suprathermal electrons are generated by short plasma waves excited at the density gradients. Some of the accelerated electrons may be reflected by the anode sheath and reintroduced into the two-stream instability area where they will be accelerated one more time. The energy of an electron after the second acceleration can be an order of magnitude higher than its initial energy and few times more than its energy after the first acceleration stage. The simulation above, unlike the experiments of Xu et al. (2008); Chen and Funk (2010), does not include the rf voltage. This has both favorable and negative consequences. On one hand, variation of the energy of the beam by the rf voltage may reduce the efficiency of excitation of plasma waves. On the other hand, in a real dc-rf system, plasma bulk electrons are trapped (at least part of the rf period) in a potential well much deeper than the one created by thermal electron motion. This will prevent suprathermal electrons from escaping to the walls and allow them to go through two or more acceleration cycles as described above.
ACKNOWLEDGMENTS
I. D. Kaganovich is supported by the U.S. Department of Energy.
References
- Melrose (1986) D. B. Melrose, Instabilities in Space and Laboratory Plasmas (Cambridge University Press, 1986), chap. 3, 4.
- Malkin and Fisch (2002) V. M. Malkin and N. J. Fisch, Phys. Rev. Lett. 89, 125004 (2002).
- Kemp et al. (2006) A. J. Kemp, Y. Sentoku, V. Sotnikov, and S. Wilks, Phys. Rev. Lett. 97, 235001 (2006).
- Kelogg (2003) P. J. Kelogg, Planet. Space Sci. 51, 681 (2003).
- Treumann (2009) R. A. Treumann, Astron. Astrophys. Rev 17, 409 (2009).
- Balogh and Treumann (2011) A. Balogh and R. A. Treumann, Physics of Collisionless Shocks - The Space Plasma Shock Waves, vol. 10 of ISSI Scientific Report Series (Springer Media Verlag, Berlin-Heidelberg-New York, 2011).
- et al. (2010) T. Morita et al., J. Phys. Conf. Ser. 244, 042010 (2010).
- et al. (2012) J. S. Ross et al., Phys. Plasmas 19, 056501 (2012).
- Yoon et al. (2005) P. H. Yoon, T. Rhee, and C.-M. Ryu, Phys. Rev. Lett. 95, 215003 (2005).
- Kaganovich et al. (2009) I. D. Kaganovich, V. I. Demidov, S. F. Adams, and Y. Raitses, plasma Phys. Contr. Fusion 51, 124003 (2009).
- Xu et al. (2008) L. Xu, L. Chen, M. Funk, A. Ranjan, M. Hummel, R. Bravenec, R. Sundararajan, D. J. Economou, and V. M. Donnelly, Appl. Phys. Lett. 93, 261502 (2008).
- Chen and Funk (2010) L. Chen and M. Funk, in 63rd Annual Gaseous Electronics Conference and 7th International Conference on Reactive Plasmas (Paris, France, 2010), abstract ID: BAPS.2010.GEC.CTP.154.
- Tsytovich (1970) V. N. Tsytovich, Nonlinear effects in plasma (Plenum Press, NY, 1970).
- Shapiro and Shevchenko (1984) V. D. Shapiro and V. I. Shevchenko, Basic Plasma Physics (North Holland Phys. Publ., Amsterdam, 1984), vol. 2, pp. 123–182.
- Porkolab and Chang (1978) M. Porkolab and R. P. H. Chang, Rev. Modern Phys. 50, 745 (1978).
- Robinson (1997) P. A. Robinson, Rev. Modern Phys. 69, 507 (1997).
- Cairns and Robinson (1999) I. H. Cairns and P. A. Robinson, Phys. Rev. Lett. 82, 3066 (1999).
- Golovanov et al. (1977) Y. P. Golovanov, N. I. Elagin, L. P. Zakatov, A. S. Kingsep, and A. G. Plakhov, Sov. J. Plasma Phys. 3, 349 (1977).
- et al. (1999) A. V. Arzhannikov et al., Fusion Tech. 35, 112 (1999).
- Papadopoulos and Coffey (1974) K. Papadopoulos and T. Coffey, J. Geophys. Res. 79, 674 (1974).
- Rowland (1988) H. L. Rowland, J. Geophys. Res. 93, 12916 (1988).
- Khrabrov et al. (2015) A. V. Khrabrov, I. D. Kaganovich, P. L. G. Ventzek, A. Ranjan, and L. Chen, Plasma Sci. Technol. (2015), submitted.
- Sydorenko (2006) D. Sydorenko, Ph.d., University of Saskatchewan (2006).
- et al. (1998) V. T. Astrelin et al., Sov. Phys. J. Exp. Theor. Phys. 86, 489 (1998).
- Ryutov (1970) D. D. Ryutov, Sov. Phys. J. Exp. Theor. Phys. 30, 131 (1970).
- Gunell et al. (1996) H. Gunell, J. P. Verboncoeur, N. Brenning, and S. Torven, Phys. Rev. Lett. 77, 5059 (1996).
- McFarland and Wong (1998) M. D. McFarland and A. Y. Wong, Phys. Rev. Lett. 80, 5540 (1998).
- Wendt et al. (2001) M. Wendt, T. Klinger, C. Franck, and A. Piel, Phys. Scr. 63, 62 (2001).
- Kaganovich and Sydorenko (2015) I. D. Kaganovich and D. Sydorenko, Phys. Rev. Lett. (2015), submitted.