Boxy/peanut/X bulges, barlenses and the thick part of galactic bars: What are they and how did they form?
Abstract
Bars have a complex three-dimensional shape. In particular their inner part is vertically much thicker than the parts further out. Viewed edge-on, the thick part of the bar is what is commonly known as a boxy-, peanut- or X- bulge and viewed face-on it is referred to as a barlens. These components are due to disc and bar instabilities and are composed of disc material. I review here their formation, evolution and dynamics, using simulations, orbital structure theory and comparisons to observations.
1 Introduction
Boxy/peanut/X (for short B/P/X, or B/P) bulges protrude out of the central region of galactic discs viewed edge-on. Their name comes from their shape, which is reminiscent of a box, a peanut or an ‘X’ structure. Good examples are NGC 1381 and ESO 151-G004. There have been many observational studies of such objects over the years, while their formation and evolution have also been extensively studied with the help of simulations, both to understand their origin and as a link to secular evolution. Orbital studies have provided candidate families for the backbone of this structure.
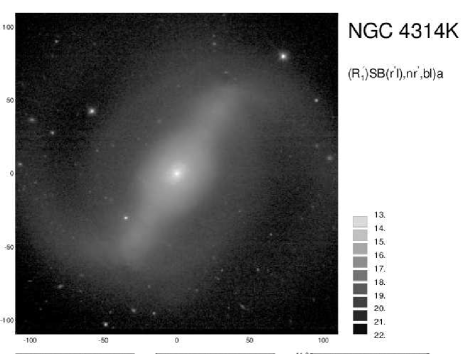
Barlens components (bl for short) were introduced into the picture only quite recently (Laurikainen et al., 2011). They are defined as “lens-like structures embedded in the bars” (Laurikainen et al., 2013). They are thus found in the central part of barred galaxies “but are generally distinct from nuclear lenses by their much larger sizes” (Laurikainen et al., 2011). They are also distinct from standard lenses (Kormendy, 1979) because they are shorter than bars (Laurikainen et al., 2013) and because on the bar major axis they blend smoothly in the bar radial density profile, without having any steep drop (Laurikainen et al., 2014; Athanassoula et al., 2014). NGC 4314 and NGC 4608 are good examples of galaxies with a barlens component. Images of further example galaxies can be found in the NIRS0S (Near Infrared S0 survey) atlas (Laurikainen et al., 2011), the Hubble atlas (Sandage, 1961), the S4G (Spitzer Stellar Structure Survey of Galaxies) sample (Sheth et al., 2010), as well as in Fig. 2 of Buta et al. (2006) and Fig. 8 and 12 of Gadotti (2008).
Here I will discuss how these components form and evolve and what their properties and dynamics are, basing this discussion on simulations, orbital structure results and on comparison with observations. I will discuss neither the Milky Way bulge, nor bulges in a cosmological setting, and will not give a full account of observations, since all three subjects will be covered elsewhere in this book. I first review orbital structure results (Sect. 2), focusing on the families that can be building blocks of B/P/X/bl structures. I then turn to simulation results (Sect. 3). In particular, in Sect. 3.3 I discuss the ensuing shape of bars and the B/P extent. Comparison with observations is the subject of Sect. 4: morphology and photometry in Sect. 4.1; kinematics in Sect. 4.2. I discuss theoretical aspects of the barlens component in Sect. 5. Recent reviews on this or related subjects have been given by Kormendy & Kennicutt (2004), Athanassoula (2008, 2013a) and Kormendy (2008, 2013).
2 Orbital structure
In order to understand the structure, kinematics or dynamics of a given galaxy, or of any of its substructures, it is necessary first to understand the orbits that constitute it. Particularly important for this are the periodic orbits – i.e. orbits that close in a given reference frame after a number of rotations – which constitute the backbone of the structure. These come in two types. Stable periodic orbits trap around them regular orbits, while unstable periodic orbits are linked to chaos. The latter, however, can also, in certain cases, contribute to the outline of structures.
2.1 Periodic orbits in two dimensions
The orbital structure of bars in two dimensions (2D) is relatively simple. The main backbone here is the family, constituted of orbits which, in a frame of reference co-rotating with the bar, close after two radial oscillations and one revolution around the centre, i.e. are in 2:1 resonance (Contopoulos & Papayannopoulos, 1980; Athanassoula et al., 1983). They are elongated along the bar and their axial ratio varies with distance from the centre, but also from one model to another. At their apocentres they often have cusps or loops (see Athanassoula 1992a for a study of their morphology). There are other families of orbits, such as the – which is also 2:1 but is elongated perpendicular to the bar – the 3:1, or the 4:1, but they are less important for the global bar structure, although they are related to several specific aspects such as the shape of the bar, or the structure of the inner kpc.
In 2D studies, by construction, we can study orbital stability only in the plane and the trapped orbits are also planar. A fair fraction of the orbits are stable, but the amount of chaos depends strongly on the properties of the bar, such as its mass, axial ratio etc. (e.g. Athanassoula et al., 1983; Manos & Athanassoula, 2011).
2.2 Periodic orbits in three dimensions
In three dimensions (3D) the orbital structure becomes much more complex, even for planar orbits (e.g. Pfenniger, 1984; Skokos, Patsis & Athanassoula, 2002a, b; Harsoula & Kalapotharakos, 2009; Patsis & Katsanikas, 2014a, b). Indeed – while in two dimensions periodic orbits can be stable or unstable depending on their response to in-plane perturbations – in 3D all orbits, including the planar periodic ones, can be subject to vertical perturbations, which in turn can introduce instability in the system. The latter is particularly important for our subject matter. At the energy value where a family turns from stable to unstable a new stable family is generated by bifurcation, and this may play an important role in the dynamics of the system. Thus, in barred galaxies there are a number of vertical families named by Skokos et al. as as , , etc.111For certain potentials there is also the z3.1s family whose morphology resembles that of the family, but it is not related to the tree. Another potentially useful family is the x1mul2 (Patsis & Katsanikas, 2014a).. These bifurcate from the family at the main vertical resonances, such as the 2:1, 3:1, 4:1 etc. There are generally two per resonance, one which crosses the symmetry plane perpendicular to the bar major axis at = 0 and the other with = 0. Hence, and correspond to the 2:1 vertical resonance, and to the 3:1 etc. Trapping around these families determines the vertical thickness and structure of the bar. These vertical families, together with the family from which they bifurcate, form what is often referred to as the tree (Skokos, Patsis & Athanassoula, 2002a). Thus the backbone of a 3D bar is not the family but the tree. Examples of members of the main four vertical families are given in Fig. 1. These plots are taken from the work of Skokos, Patsis & Athanassoula (2002a) where the bar is along the axis, so that the end-on view222In the end-on view the galaxy is observed edge-on with the line of sight along the bar major axis. is the projection on the (, ) plane and the side-on view333In the side-on view the galaxy is observed edge-on with the line of sight perpendicular to the bar major axis. is the projection on the (, ) plane. Since the bar potential is symmetric with respect to the equatorial plane, for each periodic orbit there is also its corresponding symmetric one (not shown here). Thus the side-on view of an orbit has the shape of either a smile () or a frown ().
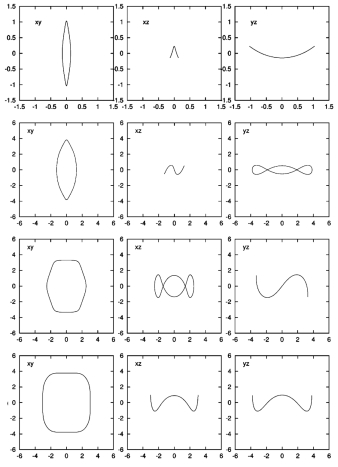
The orbits of each family can be useful for building a vertically thick structure only within certain energy ranges and fill only specific regions of the 3D space. As a result, these orbits do not thicken vertically the whole bar; instead they only thicken its inner parts. Thus, if the vertical families are populated, the bar should have two parts: an inner one that is vertically thick and an outer one which is vertically thin.
A further point to note is that the members of the various families have different extents along the bar major axis relative to the bar length, and their vertical extent and face-on shapes differ considerably from one family to another. The family, which bifurcates at the lowest energy, has the smallest extent along the bar major axis and the largest extent perpendicular to the equatorial plane. Its face-on shape is rather elongated. Higher order families, compared to lower order ones, bifurcate at higher energies, have a larger extent along the bar major axis close to the equatorial plane and a smaller one perpendicular to this plane. Their face-on outline is much less elongated. Measuring the ratio of the bar length (as determined from the orbits that constitute it) to the length of the thick part (also from its orbits) (Patsis, Skokos & Athanassoula (2002), hereafter PSA02) find that this number for the is roughly in the range [2., 4.], while for the family it is around 1.1 to 1.3. A note of caution is necessary though: the only realistic bar potential used so far in 3D orbital calculations is the Ferrers’ bar potential (Ferrers, 1877). It is thus not possible to check to what extent these numbers are model dependent. Moreover, the density corresponding to the Ferrers potential does not have an appropriate side-on shape, i.e. it is neither boxy- nor peanut- shaped. Performing more orbital structure calculations using a yet more realistic potential would be highly desirable at this stage.
2.3 The role of chaotic orbits
Stable periodic orbits and regular orbits trapped around them are not the only way of building the galactic structures we are discussing here. Unstable periodic orbits are linked to chaos and could, in some cases, provide an alternative. Indeed sticky chaotic orbits may also contribute to such structures either if they stick to regular tori around the stable families or to unstable asymptotic curves of the unstable periodic orbits (Contopoulos & Harsoula, 2008).
Patsis & Katsanikas (2014a, b) examined the evolution of the phase space in a 3D bar and underlined the role that chaotic phenomena may play in building the B/P/X structures. This is a promising alternative and merits further work to establish its role in galaxies. High quality N-body simulations, provided they are realistic, are a perfect test bed for such types of studies, because they offer not only the possibility of viewing the structures from any desired viewing angles, but also allow studies at the level of individual orbits. They can thus give information on the amount of chaotic orbits and also on their specific contributions to the B/P/X structures. First steps in this direction have already been made (Athanassoula, 2005c; Harsoula & Kalapotharakos, 2009; Manos & Machado, 2014) and more specific applications are underway.
3 Simulations
3.1 General description
Although inklings of a boxy/peanut structure can be already seen in the edge-on views of the simulations of Hohl & Zang (1979) and Miller & Smith (1979), the first to show it convincingly were those of Combes & Sanders (1981). They were followed by Combes et al. (1990), who found a B/P morphology in all their bar-forming simulations viewed side-on. This forms somewhat after the bar, with a delay of the order of a Gyr (see Sect. 3.2). Using axisymmetric definitions for the resonances, the authors found that the horizontal and vertical inner Lindblad resonances (ILRs) coincide by the end of the simulations. This, however, is presumably model dependent (see e.g. Quillen et al., 2014, for a different behaviour). Both Combes et al. (1990) and Pfenniger & Friedli (1991) found that the backbone of the peanut should be a vertically 2:1 family.
Pfenniger & Friedli (1991) and Raha et al. (1991), running similar simulations, found that the formation of the B/P structure is preceded by an asymmetric phase during which the equatorial plane is not a symmetry plane anymore. In the latter of these two papers this was ascribed to the fire-hose instability (Toomre, 1966), while in the former to orbital instabilities and the ensuing families (Sect. 2). Both Combes et al. (1990) and Raha et al. (1991) note that the B/P formation is associated with a drop of the bar strength, which in many cases can be strong and sharp. The latter work conjectured that “bars may be […] even destroyed by this instability”. However, Debattista et al. (2004, 2006) ran a larger set of simulations and found no clear case of bar destruction. From my own, yet larger set of simulations, I also found the same result (unpublished). Strictly speaking, this does not prove that a bar destruction can not occur, it just shows that it is rather unlikely, unless this occurs in a part of the parameter space which has not yet been explored. Note also that after its sharp decrease, the bar strength starts increasing again, or at least stays relatively constant (see Sect. 3.2).
Athanassoula & Misiriotis (2002, hereafter AM02) and Athanassoula (2005a) ‘observed’ the bars and B/P bulges in their simulations and obtained specific results on their shape, extent and kinematics. The quantitative estimates they obtained showed clearly that the B/P bulges are shorter than bars. AM02 and Athanassoula (2003, 2005a) showed that stronger bars produced on average stronger B/P bulges, i.e. bulges which extended further out from the galactic plane, thus confirming the observational result of Lütticke et al. (2000b). They also found that the thick part of relatively weak bars generally has a boxy shape, that of stronger ones a peanut shape, and the very strong ones an X shape.
Mihos et al. (1995) simulated a minor merger of a disc galaxy with its satellite. This induces a strong bar which forms a clear X shape. Strictly speaking, this is not really an example of a B/P formation from a merger, since all the companion does is to drive a bar, which, once formed, buckles and thickens vertically. This driven bar is very strong and according to the results discussed above, one would expect an ‘X’ shaped bulge to form, as indeed occurred in the simulation.
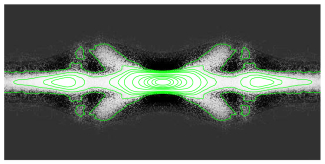
Athanassoula (2005a) unsharp masked444Unsharp masking, also called median filtering, consists in replacing the value of each pixel by the difference between it and the median of all pixel values within a circular aperture centred on the pixel. This highlights sharp features. a number of images from N-body simulations with the disc viewed edge-on and found a number of interesting morphological features. An example is given in Fig. 2, which clearly shows an X-shape, whose four arms do not meet at the centre but in pairs at a distance from it. In other examples though (not shown here) these four arms meet together in the centre. Schematically, these two types of X shapes can be shown as – and , respectively. They were later found also in observations and were dubbed off-centred and centred Xs, respectively (Bureau et al., 2006). There are also two clear maxima, one on either side of the centre of the simulated galaxy. In the example of Fig. 2 they are due to an inner ring, but they could also have been due to a superposition of appropriate orbit families (PSA02).
Martinez-Valpuesta et al. (2006) witnessed in her simulation a second buckling event occurring between 5 and 8 Gyr, i.e. when the bar is in its secular evolution phase. At the beginning of this time range, its length is already of the order of 12 1 kpc, and continues growing after the end of the second buckling, reaching roughly 16 kpc at 12 Gyr. During the first buckling, the asymmetry is strongest in the region closer to the centre and during the second one roughly in the middle of the bar region. Such events can also be seen, or inferred, in other simulations (e.g. O’Neill & Dubinski, 2003; Athanassoula, 2005b; Athanassoula, Machado & Rodionov, 2013) and even a triple buckling has been reported (Debattista et al., 2006).
Including gas in simulations may or may not suppress buckling 555Peanut formation without buckling has also been found in simulations with no gas (Quillen et al., 2014).. Berentzen et al. (1998, 2007) and Villa-Vargas, Shlosman, & Heller (2010) use an isothermal gas and note that the vertical buckling is much less pronounced than in a similar but collisionless simulation, to the point of being difficult to detect by simple visual inspection. They find that with increasing gas fraction, both the buckling and the B/P strength decrease. When radiative cooling is included, buckling is prohibited (Debattista et al., 2006; Wozniak & Michel-Dansac, 2009). This is in agreement with the bar strength evolution of the simulations in Athanassoula, Machado & Rodionov (2013), coupled to their peanut strength shown in (Iannuzzi & Athanassoula 2015, hereafter IA15).
3.2 Evolution of bar related quantities
In Fig. 3 I show the time evolution of bar-related quantities for three different collisionless simulations. The upper panel (a) corresponds to what is referred to in AM02 as an MD model, i.e. a model where the disc dominates in the inner region (a maximum disc model). The two lower panels correspond to what is referred to in AM02 as an MH model. Here the halo and the disc contributions are comparable in the inner parts and the halo plays a more prominent role in the angular momentum redistribution within the galaxy.
In the MD model, the bar starts growing very rapidly, roughly 0.8 Gyr from the beginning of the simulation. Its growth phase lasts also less than a Gyr, after which the strength of the m=2 component reaches a maximum, due to some extent to a strong, but short-lived two-armed spiral (Athanassoula, 2013b). Between t=3.6 and 4.2 Gyr the bar strength decreases very strongly and rapidly, after which it starts increasing again due to secular evolution. The buckling strength is measured from the asymmetry with respect to the equatorial plane and shows a strong and narrow peak at the buckling time (t=3.65 Gyr). The strength of the B/P increases abruptly in the time interval during which the bar strength drops. Note that the time of maximum asymmetry is within this time range.
The corresponding plots for the first MH run (bottom left panel, b) show the same qualitative behaviour, but with clear quantitative differences. Namely, the bar starts growing considerably later (t=3 Gyr), grows more during the secular evolution phase and reaches a higher strength by the end of the run. These differences can be easily understood because the halo delays bar formation initially, but at later times helps the bar grow by absorbing angular momentum emitted from the bar region (Athanassoula, 2002, 2003).
The third set of plots (bottom right panel, c) is also for an MH run but shows an interesting difference from the previous simulation, namely there is a second buckling event, occurring roughly between 7 and 9 Gyr. The second asymmetry peak is less high and also broader, i.e. the buckling lasts considerably longer but is less strong. The time range during which the peanut strength increases is also somewhat longer, and the increase in B/P strength considerable. During that time the bar strength stops increasing and stays roughly constant.
The buckling episode can also be accompanied by an abrupt change of , where and are the and radial components of the velocity dispersion, respectively (e.g. Debattista et al., 2006; Martinez-Valpuesta et al., 2006; Athanassoula, 2008). Saha, Pfenniger & Taam (2013), however, present a case where a sharp drop occurs well before the buckling and propose an alternative indicator, namely the tilt of the velocity ellipsoid in the meridional plane.
3.3 The 3D shape of bars

Athanassoula (2005a) presented evidence on the 3D shape of bars coming from various sources, including orbital structure calculations, simulations and various observations of real galaxies. All converges to the same conclusion: Bars have a complex 3D shape with a vertically thick inner part and a thin outer part. Therefore, a B/P/X shaped component is a part of a bar, and, more specifically, its thick part. To visualise this best, it is informative to take a snapshot from an N-body simulation of a bar-forming disc with no classical bulge at a time when both the bar and the B/P feature have formed. Then select only the particles which in the () view are located roughly within the outer isodensities of the bar and visualise them from many viewing angles. Fig. 4 shows an example for such a result from a simulation which was chosen so as to have a strong bar with a somewhat X-like edge-on view. The top panel shows the face-on view and the bottom one gives the edge-on one, with two intermediate viewing angles in between (second and third panels). For a better visualisation see the complete animation showing the slow rotation around the bar major axis in http://195.221.212.246:4780/dynam/movie/BPreview/BPreview.avi
In the face-on view the bar is seen to have a length of roughly 8 kpc, while in the near-side-on views the thick part is seen to have an extent of roughly 4 kpc, i.e. is clearly less extended than the bar. The ratio of the two extents argues that the main contributor to the B/P/X feature could be the family. The face-on shape of the thick part of the bar can be described as a squashed oval, because the parts of the isodensities near the bar minor axis form nearly straight lines parallel to the bar major axis. In the second view (second panel from the top), the outermost parts have a clearly rectangular-like outline, which becomes X-shaped in the fully side-on view (bottom panel).
Both in the face-on and in the side-on views the outer part of the bar is quite thin. Near its ends, the bar outline becomes more extended in the face-on view, with a ansae-like shape.
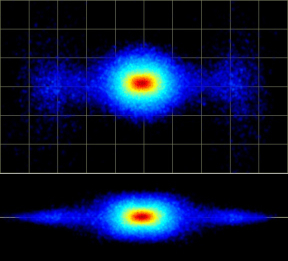
Fig. 5 gives similar information, but for a weaker bar. In the face-on view the bar has a length of roughly 4 kpc, while in the near-side-on views (not shown here) the thick part is seen to have an extent of roughly 1.5 kpc , i.e. the latter is clearly less extended than the bar along its major axis. The ratio of the two extents now argues strongly that the main contributor to the B/P feature is the family. The face-on shape of the thick part of the bar is rectangular-like in the inner parts, but not in its outermost parts where it is more oval-like. In the lower panel, the outermost B/P parts have a clearly rectangular outline, so that this feature could be called boxy.
In the face-on view the outer part of the bar is less thin than in the previous example, and near its ends, it has extensions similar to the previous example, i.e. shaped as ansae.
4 Comparisons with observations
4.1 Morphology and photometry
As already discussed in the previous section, a face-on view is not favourable to viewing the thick part of the bar, while edge-on views are not favourable for the thin part of it. The best compromise comes from intermediate, but close to edge-on cases. This was first noted by Bettoni & Galletta (1994) for NGC 4442 which has an inclination angle =72∘, Quillen et al. (1997) for NGC 7582 with =65∘ and Athanassoula & Beaton (2006) for M31 with =77∘. In this last paper Athanassoula & Beaton viewed N-body simulations from different viewing angles to compare with the near infrared (NIR) observations of Beaton et al. (2007). The B/P is easily recognised, while the outer thin part of the bar contributes two ‘elongations’ which appear offset from major axis of the B/P isodensities. For the inclination of M31, this offset is best seen when the angle between the bar and the galaxy major axes is between 20∘ and 50∘, but this range could well be somewhat model dependent. Erwin & Debattista (2013) extended this study to smaller inclinations and showed that the B/P feature can be detected even at inclinations as low as 40∘, although the range of bar position angles for which the ‘elongations’ (here called ‘spurs’) are clearly visible is considerably diminished. Using a sample of 78 nearby early type barred galaxies with inclinations less than 65∘ they showed that the extent of the thick part of the bar is between 0.4 and 3.8 kpc and the relative extent compared to that of the total bar is 0.38 0.08.
It is possible to obtain information on both the bar and the boxy/peanut in edge-on galaxies by using photometric profiles from strips parallel to the major axis (i.e. the projected equatorial plane). The signature of the bar on the profile along the major axis is a ledge followed by a sharp drop of the intensity. The distance of the drop from the centre of the galaxy gives the length of the bar projected on the plane of the sky. Similarly, profiles from strips offset from the major axis give the projected length of the B/P feature. This technique has been widely used (e.g. Wakamatsu & Hamabe, 1984; Dettmar & Barteldrees, 1990; D’Onofrio et al., 1999).
Lütticke et al. (2000a) analysed a sample of about 1350 edge-on disc galaxies and found that about 45% of all bulges are B/P shaped. In a sequel paper (Lütticke et al., 2000b) they analysed photometry of 60 edge-on galaxies in the NIR to minimise the effect of dust and concentrate on the old stellar population. They found a correlation between prominent B/P bulges and strong bar signatures, which they interpret as a dependence of the boxiness on the bar strength, as was later confirmed by simulations (Sect. 3.1). They also give the ratio of the bar extent to that of the B/P. Unfortunately, they measured the bar length up to the end of the density drop, which systematically overestimates the bar length and makes comparisons with other works difficult.
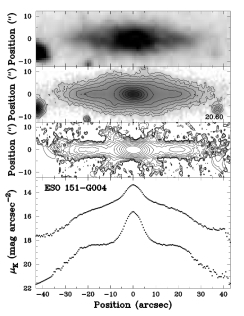
Bureau et al. (2006) analysed the structure and morphology of 30 edge-on galaxies using n-band images. With the help of unsharp masking they showed that galaxies with a B/P structure have more complex morphology than those without it, revealing centred or off-centred X shapes and secondary maxima. These are an “essentially near-perfect match” to the unsharp masks of images of N-body simulations given by Athanassoula (2005a) (Sect. 3). ESO 151-G004 (Fig. 6) is a good example of an off-centred X shape and NGC 1381 of a centred one (see Fig. 1 of Bureau et al. 2006). A large fraction of the galaxies have also two secondary maxima, one on each side of the centre, similar to and at similar locations as the unsharp masked simulated galaxies (Athanassoula, 2005a). More unsharp masked galaxies, agreeing equally well with simulations, can be found in Aronica et al. (2003) and Patsis & Xilouris (2006).
Bureau et al. also compared two types of surface brightness radial profiles, one from the major axis surface brightness (lower curve in the bottom panel of Fig. 6) and the other by summing the data vertically until the noise level of the image was reached (upper, brighter curve in the same panel and figure). The difference between the two argues that the vertical scale length varies with radius. Axisymmetric disc galaxies generally have only two major components666Since here I concentrate on the structure of the inner parts, I do not discuss outer breaks and the discs beyond them.: the disc and the classical bulge. Yet galaxies with a B/P structure have three or four characteristic regions. From the innermost to the outermost, the first region has a very steep profile and is generally associated with the bulge(s). Then follows a shallow or even flat region which is associated with the bar and in some cases links outwards to the disc component. In other cases, in between this shallow component and the disc there is a steep drop, associated with the corresponding features seen at the end of face-on bars both in observed and in simulated galaxies. All these features show up better on the cuts along the major axis than on vertically summed ones, as expected.
4.2 Kinematics
Position velocity diagrams (hereafter PVDs) obtained from emission line, long slit spectra of galaxies with B/P bulges (Kuijken & Merrifield, 1995; Merrifield & Kuijken, 1999; Bureau & Freeman, 1999) show a number of interesting features, of which the most important has the form of a tilted X with one near-vertical branch and the other at an angle, and a clear gap between the two. There is also material in the so-called forbidden quadrants. These features were already linked to bars by Kuijken & Merrifield (1995).
Bureau & Athanassoula (1999) made model PVDs from the planar periodic orbits in a barred galaxy model. Although this approach is too crude to reproduce, even approximately, observed PVDs it can give valuable insight. There are clear signatures of the and the families. The latter is near-vertical in the PVD space, while the former is at an angle to it. Furthermore there is signal in the forbidden quadrants, resulting from the elongated shape of the orbits. To actually model emission line PVDs, Athanassoula & Bureau (1999) used the gas flow simulations of Athanassoula (1992b) viewing them edge-on. They found that the shocks along the leading edges of the bar and the resulting inflow lead to the characteristic gap seen in observed PVDs. This gap thus reliably indicates the presence of a bar and the existence of an ILR. It also sets strong constraints on the orientation of the bar with respect to the line of sight.
Chung & Bureau (2004) made long-slit absorption line kinematic observations along the major axis of the 30 galaxies of the Bureau & Freeman (1999) sample. They used Gauss-Hermite series up to fourth order and obtained the integrated light, the mean stellar velocity , the velocity dispersion and the third and fourth order moments and . Bureau & Athanassoula (2005) used the same techniques and, in as much as possible, also the same software to ‘observe’ N-body simulations from an edge-on perspective. They found similar signatures in these profiles, namely i) a rotation curve with characteristic double hump, ii) an that correlates with over most of the bar extent and iii) a velocity dispersion with a central peak which in the centre-most region may be flat or have a relatively shallow minimum. At intermediate radii has a plateau, which may end on either side by a shallow maximum before a steep drop (see also AM02).
The work described so far has only considered 1D velocity information on a slit along the major axis. Obtaining information beyond this for NGC 4565, Kormendy & Illingworth (1982) made a very interesting finding, namely that, within the bulge, the rotational velocity changes very little with height, which was dubbed ‘cylindrical rotation’. This was confirmed for other galaxies by many other studies (e.g. Bettoni & Galletta, 1994; Fisher, Illingworth & Franx, 1994; Falcon-Barroso et al., 2004; Williams et al., 2011, and references therein). From the simulation side, a very spectacular cylindrical rotation was found by AM02 for a strongly barred galaxy viewed side-on. Nevertheless, although there may be some rough relation between bar strength and cylindrical rotation, it is far from being a clear correlation, as was found from the observational side by Williams et al. (2011) and from the simulations by IA15.
IA15 extended previous work, by including the second dimension and by using Voronoi binning and the software of Cappellari (Cappellari & Copin, 2003). They also used simulations including gas, star formation, feedback and cooling, partly from Athanassoula, Machado & Rodionov (2013). They recover the results of Bureau & Athanassoula (2005) and also find peanut related signatures (elongated wings of large values and X-shaped regions of deep minima) roughly in an area covering the peanut.
When viewed end-on, bars can be mistaken for classical bulges (e.g. AM02). This holds also for small departures of the bar major axis from the line of sight, not exceeding 10∘ (Athanassoula, 2005a). IA15 investigated the case where both a classical bulge and an end-on viewed bar are present and note that the existence of the bar can be seen in the kinematics, although its signatures are considerably weaker than in the absence of the classical bulge, erroneously hinting to a much weaker bar than actually present.
Similar work, but for face-on views showed that the kinematic signature of a face-on peanut is two minima, one on either side of the centre (Debattista et al., 2004; Mendez-Abreu et al., 2008). These results were recovered also by Iannuzzi & Athanassoula (2015), who also examined the kinematic signatures of the second bucklings. These are much deeper than the corresponding ones of the first buckling and could therefore be easier to observe. Furthermore, the second buckling lasts longer than the first one, which means there would be a higher probability to observe it.
Note that a few large integral-field spectroscopic surveys of nearby galaxies are already available, and many more are starting. Such data, particularly from large telescopes, can provide important new information to further our understanding of bars.
5 Barlenses
As mentioned in the Introduction, barlenses were introduced as separate components only very recently, so very little theoretical work on these structures has so far been made. Athanassoula, Machado & Rodionov (2013) ran a number of high resolution simulations including gas and its physics (star formation, feedback and cooling) and found very realistic morphologies (see their figures 4 and 5 for face-on views). In particular, the inner parts of the bars showed structures whose morphology is very reminiscent of barlenses (see also Figs. 4 and 5 here). To substantiate this visual impression and to understand the origin of these structures Athanassoula et al. (2014, hereafter ALSB) created fits images from the snapshots of these runs and analysed them using the same procedures and software as those used for the analysis of real galaxy images (e.g. Laurikainen et al., 2010).
The comparison to observations started by a visual morphological assessment, which allowed ALSB to make comparisons of observed and simulated galaxy images. The simulated radial projected density profiles along the bar major and minor axes are very similar to those found from observations. Ellipse fits and decompositions of the simulated galaxy images allowed further comparisons. The results are in very good agreement with those found from observed galaxies and showed that the structures found in the simulations can indeed be called barlenses.
An understanding of the nature of the barlens components was now possible from an analysis of the simulations. By viewing snapshots from many different angles, ALSB showed that barlenses are the vertically thick part of the bar viewed face-on, i.e. a barlens and a boxy/peanut/X bulge are the same component, but simply viewed from a different viewing angle.
ALSB, furthermore, came up with a rule of thumb to estimate the extent of the thick part of the bar along the bar major axis, simply from the shape of the isophotes. Based on this, it is possible to estimate galactic potentials more accurately (Fragkoudi et al., 2015), leading to improvements both in orbital and gas flow calculations. ALSB also found from the simulation data correlations between the bar strength and barlens related quantities. These were confirmed by observations in Laurikainen et al. (2014).
A further interesting point is that the barlens component can be, in some cases, mistaken for a classical bulge (ALSB). Thus the fraction of disc galaxies with no classical bulge is presumably larger than what is actually acknowledged. Furthermore, in decompositions where the barlens is taken into account as a separate component, the mass of the classical bulge relative to the total is considerably smaller than that found when a single component is used to model the bar. Laurikainen et al. (2014) find for their sample that =0.1 when a bl component is included in the decomposition, compared to =0.35 obtained from similar decompositions when the barlens component is omitted.
6 Nomenclature
This situation in which the same object, namely the thick part of the bar, is known by several different names depending on the viewing angle is not very satisfactory. It comes from the fact that observations preceded theory and the thick part of the bar was observed from different angles well before N-body simulations and orbital structure studies established the 3D shape of bars.
The situation is further complicated by the fact that the thick part is rightfully called a bulge by the two most widely used definitions of a bulge. According to the first definition, a bulge has a smooth light distribution that swells out of the central part of a disc viewed edge-on. B/P/Xs clearly fulfil this definition. The second definition of bulges is based on radial photometric profiles. Here the bulge is identified as the additional light in the central part of the disc, above the exponential profile fitting the remaining (non-central) part. Barlenses clearly fulfil this definition (ALSB Laurikainen et al., 2014).
Thus B/P/X/bl objects (i.e. the inner thick part of the bar) deserve to be called ‘bulges’ with both current definitions. This is unsatisfactory and calls for a change of the definition of a ‘bulge’ so as to include kinematics. Bulges should be defined as objects that protrude out of the galactic disc in edge-on galaxies, AND contribute to the additional light in the inner parts of the radial photometric profile, above the disc exponential profile, AND are clearly more pressure than rotationally supported (as measured e.g. by their value). Under this definition, only what is now known as classical bulges (Kormendy & Kennicutt, 2004; Athanassoula, 2005a) would qualify as bulges. B/P/X/bl objects could then rightfully be called the thick part of the bar, while discy pseudo-bulges (Kormendy & Kennicutt, 2004; Athanassoula, 2005a; Erwin et al., 2008) could then be called inner discs. This suggestion deserves some consideration, since the nomenclature problem in this subject is becoming quite acute.
7 Summary
Shortly after their formation, bars become vertically unstable. At that point they may, or may not buckle out of the equatorial plane of the galaxy. Following this possible asymmetric stage, or directly after the onset of the instability, the inner parts of the bar thicken considerably and take the shape of a box. At the same time the bar weakens. Subsequently in most cases the bar amplitude starts growing again, although many cases have been found where it stays roughly constant. The thickness of its inner part also increases with time and its shape can evolve to peanut- or X- like.
By singling out the particles that constitute the bar in the face-on view and then viewing the volume they occupy, it becomes clear that the bar has a very complex and interesting three dimensional shape. It has a vertically thick inner part and a thin outer part. Seen face-on the inner part is elongated along the bar; seen edge-on it has a box, or peanut, or ‘X’ shape. This global bar geometry has clear signatures when seen from different viewing angles.
Orbital structure theory has provided the families of 3D orbits that can constitute the backbone of this component. Their extent along the bar major axis is always smaller than that of the bar, but it varies from one family to another as do their vertical height and shape. Thus the family provides the building blocks that are shortest along the bar major axis, vertically thickest and face-on most elongated, while higher order families have orbits which are relatively more extended along the bar major axis, vertically thinner and less elongated.
Simulations, orbital structure results and observations have been extensively inter-compared and an excellent agreement has been found. It is clear that all three are describing the same objects.
The vertically thick part of the bar is known by different names. Viewed edge-on it is usually referred to as boxy, peanut, or X-shaped bulge. Viewed face-on it is known as the barlens component.
Acknowledgements.
I thank Albert Bosma for many stimulating discussions and the editors for inviting me to write this review. I acknowledge financial support from the People Programme (Marie Curie Actions) of the European Union’s Seventh Framework Programme FP7/2007-2013/ under REA grant agreement number PITN-GA-2011-289313 to the DAGAL network. I also acknowledge financial support from the CNES (Centre National d’Etudes Spatiales - France) and from the “Programme National de Cosmologie et Galaxies” (PNCG) of CNRS/INSU, France, and HPC resources from GENCI- TGCC/CINES (Grants x2013047098 and x2014047098).References
- (1)
- Aronica et al. (2003) Aronica, G., Athanassoula, E., Bureau, M., Bosma, A., Dettmar, R.-J., Vergani, D., Pohlen, M., 2003, Ap&SS, 284, 753
- Athanassoula (1992a) Athanassoula E., 1992a, MNRAS, 259, 328
- Athanassoula (1992b) Athanassoula E., 1992b, MNRAS, 259,
- Athanassoula (2002) Athanassoula E., 2002, ApJL, 569, L83
- Athanassoula (2003) Athanassoula E., 2003, MNRAS, 341, 1179
- Athanassoula (2005a) Athanassoula E., 2005a, MNRAS, 358, 1477
- Athanassoula (2005b) Athanassoula E., 2005b, in Planetary Nebulae as Astronomical Tools, Szczerba R., Stasinska G., Gorny S. K., eds., 333
- Athanassoula (2005c) Athanassoula E., 2005c, Ann. New York Acad. Sciences, 1048, 168
- Athanassoula (2008) Athanassoula E., 2008, in Formation and Evolution of Galaxy Bulges, IAU Symp. 245, eds. M. Bureau, E. Athanassoula & B. Barbuy, Cambridge, UK: Cambridge Univ. Press, 93
- Athanassoula (2013a) Athanassoula E., 2013a, in Secular Evolution of Galaxies, eds. J. Falcón-Barroso & J.H. Knapen, Cambridge, UK: Cambridge University Press, 305
- Athanassoula (2013b) Athanassoula E., 2013b, MNRAS, 358, 1477
- Athanassoula & Beaton (2006) Athanassoula, E., Beaton, R. 2006, MNRAS, 370, 1499
- Athanassoula et al. (1983) Athanassoula, E., Bienaymé, O., Martinet, L. & Pfenniger, D. 1983, A&A, 127, 349
- Athanassoula & Bureau (1999) Athanassoula, E., Bureau, M. 1999, ApJ, 522, 699
- Athanassoula et al. (2014) Athanassoula, E., Laurikainen, Salo & Bosma, 2014, arXiv:1405.6726 (ALSB)
- Athanassoula, Machado & Rodionov (2013) Athanassoula, E., Machado, R. E. G., & Rodionov, S. A. 2013, MNRAS, 429, 1949
- Athanassoula & Misiriotis (2002) Athanassoula, E., Misiriotis, A., 2002, MNRAS, 330, 35 (AM02)
- Beaton et al. (2007) Beaton, R., Majewski, S.R., Guhathakurta, P., Skrutskie, M.F., Cutri, R.M., Good, J., Patterson, R.J., Athanassoula, E., Bureau, M., 2007, ApJ, 658, L91
- Berentzen et al. (1998) Berentzen I., Heller C. H., Shlosman I., Fricke K. J., 1998, MNRAS, 300, 49
- Berentzen et al. (2007) Berentzen I., Shlosman I., Martinez-Valpuesta I., Heller C. H., 2007, ApJ, 666, 189
- Bettoni & Galletta (1994) Bettoni, D., Galletta, G., 1994, A&A, 281, 1
- Bureau et al. (2006) Bureau M., Aronica G., Athanassoula E., Dettmar R.-J., Bosma A., Freeman K. C., 2006, MNRAS, 370, 753
- Bureau & Athanassoula (1999) Bureau, M., Athanassoula, E. 1999, ApJ, 522, 686
- Bureau & Athanassoula (2005) Bureau M., Athanassoula E., 2005, ApJ, 626, 159
- Bureau & Freeman (1999) Bureau, M., Freeman, K. C. 1999, AJ, 118, 126
- Buta et al. (2006) Buta, R., Laurikainen, E., Salo, H., Block, D., Knapen, J.H., 2006, AJ, 132, 1859
- Cappellari & Copin (2003) Cappelari, M., Copin, Y., 2003, MNRAS, 342, 345
- Chung & Bureau (2004) Chung, A., Bureau, M. 2004, AJ, 127, 3192
- Combes et al. (1990) Combes F., Debbasch F., Friedli D., Pfenniger D., 1990, A&A, 233, 82
- Combes & Sanders (1981) Combes F., Sanders R. H., 1981, A&A, 96, 164
- Contopoulos & Harsoula (2008) Contopoulos G., Harsoula, M. 2008, Intern. J. of Bifurcation and Chaos, 18, 2929
- Contopoulos & Papayannopoulos (1980) Contopoulos G., Papayannopoulos, T. 1980, A&A, 92, 33
- Debattista et al. (2004) Debattista V. P., Carollo C. M., Mayer L., Moore B., 2004, ApJ, 604, L93
- Debattista et al. (2006) Debattista V. P., Mayer L., Carollo C. M., Moore B., Wadsley J., Quinn T., 2006, ApJ, 645, 209
- Dettmar & Barteldrees (1990) Dettmar, R.J., Barteldrees, A., 1990, in ESO/CTIO Workshop on Bulges of Galaxies, Proceedings (A92-18101 05-90)
- D’Onofrio et al. (1999) D’Onofrio M., Capaccioli M., Merluzzi P., Zaggia S., Boulesteix J., 1999, A&AS, 134, 437
- Erwin et al. (2008) Erwin, P., 2008, in Formation and Evolution of Galaxy Bulges, IAU Symp. 245, eds. M. Bureau, E. Athanassoula & B. Barbuy, Cambridge University Press, 113
- Erwin & Debattista (2013) Erwin, P., Debattista, V.P., 2013, MNRAS, 431, 3060
- Falcon-Barroso et al. (2004) Falcon-Barroso, J. et al. 2004, MNRAS, 350, 35
- Ferrers (1877) Ferrers N. M. 1877, Q.J. Pure Appl. Math., 14, 1
- Fisher, Illingworth & Franx (1994) Fisher, D., Illingworth, G., Franx, M., 1994, AJ, 107, 160
- Fragkoudi et al. (2015) Fragkoudi, F., Athanassoula, E., Bosma, A., Iannuzzi, F., MNRAS, 2015, arXiv:1503.03068
- Gadotti (2008) Gadotti D. A., 2008, MNRAS, 384, 420
- Harsoula & Kalapotharakos (2009) Harsoula M., Kalapotharakos C., 2009, MNRAS, 394, 1605
- Hohl & Zang (1979) Hohl, F., Zang, T.A. 1979, AJ, 84, 585
- Iannuzzi & Athanassoula (2015) Iannuzzi, F., Athanassoula, E., 2015, MNRAS, submitted (IA15)
- Kormendy (1979) Kormendy, J., 1979, ApJ, 227, 714
- Kormendy (2008) Kormendy, J., 2008, in Formation and Evolution of Galaxy Bulges, IAU Symp. 245, eds. M. Bureau, E. Athanassoula & B. Barbuy, Cambridge Univ. Press, 107
- Kormendy (2013) Kormendy, J., 2013, in Secular Evolution of Galaxies, eds. Jesús Falcón-Barroso & Johan H. Knapen, Cambridge, UK: Cambridge University Press, 2013, 1
- Kormendy & Illingworth (1982) Kormendy, J., Illingworth, G., 1992, ApJ, 256, 460
- Kormendy & Kennicutt (2004) Kormendy J., Kennicutt R. C., Jr., 2004, ARA&A, 42, 603
- Kuijken & Merrifield (1995) Kuijken, K., Merrifield, M. R. 1995, ApJ, 443, L13
- Laurikainen et al. (2010) Laurikainen E., Salo H., Buta R., Knapen J. H., Comeron, S, 2010, MNRAS, 405, 1089
- Laurikainen et al. (2011) Laurikainen E., Salo H., Buta R., Knapen J. H., 2011, MNRAS, 418, 1452
- Laurikainen et al. (2013) Laurikainen, E., Salo, H., Athanassoula, E., Bosma, A., Buta, R., Janz, J. 2013, MNRAS, 430, 3489
- Laurikainen et al. (2014) Laurikainen, E., Salo, H., Athanassoula, E., Bosma, A., Herrera Endoqui, M. 2014, MNRAS, 444, L80
- Lütticke et al. (2000a) Lütticke R., Dettmar R.-J., Pohlen M., 2000a, A&AS, 145, 405
- Lütticke et al. (2000b) Lütticke R., Dettmar R.-J., Pohlen M., 2000b, A&A, 362, 435
- Manos & Athanassoula (2011) Manos, T., Athanassoula, E., 2011, MNRAS, 415, 629
- Manos & Machado (2014) Manos, T., Machado, R. 2014, MNRAS, 438, 2201
- Martinez-Valpuesta et al. (2006) Martinez-Valpuesta I., Shlosman I., Heller C., 2006, ApJ, 637, 214
- Mendez-Abreu et al. (2008) Mendez-Abreu, J., Corsini, E.M., Debattista, V.P., De Rijcke, S., Aguerri, J.A.L., Pizzella, A., 2008, ApJ, 679, L73
- Merrifield & Kuijken (1999) Merrifield, M. R., Kuijken, K. 1999, A&A, 345, L47
- Miller & Smith (1979) Miller, R.H., Smith, 1979, ApJ, 227, 785
- Mihos et al. (1995) Mihos, J.C., Walker, I.R., Hernquist, L., Mendes de Oliveira, C., Bolte, M., 1995, ApJ, 447, L87
- O’Neill & Dubinski (2003) O’Neill J. K., Dubinski J., 2003, MNRAS, 346, 251
- Patsis & Katsanikas (2014a) Patsis P. A., Katsanikas, M. 2014a, MNRAS, 445, 3525
- Patsis & Katsanikas (2014b) Patsis P. A., Katsanikas, M. 2014b, MNRAS, 445, 3546
- Patsis, Skokos & Athanassoula (2002) Patsis P. A., Skokos, Ch., Athanassoula E., 2002, MNRAS, 337, 578 (PSA02)
- Patsis & Xilouris (2006) Patsis P. A., Xilouris, M., 2006, MNRAS, 366, 1121
- Pfenniger (1984) Pfenniger, D. 1984, A&A, 134, 373
- Pfenniger & Friedli (1991) Pfenniger D., Friedli D., 1991, A&A, 252, 75
- Quillen et al. (1997) Quillen, A.C., Kuchinski, L.E., Frogel, J.A., DePoy, D.L., 1997, ApJ, 481, 179
- Quillen et al. (2014) Quillen, A.C., Minchev, I., Sharma, S., Qin, Y.-J., Di Matteo, P., 2014, MNRAS, 437, 1284,
- Raha et al. (1991) Raha N., Sellwood J. A., James R. A., Kahn F. D., 1991, Nature, 352, 411
- Sandage (1961) Sandage, A., The Hubble Atlas of Galaxies, Carnegie Institution of Washington, 1961
- Saha, Pfenniger & Taam (2013) Saha, K., Pfenniger, D., Taam, R.E., 2013, ApJ, 764, 123
- Sheth et al. (2010) Sheth, K. et al. 2010, PASP, 122, 1397
- Skokos, Patsis & Athanassoula (2002a) Skokos, Ch., Patsis, P.A., Athanassoula, E. 2002a, MNRAS, 333, 847
- Skokos, Patsis & Athanassoula (2002b) Skokos, Ch., Patsis, P.A., Athanassoula, E. 2002b, MNRAS, 333, 862
- Toomre (1966) Toomre A., Geophys. Fluid Dyn., No. 66-46, 111
- Villa-Vargas, Shlosman, & Heller (2010) Villa-Vargas J., Shlosman I., Heller C., 2010, ApJ, 719, 1470
- Wakamatsu & Hamabe (1984) Wakamatsu, K.I., Hamabe, M., 1984, ApJS, 56, 283
- Williams et al. (2011) Williams, M.J., Zamojski, M.A., Bureau, M., Kuntschner, H., Merrifield, M.R., de Zeeuw, P.T., Kuijken, K., 2013, MNRAS, 414, 2163
- Wozniak & Michel-Dansac (2009) Wozniak H., Michel-Dansac L., 2009, A&A, 494, 11