Substellar fragmentation in self-gravitating fluids with a major phase transition
Abstract
Context. The observation of various ices in cold molecular clouds, the existence of ubiquitous substellar, cold H2 globules in planetary nebulae and supernova remnants, or the mere existence of comets suggest that the physics of very cold interstellar gas might be much richer than usually envisioned. At the extreme of low temperatures (), H2 itself is subject to a phase transition crossing the entire cosmic gas density scale.
Aims. This well-known, laboratory-based fact motivates us to study the ideal case of a cold neutral gaseous medium in interstellar conditions for which the bulk of the mass, instead of trace elements, is subject to a gas-liquid or gas-solid phase transition.
Methods. On the one hand, the equilibrium of general non-ideal fluids is studied using the virial theorem and linear stability analysis. On the other hand, the non-linear dynamics is studied using computer simulations to characterize the expected formation of solid bodies analogous to comets. The simulations are run with a state-of-the-art molecular dynamics code (LAMMPS) using the Lennard-Jones inter-molecular potential. The long-range gravitational forces can be taken into account together with short-range molecular forces with finite limited computational resources, using super-molecules, provided the right scaling is followed.
Results. The concept of super-molecule, where the phase transition conditions are preserved by the proper choice of the particle parameters, is tested with computer simulations, allowing us to correctly satisfy the Jeans instability criterion for one-phase fluids. The simulations show that fluids presenting a phase transition are gravitationally unstable as well, independent of the strength of the gravitational potential, producing two distinct kinds of substellar bodies, those dominated by gravity (“planetoids”) and those dominated by molecular attractive force (“comets”).
Conclusions. Observations, formal analysis, and computer simulations suggest the possibility of the formation of substellar H2 clumps in cold molecular clouds due to the combination of phase transition and gravity. Fluids presenting a phase transition are gravitationally unstable, independent of the strength of the gravitational potential. Arbitrarily small H2 clumps may form even at relatively high temperatures up to – , according to virial analysis. The combination of phase transition and gravity may be relevant for a wider range of astrophysical situations, such as proto-planetary disks.
Key Words.:
Instabilities – ISM: clouds – ISM: kinematics and dynamics – ISM: molecules – Methods: analytical – Methods: numerical1 Introduction
Typically around or more of the gas in spiral galaxies consists of H2, inferred indirectly by CO or dust emission. Since the discovery of dark molecular hydrogen (Grenier et al. 2005; Langer et al. 2010; Planck Collaboration et al. 2011; Paradis et al. 2012), the estimated quantity of H2 in the Milky Way has essentially been doubled, effectively revealing the nature of some of the dark baryons. It is commonly admitted that the CO-related molecular hydrogen is present in relatively dense regions of the interstellar medium, molecular clouds with number density and temperatures of – (Draine 2011).
Even though H2 is by far the most abundant molecule (), molecular clouds are mainly detected by CO emissions because of all the difficulties in detecting cold H2 (Bolatto et al. 2013). For example, H2 only starts emitting at temperatures . See Combes & Pfenniger (1997) for a review of several possible methods for detecting cold H2. Because of these detection difficulties, the real quantity of H2 (as well as He, which shares similar properties of discreteness with H2) in molecular clouds is still rather unknown, especially when the gas temperature is below down to the cosmic background temperature of .
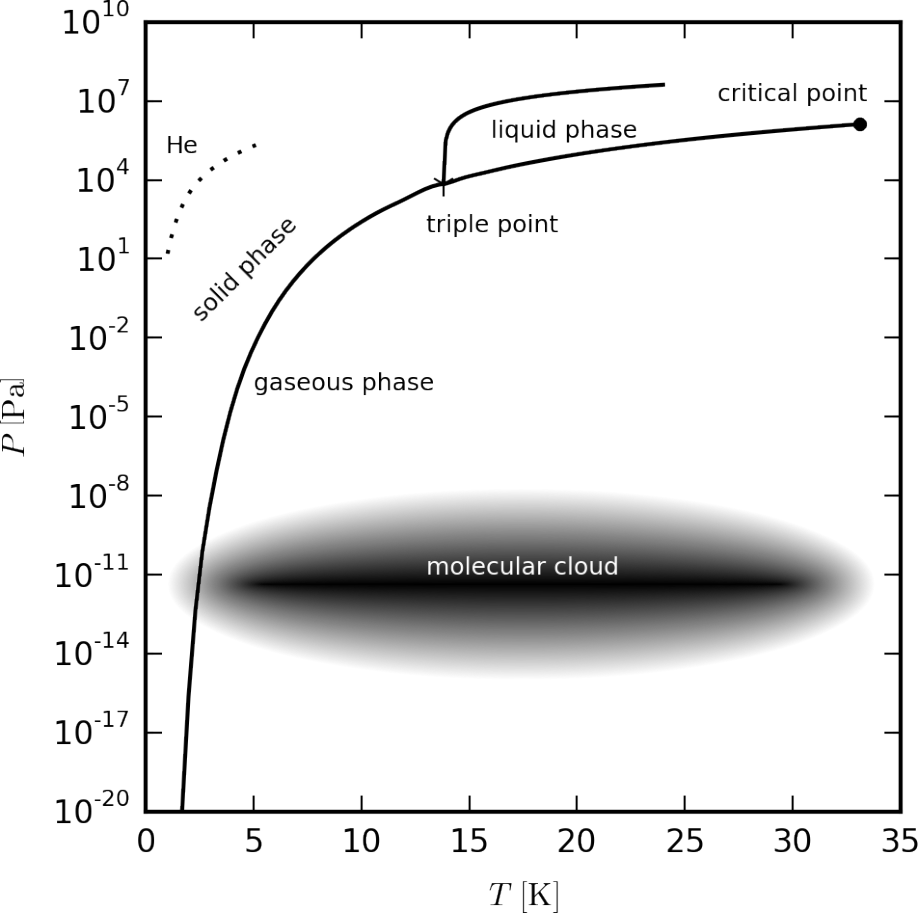
The condensation properties of H2 relevant for molecular cloud conditions are well known from laboratory data (Air Liquide 1976). The phase diagram (Fig. 1) shows the domain of pressure conventionally attributed to molecular clouds. One has to keep in mind, however, that since molecular clouds are highly structured (Pfenniger & Combes 1994), and commonly observed in a state of supersonic turbulence (Elmegreen & Scalo 2004), large fluctuations in density and temperature must occur.
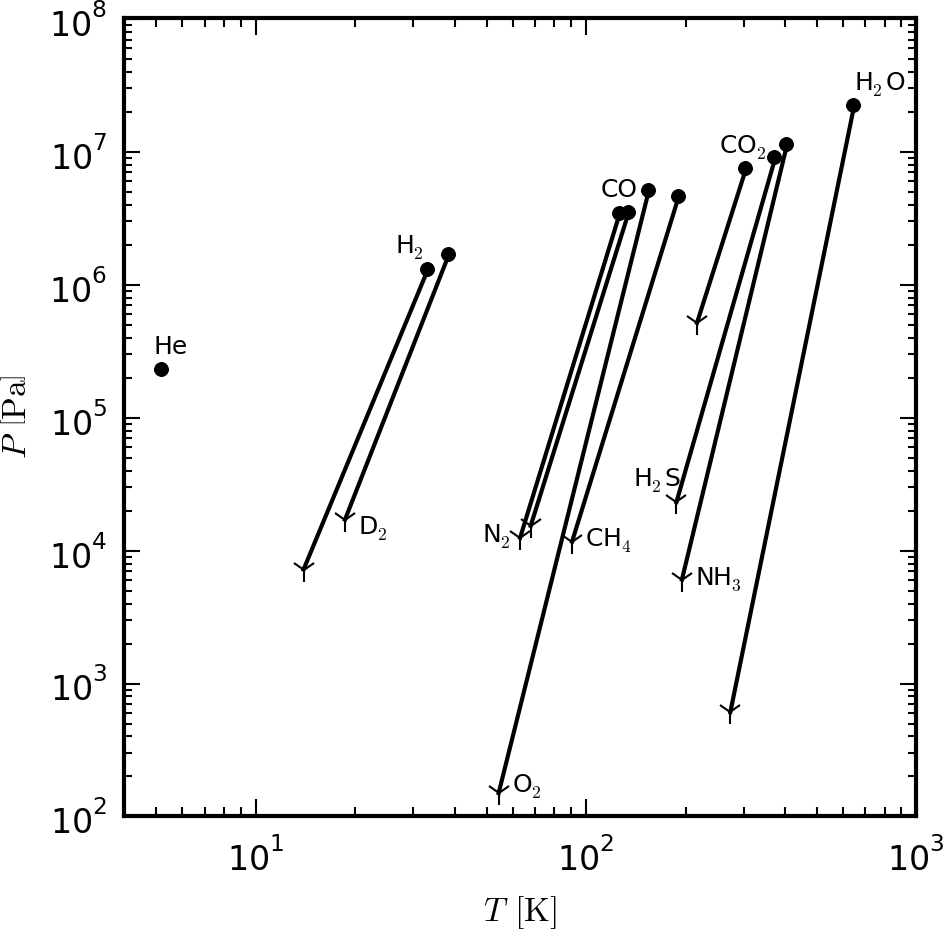
The presence of ice in the interstellar medium consisting of heavier molecules, such as H2O, CO, CO2 and NH3 covering dust grains, is nowadays well documented (Allamandola et al. 1999). Figure 2 shows the location of the critical and triple points of abundant molecules existing in the ISM. H2 ice has been detected in the absorption band at (Sandford & Allamandola 1993; Buch & Devlin 1994; Dissly et al. 1994), but the interpretation of this detection is that H2 is mixed within H2O-rich grains in conditions that are too warm to allow the bulk of H2 to condense (Kristensen et al. 2011).
High-resolution pictures of nearby planetary nebulae or remnants of supernova have shown the presence of substellar fragments (Walsh & Meaburn 1993). These very cold globules, or knots, each of the size of a few tens of AU, are at least as cold in the inner parts () as molecular clouds, but much smaller. An important feature is that the apparent column density in these knots increases inwards as long as the resolution allows, or until the knot is optically thin (Burkert & O’dell 1998). If these trends extend to the centre, one can expect there would be much higher density at colder conditions. It would be ideal to eventually reach a regime where H2 could condense in liquid or solid form, especially because at high column density the medium blocks UV radiation and cosmic ray heating.
At the level of molecular clouds, even though their average properties are well separated from the H2 phase transition, these are only static properties that ignore the highly dynamical nature of supersonic turbulence observed in the interstellar medium, where fluctuations must be large. Lower temperatures can be reached with fast adiabatic decompression alone. An example of fast decompression is displayed in the Boomerang Nebula, which reaches a temperature of only because of a fast expanding wind (Sahai & Nyman 1997). Thus, one should expect, to be coherent with supersonic turbulence, that regions of expansion and compression must be common in the ISM.
The fragmentation of self-gravitating gas leading to collapse has been studied for over a century. The molecular cloud is normally represented as a self-gravitating, one-phase fluid (i.e. pure gas), which is governed by the balance between gravity and gas pressure. The gravity of this fluid is directly proportional to its density, and the pressure to the adiabatic density derivative of the pressure, . It has been shown by Jeans (1902) that if a perturbation with a long enough wavelength is introduced into the system, this perturbation will grow exponentially. With growing perturbation, the pressure of the fluid will not be able to withstand its gravity anymore, which will ultimately lead to gravitational collapse.
The approximation of molecular clouds as a one-phase fluid is valid in many cases, but when considering very cold, high-density regions, it is an over-simplification. In these condition, H2 will start creating ice, which has to be taken into account (Walker 2013). The dynamics of this kind of fluid presenting a phase transition is different from a one-phase fluid, the most important difference being a very low value of (Johnston 2014). But, as is crucial for the stability of a fluid, a cold high-density fluid presenting a phase transition is therefore expected to be very unstable.
Based on the observation of substellar globules in planetary nebulas and the dynamics of fluids presenting a phase transition, we may expect the presence of small, substellar H2 ice fragments in molecular clouds due to the fragmentation of cold high-density regions. It is of great astronomical interest to study the nature of this substellar fragmentation, as the resulting bound objects may be too small to start nuclear fusion and, thanks to their very low temperature, are very difficult to detect. Some of the baryonic dark matter may actually consist of these fragments (Pfenniger & Combes 1994; Pfenniger et al. 1994).
In this article, we study the physics of a self-gravitating van der Waals fluid presenting a phase transition analytically and with simulations. In the analytic part (Sect. 2), the physics of a van der Waals fluid and the related Lennard-Jones (thereafter LJ) potential are recalled. We calculate the virial theorem taking both the gravitational and the LJ potential into account. The virial analysis helps to characterize different types of fluids. The stability of a self-gravitating van der Waals fluid presenting a phase transition is then analyzed.
In Sect. 3, the molecular dynamics simulator LAMMPS (Plimpton 1995) is introduced. By proper scaling of physical constants the Coulomb force solver is used to calculate the gravitational force, and the short rang molecular force is calculated with the LJ force. We introduce the concept of super-molecules to enable us to perform simulations with a total mass high enough for the fluid to be self-gravitating.
The simulations performed are discussed in Sect. 4. First, the correctness of the super-molecule approach is tested. Second, one-phase fluids (i.e. pure gas) are used to test the Jeans criterion. Third, simulations close to a phase transitions are performed, studying the properties of non-gravitating fluids and fluids with a gravitational potential above and below the Jeans criterion.
2 Physics of a fluid presenting a phase transition
In this section, we describe the physics of a self-gravitating fluid presenting a phase transition.
2.1 van der Waals equation
The van der Waals equation is a classical equation of state (EOS) of a pure fluid presenting a first order phase transition. This EOS describes the macroscopic behaviour of a fluid in which at microscopic level the molecules are strongly repulsive at short distances and beyond that weakly attractive over a limited range.
The van der Waals equation (van der Waals 1910; Johnston 2014) is a modification of the ideal-gas law, taking the finite size of molecules and intermolecular interactions into account. It links pressure, density, and temperature as follows:
| (1) |
with and being constants characteristic of the fluid. It can also be expressed in a reduced, dimensionless form as,
| (2) |
where , , and . The parameters , and are the values of the thermodynamic critical point (Kondepudi & Prigogine 1998; Carey 1999).
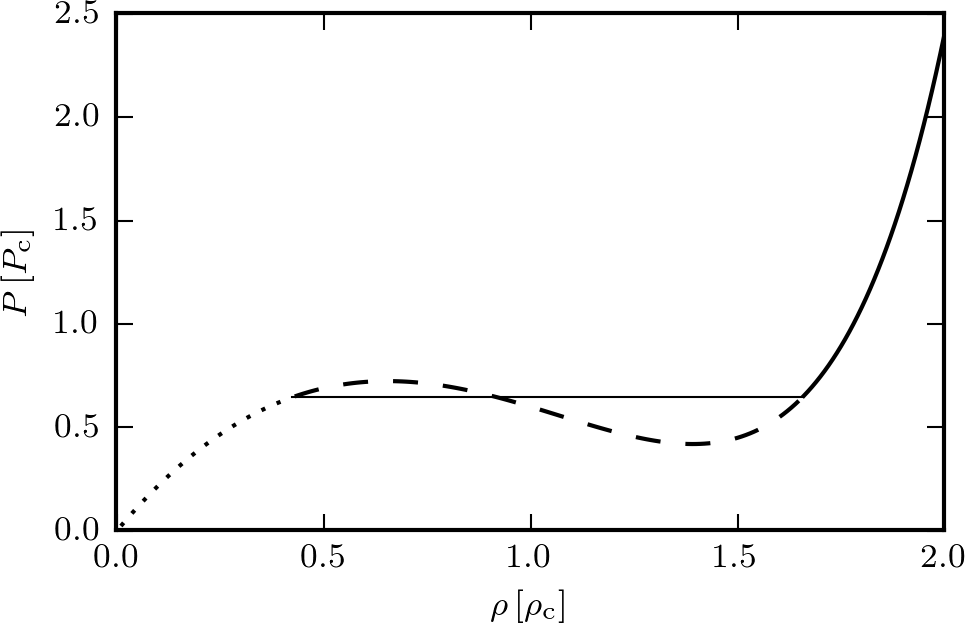
Figure 3 shows the phase diagram for a fluid with . One can distinguish the gaseous phase (dotted line) and the solid phase (solid line); in between (dashed line), the fluid presents a phase transition. There are states where , which is thermodynamically unstable. The parts of the dashed curve where are metastable because a lower entropy state is reached when the fluid splits into condensed and gaseous components. The fraction of condensed over gaseous phase grows from 0 to 1 from left to right.
When the two phases coexist, the van der Waals EOS is replaced by a constant pressure marked by a horizontal line. This constant pressure level is determined by the Maxwell “equal area” construct (Clerk-Maxwell 1875), demanding a total zero work for an adiabatic cycle between the fully gaseous to the fully condensed state.
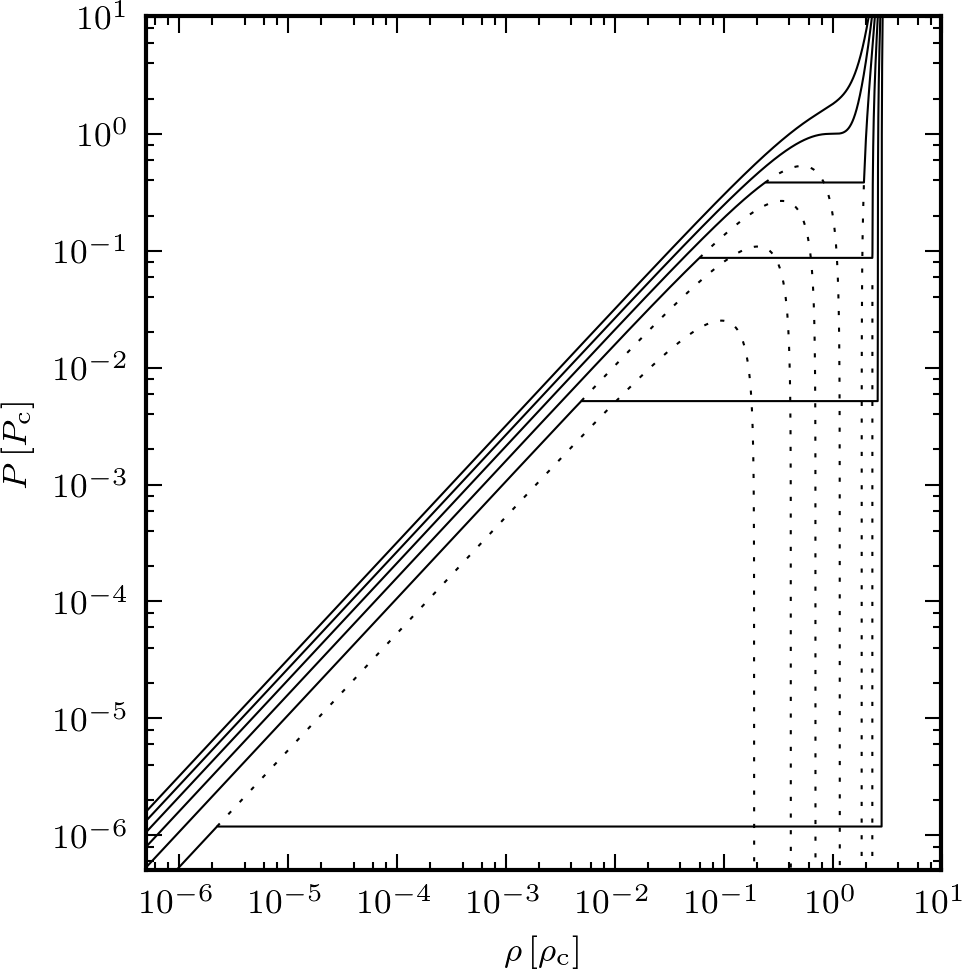
Figure 4 shows the phase diagrams for fluids with a temperature from to . The dotted line shows the original van der Waals EOS whereas the solid line displays the modified law using the Maxwell construct. There is no Maxwell construct for as is always . Lekner (1982) provides a parametric solution to the van der Waals and Maxwell construct, using as variable.
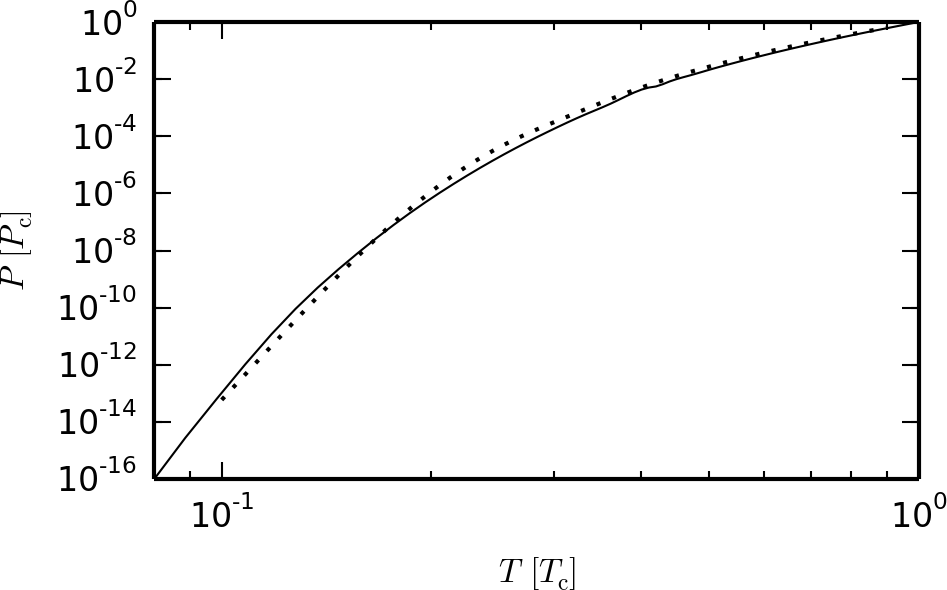
The phase equilibrium pressure is almost identical with the coexistence curve of laboratory data for H2 over a wide range of pressure (Fig. 5).
2.1.1 Lennard-Jones forces
The van der Waals model of phase transition fluid is convenient for a continuum fluid description, but fails to represent all the phenomena around the phase transition, which is the reason for correcting it with the above mentioned Maxwell construct. Even with the Maxwell construct, however, a local thermal equilibrium is still supposed to hold. In astrophysical contexts, often even these assumptions cannot be granted. For instance, in supersonic turbulent situations, ubiquitous in the interstellar medium, thermal equilibrium cannot be satisfied since mechanical energy propagates faster than thermal energy through pressure. Thus any method using quantities, like temperature or pressure, implicitly assumes that a local thermal equilibrium is established, which makes their use in the supersonic turbulent regime uncertain.
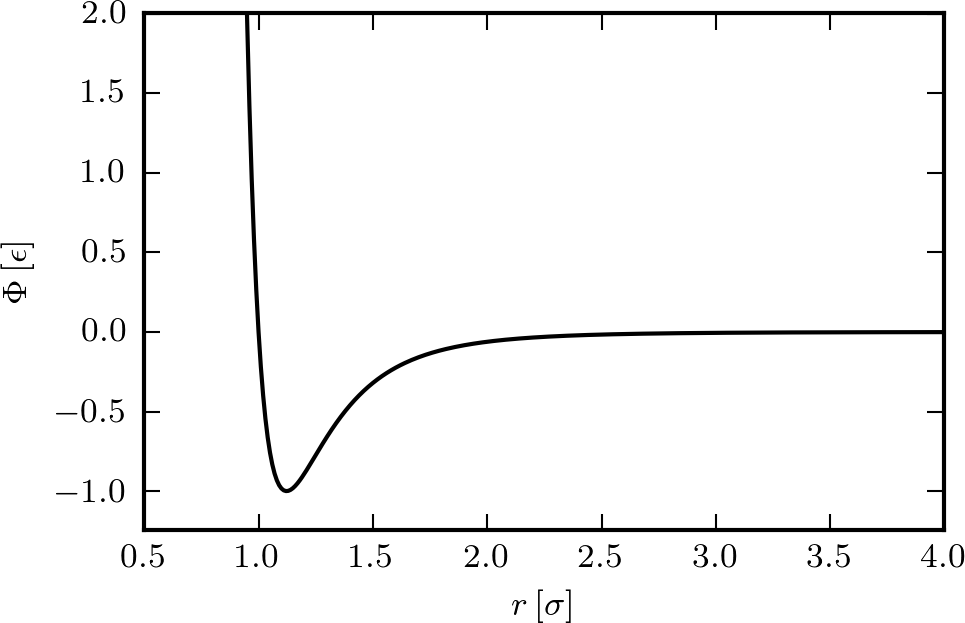
A much less demanding model of fluid is provided by molecular dynamics, where the simplest molecule interactions close to the van der Waals model in equilibrium situations is provided by the Lennard-Jones (LJ) intermolecular potential (Jones 1924). No local or global thermal equilibirum is required. The LJ potential consists of an attractive long-range term and a repulsive short-range term (Fig. 6),
| (3) |
with . Its minimum value, located at , is .
2.2 Virial theorem for a Lennard-Jones gravitating fluid
2.2.1 Lagrange-Jacobi identity
The virial theorem (Clausius 1870) describes the statistical equilibrium of a system of interacting particles or fluid systems, relating the kinetic and potential energies. In the case of a self-gravitating LJ fluid, the LJ potential and gravity combine as a total potential .
The virial theorem for this new potential can be derived using the Lagrange-Jacobi identity path, by taking the second time derivative of the moment of the polar inertia , we find,
| (4) |
where the first right-hand term is twice the kinetic energy , and the second one is the virial term. For a system near a statistical equilibrium, both sides of this equation should oscillate around 0, so the respective time averages should vanish.
The LJ potential is a sum of two homogeneous functions aaaBy definition, a homogeneous function of degree satisfies . of degree and respectively, while gravity is of degree . So we can use Euler’s theorem of homogeneous functions to express the virial term as a sum of potential energies multiplied by minus the homogeneous degree. The Lagrange-Jacobi identity becomes
| (5) |
2.2.2 Homogeneous sphere
For homogeneous, finite mass spheres at a given temperature, the individual terms of the Lagrange-Jacobi identity read,
| (6) | |||||
| (7) | |||||
| (8) | |||||
| (9) |
where the constants and in the LJ terms have been calculated by straight summation over the nearest molecules, as given in Table 1 for both the simple cubic (SC) and hexagonal close packed (HCP) or face-centred cubic (FCC) lattices.
| Lattice | ||
|---|---|---|
| SC | ||
| HCP/FCC |
The virial equation, obtained by setting in the Lagrange-Jacobi identity, contains terms proportional to except the gravity term, which is proportional to . Dividing the equation by we can separate , yielding,
| (10) |
which is indeed positive if the sum of the terms inside the brackets are also positive. However the term proportional to is negative, and when large introduces the possibility that no positive solution for exists. Solving the bracket terms equal to zero for , we have then a quadratic equation for this term, which gives the solutions for the densities for which vanishes,
| (11) |
The and solutions are real non-negative when the term inside the square root above is non-negative. The maximum temperature at which can vanish is thus,
| (12) |
Since the critical temperature for a phase transition in the absence of gravity is about , we see that can be substantially larger than the critical temperature. With the values given in Table 1 for the constants and , the maximum temperature below which gravity combined with molecular forces enhances fragmentation are and for the SC and HCP/FCC lattices, respectively, which are and larger than .
The corresponding density at which fragmentation can occur at arbitrarily small mass is
| (13) |
which is of the order of the individual molecule density .
The Lagrange-Jacobi identity therefore allows us to predict a density and a maximum temperature below which a homogeneous sphere made of LJ molecules can find a gravitational equilibrium at an arbitrarily small mass: in a way, this provides a simple model, an explanation, for the reason of forming substellar ice clumps out of a cold self-gravitating gas. For H2 molecules arranged as SC or HCP/FCC lattice, we find and , respectively. These densities are of the order or slightly below the solid or liquid H2 density ().
At temperatures the isothermal equilibrium curves have a minimum mass when , which is expressed as
| (14) |
where and
| (15) |
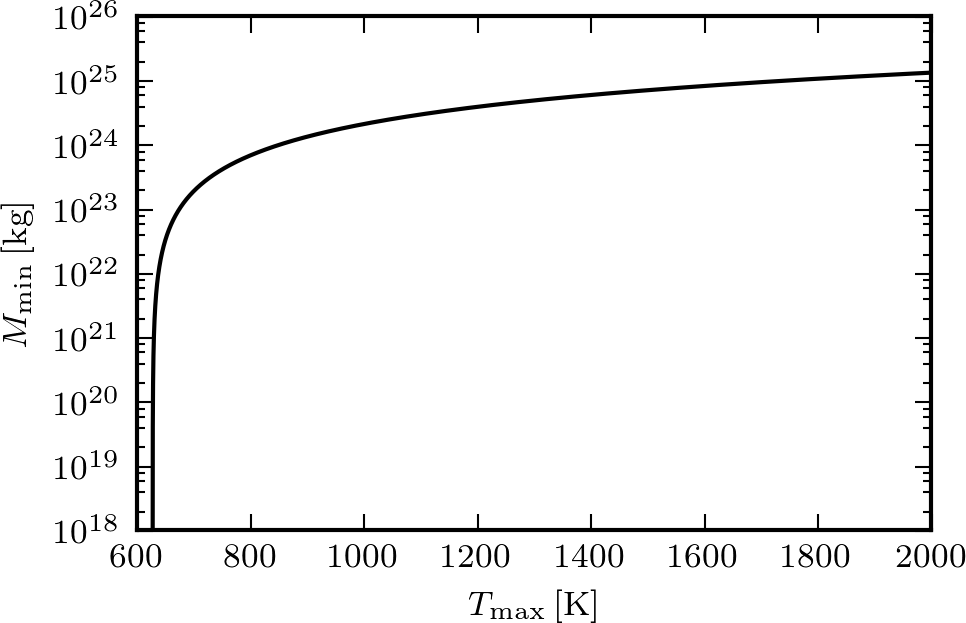
Figure 7 shows the minimum mass as a function of the temperature for HCP/FCC H2 homogeneous spheres. It is rising very steeply at , but rising much slower after . Interestingly the mass range includes all the masses below terrestrial planet masses for temperatures below H2 dissociation.
2.2.3 Condensed bodies
Different condensed and uncondensed bodies can be identified using the Lagrange-Jacobi identity, as summarized in Table 2.
| Dominating Terms | Name |
|---|---|
| “molecular gas” | |
| “comet” | |
| “rocky planetoid” | |
| “gaseous planetoid” |
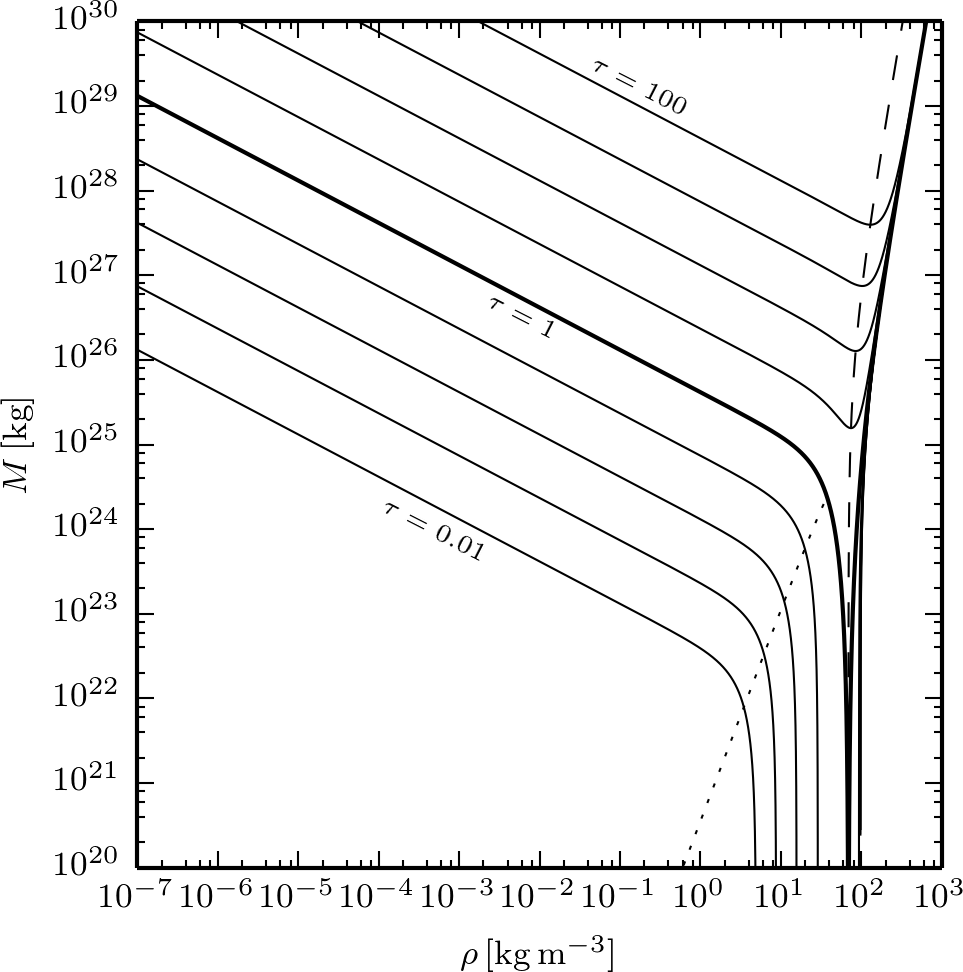
Figure 8 shows some equilibrium curves of gravitating homogeneous sphere whose molecules are arranged on a HCP/FCC lattice, which is able to represent the most compact sphere lattice at high density. At low density, on the left of the diagram, the equilibrium is principally fixed by the attractive part of molecules and their temperature, and the exact lattice structure is irrelevant. This is the domain of uncondensed “molecular gas”.
On the right, there is an accumulation curve at approximately representing purely condensed H2 bodies mainly balancing gravity with the repulsive part of the molecular interaction. The area between the dashed line, connecting the minimum of the isotherms with , and the accumulation curve is the domain of “rocky planetoids”.
At temperatures below , the equilibrium curves plunge to arbitrarily small masses along two regimes: the left vertical asymptotes represent the limit gaseous bodies, and the right asymptotes the condensed (solid or liquid) bodies called “comets”. The area of the “comets” lies between the dotted line, connecting the elbows of the isotherms with , and the dashed line.
At high temperature and low density, to the left of both the dotted and dashed line and above the isotherm lines, lie the “gaseous planetoids”. These bodies’ equilibrium is fixed principally by gravity and temperature.
Of course real astrophysical bodies are not homogeneous, in practice in the small mass regime one can expect bodies made of a mixture of condensed state in the core surrounded by a less dense gaseous atmosphere, which could be calculated by solving the hydrostatic equilibrium, see Pfenniger (2004), where some models of isothermal bodies made of H2 containing a solid core and a gaseous atmosphere have been discussed.
2.3 Gravitational instability
The linearized wave equation for the isentropic density perturbation of a self-gravitating fluid of density is the following (Jeans 1902; Weinberg 1972):
| (16) |
Its solution is a superposition of modes of the form , where is the frequency and the wavenumber, and where is the wavelength. This leads to the instability condition (Jeans 1902),
| (17) |
When fulfilled the modes are real-exponential, therefore unstable. The classical Jeans criterion reads,
| (18) |
Therefore the effective gravitational instability is directly dependent on the EOS of the medium.
2.3.1 Ideal gas
In most textbooks about Jeans instability only the ideal gas is discussed. In the case of an ideal monoatomic gas, the pressure derivative term is
| (19) |
with the adiabatic index . This value is always positive, which leads to the classical, ideal monoatomic gas Jeans criterion for instability,
| (20) |
2.3.2 Fluid with phase transition
When considering a fluid presenting a phase transition the term may differ from that of an ideal gas. As seen before, in the case of the van der Waals EOS, the Maxwell construct must be used, which may considerably change the combined stability of the fluid (Sect. 2.1). In the presence of a phase transition, the EOS gradient is strongly modified, in particular . Using
| (21) |
with and both finite values, we find . Therefore, a self-gravitating fluid in a phase transition is also automatically gravitationally unstable.
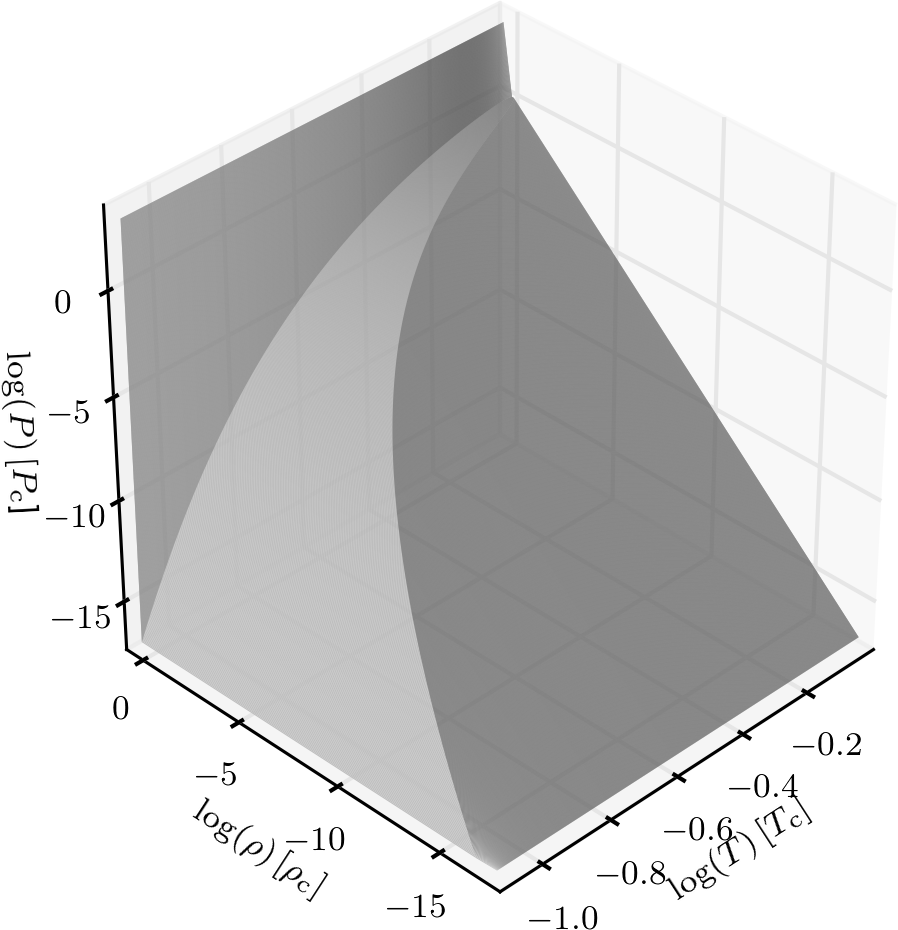
Figure 9 shows the 3D representation of the EOS including the Maxwell construct. Clearly the curved triangular region, the phase transition region (on the left) has a very different gradient than the almost ideal-gas region at low density and high temperature, or the condensed phase region at high density. It is remarkable that a temperature drop by one order of magnitude from the critical temperature leads to a drop in the critical pressure by 14 orders of magnitude. For example for H2 at 3 K the critical pressure is .
3 Molecular dynamics
For all simulations, the Large-Scale Atomic/Molecular Massively Parallel Simulator (LAMMPS) is used (Plimpton 1995). The LAMMPS software is a state of the art and widely used single and multi-processor code in chemistry, material sciences, and related fields. Its abilities to quickly compute short and long-range forces and the possibility to use a multi-timescale integrator make it a suitable tool to perform our simulations.
3.1 Potential Solver
The LAMMPS code has a wide range of force fields. For the simulations in this article we use only the LJ and self-gravitational potentials.
Since the straight calculation cost for exact pairwise interactions is , approximate but still accurate methods are implemented that make the calculations possible at a much lower cost. A cut-off radius is used for the short-range forces. As the attractive part of the LJ potential drops with , it is calculated only for neighbour particles within . The neighbours for each particle are found using a Verlet neighbour list. This list is created with a radius of , being an extra “skin” distance to avoid the recalculation of the Verlet list at every time-step. This cut-off method is and therefore linearly scales with the number of particles.
The gravitational potential drops with so the long range interactions cannot be ignored. It is calculated using the Particle3-Mesh (P3M) method (Hockney & Eastwood 1981). The gravitational potential is split in short-range and long-range parts in Fourier space (Ewald 1921):
| (22) |
where is the splitting distance. The potential is calculated at the same time as the LJ potential, using the same Verlet list. The potential is calculated in Fourier space using a fast Fourier transform (FFT).
As LAMMPS is designed for the simulation of chemical substances not far from terrestrial conditions, and self-gravity is too weak to be of any influence, no specific self-gravity module is provided. For that reason, a tweak is used by using the Coulomb’s potential module for an electric field,
| (23) |
where is the interaction constant, the dielectric constant, and the charges of the molecules. As is fixed in LAMMPS, to correctly calculate the gravitational potential we set the constants as follows:
| (24) | |||||
| (25) |
3.2 Time integration
The time integration is done using the symplectic leapfrog scheme. The drift and kick operators,
| (26) | |||||
| (27) |
are applied according to the sequence at each elementary time-step. For short-range force, the time-step is constant throughout the simulation and set as – , which is the typical interaction timescale during nearest-neighbour molecular interactions. This is reasonable since the repulsive interaction and the finite kinetic energy prevent strongly varying accelerations between particles.
Small changes of individual particle positions can significantly change the short-range forces, which is why a very small time-step is required. But these small changes have almost no influence on long-range forces. For this reason, there is no need to calculate the long-range forces at every time-step.
In regard to short-range calculations, long-range calculations are an order of magnitude more costly per step but always need the same amount of calculation time: creation of the density-map with a fifth order interpolation procedure, a FFT solution of the potential, and the same interpolation procedure for finding the accelerations.
With the “reversible reference system propagator algorithm” (rRESPA), a multiple timescale integrator is available for LAMMPS that enables us to reduce the number of long-range force calculation (Tuckerman et al. 1992). It enables time integration in up to four hierarchical levels, but only two are needed for the simulations we present. The rRESPA time-integration-scheme looks as follows:
| (28) |
where is the number of short-range iterations and set as – , is the kick operator using the long-range (FFT) accelerations, and the kick operator using the short-range accelerations.
3.3 Super-molecules
The maximum number of particles that can be simulated on today’s supercomputers is of the order of – particles. Even using such a huge number of molecules would only result in a fluid with a total mass of a few femtograms. It is obvious that gravity has no effect on this kind of fluid. For that reason, the concept of super-molecules is introduced. This concept is well established in galactic dynamics simulation, where super-stars weigh typically , and in cosmology where super-WIMPS may weigh as much as GeV particles. Two-body relaxation or diffusion due to the low number of super-particles is negligible, provided the simulation time is not too large, depending on the specific problem. Practice has shown that this kind of an approximation is valid in galactic dynamics for instance if the simulation length is of order 100 dynamical times (Binney & Tremaine 2008).
The basic principle of the concept is that each super-molecule consists of molecules, and its mass is therefore,
| (29) |
To have the same properties of a super-molecule fluid as for a normal fluid, every term of the virial Equ. (5) has to be transformed such that the ratios of the terms are invariant. The kinetic energy term reads
| (30) |
Since the total mass is constant, , the velocity dispersion of molecules and super-molecules is also the same,
| (31) |
From the two LJ terms, Equ. (7–8) remain the same if
| (32) | |||||
| (33) |
Solving these two equations and using Equ. (29), we derive
| (34) | |||||
| (35) |
The gravitational energy Equ. (9) does not change since it does not depend on super-molecule properties.
It is important to ensure that the gravitational force between two super-molecules remains small compared to the corresponding LJ force within the short-range force cut-off radius. This is assured by setting with being the cut-off radius. This leads to the following constraint:
| (36) |
where . Using a cut-off radius of and hydrogen super-molecules, we find a maximum super-molecule mass equal to , meaning at least particles are required for simulating an Earth-mass, virialized, H2-condensed body.
3.4 Ice clump detection
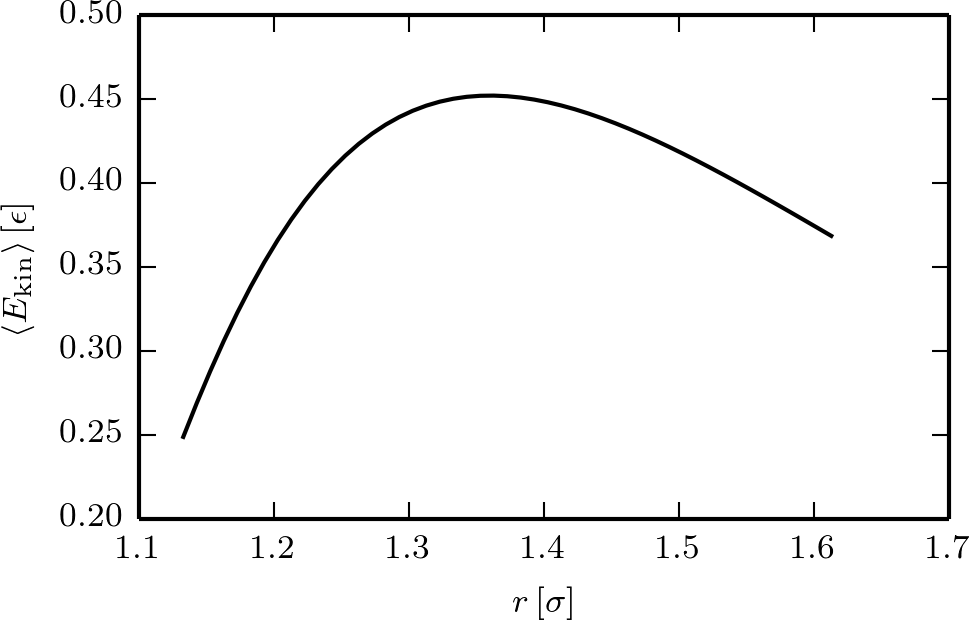
The LJ potential has its minimum at . If an ice clump is at absolute zero temperature, all bound molecules would have this distance from at least one other molecule. But, as the molecules in a clump are vibrating, the maximum binding distance between two molecules is generally larger than .
The simplest clump consists of two molecules. Their mean kinetic energy as a function of the maximum displacement can be calculated numerically (Fig. 10).
The mean kinetic energy rises up to the maximum value of , after which it drops again. It can be assumed that all stable clumps have a binding distance below this value. The distance constraint for two molecules to be bound is therefore:
| (37) |
Using as the threshold distance, LAMMPS provides a list of clumps at fixed time intervals.
4 Simulations
| Name | |||
| SM15 | – | ||
| SM30 | – | ||
| SM60 | – | ||
| SM04 | – | ||
| SM06 | – | ||
| SFa𝑎aa𝑎aExternal gravity | – |
| Name | ||||
|---|---|---|---|---|
| OP0 | ||||
| OPGw | ||||
| OPGs | – |
| Name | ||||
|---|---|---|---|---|
| OPGs | – | , , | ||
| PT1-1 | , | , , | ||
| PT2-1 | , | , , | ||
| PT3-1 | , | , , | ||
| PT1-2 | , | , , | ||
| PT2-2 | – | , , | ||
| PT3-2 | – | , , | ||
| PT5-2 | , | , , | ||
| PT7-2 | , | , , | ||
| PT9-2 | , | , , | ||
| PT1-3 | , | , , | ||
| PT2-3 | , | , , | ||
| PT3-3 | , | , , |
4.1 Units
A fluid is defined by the number of super-molecules , the initial velocity distribution (temperature), the number density, and the strength of the gravitational potential. All simulation properties are molecule-independent, the initial temperature and density are measured as a factor of the critical values and , and the gravitational potential is measured as the factor of the ideal-gas Jeans gravity , defined as
| (38) |
with the box side . It is interesting to note that is proportional to temperature and inversely proportional to density. For all simulations, the time unit is defined as the average time of a particle crossing the box
| (39) |
with .
The distance at which the gravitational and LJ forces are equal is denoted as
| (40) |
4.2 Super-molecule concept tests
4.2.1 Potential energy
(a) See Table 5
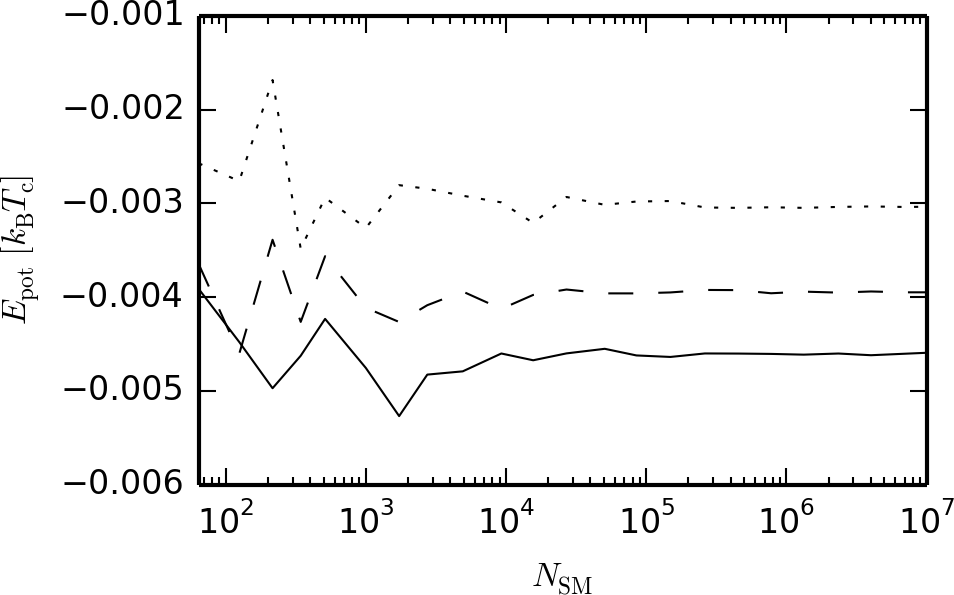
A fluid in a cubic box with periodic boundary conditions and initial constant density of is simulated with LAMMPS. Three different initial Maxwellian velocity distributions with temperature , and , and a number of particles from – are used. Table 5 shows the parameters of the different simulations.
Figure 11 shows the LJ potential energy of those three fluids with respect to the number of super-molecules. One can see fluctuations in the simulations with low , but the result becomes reasonable when and a satisfactory convergence is obtained if . Therefore all the subsequent simulations are performed with .
4.2.2 Cluster percentage
(a) See Table 5
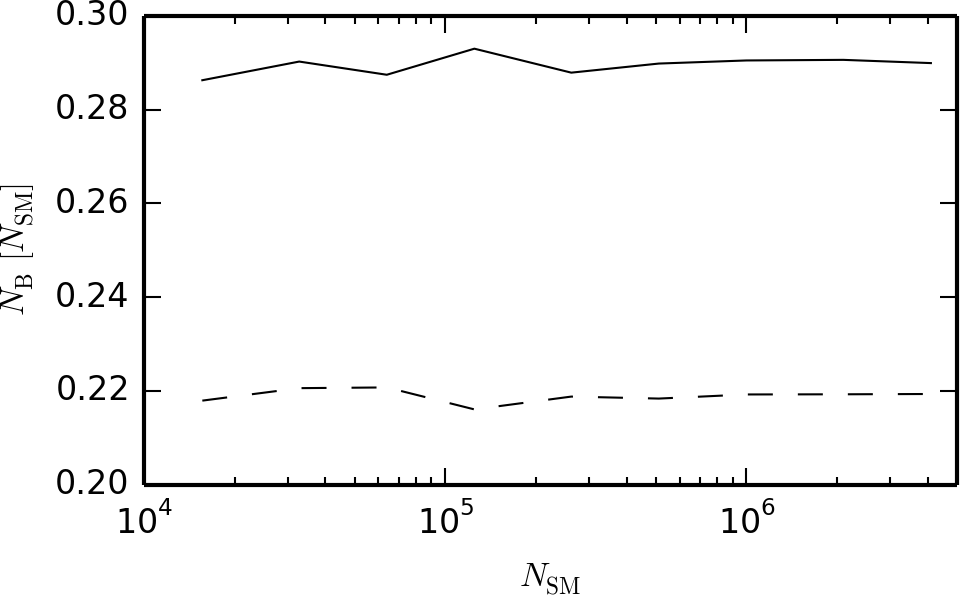
High density, low temperature fluids are simulated during at various number of super-molecules. These fluids will form “comets” and allow us to compare the final percentage of bound molecules. Table 5 shows the parameters of the different simulations.
Figure 12 shows the fraction of bound molecules with respect to the number of super-molecules. All simulations reach the same percentage, independent of the number of super-molecules.
4.2.3 Precipitation in an external field
(a) See Table 5
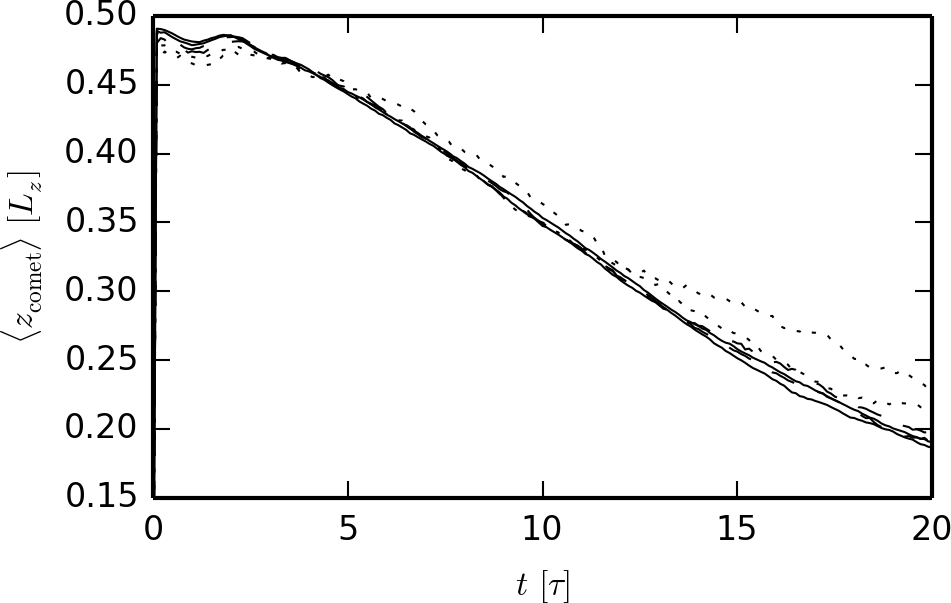
An external acceleration is applied in the direction to a fluid within a box with reflecting boundary conditions. The fluid is very cold and rather dense (see Table 5) and is therefore forming ice grains, or “comets”. Because of acceleration and Archimedes’s principle, the “comets” fall to the bottom and stay there, similar to snowfall on Earth.
The purpose of this simulation is to test the timescaling of the precipitation as function of the number of particles. Figure 13 shows the coordinate of the centre of mass of “comets” as a function of time. The curves are very similar, with a slight over-estimation of the collapse time for the smallest simulation. Therefore the precipitation phenomenon timescale is not strongly dependent on the mass resolution.
4.3 Fluid with perturbation
To illustrate the behaviour of a homogeneous fluid perturbed by a plane sinusoidal wave, a velocity perturbation in the direction is introduced with wavelength equal to the box side . Starting with a Maxwellian distribution of velocities for the homogeneous unperturbed case, the -component of the velocities is perturbed in such a way as to conserve energy. The perturbed -velocity component for each particle reads,
| (41) |
with . The correction factor is used to keep the same kinetic energy in the direction, with
| (42) |
determines the strength of the perturbation, but is supposed to be small enough to be in the linear regime of perturbations. In the present simulations, .
4.4 One-phase fluid
To study the reaction of a pure one-phase ideal-gas fluid far from the phase transition but with the above plane-wave perturbation, the initial temperature is taken above the critical value () and the initial density well below the critical value (). Three different cases are studied: without gravity, weakly self-gravitating below the classical ideal-gas Jeans criterion with , and sufficiently self-gravitating above the ideal-gas Jeans criterion with . The simulations are performed with ranging from to . Table 5 shows the parameters of the different simulations.
4.4.1 Time evolution

(a) See Table 5
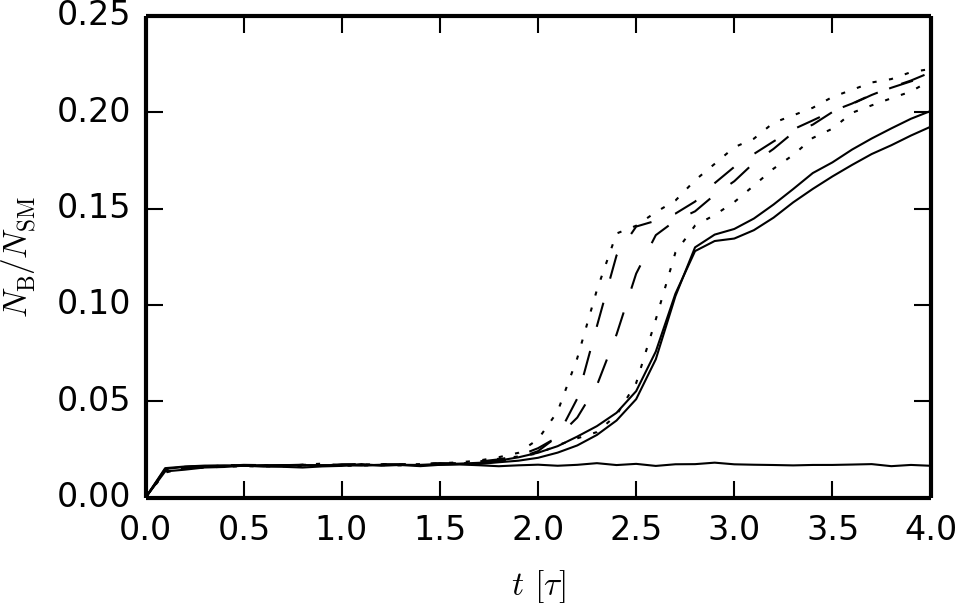
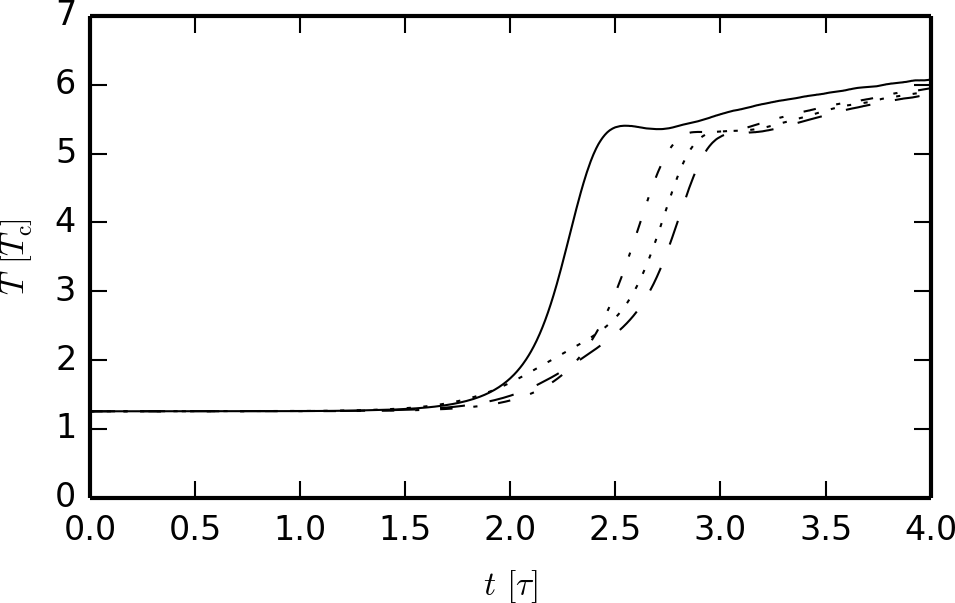

As the simulations conserve total energy, the formation of “comets”, implying a decrease of potential energy, can be measured by the mean temperature (i.e., kinetic energy) of the system. This is equivalent to the release of latent heat when a gaseous fluid condenses.
Figures 14 and 15 display the temperature and the “comet” percentage evolutions of the one-phase fluid simulations: OP0 without gravity and super-molecules and the sufficiently self-gravitating fluid OPGs with ranging from to . The weakly self-gravitating fluid of simulation OPGw is not shown since it is identical to the no gravity case OP0.
For the fluid without gravity OP0 and the weakly self-gravitating fluid OPGw, no particular effect is observed. The percentage of “comets” rises to , which can be attributed to the initial fluctuations in the distribution. The small perturbation introduced in the -direction does not change the nature of the fluid; its temperature and “comet” percentage remains the same.
The sufficiently self-gravitating OPGs fluids, on the other hand, do change. Their temperatures and cluster percentages are rising steeply showing a substantial latent heat release. All simulations reach the same asymptotic temperature , but different initial conditions (i.e., random seeds) yield slightly different behaviours during the collapse. This can also be observed in Fig. 16 where four identical parameter simulations but different random seeds are run with , leading to a time difference of for reaching the asymptotic upper value.
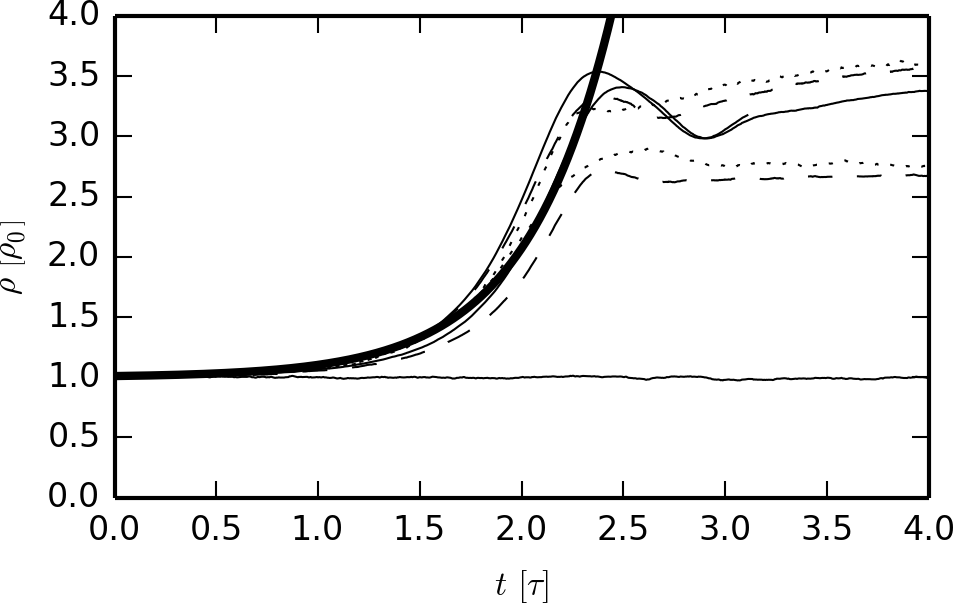
Figure 17 shows the density increase around the centre of the perturbation in the range and compares them to the analytic solution for an ideal gas. The simulations follow the ideal-gas solution with a slight dispersion up to , where a density rise is not possible anymore because of the repulsive LJ force; the density declines for a short while because of the collapse rebound down to a minimum at . This density local minimum corresponds with the break in the temperature increase visible in Fig. 14. Subsequently, the temperature growth is much slower.
Figure 18 shows the evolution of density in the simulations, and the predicted growth rate line for an ideal gas subject to Jeans’ instability (Sect. 2.3). All curve slopes correspond initially to the predicted Jeans’ growth rate. The initial steep growth and the small time delay are caused by the initial noise in the particle distribution. Thus, a certain time is needed for the perturbation to overcome the noise.
4.4.2 “Comet” mass distribution
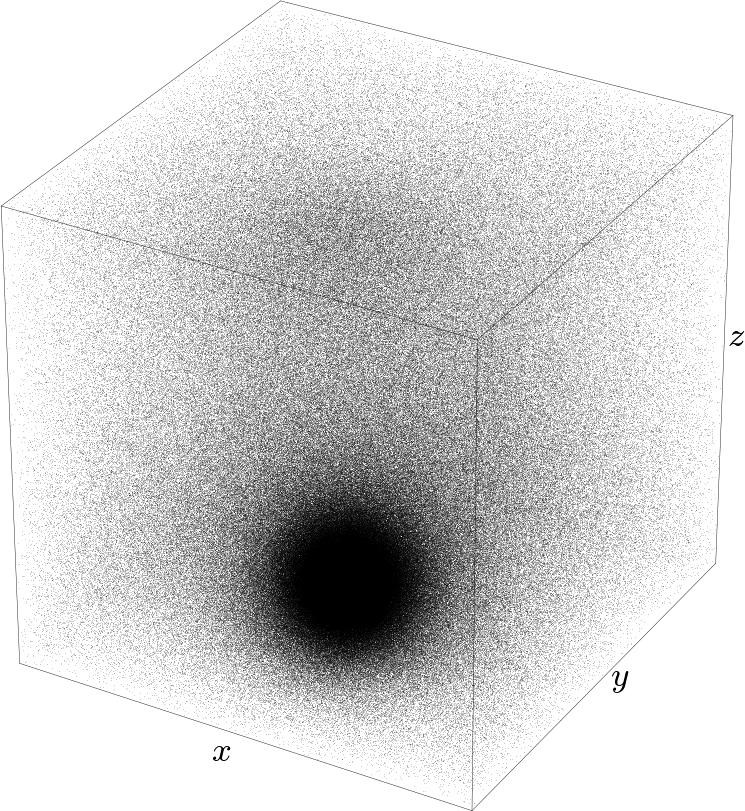
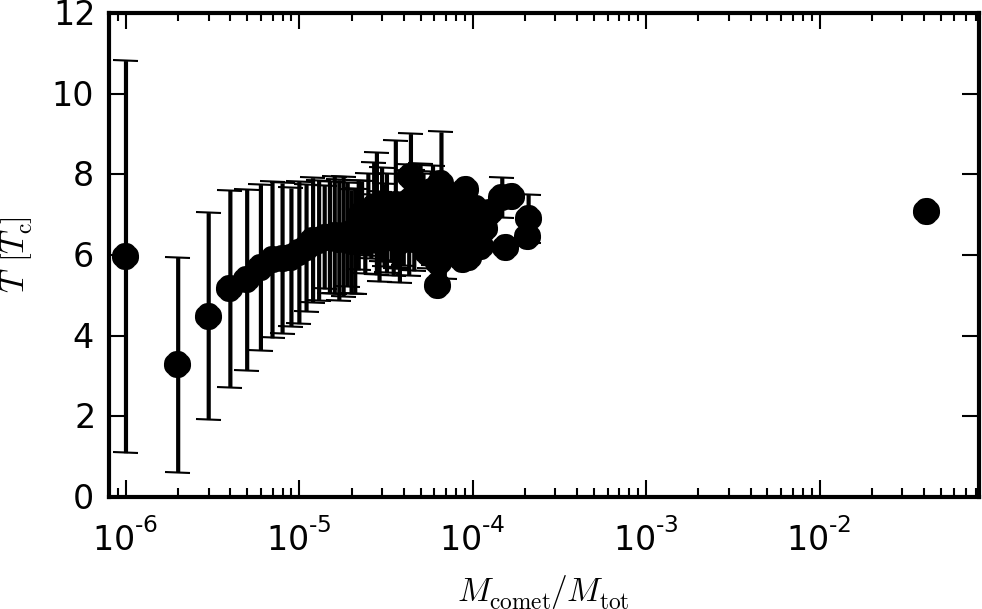
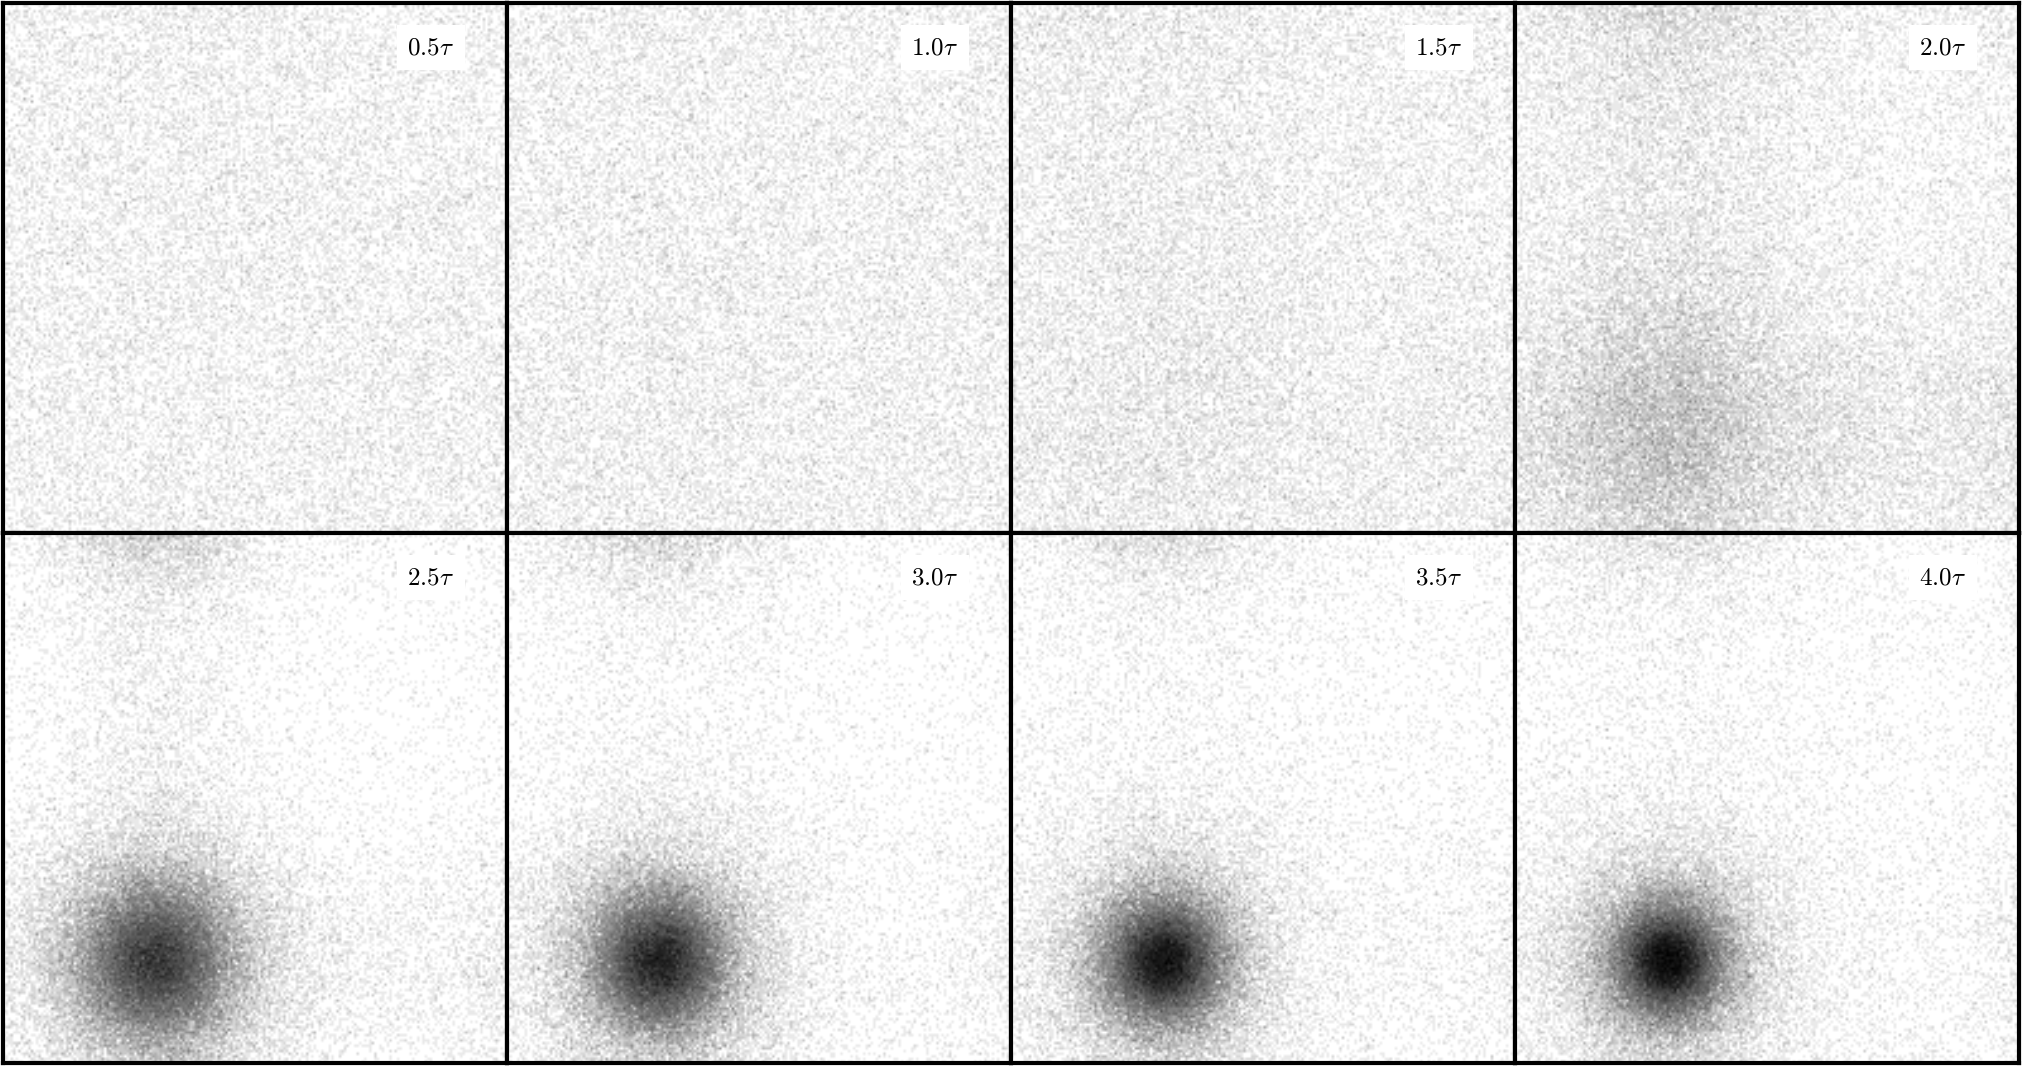
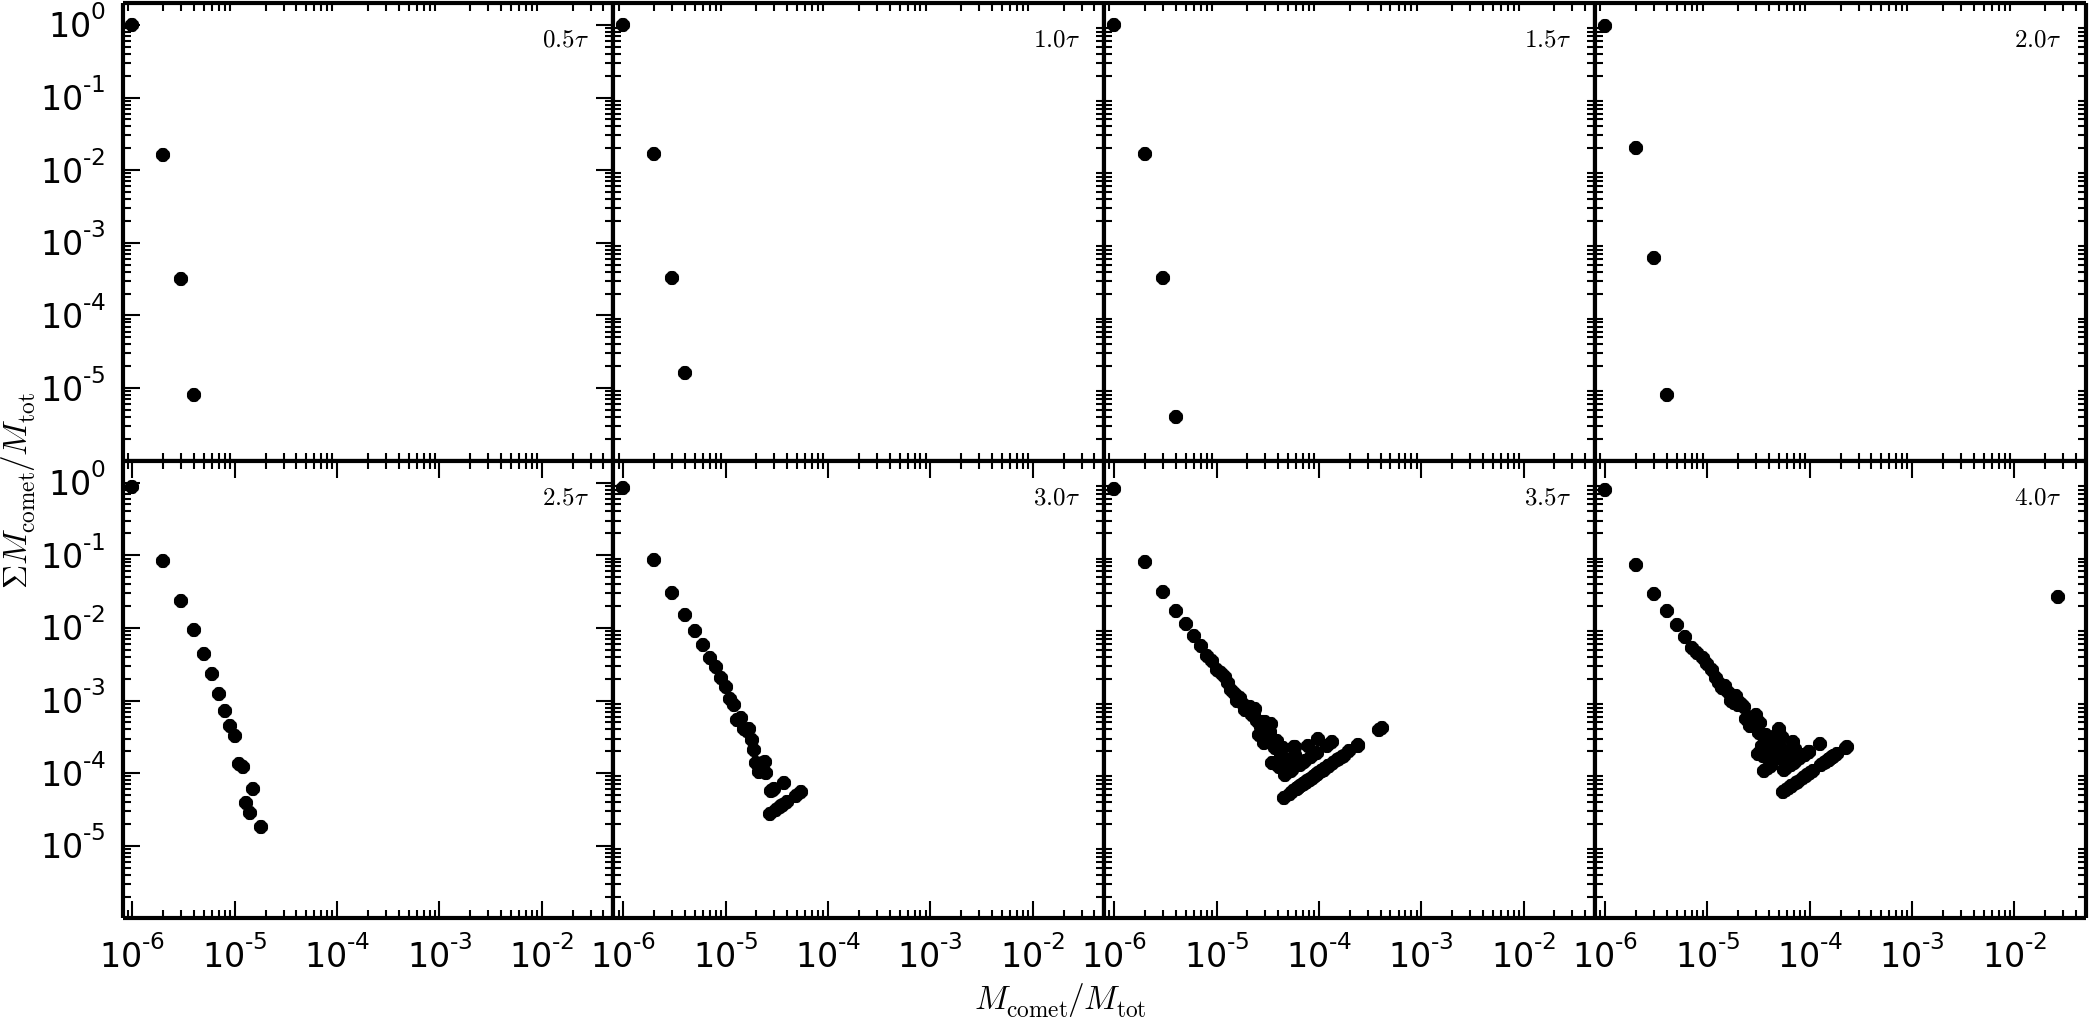
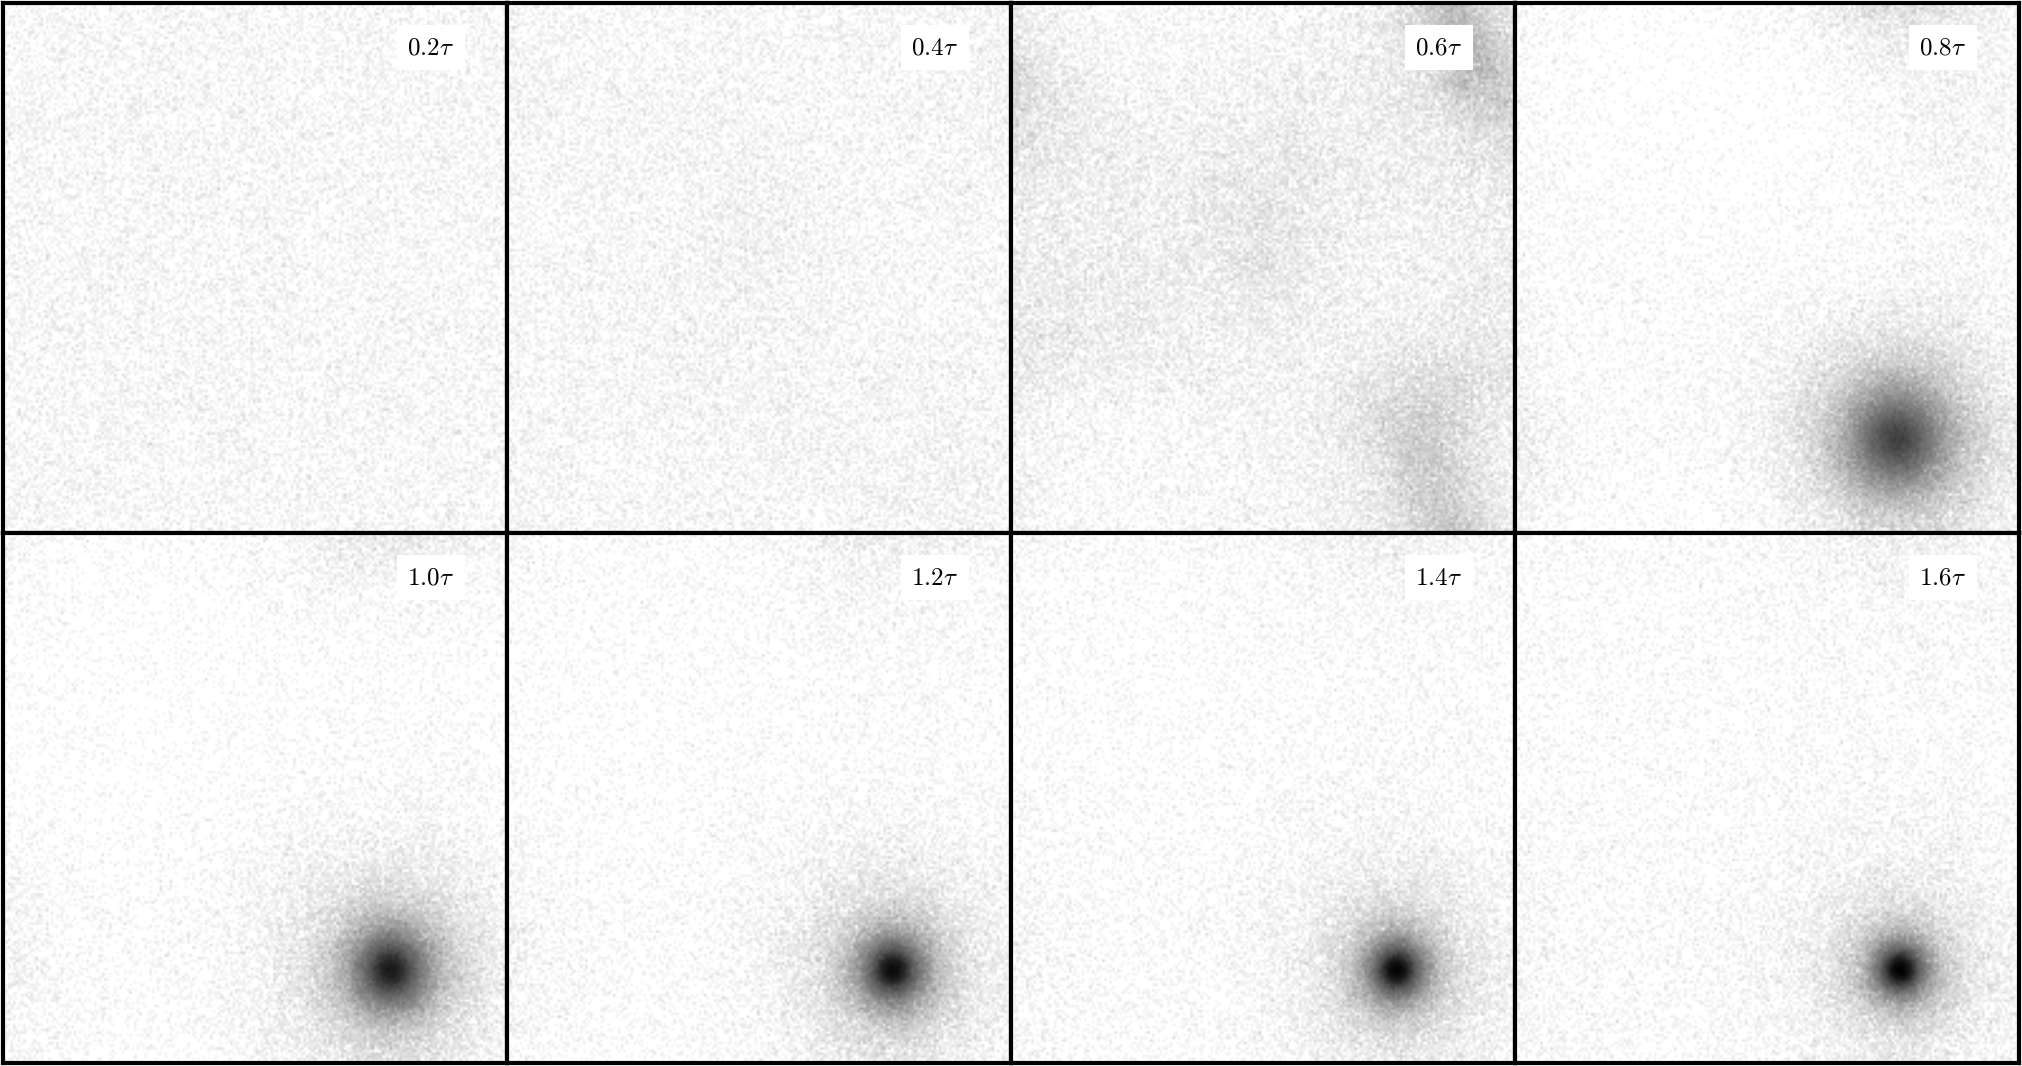
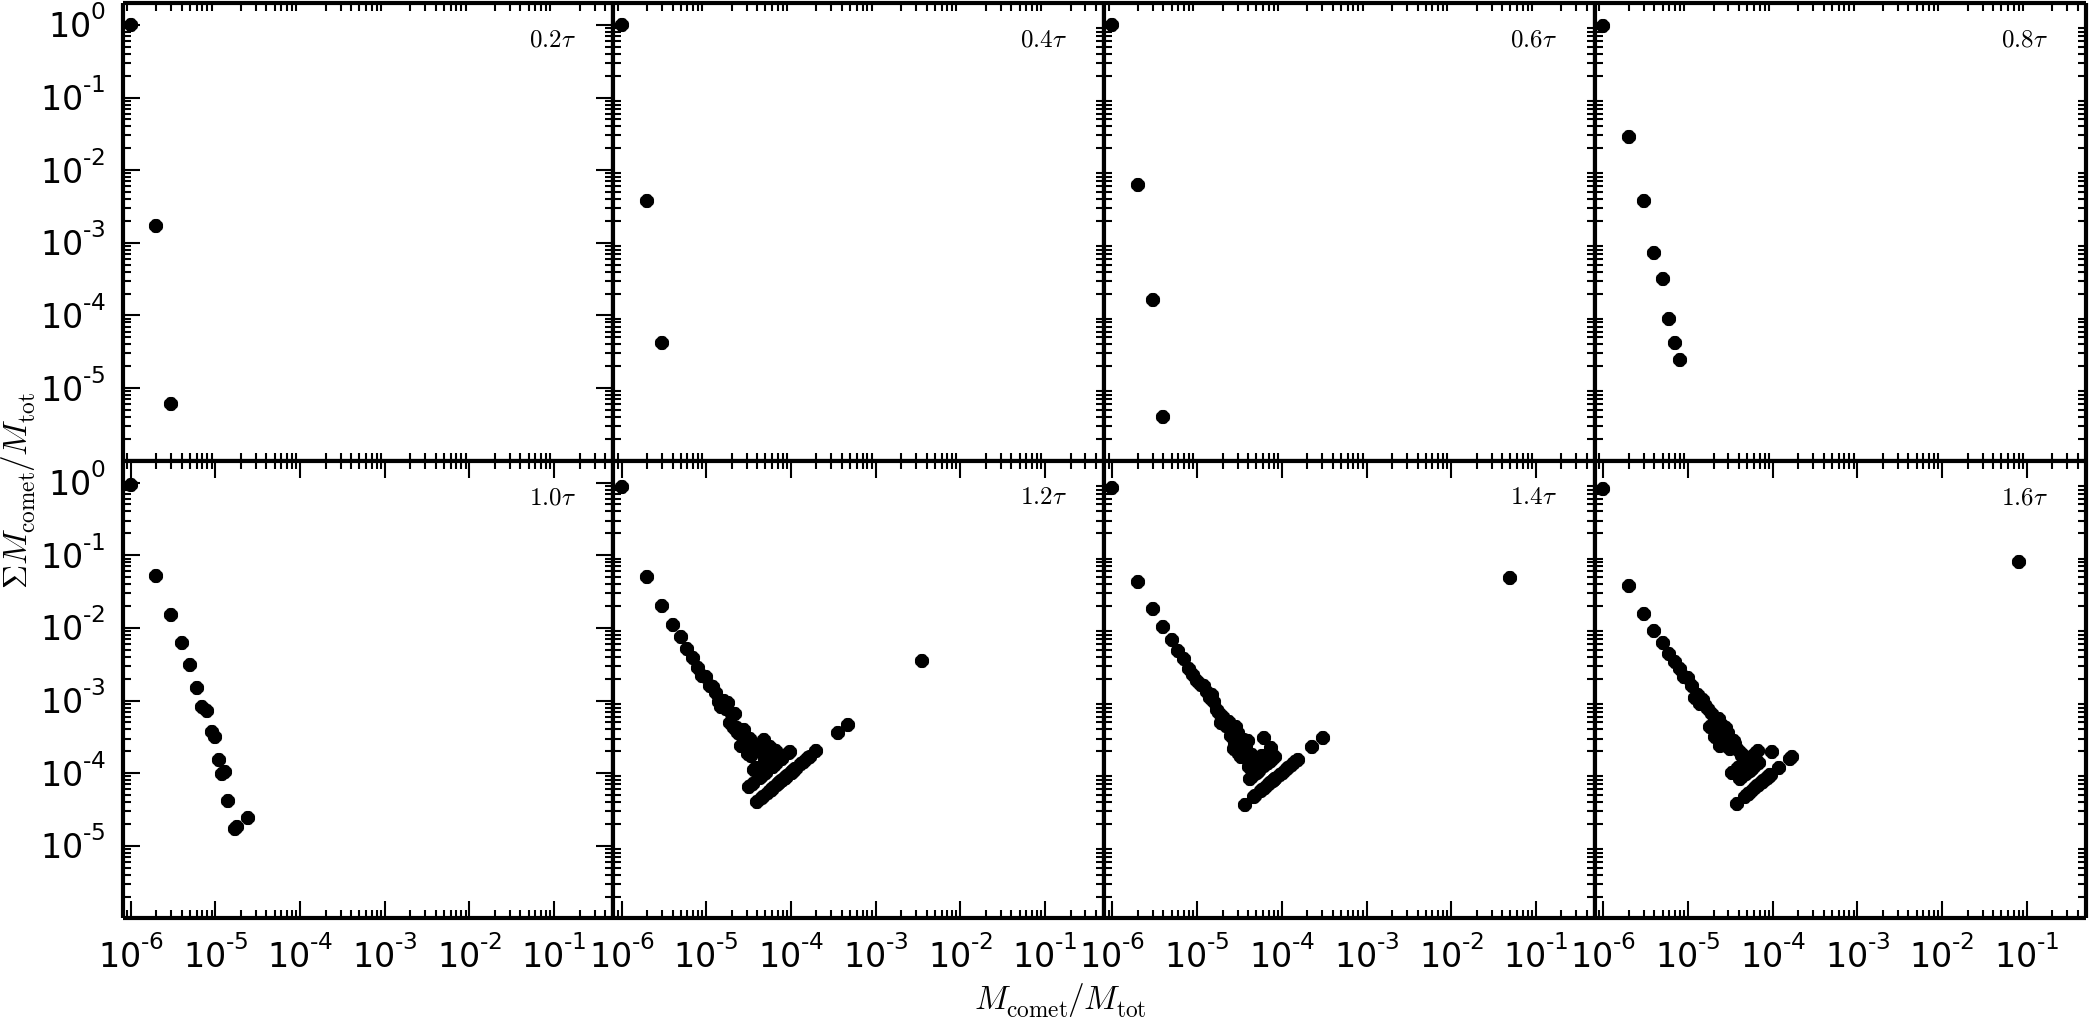
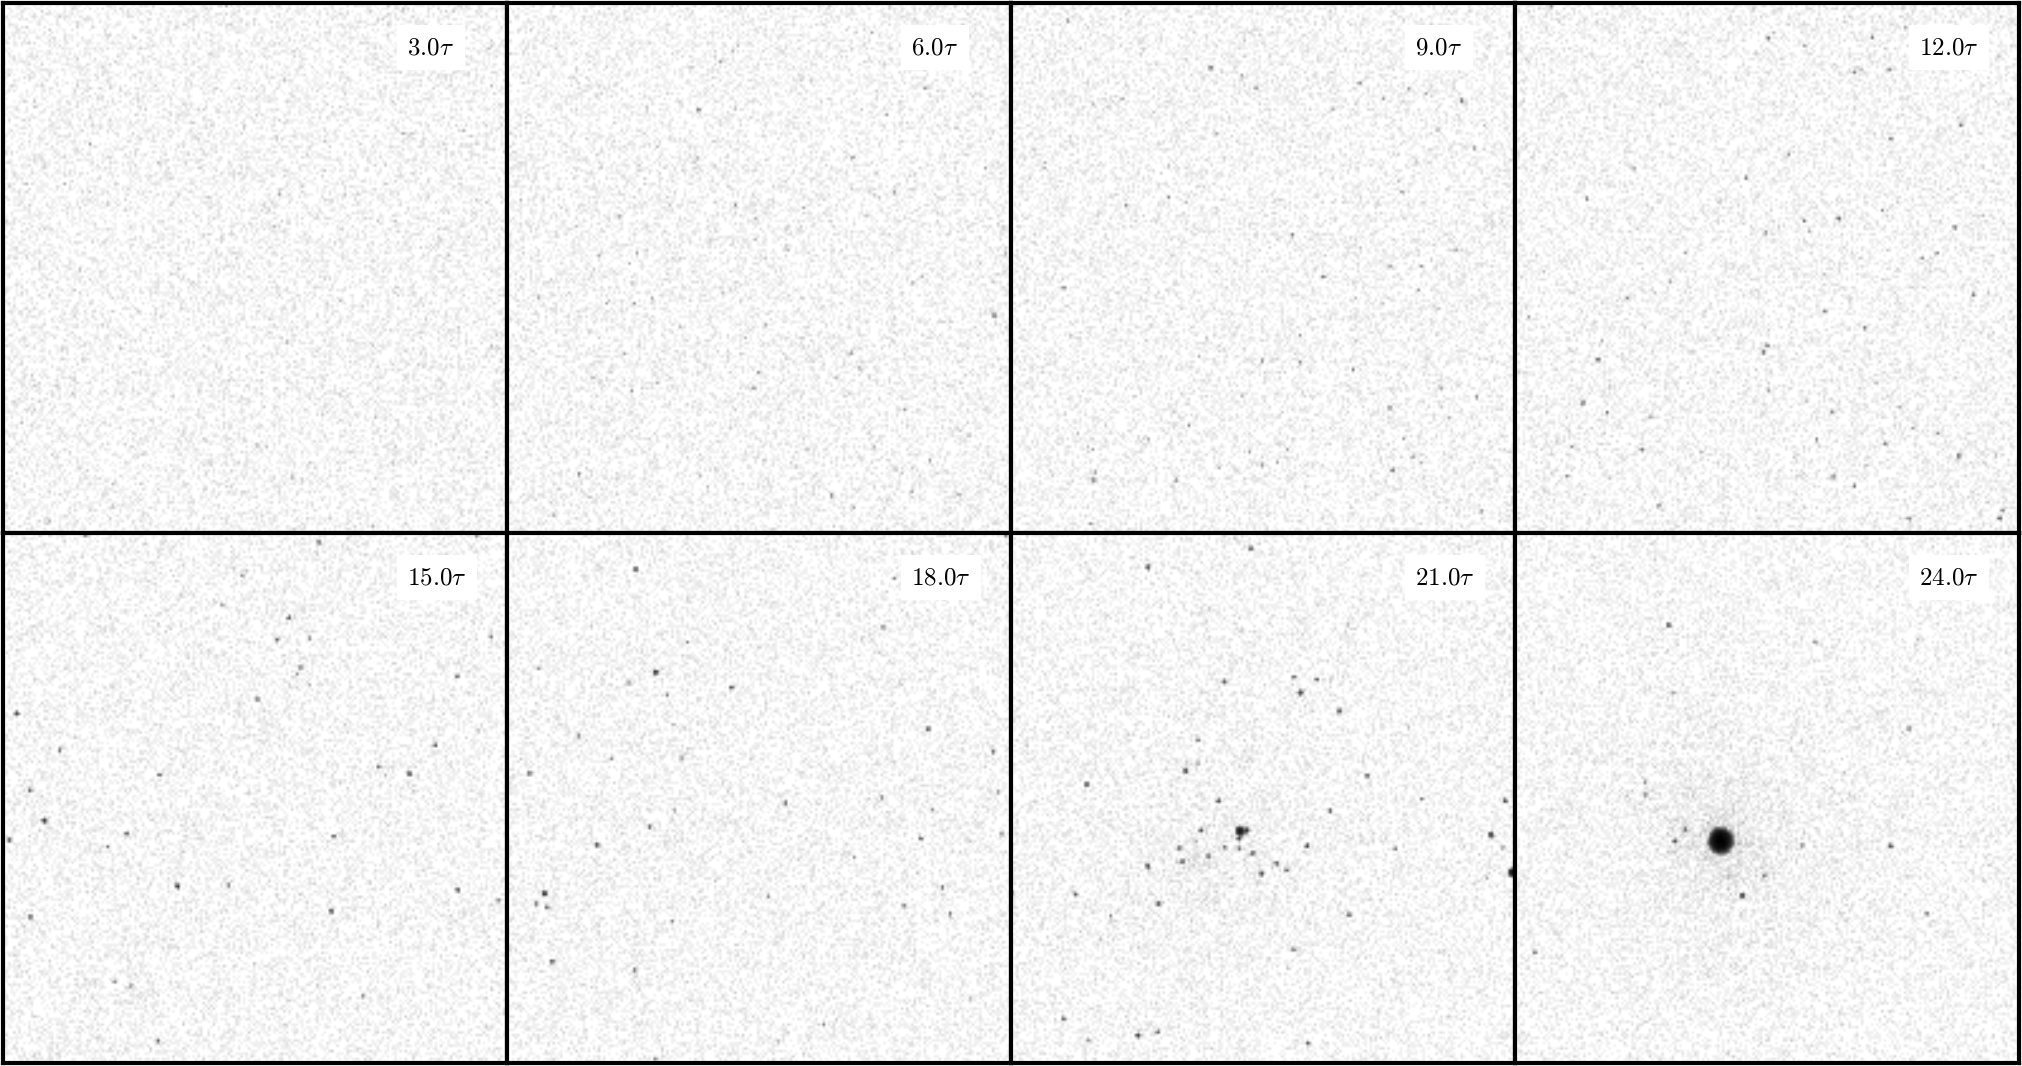
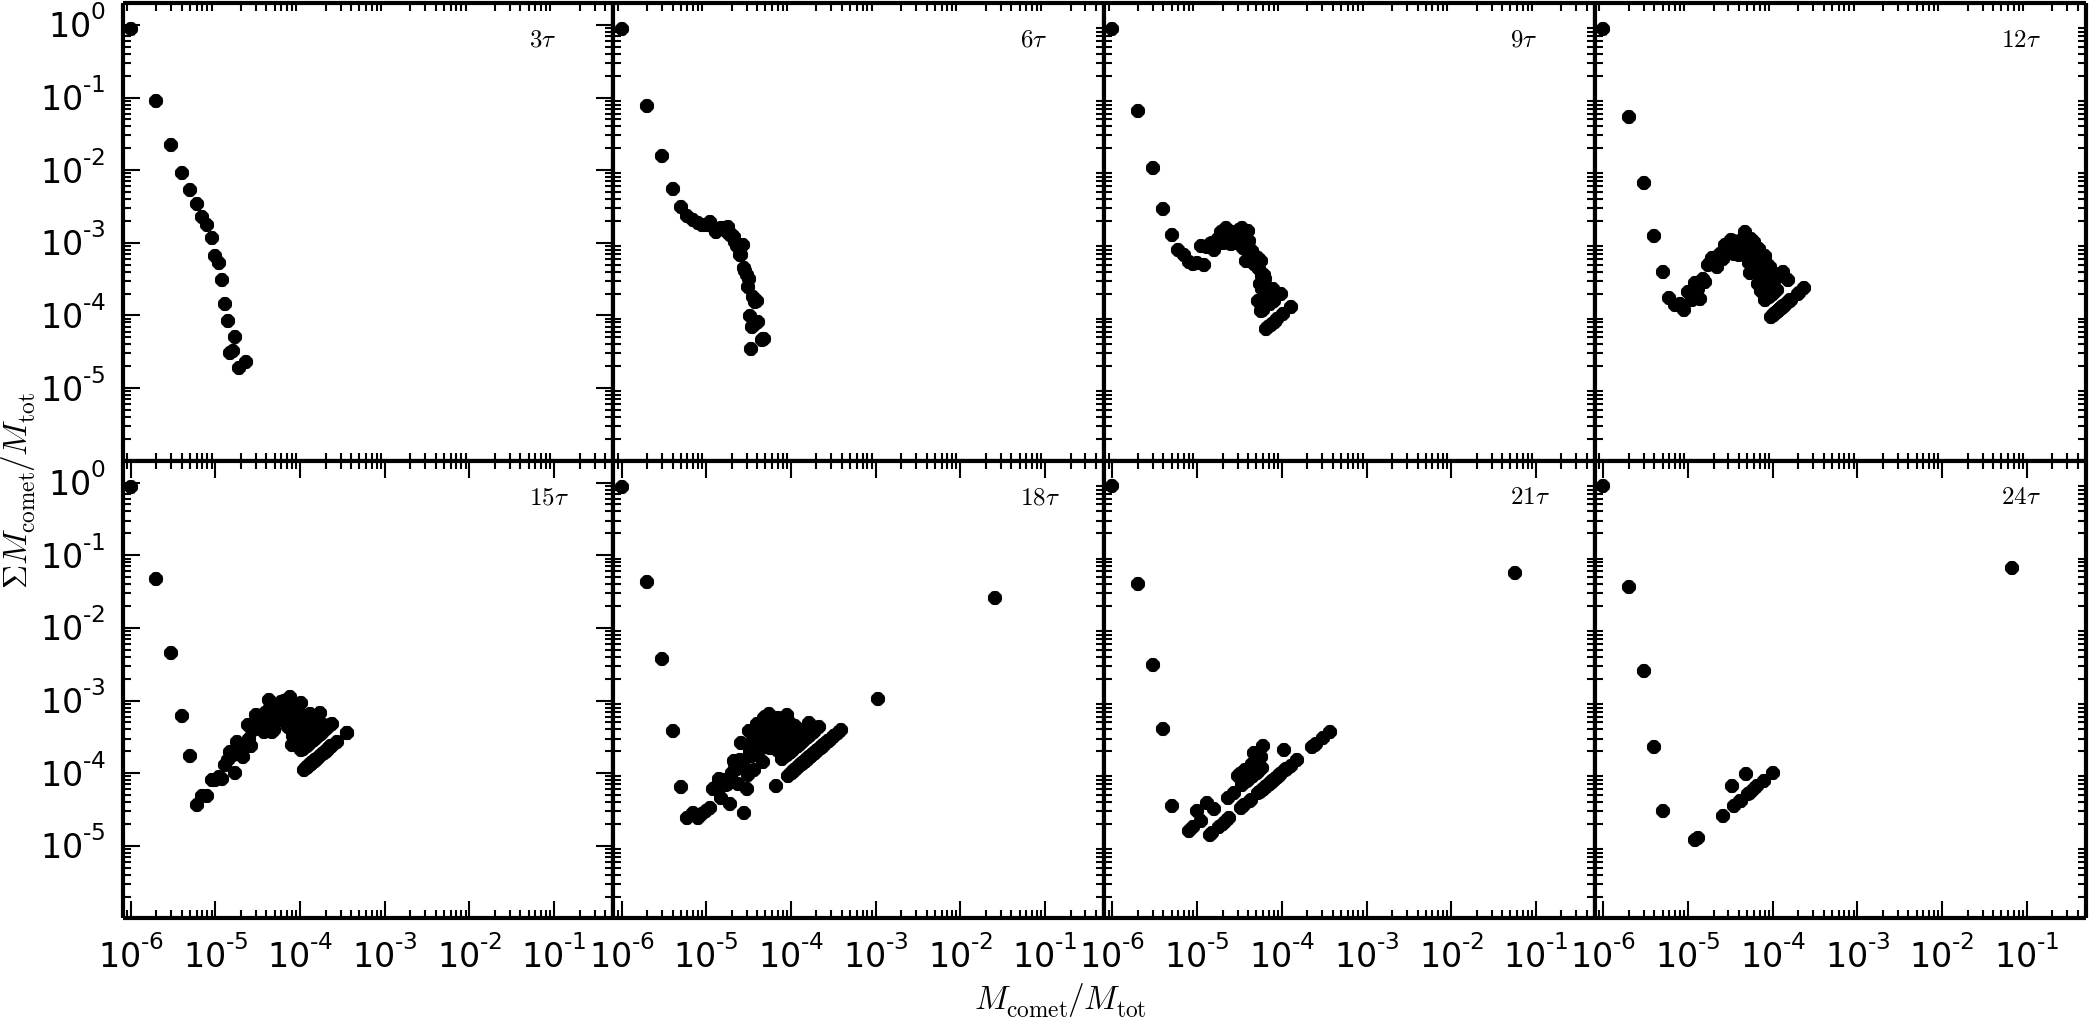
Figure 34 shows snapshots and Fig. 34 the “comet” mass distribution at different times. During the temperature rise, the “comets” are distributed according to a power law,
| (43) |
and no “planetoid” is formed. The power-law index is very steep at the beginning with , but quickly decreases as it reaches a value of at the end.
After the temperature increase break at , the power-law distribution remains for small “comets”, but one bigger “gaseous planetoid” with over of the total mass forms. It is shown in Fig. 19. The spherical body seen at in the snapshots is uncondensed gas, which is why it does not figure in the “comet” mass distribution (see Sect. 3.4 for a discussion how condensed matter is identified).
A second power law:
| (44) |
on the right side of the diagram describes the “comets” and “planetoids”. Each body occurs typically only once with our limited , and . Equation (43) describes the mass distribution of small bodies where gravity is negligible whereas Equ. (44) describes large bodies where gravity is weak, but cannot be neglected.
The first high-density plane is created thanks to the plane perturbation parallel to the -plane at . One can observe in Fig. 34 at that two filaments form, along the - and - axes, connecting the “planetoid” with itself thanks to the periodic boundary conditions. They are aligned with the mesh, but not primarily due to grid effects, but because these lines are the shortest distance between the “planetoid” and its periodic images. As can be seen in Fig. 40, diagonal filaments are also possible using the second shortest distance.
The position of the “planetoid” is, thanks to the plane-wave perturbation, situated in the plane, the and positions are random and depend on the initial condition and vary with every simulation as shown in Fig. 20.
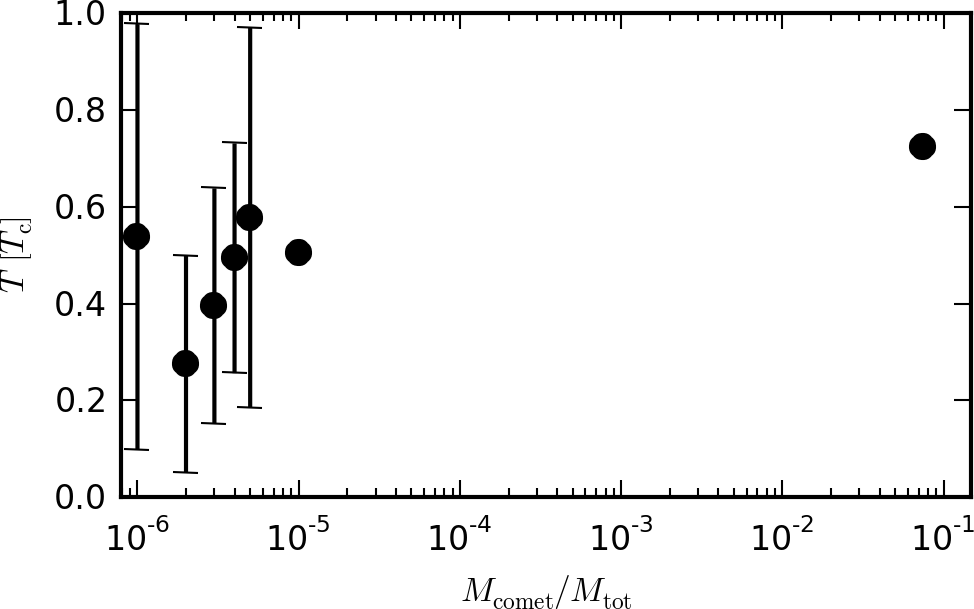
Figure 21 shows the temperature distribution in the “comets” as function of mass. As the number of large “comets” with the same number of super-molecules is small or even one, no error bars can be seen for the larger “comets” and the “gaseous planetoid”.
The broad Maxwellian velocity distribution is seen for the unbound molecules (). The small “comets” (2 or more particles) clearly have a lower temperature and dispersion than the average temperature of the system. This is due to the fact that in order for two super-molecules to cluster together, a third one is needed, and this takes away some of their kinetic energy. The larger a “comet” is, the closer its temperature is to the system average temperature. On longer formation time the “planetoids” temperature tends towards the system average temperature, as expected.
4.4.3 Scaling

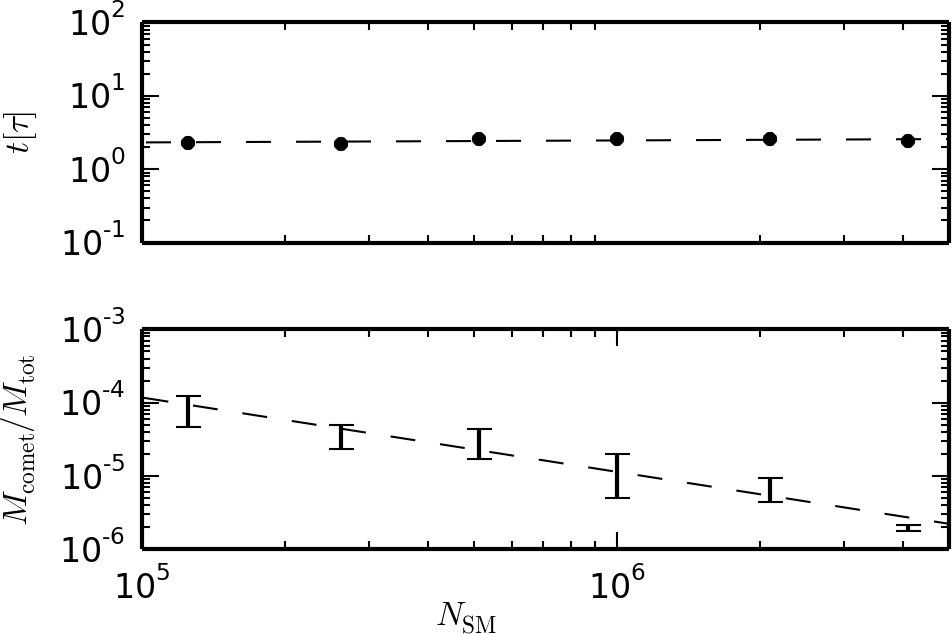
Figure 22 shows the mean temperature value over four simulations with different random seeds. One can see that the two smallest simulations with and are starting to collapse earlier than the other simulations, which are very similar. This can be explained by the fact that these simulations have very low values (Equ. 40), and . The first value is in fact lower than the cut-off radius of and fails to satisfy Equ. (36), the other one just slightly above it. In these simulations, the gravitational forces are strong even in short-range intermolecular interactions, the simulations are therefore overemphasizing the gravitational effect.
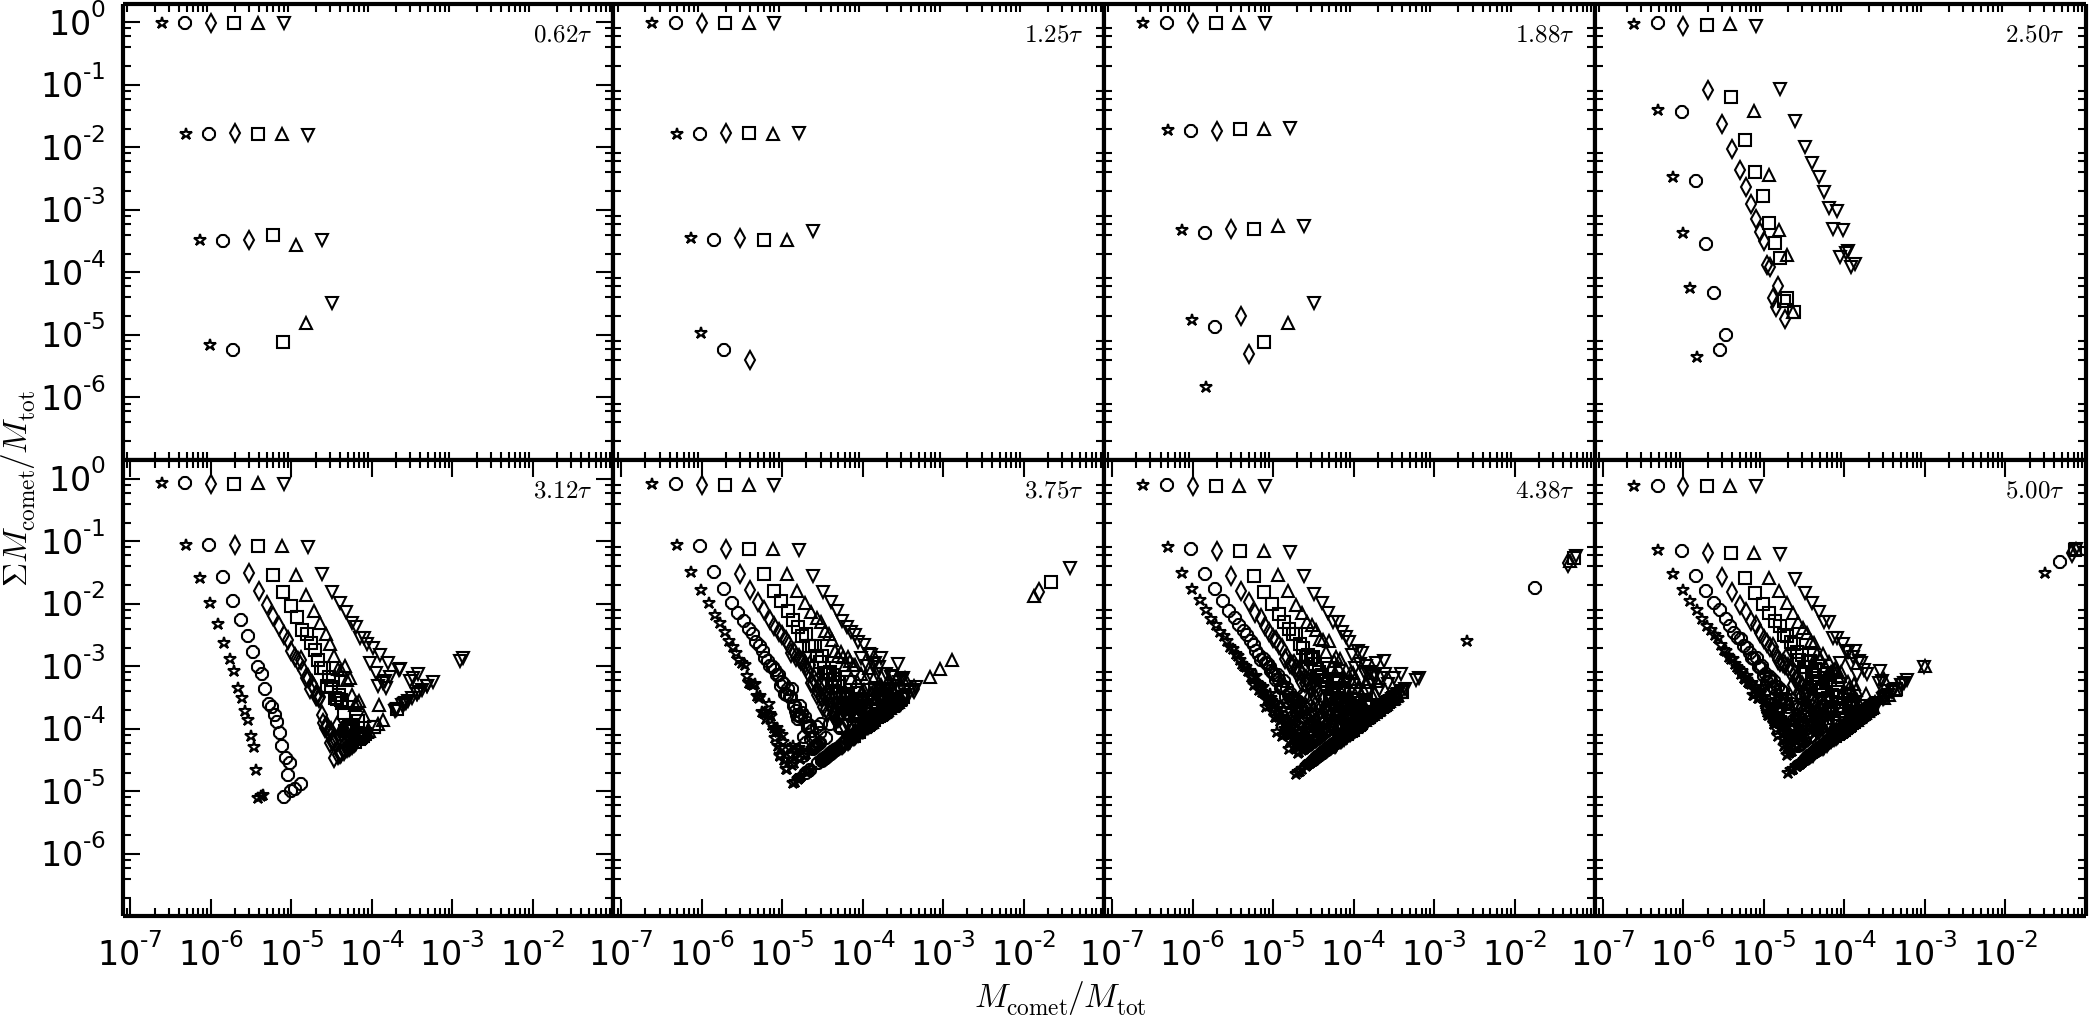
Figure 36 shows the “comet” mass distribution of all OPGs simulations. For small “comets”, the percentage for a same number of super-molecules is the same for all . For example, at , all simulations have a fraction of for comets consisting of two super-molecules. These small clumps should be called multimers as mentioned below. But, with increasing , the mass of a comet consisting of two super-molecules diminishes since .
On the other hand, for large “comets” and the “planetoid”, the mass is invariant to . For example, the “planetoid” at has the same mass of for all .
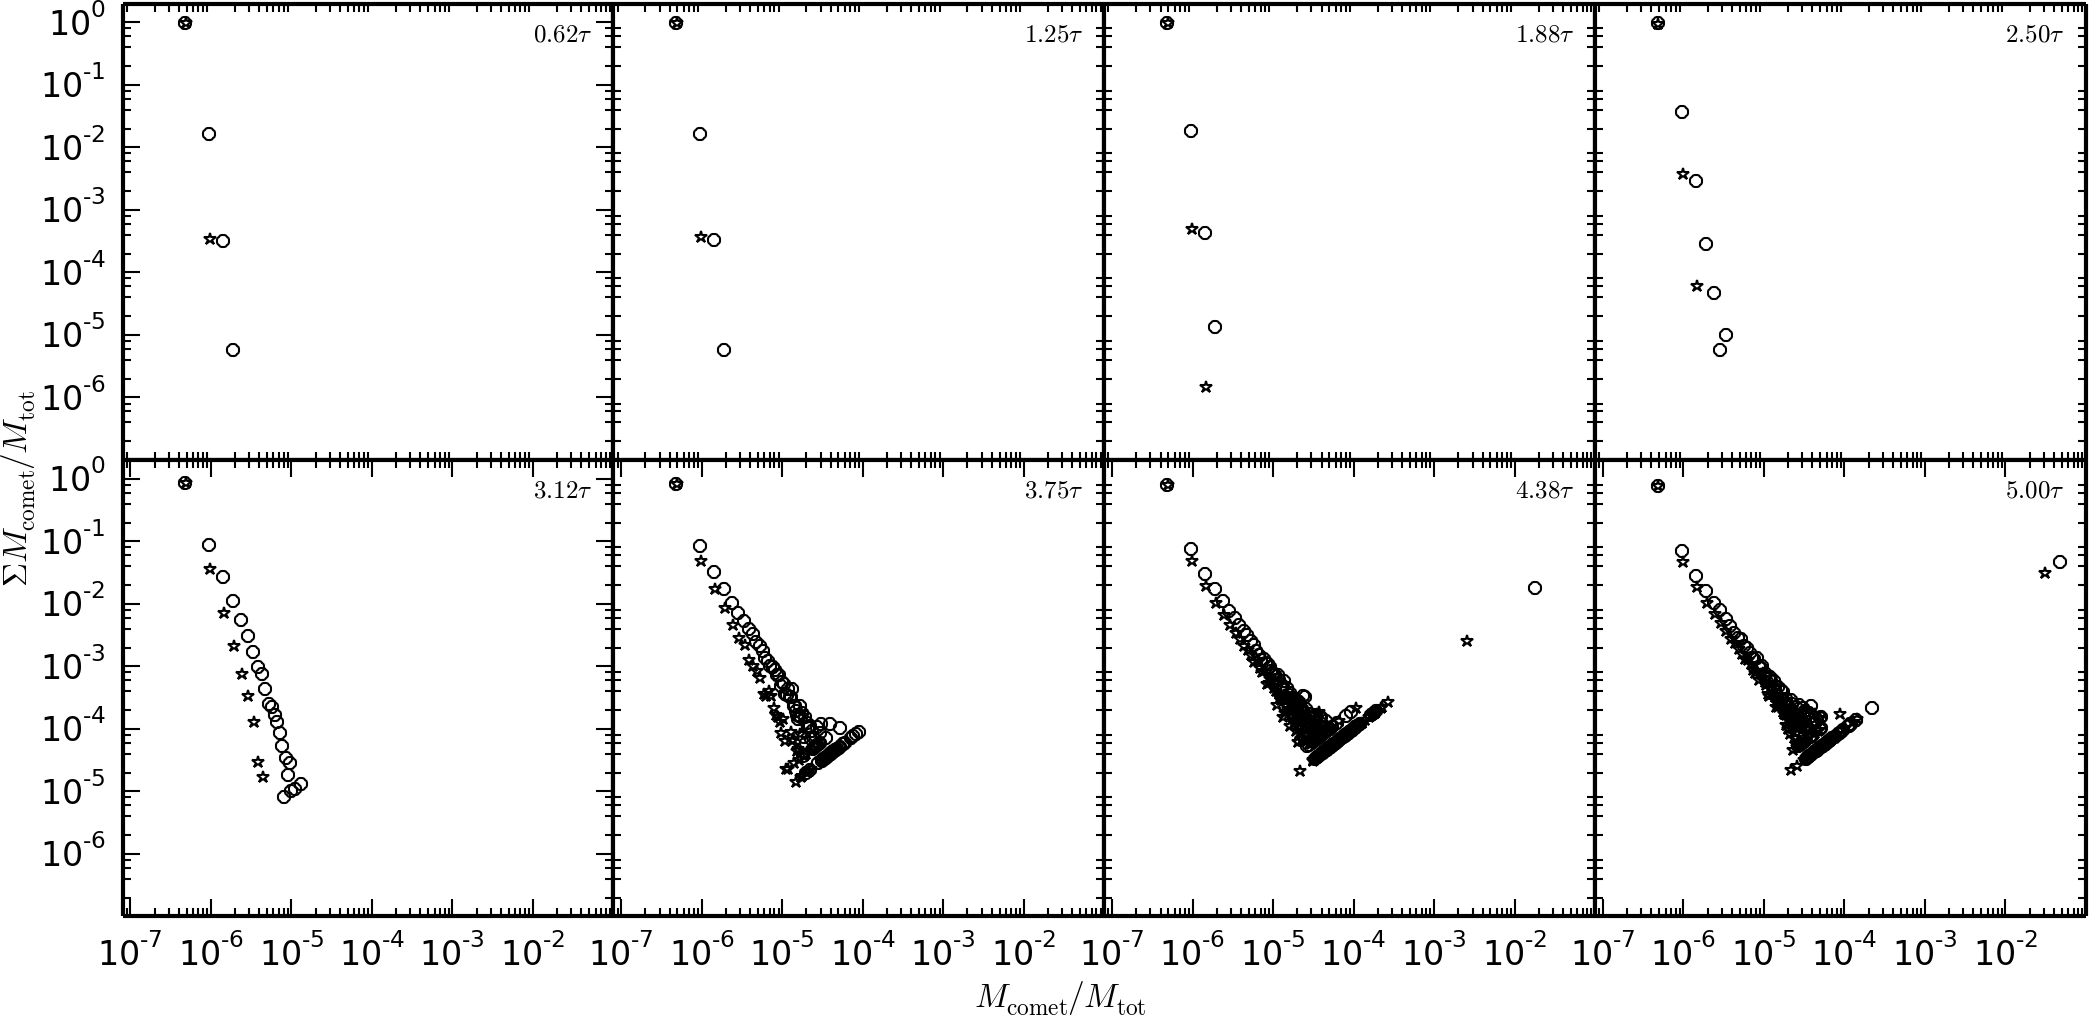
The fact that the mass distributions are shifted to the left for larger is misleading, as shown in Fig. 36. Only the two largest simulations are shown, the simulation with is shown normally, but for the simulation with is downscaled to , always two “comet” sizes are added together. As can be seen, when comparing the two simulation using the same scaling, the two mass distributions are in fact very similar.
It is interesting to look at the turning point, defined as the point where the mass sum of the biggest “comets” is larger than the mass sum of smaller comets. This point is interesting as it is the first indicator of the creation of a aggregate of molecules that start to be influenced by gravity. Figure 23 shows the time and the mass of the turning point. One can see than the time of appearance is independent of . The “comet” mass, on the other hand, clearly follows a power law with:
| (45) |
with . Since , at turning point the number of super-molecules is always of order of 10. In other words, in critical conditions where the attractive molecular force adds up to gravity, the tendency to make a larger condensed body mass fraction already starts at about ten molecules.
4.4.4 Extrapolation to physical scale
Having studied the scaling behaviour of the simulations, we can attempt to extrapolate some properties for a fluid consisting of real molecules instead of super-molecules. Considering H2 molecules, the total mass of the OPGs simulations is , the box length equal to and .
Thus, in realistic conditions there would be a total amount of H2 molecules, the number of molecules per super-molecule varying from for to for . So, even for the largest simulations, there is a difference in number of particles of more than orders of magnitude with real situations. For that reason, the extrapolated data has to be treated with caution. As long as no other physics enters in the interval of scales, this is however not extraordinary in regards to common practices in simulation works, such as simulating stars with SPH particles. While a single SPH particle can at best represent a mass fraction of of the total, an SPH particle is supposed to behave as the smallest mass element in local thermal equilibrium, say a few 1000 protons over the stellar mass: , which lies therefore well over times the SPH simulation resolving capacity.
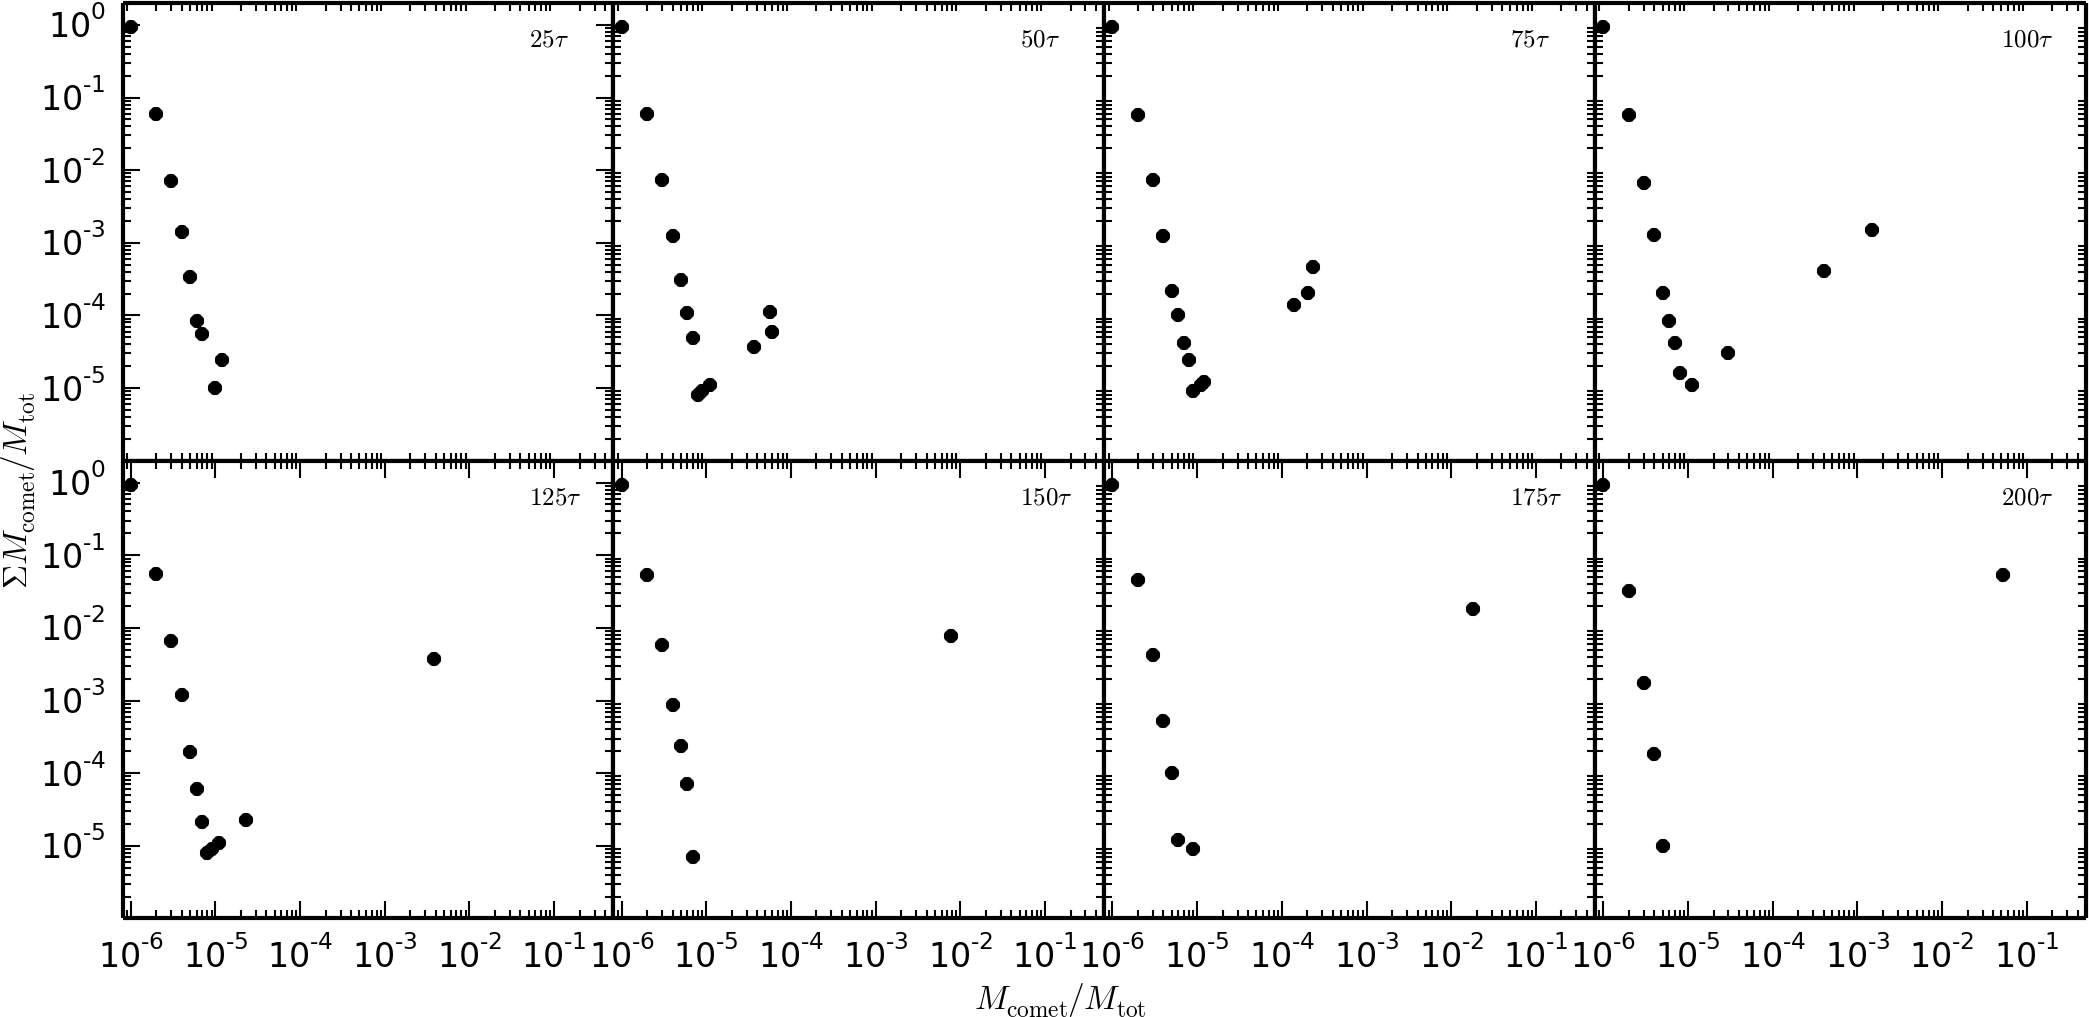
As can be observed in Fig. 15, the fraction of bound molecules does not change when increasing the number of particles and will remain unchanged for a fluid consisting of molecules. The same is true for the size of the resulting “planetoid”, as can be seen in Fig. 36. Therefore, we can assume that after , the system will consist of unbound molecules and a “planetoid” with a mass of .
At , there is a fraction of of two molecules aggregates i.e. dimers with a mass of . These multi-molecules clumps should be called “multimers” instead of “comets”. As mentioned above the turning point occurs at consistently for approximately molecules, so its mass is about .
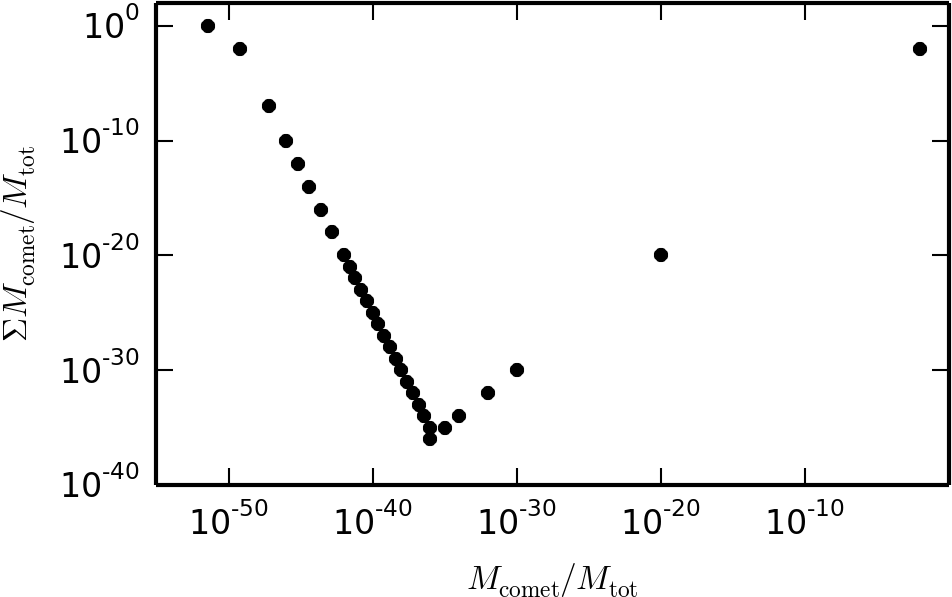
Using the above values and the two power laws of Equ. (43 – 44), Fig. 24 shows a schematic diagram showing the mass distribution at . While the mass fraction of the turning point multimers is tiny, the power-law distribution rapidly increases the mass in larger grain- and comet-sized bodies until they become a planetoid mass.
4.5 Phase transition
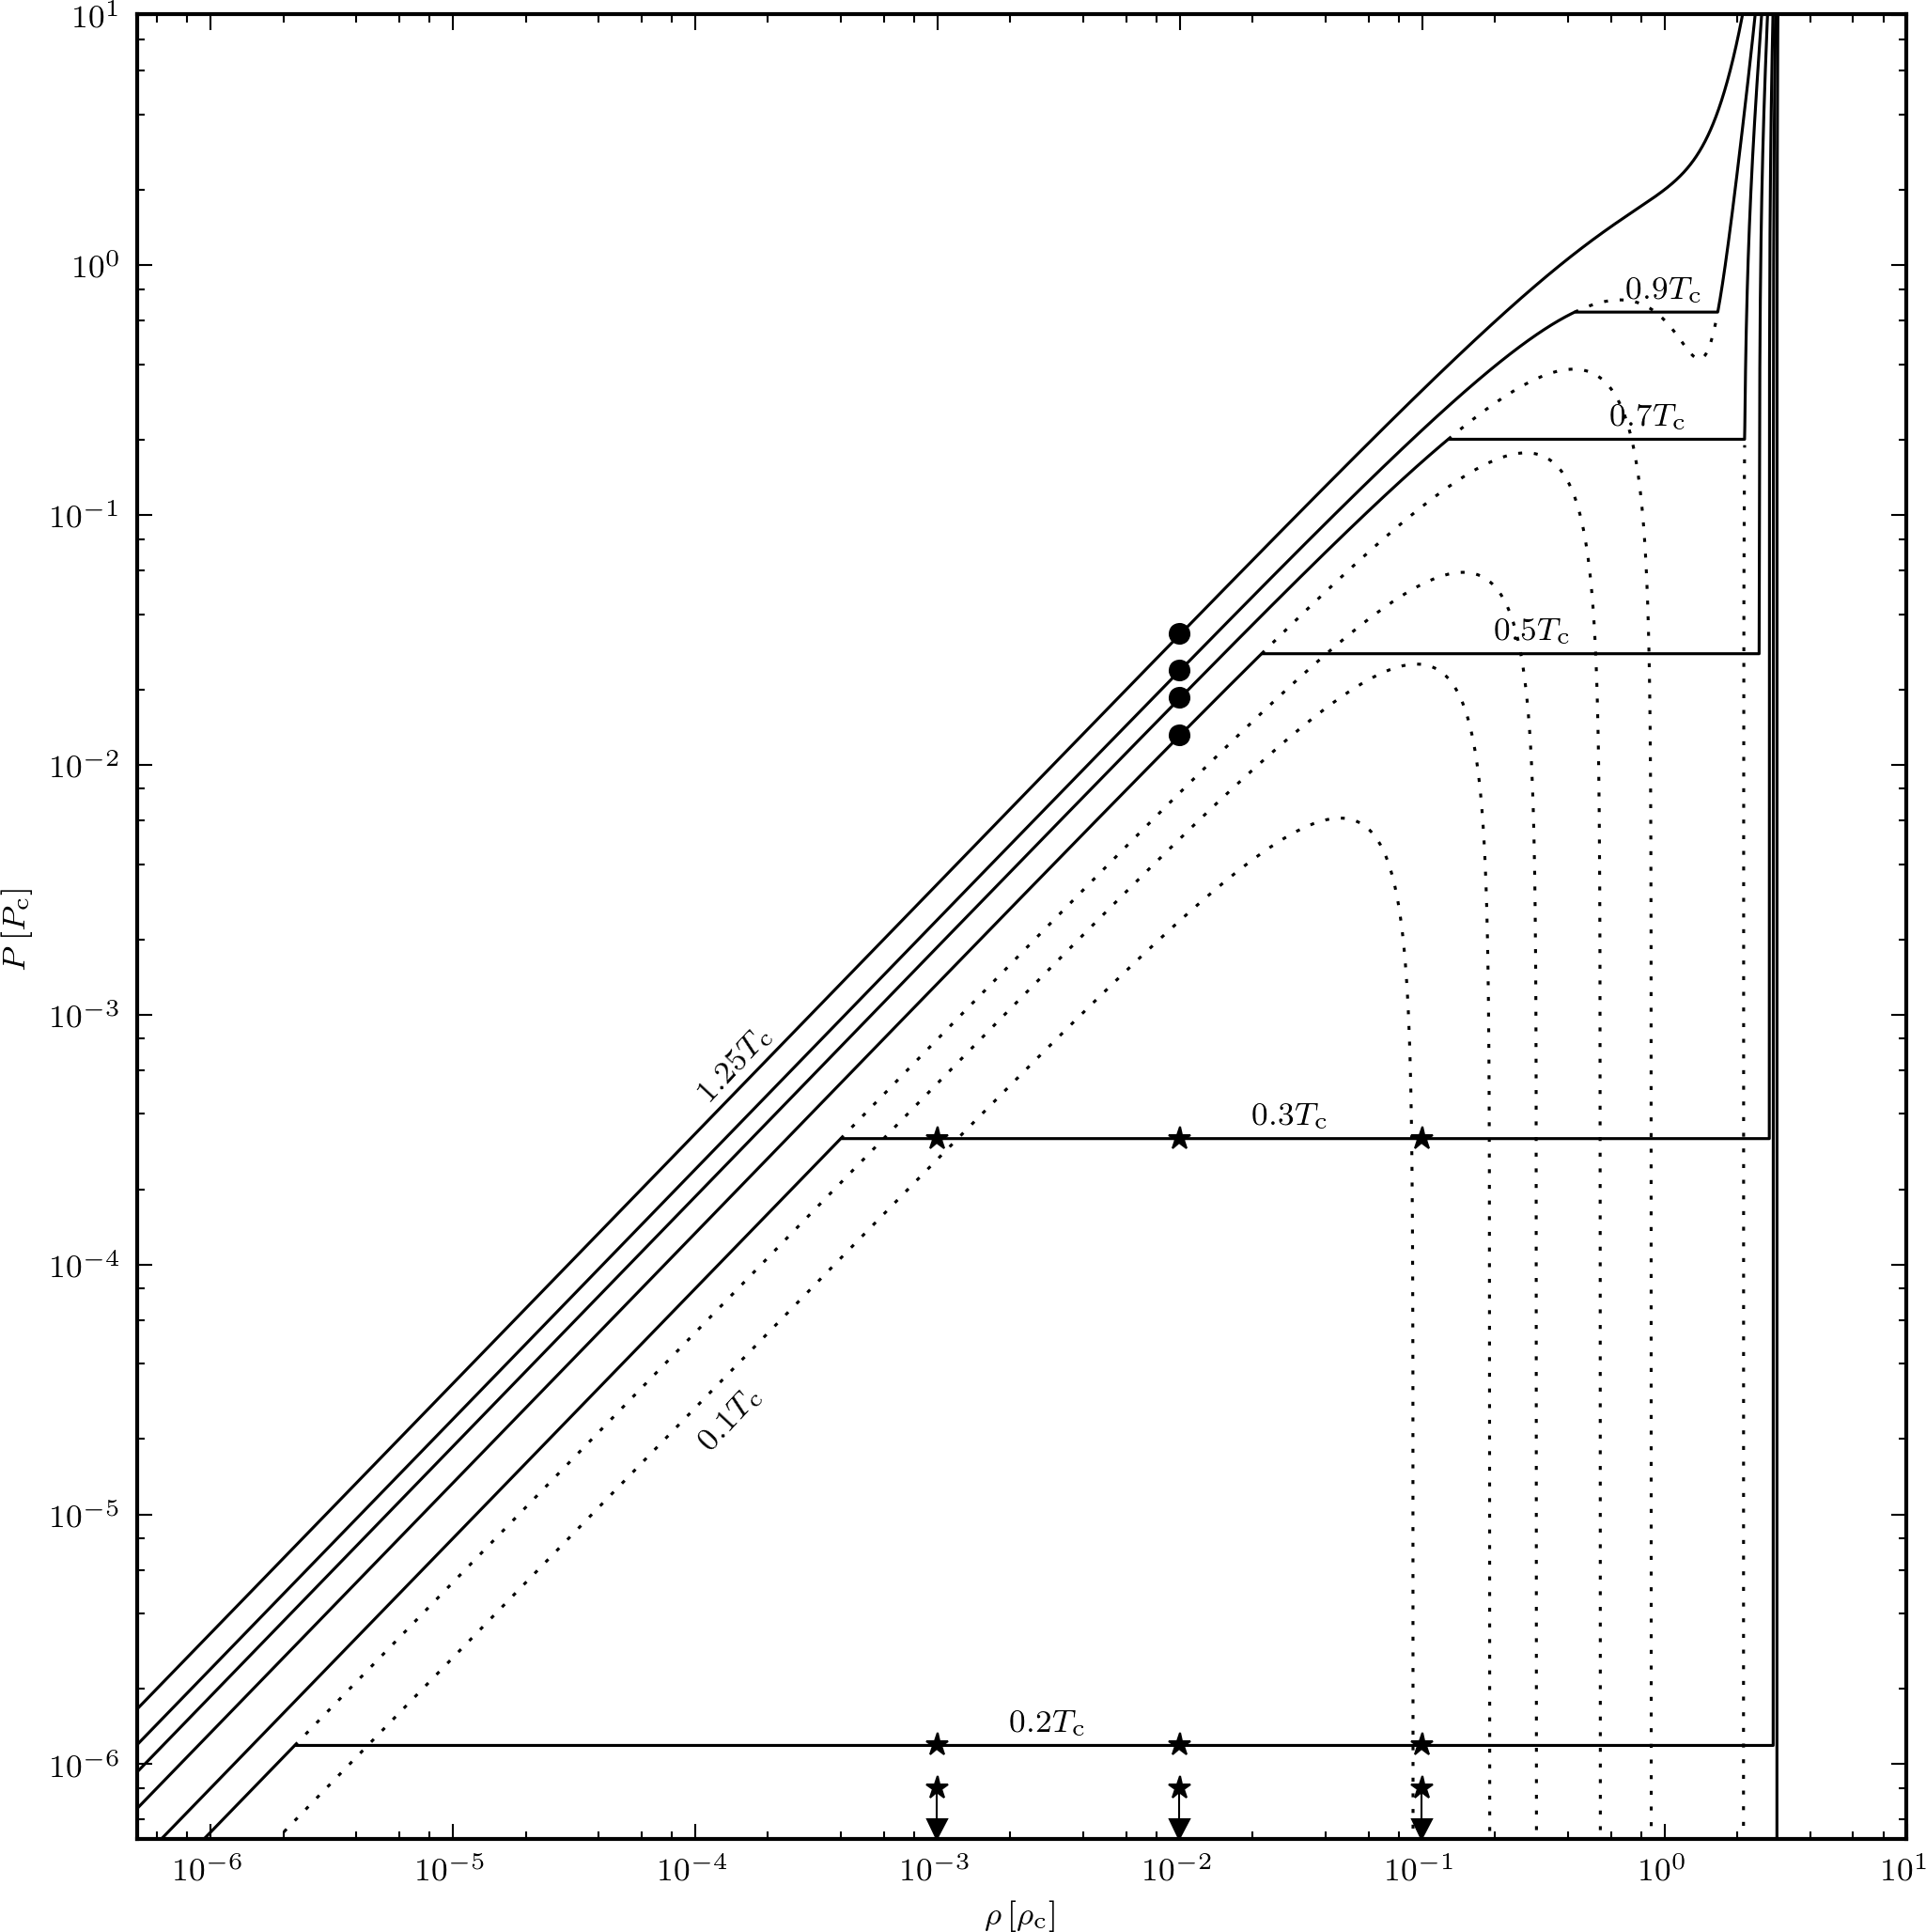
We study several physical conditions close to a phase transition. Table 5 summarizes their properties. Three different densities, , and , and three different temperatures, , and , are chosen. As the one-phase fluid studied in Sect. 4.4 also has a density of , three additional temperatures, , and , were used for this density to make a link between the one-phase fluid and the fluids studied in this section.
Looking at the phase transition diagram (Fig. 25), all fluids with are on the Maxwell line. Those with are on the part of the van der Waals phase diagram, which corresponds to metastable states on the verge of a deep phase transition. The fluids with are on the part of the van der Waals phase diagram, which corresponds to unstable states in a phase transition. The fluids with are still in the stable regime.
Three different cases are studied: without gravity, strongly self-gravitating above the Jeans criterion, and weakly self-gravitating below the Jeans criterion.
4.5.1 Fluid without gravity
(a) See Table 5
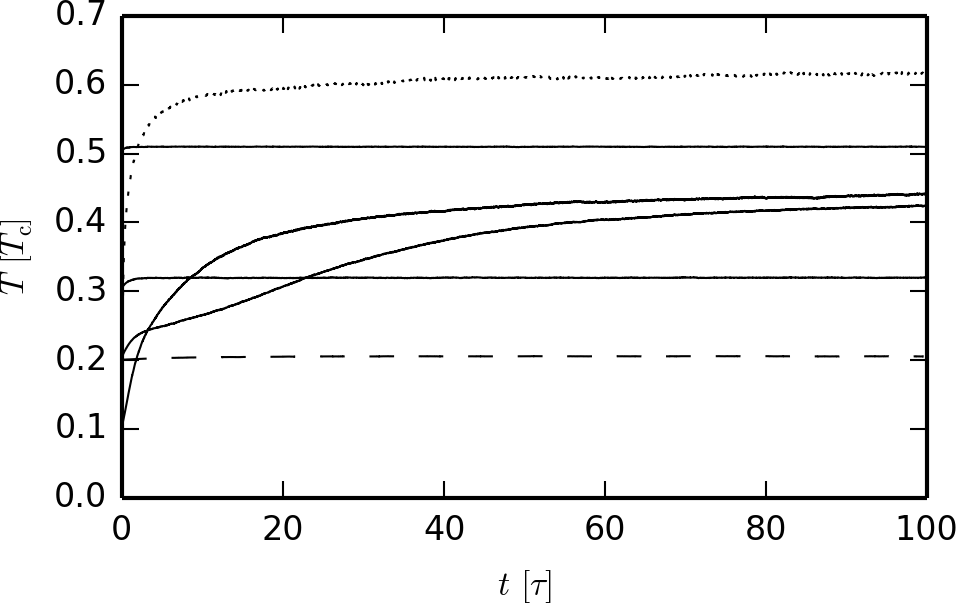
To study the evolution of fluids presenting a phase transition without gravity, the value does not have to be considered and the number of super-molecules is set to . Figure 26 shows the temperature evolution of some of these fluids. In the beginning, the molecules merge into small “comets”, which leads to a decrease of the potential energy and therefore a rise of the temperature. Once the temperature is high enough, the kinetic and potential energy reach a equilibrium and the fluid remains stable.
The number of “comets” formed is dependent on the density and inversely dependent on the temperature. The higher the number of formed “comets“, the longer it takes for the fluid to reach a stable regime. For example, the very cold fluids PT1-2 and PT2-2 only reach an asymptotic value around .
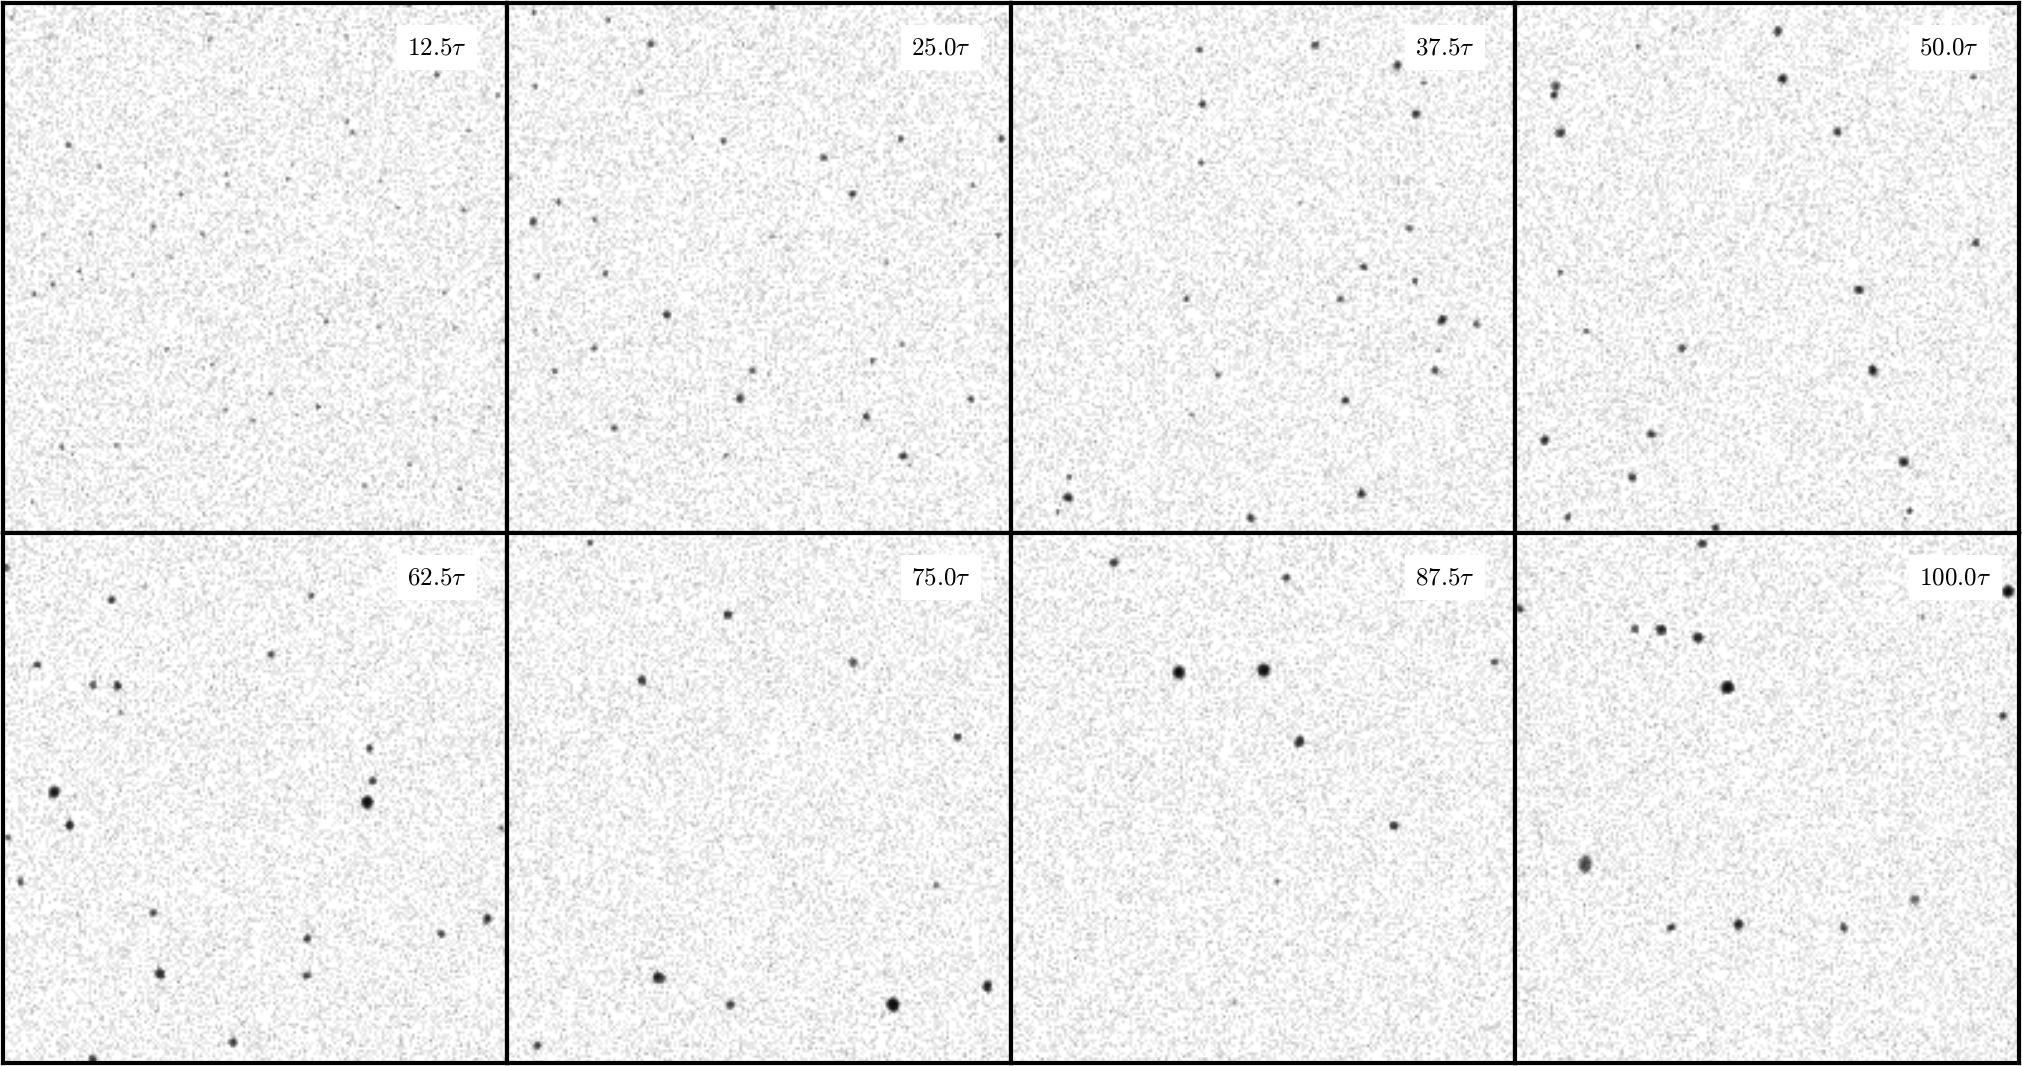
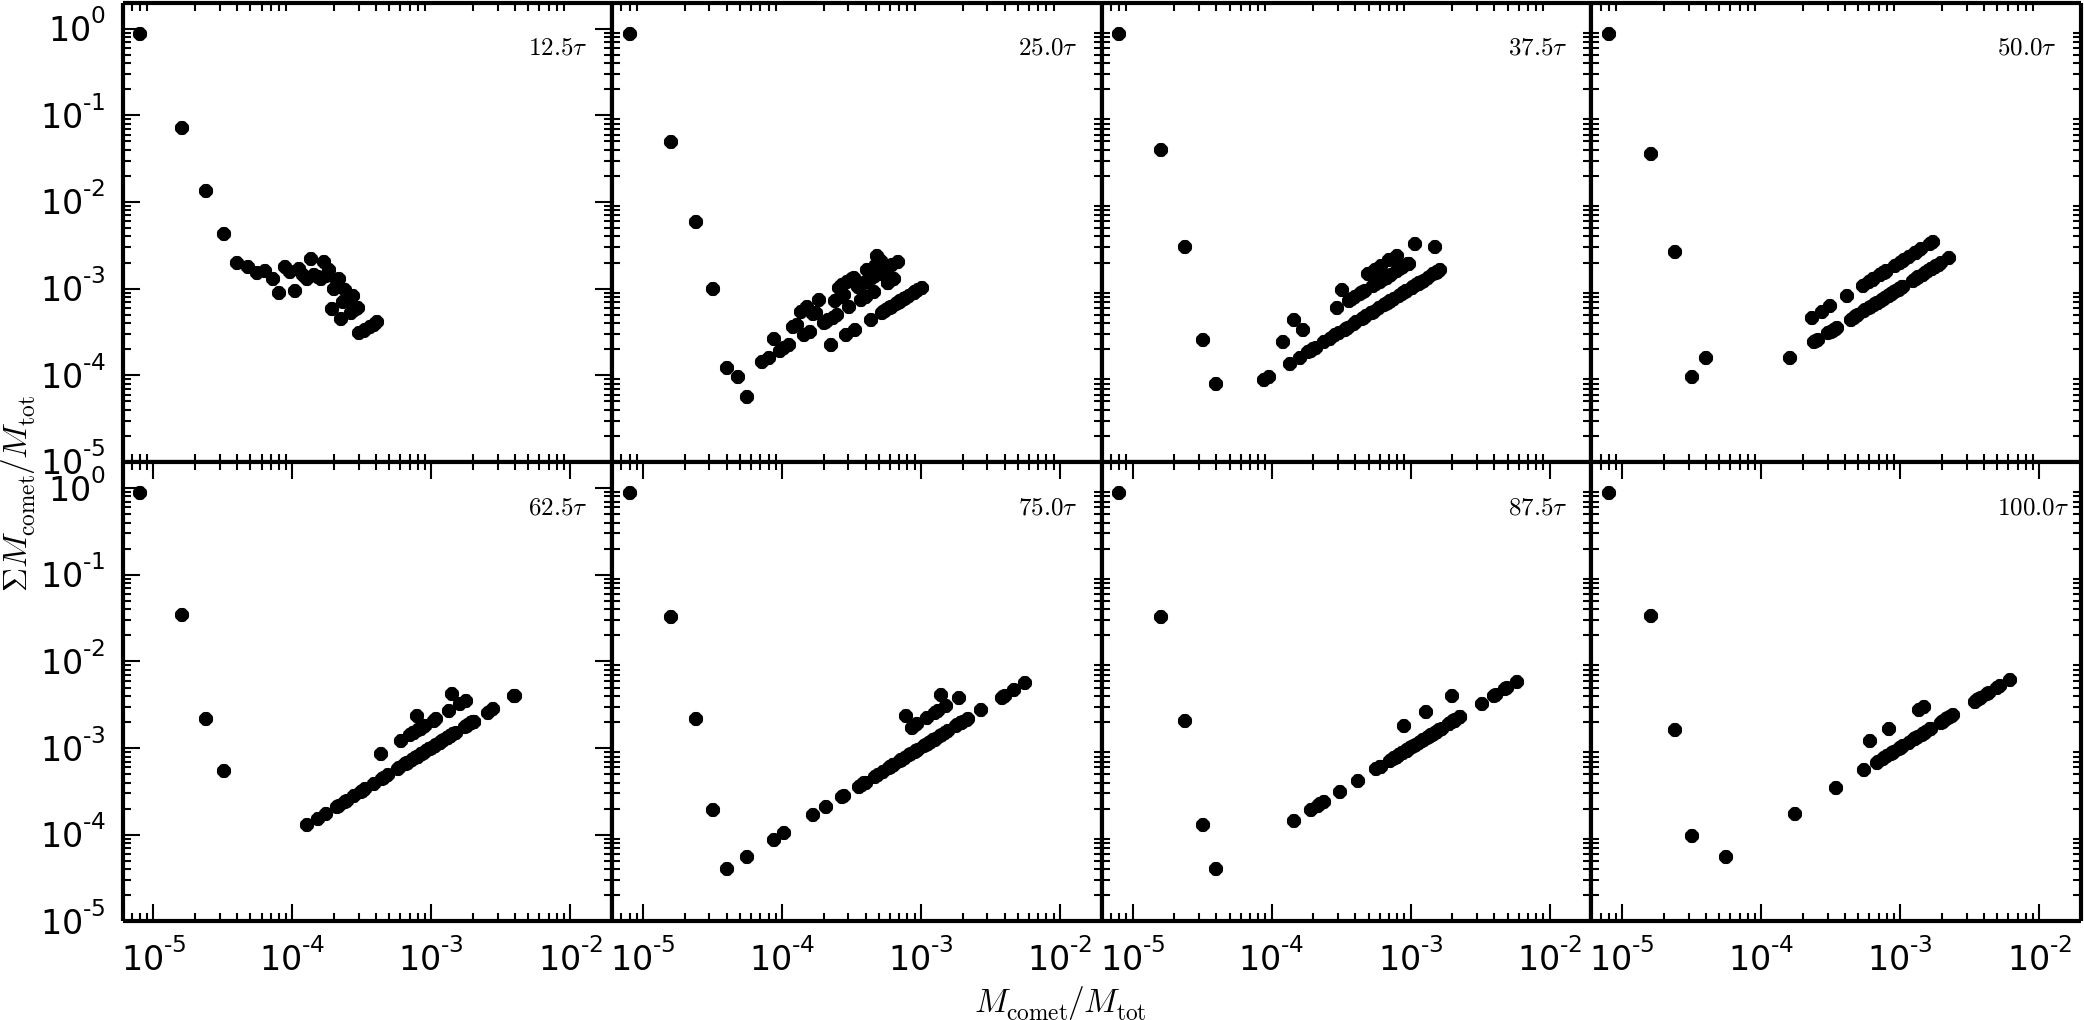
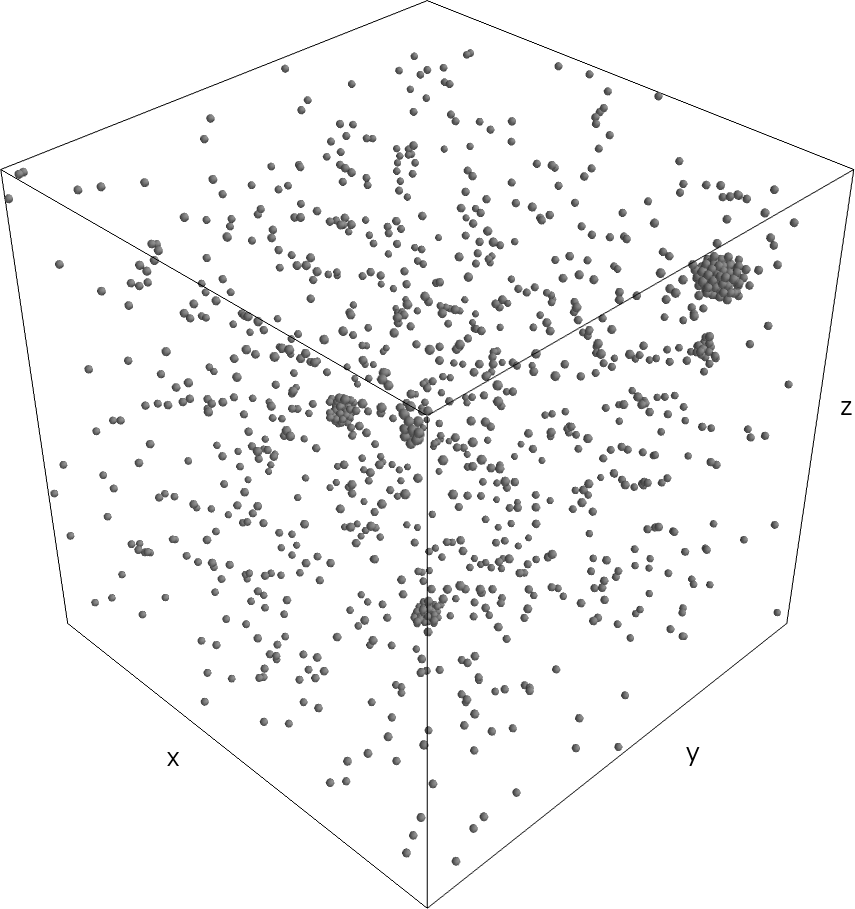
The “comets” remain at moderate size as can be seen in the snapshots (Fig. 38) and in their mass distribution (Fig. 38): The number of super-molecules per “comets” is . The mass distribution follows the power law of Equ. (43), but at , the mass distribution rises again, presenting a big number of “comets” between to super-molecules. Fig. 27 shows a close-up 3D view of a medium-sized “comet” and smaller aggregates.
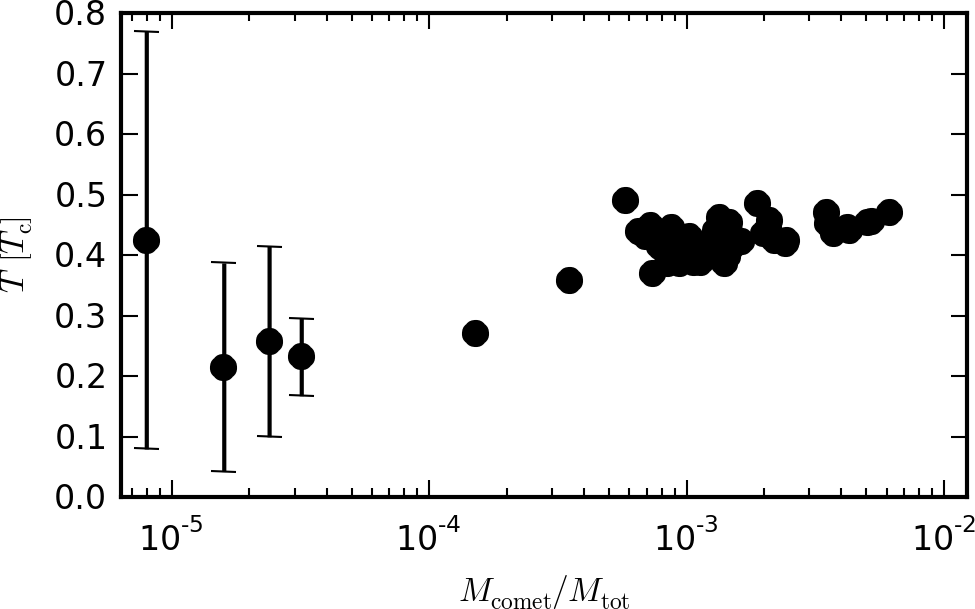
Figure 28 shows the temperature distribution as a function of the “comet” mass. As in simulation OPGs, the temperature for small bodies lies below average, but reaches average value for more massive bodies.
4.5.2 Self-gravitating fluid above Jeans criterion
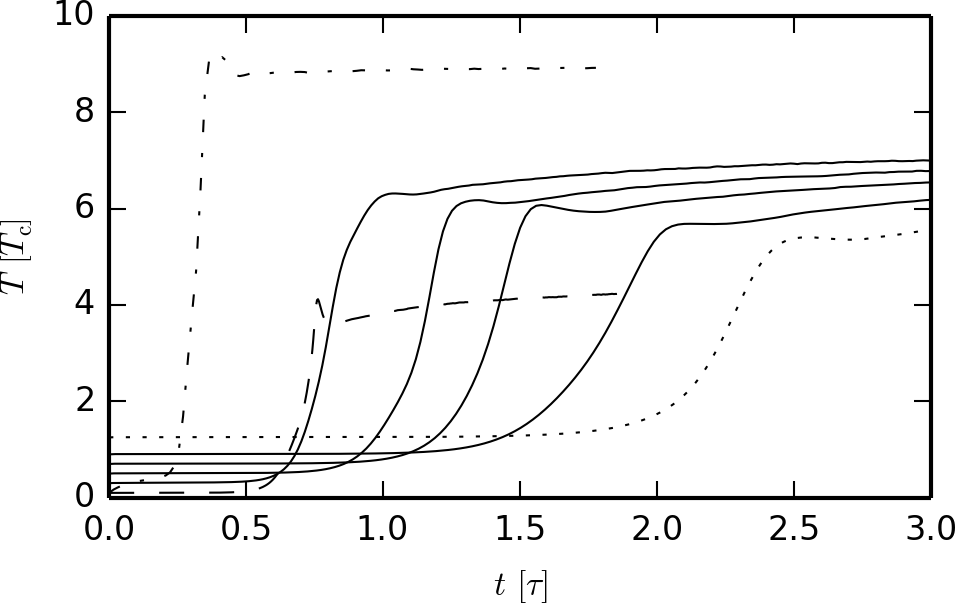
(a) See Table 5
All sufficiently self-gravitating simulations use the same gravitational potential, . As the temperatures and densities differ, and therefore is different for each simulation, but this parameter is always .
As for all simulated fluids, they are unstable if perturbed. The lower the initial temperature of a fluid, the bigger is , which translates to a faster exponential growth. This can be seen in Fig. 29 where the fluids with a density of are starting to collapse one after another, from the lowest to the highest temperature.
The evolution of the fluids is identical to the fluid OPGs: an exponential rise of the temperature until it reaches a temperature break, after which the temperature rises only slowly and a single “gaseous planetoid” is formed. Figures 40 and 40 show snapshots and “comet” mass distribution, again very similar to the fluid OPGs. First, there is a formation of small “comets” following the power law of Equ. (43), and then the “comets” are massive enough to attract each other and merge into one big spherical “planetoid” (), following the power law of Equ. (44). The power-law index also evolves in a similar fashion as in simulation OPGs, starting out very steep and reaching a final value of .
4.5.3 Self-gravitating fluid below Jeans criterion
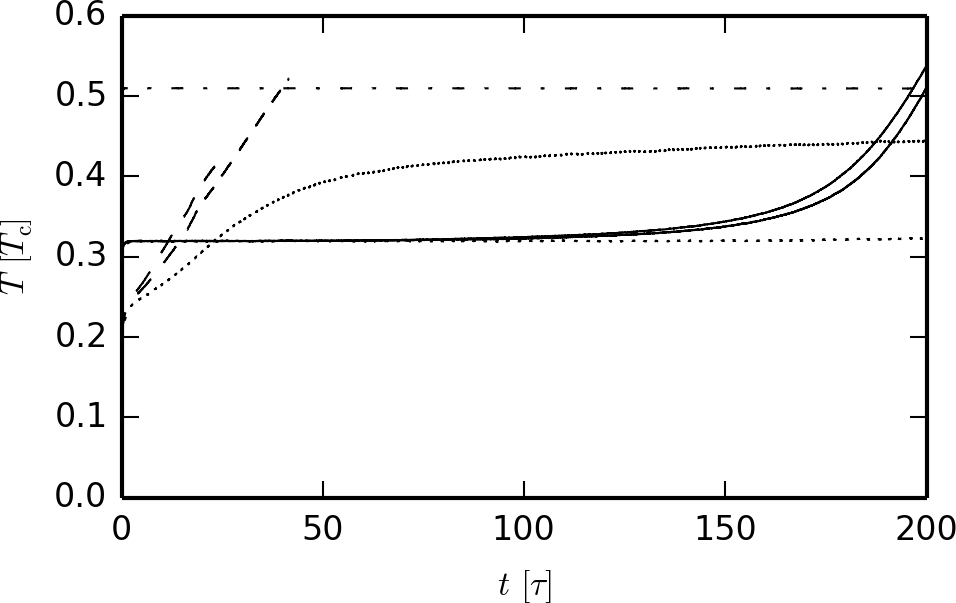
To compare weakly self-gravitating fluids in a phase transition (on the Maxwell line) with out-of-phase-transition fluids (below the Maxwell line), is set to for all fluids. This means that the individual value is different for each simulation.
As shown in Sect. 4.5.1, the perturbation of the weakly self-gravitating one-phase fluid OPGw does not create any effect if . Figure 30 shows the temperature as a function of time of the self-gravitating fluids PT5-2, PT3-2, and PT2-2, and compares them to the non-gravitating fluids. The out-of-phase-transition fluid PT5-2 remains unchanged and does not differ from the non-gravitating fluid, identical to OPGw.
The temperatures of the fluids in a phase transition PT3-2 and PT2-2 are exponentially growing and differ clearly from the non-gravitating ones. In the beginning, the LJ forces dominate the gravitational forces and the fluids behave like non-gravitating fluids. PT2-2 reacts much faster than PT3-2, thanks to its low initial temperature and fluctuations due to the Maxwellian velocity distribution,and forms many small- and medium-sized “comets” (see Sect. 4.5.1). Once these “comets” are formed, their mass is high enough to attract each other with gravity, forming a single “rocky planetoid”.
This can be seen in the snapshots (Fig. 42) and “comet” mass distribution (Fig. 42). During the first , the fluid is identical to the low-temperature, non-gravitating fluid (compare to Fig. 38). Only then does gravity start to play a role, one can see the formation of a “planetoid” and how it swallows the small- and medium-sized “comets” during its growth.
With its higher temperature, PT3-2 forms almost no small- or medium-sized “comets”, which can be seen in the snapshots (Fig. 44) and “comet” mass distribution (Fig. 44) for the first . Only after does gravity show its effect with the appearance of a medium-sized “comet”, which is too massive to fit into the power law (see Fig. 44, ). From then on, this “comet” attracts super-molecules and thus grows in size until at , a single big “rocky planetoid” is formed.
Figure 31 shows the temperature distribution as a function of the “comet” mass of PT3-2. The temperature of the “comets” containing few super-molecules lies below the average, but the “planetoids” temperature is the same as the average.
PT2-2, PT3-2 and PT5-2 all scale very well. The two fluids in a phase transition, PT2-2 and PT3-2, have an almost identical timescale for the exponential growth for and . The slight difference is due to the initial random seed. As depends on and the temperature, both much lower than for OPGs, its value is clearly above the cut-off radius, which is and for PT2-2 and and for PT3-2.
PT5-2 shows no difference for any number of super-molecules, with ranging from to .
4.6 “Planetoid” densities
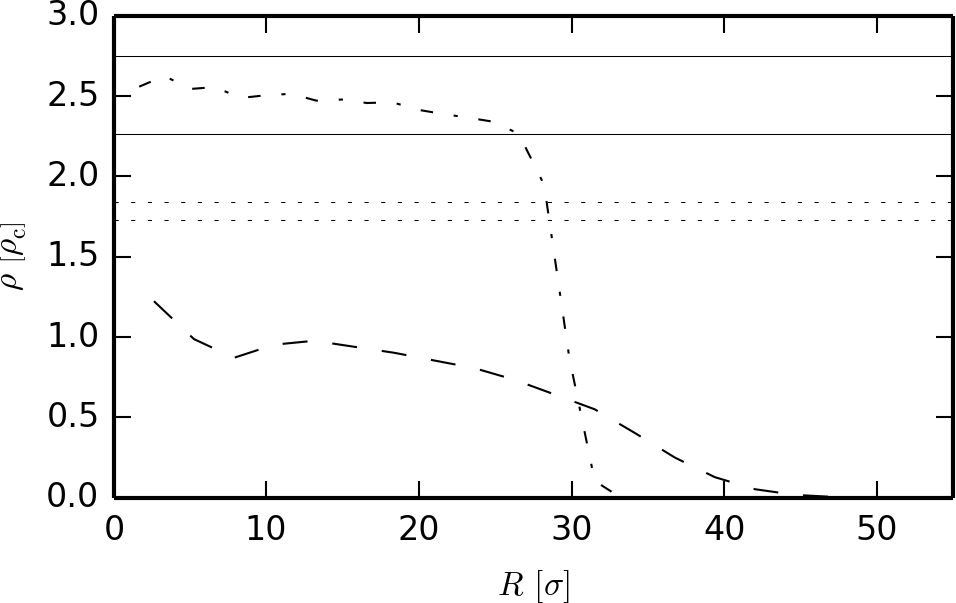
Figure 32 shows the densities of the “planetoids” as a function the radius of the simulations OPGs and PT3-2 with , and compares them to hydrogen laboratory data and values found in the Lagrange-Jacobi identity (Sect. 2.2).
The density of the OPGs “gaseous planetoid” is below that of a conventional solid or liquid. As their temperature is above the critical value (), super-molecules are not able to condense without the aid of gravity, and because of their high kinetic energy, are vibrating at much higher amplitudes. This leads to more space between the super-molecules and therefore a lower density compared to super-molecules below the critical temperature.
The density of the “gaseous planetoid” drops with increasing radius and hence does not qualify as a homogeneous sphere, but its average density is below the value of the Lagrange-Jacobi identity (Equ. 13), in accordance with Tab. 2 and Fig. 8 for “gaseous planetoids”.
The density of the PT3-2 “rocky planetoid” lies between the liquid and solid phase. There is no continuous density drop as for the OPGs simulation, the density remains stable up to almost the outer radius and the body can be approximated as a homogeneous sphere. Its density lies above in accordance with Tab. 2 and Fig. 8 for “rocky planetoids”.
5 Conclusions
We used analytic methods (Sect. 2) and computer simulations (Sects. 3-4) to study substellar fragmentation of fluids presenting a phase transition. The motivating astrophysical context are molecular clouds where H2 forms the bulk of the gravitating mass and is not very far from condensation conditions.
5.1 Analytic results
The study of the virial theorem, using the gravitational and the Lennard-Jones potential energies, has shown that there is a maximum temperature below which a fluid can fragment at arbitrary small masses. This temperature is an order of magnitude above the critical temperature. This shows, granted the right circumstances, that “comets” can form at a temperatures an order of magnitude larger than the critical temperature. In the case of H2, this maximum temperature lies in the range of – , depending on the solid crystalline structure.
A van der Waals fluid can be in three different states: gaseous, solid/liquid, or in a phase transition where the two phases coexist. The latter is defined as lying on the line of the Maxwell construct, where . A fluid is gravitationally unstable if an introduced perturbation has a wavelength above a certain value, which depends on . Since this quantity vanishes for a fluid presenting a phase transition, such a fluid is also gravitationally unstable.
5.2 Simulation results
We performed simulations using the state-of-the-art molecular dynamics simulator LAMMPS. We used super-molecules to simulate gravitational and molecular forces together with a computationally tractable number of particles.
5.2.1 Super-molecules
We tested the super-molecule concept thoroughly. We achieved good scaling for non-gravitational effects if the number of super-molecules is large enough (). The sticking point is to ensure that the molecular LJ forces are dominating the gravitational forces in close-range interactions. This is achieved by setting the number of super-molecules to be large enough so that the distance at which the two forces are equal is above the cut-off radius . For an H2 fluid this sets a maximum super-molecule mass equal to , limiting the total mass that can be simulated by the available computing power.
In principle, the super-molecule concept should not perfectly reproduce the time dependence of diffusive properties, as bigger particles introduce faster relaxation. But our experiments using different resolutions spanning several orders of magnitude did not reveal important modifications in the timings of major collapse and asymptotic evolution state. This enables us to study the fragmentation of large bodies, which we call “comets” and “planetoids”.
5.2.2 One-phase fluid
We applied a plane sinusoidal perturbation into a one-phase fluid with a temperature above the critical value. The results reproduce the ideal-gas Jeans instability: no collapse is seen for conditions below the Jeans criterion, while an exponential growth of the perturbation is observed for conditions above it.
As a result, the temperature rises, and small- and medium-sized “comets” form, some of which later merge into one big “planetoid”. An interesting observation is the mass distribution of these “comets”, which follows a power law for the small- and medium-sized ”comets”, while the “planetoid” and the largest “comets” follow a different power law.
5.2.3 Phase transition fluid
We simulated fluids with temperatures below the critical value and close to the effective phase transition for three different cases: without gravity, sufficiently, and weakly self-gravitating (above and below the ideal-gas Jeans criterion).
Because of the Maxwellian velocity distribution fluctuations, the non-gravitating fluids form small- and medium-sized “comets” until the potential and kinetic energy reach an equilibrium; thereafter they remain statistically stable. In the absence of any long-range force, no “planetoid” forms.
The self-gravitating fluids with a gravitational potential above the ideal-gas Jeans criterion do not react differently to a plane sinusoidal perturbation from a one-phase fluid: the perturbation grows exponentially and its temperature rises, and small- and medium-sized “comets” form, which ultimately merge into one “planetoid”.
The analysis predicts that fluids presenting a phase transition are unstable even if the gravitational potential alone is below the ideal-gas Jeans threshold. The performed simulations of weakly self-gravitating fluids in the phase transition regime did reproduce the prediction. Because of the weak nature of the gravitational potential, the timescale to see this reaction is two orders of magnitude longer than for sufficiently self-gravitating fluids, but, in the end, a big central “planetoid” forms anyway. While the out-of-phase transition fluids do not amplify perturbations, those in a phase transition indeed amplify them.
This study is general enough to be relevant for many astrophysical situations. In the case of H2 as main component, it concerns situations where temperature may drop well below , such as in cold molecular gas in the outer galactic disks, in expanding winds of planetary nebulae or supernovae, where cold substellar mass condensations are known to form, or in protoplanetary disks. Other molecules besides H2, such as CO, can condense even sooner, but as their mass fraction is low they should not significantly perturb the gravitational balance, while He should not condense at all and should keep a minimal amount of gaseous phase.eeeIn Safa & Pfenniger (2008) it was calculated that the mixture of He and H2 at cosmic abundance does not change the conclusion regarding the phase transition of H2 alone, as the species do not remain mixed when H2 alone condenses. The precipitation of formed “comets” and “planetoids” in a gravitational field, separating the gaseous and condensed phases, is also a fascinating aspect that is as yet impossible to capture with traditional hydrodynamical codes, but possible with the molecular dynamics approach. We will pursue further simulation work, including more specific astrophysical applications.
Acknowledgements.
This work is supported by the STARFORM Sinergia Project funded by the Swiss National Science Foundation. We thank the LAMMPS team for providing a powerful open source tool to the scientific community. We thank the referee for a thorough reading of the manuscript and constructive comments, which substantially improved the paper.References
- Air Liquide (1976) Air Liquide. 1976, Gas Encyclopedia (Editor Elsevier)
- Allamandola et al. (1999) Allamandola, L. J., Bernstein, M. P., Sandford, S. A., & Walker, R. L. 1999, Space Science Reviews, 90, 219
- Binney & Tremaine (2008) Binney, J. & Tremaine, S. 2008, Galactic Dynamics: Second Edition
- Bolatto et al. (2013) Bolatto, A. D., Wolfire, M., & Leroy, A. K. 2013, Annual Review of Astronomy and Astrophysics, 51, 207
- Buch & Devlin (1994) Buch, V. & Devlin, J. P. 1994, The Astrophysical Journal Letters, 431, L135
- Burkert & O’dell (1998) Burkert, A. & O’dell, C. R. 1998, The Astrophysical Journal, 503, 792
- Carey (1999) Carey, V. P. 1999, Statistical Thermodynamics and Microscale Thermophysics (Cambridge University Press)
- Clausius (1870) Clausius, R. 1870, Annalen der Physik, 217, 124
- Clerk-Maxwell (1875) Clerk-Maxwell, J. 1875, Nature, 11, 357
- Combes & Pfenniger (1997) Combes, F. & Pfenniger, D. 1997, Astronomy and Astrophysics, 327, 453
- Dissly et al. (1994) Dissly, R. W., Allen, M., & Anicich, V. G. 1994, The Astrophysical Journal, 435, 685
- Draine (2011) Draine, B. T. 2011, Physics of the Interstellar and Intergalactic Medium
- Elmegreen & Scalo (2004) Elmegreen, B. G. & Scalo, J. 2004, Annual Review of Astronomy and Astrophysics, 42, 211
- Ewald (1921) Ewald, P. P. 1921, Annalen der Physik, 369, 253
- Grenier et al. (2005) Grenier, I. A., Casandjian, J.-M., & Terrier, R. 2005, Science, 307, 1292
- Hockney & Eastwood (1981) Hockney, R. W. & Eastwood, J. W. 1981, Computer Simulation Using Particles
- Jeans (1902) Jeans, J. H. 1902, Royal Society of London Philosophical Transactions Series A, 199, 1
- Johnston (2014) Johnston, D. C. 2014, ArXiv e-prints, 1402, 1205
- Jones (1924) Jones, J. E. 1924, Royal Society of London Proceedings Series A, 106, 463
- Kondepudi & Prigogine (1998) Kondepudi, D. K. & Prigogine, I. 1998, Modern thermodynamics: from heat engines to dissipative structures (John Wiley)
- Kristensen et al. (2011) Kristensen, L. E., Amiaud, L., Fillion, J.-H., Dulieu, F., & Lemaire, J.-L. 2011, Astronomy & Astrophysics, 527, A44
- Langer et al. (2010) Langer, W. D., Velusamy, T., Pineda, J. L., et al. 2010, Astronomy and Astrophysics, 521, L17
- Lekner (1982) Lekner, J. 1982, American Journal of Physics, 50, 161
- Paradis et al. (2012) Paradis, D., Dobashi, K., Shimoikura, T., et al. 2012, Astronomy and Astrophysics, 543, 103
- Pfenniger (2004) Pfenniger, D. 2004, in IAU Symposium, Vol. 220, Dark Matter in Galaxies, ed. S. Ryder, D. Pisano, M. Walker, & K. Freeman, 241
- Pfenniger & Combes (1994) Pfenniger, D. & Combes, F. 1994, Astronomy and Astrophysics, 285, 94
- Pfenniger et al. (1994) Pfenniger, D., Combes, F., & Martinet, L. 1994, Astronomy and Astrophysics, 285, 79
- Planck Collaboration et al. (2011) Planck Collaboration, Ade, P. A. R., Aghanim, N., et al. 2011, Astronomy and Astrophysics, 536, 19
- Plimpton (1995) Plimpton, S. 1995, Journal of Computational Physics, 117, 1
- Safa & Pfenniger (2008) Safa, Y. & Pfenniger, D. 2008, European Physical Journal B, 66, 337
- Sahai & Nyman (1997) Sahai, R. & Nyman, L.-A. 1997, The Astrophysical Journal Letters, 487, L155
- Sandford & Allamandola (1993) Sandford, S. A. & Allamandola, L. J. 1993, The Astrophysical Journal Letters, 409, L65
- Tuckerman et al. (1992) Tuckerman, M., Berne, B. J., & Martyna, G. J. 1992, Journal of Chemical Physics, 97, 1990
- van der Waals (1910) van der Waals, J. D. 1910, Koninklijke Nederlandse Akademie van Wetenschappen Proceedings Series B Physical Sciences, 13, 1253
- Walker (2013) Walker, M. A. 2013, Monthly Notices of the Royal Astronomical Society, 434, 2814
- Walsh & Meaburn (1993) Walsh, J. R. & Meaburn, J. 1993, The Messenger, 73, 35
- Weinberg (1972) Weinberg, S. 1972, Gravitation and Cosmology: Principles and Applications of the General Theory of Relativity
