Acoustic emission signals resulting from the drying induced fractures of Phyllostachys Pubescens bamboo, Evidence of scale free phenomena
Abstract
I have performed experimental measurements of acoustic emission signals resulting from the drying process of Phyllostachys Pubescens bamboo. The emphasis was on identifying individual events, and characterize them according to their time span and energy release. My results show a histogram of experimental squared voltage distributions nicely fit into a power law with exponent of , reminiscent of scale free phenomena. I have also calculated the average signal shape, for different time spans of the system, and found an asymmetrical form. The experimental evidence points to the system having an isolated large crack at the beginning of the simulation.
1 Introduction
Bamboo is a giant grass, with remarkable mechanical characteristics 111Values of the elastic modulus of the fiber cell wall of either 10.4 [13] or 16.1 [12]have been reported in the literature. Nonetheless, as it is a natural material, its drying requires special care in order to prevent the cracking due to dessication [5]. In some aspects Bamboo drying is similar to wood drying: there is a first fast drying stage, in which free water is removed from the plant; followed by a slow stage in which bond water, from within the cell walls, has to be removed [11]. The main difference between drying this two natural materials comes from the structure of their tissues. Unlike wood, bamboo has a special direction, the culm, along which different tissues are aligned: its fibers, conductive material and parenchymatous tissues [3].
Very few research groups have studied the relationship between shrinkage and fracturing in bamboos. Overall shrinkage of bamboo canes can be attributed to the shrinkage of the fiber-phloem bundles, as well as to the shrinkage of parenchyma tissue. In the latter, the collapse of cells can be an important factor. Obataya et. al. have shown how the slow drying process can lead to the collapse of Arundo donax cane, [7, 6]. Those authors claim that an slow drying schedule increases the intensity of collapse.
On a more general fracture case, Habibi and Lu have studied the path followed by different cracks within the bamboo culm, by means of micro indentation experiments as well as tensile tests [2]. Interestingly, the micro crack grows mainly in the interface between the parenchyma cells. When the crack reaches a fiber it is sometimes possible for it to continue within the fiber, again in the interfaces between fiber cells. They have also shown how the voids within the bamboo have an effect of crack grow deflection and crack tip energy absorption.
I would expect a different path of growth for dessication induced fractures compared to indentation; as drying stresses are more homogeneous, not having a unique defined direction of deformation. My attempts to look for the fracture in the surface proved futile; which may be caused by fractures being smaller than the resolution of my optical microscope, or by them being inside of the samples themselves [9]. Then, the problem calls for a different way to characterize the fracture evolution during drying, so I turned the research focus into acoustic emission. As fractures are created at every scale, some of the energy is released in the form of an acoustic wave.
In the present letter I have characterized the dessication induced fractures in bamboo Phyllostachys Pubescens. To do so, I performed drying experiments in which I recorded the acoustic signal produced by the sample. Since it was not subject to any other strain, it is safe to assume that the sounds are generated by the dessication induced strains. The goal of this measurement is to obtain information about the drying induced fractures. The hypothesis being that the average shapes of fractures, the distributions of energy released in an avalanche event, and also the waiting times between avalanches; all have useful information about the process of the drying induced fracturing.
The organization of the paper is as follows. In section 2 I describe the experiments, materials and methods used. In Section 3 I will present my results and conclusions.
2 Materials and Methods
Two kinds of experiments were performed, namely, on characterizing the process of drying and on characterizing the acoustic emissions. For the former I measured the weight as a function of drying time. For the latter, I measured the acoustic emission resulting from the drying process.
| Label | Number of Samples | Length |
|---|---|---|
| Sample 0 | 4 | |
| Sample 1 | 1 | |
| Sample 2 | 10 |
2.1 Materials
Bamboo samples were prepared from a 4 year old culm Phyllostachys Pubescens, harvested on June 2011, from Friedrich Eberts’ plantation in Chiavari, Italy. Three sets of inter-node cut samples were labeled and prepared, as shown in the table. On Sample , I performed drying experiments aimed to characterize the likelihood of collapse and fracture. On Sample 1, I took the weight measurements during drying, in order to characterize the speed of drying. Finally, on Sample 2, I measured the acoustic emission of breaking events during drying. Between measurements the samples were kept on a climate controlled room, with relative humidity of 80%, to minimize the amount of drying happening before the oven treatment. I performed the drying experiments using a SalvisLAB Pantatherm D oven.
2.2 Methods
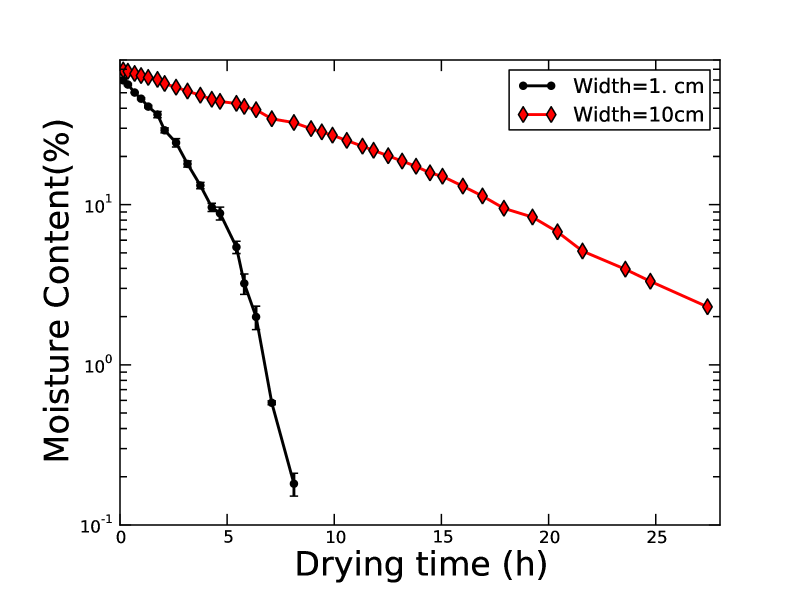
Two sets of experiments were performed. First, for the characterization of the speed of drying, inter-nodal bamboo samples of width were dried in the oven at a set temperature of . In this experiment the percentage of weight loss of the bamboo samples as function of time was monitored; and later averaged to build the plot.
The second set of experiments characterized the intensity of the microscopic cracks by measuring their acoustic emission during drying. The drying temperature was again , and the digitization was performed using a standard condenser microphone and a digital sound card at a rate of 9600 bps. The voltage on the microphone is proportional to the energy released as acoustic waves. After the recording, the whole data set was screened to check for noise coming not from the drying specimen.
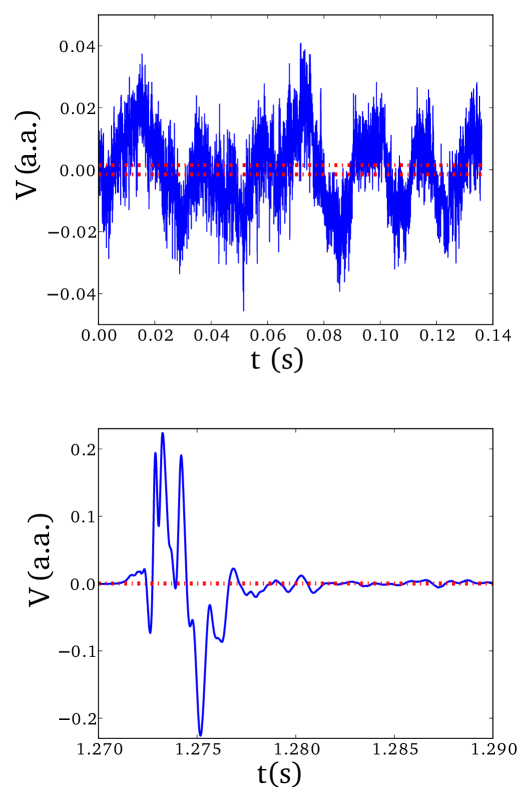
The recording took place during the first 3 hours of drying. Background noise, both acoustic and from the electronics, was filtered by means of setting a minimum threshold for recording a voltage signal (See Fig. 1). Experiments were performed overnight, to reduce the amount of noise from the environment. Later on, the recordings were split in samples; I listened to each one of them in order to exclude the sections of the recording that presented strong noises, probably arising from the oven. Finally, the signals were converted in text files.
Now, I claim that the continuous acoustic emission events can be interpreted as produced by the breaking of bamboo structures; be them fibers, conductive materials or parenchyma. Therefore they are be called indistinctly crack events or acoustic events. A single event is defined as a continuous signal that lies above the minimum recording threshold.
Since my objective is the characterization of the fracture process, the exact relationship between the voltage measured by the microphone and the amplitude of the original sound wave in does not need to be explicitly known. Moreover, this calibration is a quite complex process, that involves the electronics of the sound card and the software of the computer used to the recording (OS X, a proprietary and closed source operating system by Apple Inc.). Therefore I will report my experiments in arbitrary units of amplitude: , and its square is in arbitrary units of energy, .
3 Results and Discussion
3.1 Speed of drying experiments
The average of the weight of the bamboo samples as function of drying time is shown in Fig. 2. Let me focus first on the black dots. It seems like there is a linear trend in the semi-log graph for the first three hours of drying. This can be related to a rate process, which can be the removal of the free water (filling the interior of the cells, not chemically bounded). This is followed by a slowest drying phase, between hours three and eight. This may be due to the removal of the bound water (from inside the cell walls, chemically bounded). The thicker samples (red diamonds) only show the first stage, but the moisture content has not fallen below 2%, so there is still bond water in the sample.
3.2 Energy release histograms and waiting times
The study of fracture phenomena can be tackled from different disciplines. From the point of view of critical phenomena and statistical mechanics, fracture is seen as a series of bursts; whose size and temporal evolution characterizes the phenomena. Recently Papanikolau et. al. have taken the Barkhausen noise and studied the functional form of the noise emitted by the avalanches [8]. Besides the signal average shape, they present voltage distributions, power spectrums, and distribution of avalanche sizes and durations . Their avalanche size histogram shows a power law distribution at small sizes, followed by a tail.
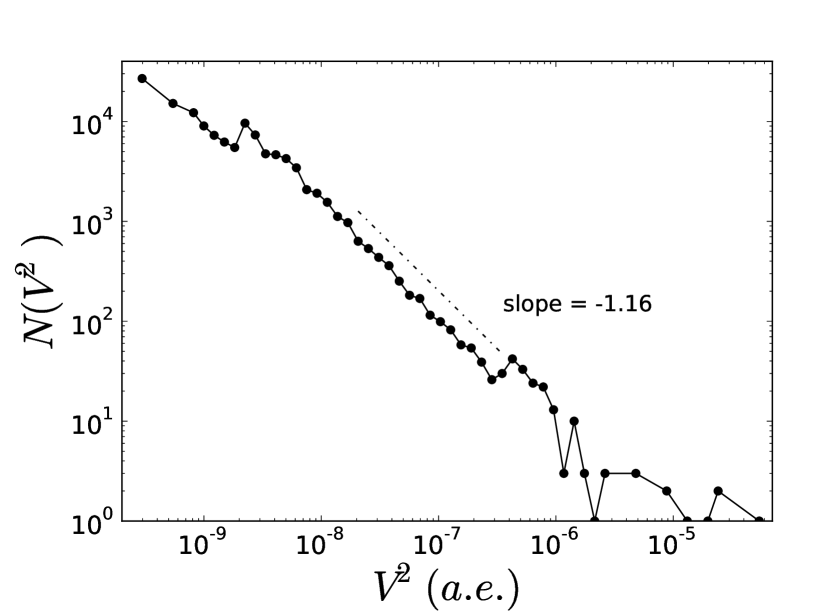
In the present case, Fig. 3 shows the probability distribution of the square of the voltage recorded by the microphone, which is proportional to the energy liberated in the fracture. A power law distribution of avalanche sizes is one indicative of scale free behavior, as seen for instance in the Gutenberg-Richter law of avalanches, and in the Barkhausen noise; even though the mechanisms that generate the fractures at different scales, there is not a single size of fracture that rules the breaking phenomena. In this case the distribution of the square of the sizes follows a power law (which is proportional to the energy released in the fracture event),
| (1) |
with an exponent of . It is interesting to notice that the power law seems to fit for three decades. In the present system small fractures and large ones correspond to different kind of tissues, and can be caused by accumulation or by direct strain; so it is not at all self evident that the fracture distribution has to be a power law.
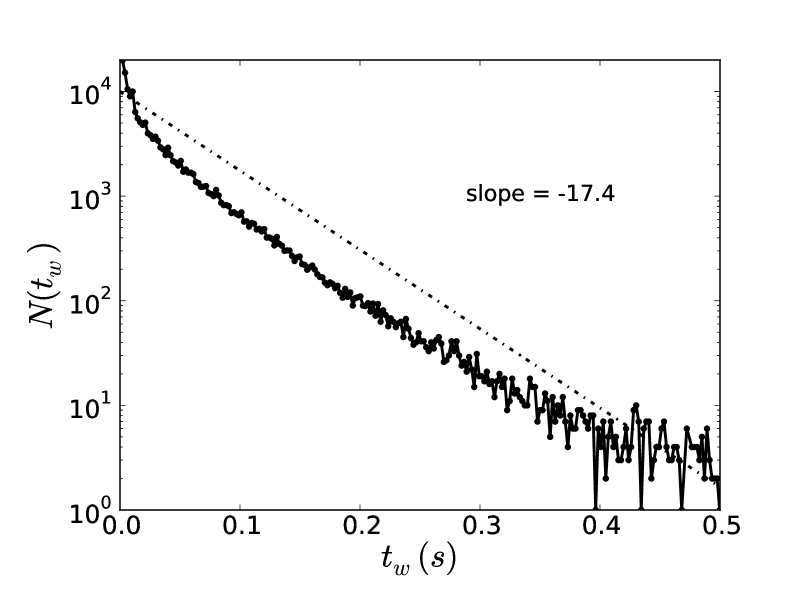
A second characteristic measurement that can give insight into avalanche processes is the waiting times between avalanches. For earthquakes this distribution is known to follow a unified scaling law, mostly a power-law with a decaying exponential tail [1]. In the present study, on the contrary, waiting times between avalanches show an exponential decay behavior; as can be seen in Fig. 4. In this case the time constant is . The difference with the earthquake case can be explained from the fact that in this system the allowed number of cracks is reduced as there are a finite number of elements to crack or delaminate; while for earthquakes the possible number of rearrangements and fractures is orders of magnitude larger. In this way, this system is closer to the granular materials. In a recent paper, Michlmayr and Or have studied the relation between the grain-scale mechanical interactions in sheared granular materials and the generated acoustic emission characteristics [4]. Their implementation of a damage accumulation fiber bundle model (similar to the one by Kun et. al), shows an exponential decay of the number of events as function of the energy (their Fig. 3, inset); which is the analogous of the waiting times for that system.
3.3 structure of energy release
To further characterize the structure of the avalanches, I want to know when do the big avalanches occur with respect to the start of the drying process; as well as whether large energy release indeed means long avalanches. For the former question, to identify the evolution of energy release, the size of the avalanche is averaged over 5 second sound intervals and plotted as function of the number of the sound interval; and can be seen in Fig. 5. It is possible to identify two stages, early and late, separated by the sound interval number . In the first stage the intensity is a large and decreasing quantity. At the late stage, there is a steady increase of the size of the avalanches as a function of time. The black lines represent the error bars.
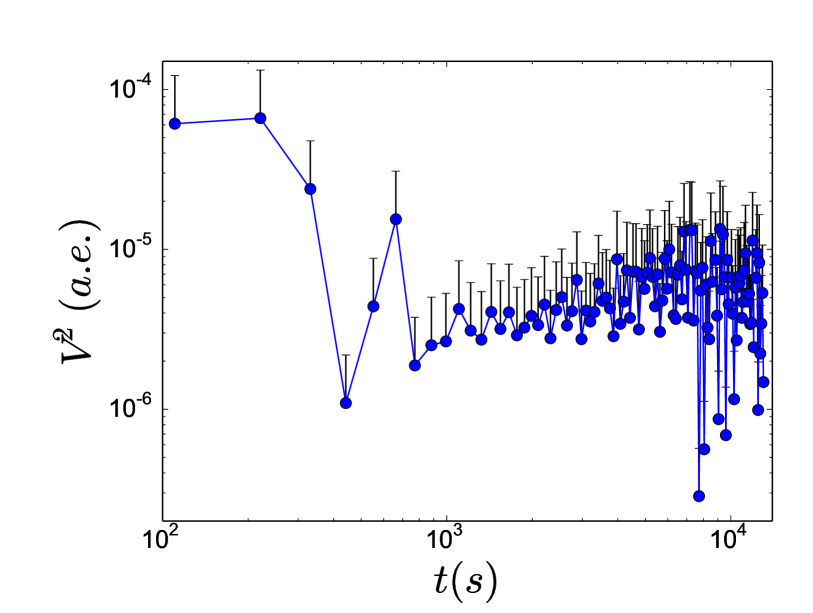
A possible explanation for the shape of this graph: large values for short times, followed by a steady increase is this: Initially, the drying process generates large fractures; creating free surfaces in a fast process. The presence of this free surfaces hinders the appearance of large cracks. After this follows a second phase, in which further fractures may happen mainly for stress accumulation. This two behaviors are seen in other computational models [10]. In that previous work, that I did with other collaborators, we shown how the statistics of bursts of breaking events in the case of shrinkage of a thin layer of 2D material could suggest the presence of an underlying critical point. In that case, the two states are related to the way the fracture is created, either by coalescence of micro-cracks or by the appearance of a large isolated crack that spanned the sample.
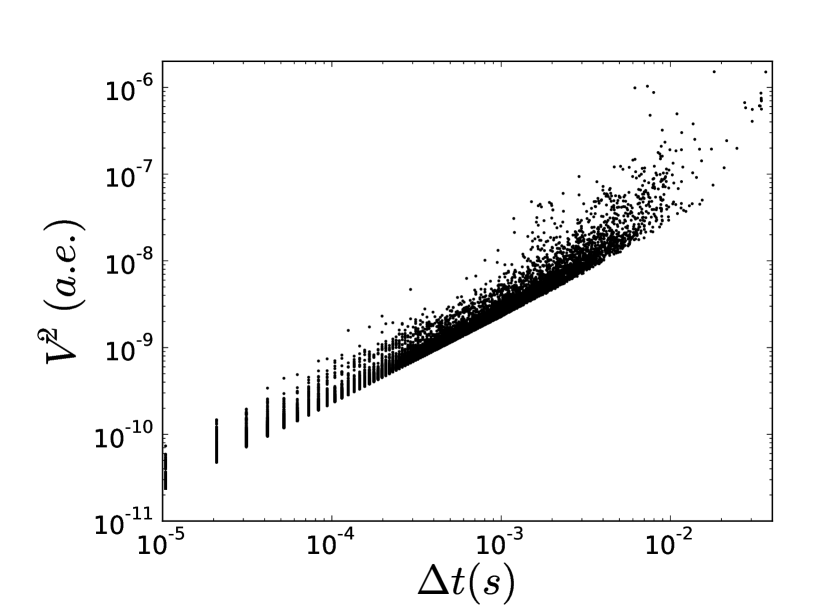
To show the relationship between the size of the avalanches and its duration, I present the correlation between the amount of released energy in an event and its time span in Fig. 6 as an scatter plot. The lower cutoff comes from the imposed threshold of measurement. The discreetness in time span values is a consequence of the sound sampling rate of the acquisition transducer. Clearly, there is more dispersion on the crack events that take longer and release a larger amount of energy, while the distribution narrows for shorter times. Furthermore it is clear that the relationship between energy release and time span can be fitted to a power law spanning several decades.
3.4 Shape of the acoustic emission events
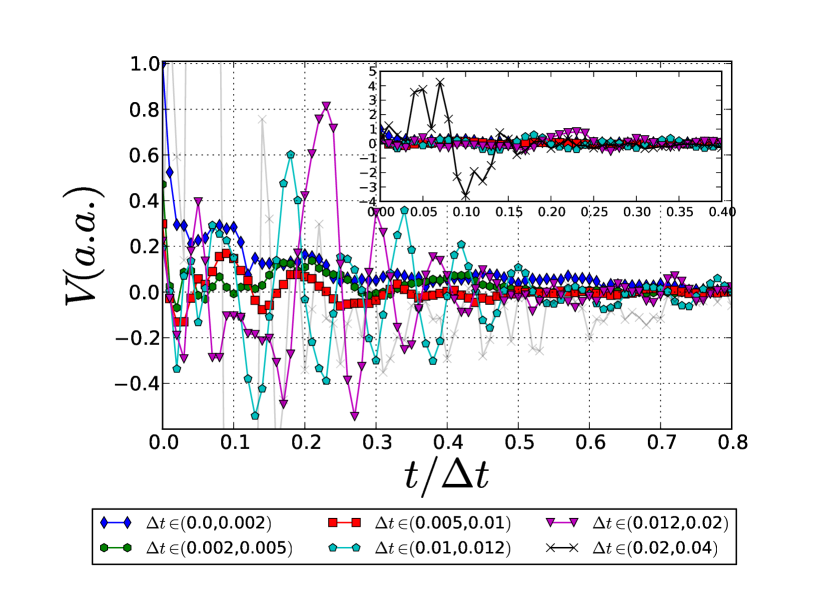
A final way to characterize the process is to study the average shape of the acoustic emission signal, for different sizes. Knowing which shape do small and large avalanches have can be useful to identify the kind of process that generates this fractures. As a matter of fact, in a previous paper [8] showed a temporal average avalanche shape, rescaled to unit height and duration, has a parabolic shape for small avalanches, that flattens towards a unit pulse shape for longer avalanches; in the case of Barkhausen noise.
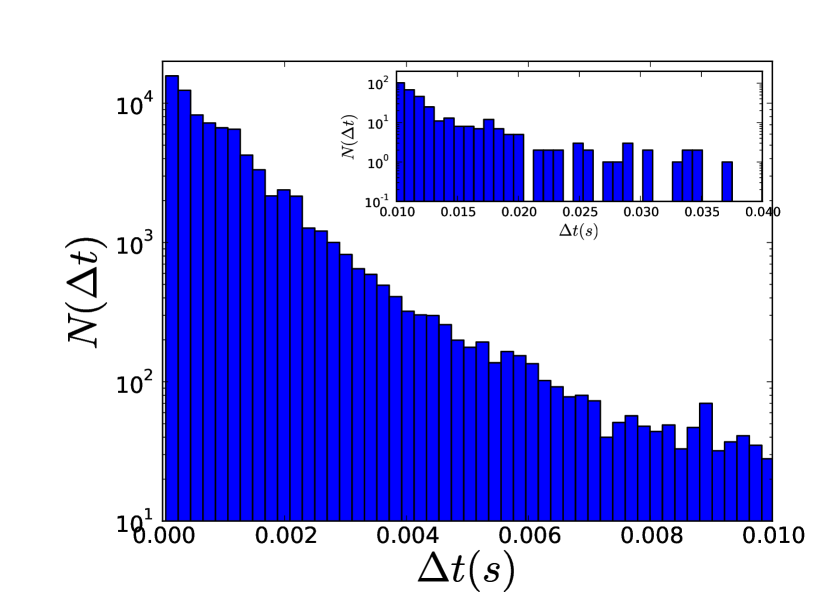
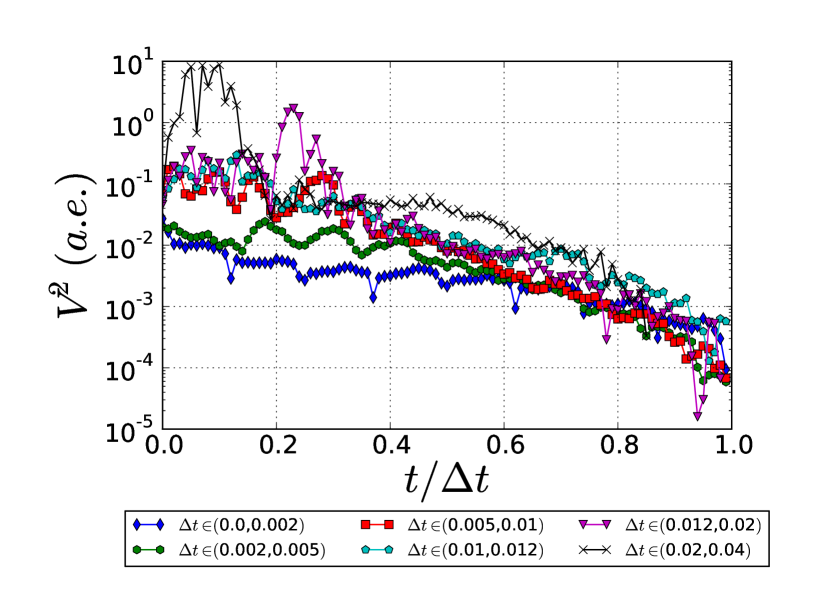
To define the intervals that correspond to avalanches of similar size, I performed an histogram of the duration of avalanche events, Fig. 7. The number of avalanches varies over 4 orders of magnitude. In view of this, I hand picked six intervals: ,,,, and . Roughly speaking the first three correspond to the most populous bins ( to fractures), short avalanches; and the latter to the large avalanches, more than .
Fig. 8 shows the average avalanche shape for the different bins, as a function of the normalized time span. In the main plot I show the first five averaged signals, with the longest avalanches are shown, but faintly; while in the inset all the six averaged signals can be seen. Unlike the Barkhausen effect case from the literature, [8] in which there is clear symmetry; in this case most of the signals are not symmetrical: there is a large peak followed by a decay. This can be seen in all intervals but one (). In my view, the asymmetrical shape shape hints for the phenomenon to be that of a single breaking event, and the decay in the signal corresponds to attenuation of the noise. Short signals would correspond to small (or weaker) elements, as parenchymatous tissue; while long signals to larger (or stronger) elements, as fiber cells. Going back to the average signal in the range , the symmetrical shape here would pinpoint to a different mechanism, namely the correlated breaking of similarly sized elements; a self induced growth process in which a breaking triggers similar events. In terms of the energy, in Fig. 9 it can be seen that the average shape of the largest avalanches has a peak of energy dissipation which is almost two orders of magnitude larger than that of the medium and small size avalanches. Would be interesting to test whether this is caused by the composite nature of the bamboo, or is rather the result of the dynamics of the avalanche formation; and would occur also on a more homogeneous material.
4 Conclusion
The experimentally measured acoustic emission signals resulting from drying of bamboo Phyllostachys Pubescens shows evidence of free-scale phenomena. Firstly, the histogram of experimental squared voltage distributions nicely fit into a power law with exponent of ; while the experimental waiting times do not follow a power law, rather an exponential of slope possibly due to the finite size of the system. Secondly, the scatter plot of energy as function of avalanche time span also shows a power law that spans over 4 orders of magnitude. I have also studied the average avalanche shape, and found that both short and large avalanches have an asymmetrical shape with a peak at the beginning. This implies that for those cases there is mainly a single crack event. For medium sized fractures, on the other hand, I have found a more symmetrical shape; which could be attributed to fracture growth by a self reinforced process.
The main question that rests to be answered is whether this behavior is particular to the drying of bamboos; or can be found in other materials. This can be studied easily from numerical simulations; which is what I plan to accomplish in the future.
Acknowledgments
This work was funded partly by the “Departamento Administrativo de Ciencia, Tecnologìa e Innovación de Colombia (COLCIENCIAS)” (Convocatoria Doctorados Nacionales 2008) and by the Computational Physics for Building Materials, from Prof. Hans Herrmann at the Institute for Building Materials, ETH-Zürich. I want to thank Ferenc Kun and José D. Munõz for helpful ideas and comments. This work could not have been done without the help of Miller Mendoza, Julian Schrenk and Nuno Araujo; with whom I had enlightening conversations about the system and the measurement process. They also drove me to pick up the bamboo samples from Frederic Eberts’ forest in Chiavari, Italy (www.bambus.de), and transported us back to the ETH.
References
- [1] Per Bak, Kim Christensen, Leon Danon, and Tim Scanlon. Unified scaling law for earthquakes. Phys. Rev. Lett., 88:178501, Apr 2002.
- [2] Meisam K Habibi and Yang Lu. Crack propagation in bamboo’s hierarchical cellular structure. Scientific reports, 4, 2014.
- [3] Julius J.A. Janssen. Bamboo in building structures. PhD thesis, Eindhoven University, 1981.
- [4] Gernot Michlmayr and Dani Or. Mechanisms for acoustic emissions generation during granular shearing. Granular Matter, 16(5):627–640, 2014.
- [5] Jorge Augusto Montoya Arango. Trocknungsverfahren f r die Bambusart Guadua angustifolia unter tropischen Bedingungen. PhD thesis, Universit t Hamburg, Von-Melle-Park 3, 20146 Hamburg, 2006.
- [6] Eiichi Obataya, Joseph Gril, and Patrick Perré. Shrinkage of cane (arundo donax) ii. effect of drying condition on the intensity of cell collapse. Journal of Wood Science, 51(2):130 – 135, 2005.
- [7] Eiichi Obataya, Joseph Gril, and Bernard Thibaut. Shrinkage of cane ( Arundo donax) I. Irregular shrinkage of green cane due to the collapse of parenchyma cells. Journal of Wood Science, 50:295–300, 2004. 10.1007/s10086-003-0578-y.
- [8] Stefanos Papanikolaou, Felipe Bohn, Rubem Luis Sommer, Gianfranco Durin, Stefano Zapperi, and James P Sethna. Universality beyond power laws and the average avalanche shape. Nature Physics, 7(4):316–320, 2011.
- [9] Gabriel Villalobos. A statistical model of fracture due to drying in Bamboo Guadua Angustifolia. PhD thesis, Universidad Nacional de Colombia, 2012.
- [10] Gabriel Villalobos, Ferenc Kun, and José D. Muñoz. Effect of disorder on temporal fluctuations in drying-induced cracking. Phys. Rev. E, 84:041114, Oct 2011.
- [11] H. Q. Yu, Z. H. Jiang, C. Y. Hse, and T. F. Shupe. Selected physical and mechanical properties of moso bamboo (Phyllostachys pubescens). Journal of Tropical Forest Science, 20(4):258–263, 2008.
- [12] Yan Yu, Benhua Fei, Bo Zhang, and Xiang Yu. Cell-Wall Mechanical Properties of Bamboo Investigated by In-Situ Imaging Nanoindentation. Wood and Fiber Science, 39(4):527 – 535, October 2007.
- [13] Linhua Zou, Helena Jin, Wei-Yang Lu, and Xiaodong Li. Nanoscale structural and mechanical characterization of the cell wall of bamboo fibers. Materials Science and Engineering: C, 29(4):1375 – 1379, 2009.