X-ray Properties of Low-Mass Pre-main Sequence Stars in the Orion Trapezium Cluster
Abstract
The Chandra High Energy Transmission Gratings (HETG) Orion Legacy Project (HOLP) is the first comprehensive set of observations of a very young massive stellar cluster which provides high resolution X-ray spectra of very young stars over a wide mass range (0.7 - 2.3 ). In this paper, we focus on the six brightest X-ray sources with T Tauri stellar counterparts which are well-characterized at optical and infra-red wavelengths. All stars show column densities which are substantially smaller than expected from optical extinction indicating that the sources are located on the near side of the cluster with respect to the observer as well as that these stars are embedded in more dusty environments. Stellar X-ray luminosities are well above erg s-1 , in some cases exceeding erg s-1 for a substantial amount of time. The stars during these observations show no flares but are persistently bright. The spectra can be well fit with two temperature plasma components of 10 MK and 40 MK, of which the latter dominates the flux by a ratio 6:1 on average. The total EMs range between 3 - 8 cm-3 and are comparable to active coronal sources. Limits on the forbidden to inter-combination line ratios in the He-Like K-shell lines show that we observe a predominantely optically thin plasma with electron densities below cm-3. Observed abundances compare well with active coronal sources underlying the coronal nature of these sources. The surface flux in this sample of 0.6 to 2.3 classical T Tauri stars shows that coronal activity and possibly coronal loop size increase significantly between ages 0.1 to 10 Myrs.
1 Introduction
The Orion Nebula Cluster (ONC) is a complex stellar formation region that hosts a variety of young stellar objects in terms of mass, age, configuration and evolutionary stages. The cluster is part of the Orion A molecular cloud which is host to a hierarchical structure of ongoing star formation cells (Bally, O’Dell & McCaughrean, 2000). The part of the ONC we generally refer to is a somewhat older formation bubble located at the foreground of the main molecular cloud. Its massive stars as members of the Orion Trapezium - Ori C and Ori A - are the main sources of illumination and ionization of the Orion Nebula (M42). The ONC hosts one of the largest assembly of young stars in Orion with about 80 of its members being younger than 1 Myrs. There are over 3000 stars in the immediate vicinity of the Orion Trapezium leading to an average stellar density of about 250 stars per pc3 within a radius of about 3 pc. About 1600 stars are optically observed and have been classified to some limited extent through spectroscopic and photometric measurements (Hillenbrand, 1997). Over 2000 stars have been observed in the IR band with 2MASS (Skrutskie et al., 2006) and ground based surveys (Muench et al., 2002; Robberto et al., 2010).
X-rays from Orion and specifically the ONC were first discovered with Uhuru (Giacconi et al., 1972) as the bright X-ray source 3U0527-05. Half a decade later observations with the ANS satellite suggested a more extended emission region and it was first suggested that the X-rays are emission from coronae around T Tauri stars (den Boggende et al., 1978). This suggestion was finally confirmed by the Einstein (Feigelson & Decampli, 1981) and ROSAT (Gagne, Caillault & Stauffer, 1995) X-ray Observatories. But it was the Chandra X-ray Observatory launched in 1999 that provided the bulk of our current knowledge of X-ray detections, identifications, and basic spectral properties. The Chandra Orion Ultradeep Project (COUP, Feigelson et al. 2005) detected 1600 X-ray stars and measured column densities, source fluxes, and basic X-ray spectral and photometric parameters (Getman et al., 2005).
X-ray emissions from young pre-main sequence (PMS) stars with masses 0.1 to about 2 have 105 times the flux than stars on the main sequence. The bulk of emissions in PMS stars is in the optical band. The ratio of X-ray to bolometric luminosity in these stars lies between 10-4 and 10-3, close or at the saturation threshold. Studies of the X-ray emissions are specifically sensitive to coronal activity and to some extent - in conjunction with UV emissions - to stellar surface shocks from accretion. In fact, studies within the last two decades revealed that while these X-rays are primarily attributed to enhanced coronal activity of the star itself, many of these young PMS stars also generate X-rays through accretion from a protostellar disk (Kastner et al., 2002, 2004; Schmitt et al., 2005; Günther et al., 2006; Argiroffi, Maggio & Peres, 2007). The cases of TW Hya, BP Tau, V4046 Sgr, and MP Mus - all are known to be older classical T Tauri stars (CTTS) - are indeed quite enigmatic because here the bulk of the X-ray emission is observed below 1.5 keV (above 8 Å) with peculiar line ratios indicative of accretion shock emissions. CTTS by definition exhibit strong hydrogen Balmer (H) emissions and show stong IR excess emissions up to 100 microns indicating the presence of active accretion disks. X-ray studies of the Taurus region also indicate that accretion signatures are present in CTTS (Telleschi et al., 2007; Audard et al., 2007). The stars mentioned above are the best studied CTTS in X-rays today. In contrast, most PMS stars, CTTS and older weak-lined T Tauri stars (WTTS), are X-ray bright due to active coronae. Kastner et al. (2004) clearly showed that coronal emissions are primarily responsible for the WTTS HID98890, Telleschi et al. (2007) showed that many CTTS have hard spectra with substantial emissions up to 10 keV, which are definitely not due to accretion shocks.
Evidence that most CTTS have X-ray spectra dominated by hard emission and produced by coronal activity comes from very young stellar clusters and specifically the ONC as the closest massive cluster to the Sun. Chandra observations of many young clusters in the stellar neighborhood revealed thousands of X-ray sources, most of them CTTS, with X-ray spectra as hard as 2 - 3 keV (Feigelson et al., 2005; Wolk et al., 2002; Rho et al., 2004; Townsley et al., 2011). In the ONC Preibisch et al. (2005) showed that in a COUP sample of 600 X-ray sources. which are reliably identified with optically well characterized T Tauri stars, the plasma temperatures obtained from the X-ray spectra not only are much hotter than usually observed in main sequence stars but also show correlations related to coronal activity. Most details of coronal properties in PMS stars are still unknown as well as its evolution towards a much quieter state when these stars reach the main sequence.
In this paper we present an in-depth analysis of the X-ray properties of six classical T Tauri stars in the ONC for which we have sufficient spectral data. These stars are some of the brightest and most active CTTS in the COUP sample described by Preibisch et al. (2005).
2 Observations and Data Reduction
The Orion Trapezium was observed with the Chandra high energy transmission grating spectrocmeter HETGS (Canizares et al., 2005) seventeen times between 1999 and 2008. Table 1 summarizes the observing parameters and exposures. While most observations were performed by pointing towards the brightest Orion star Ori C (RA: 05:35:16.46, Dec: -05:23:22.85), some pointings were up to 1.5’ off that direction. Since the six PMS stars we focus on here are within 40” of Ori C, this created some very unfavorable combinations of off-axis angles and roll angle overlaps. Specifically OBSIDs 4473 and 4474 are severely affected and we omit the latter from the analysis. In OBSID 4473 we only have useful spectra for V1399 Ori. Note, the count rate in Table 1 only shows the cumulative rates of all six sources after spectral cleaning (see below). While the total exposure of all observations is about 585 ks, at the end only 250 ks on average are available for each of the six stars in the sample analyzed here.
| ObsID | Start Date | Start Time | Exposure | rate† |
|---|---|---|---|---|
| [UT] | [h:m:s] | [ks] | 10-1 c/s | |
| 3 | 1999 Oct 31 | 05:46:18 | 49.482 | 3.9 |
| 4 | 1999 Nov 24 | 05:36:51 | 30.914 | 1.5 |
| 2567 | 2001 Dec 28 | 12:24:53 | 46.357 | 2.9 |
| 2568 | 2002 Feb 19 | 20:28:38 | 46.334 | 2.4 |
| 4473 | 2004 Nov 3 | 01:47:00 | 49.119 | 0.3 |
| 7407 | 2006 Dec 3 | 19:06:43 | 24.633 | 1.6 |
| 7410 | 2006 Dec 6 | 12:10:32 | 13.067 | 2.4 |
| 7408 | 2006 Dec 19 | 14:16:25 | 24.862 | 2.4 |
| 7409 | 2006 Dec 23 | 00:46:36 | 27.086 | 2.1 |
| 7411 | 2007 Jul 27 | 20:40:17 | 24.631 | 0.7 |
| 7412 | 2007 Jul 28 | 06:15:04 | 24.834 | 0.9 |
| 8568 | 2007 Aug 6 | 06:53:03 | 35.860 | 1.1 |
| 8589 | 2007 Aug 8 | 21:29:30 | 50.402 | 1.5 |
| 8897 | 2007 Nov 15 | 10:02:11 | 23.644 | 1.3 |
| 8896 | 2007 Nov 30 | 21:57:29 | 22.657 | 1.3 |
| 8895 | 2007 Dec 7 | 03:13:02 | 24.851 | 1.5 |
sum of 1st order dispersed count rates for all six sources.
All observations were reprocessed using CIAO4.6 with the most recent CIAO CALDB products. We used standard wavelength redistribution matrix files (RMF) and generated effective areas (ARFs) using the provided aspect solutions 111see http://asc.harvard.edu/ciao/threads/. Note that for the HETGS spectra the RMF is fairly independent of focal plane temperature, however the order sorting has to be adjusted to the different pulse height distributions of the CCD at -110 C in OBSIDs 3 and 4. Here we followed the steps applied in the data reduction for the Trapezium stars described in previous analyses using these data sets (Schulz et al., 2000, 2006). For all the HETGS observations we generated spectra and analysis products for the medium energy gratings (MEG) +1 and -1 orders, as well as for the high energy gratings (HEG) +1 and -1 orders.
![[Uncaptioned image]](/html/1503.04366/assets/x1.png)
Plots of grating dispersion (tgmlam) versus CCD array pulse height channels (energy) for one OBSID for MEG (left) and HEG (right). The source dispersion of the bright star MT Ori (red) overlaps significantly with another source (black) rendering the MEG portion unuseable.
A crowded field of stars and observations at various different roll and off-axis angles create additional challenges in the proper spectral data extraction. In order to clean the data there are several steps to consider. These are described in detail in Huenemoerder et al. (2009) for the extraction of the young and bright intermediate Orion Trapezium binary Ori E. The first one concerns the various off-axis angles of the sources with respect to the telescopes optical axis. The HETG spectral resolution degrades significantly once a source is well beyond 1’ from the optical axis of the telescope.
As a next step the orders from the grating dispersion are sorted by the pulse heights (PHA) of the CCDs. However sources with rolls causing overlaps of their dispersed spectra from other sources spatially will suffer from sharing PHAs of dispersed orders from these sources. The result cannot be resolved and these data have to be discarded. Depending on roll angle, single grating arms are affected differently and each arm for each source has to be investigated separately. Note that these overlaps can be caused by any of the sources in the field including the bright sources of the Orion Trapezium (Schulz et al., 2001, 2003). Figure 2 shows an example of such a case in MT Ori data where PHA orders of two different sources overlap. In all of these cases the grating orders cannot be used. On average these occurrences remove about 40 of the available exposure for each source.
In a separate step coincidences of other source zero orders located on HETG dispersion arms have to be eliminated as they appear as spurious line emissions in the dispersion. Many of these coincidences can be allocated using the source locations from Getman et al. (2005). However, since there are considerable numbers of X-ray flaring sources in the ONC, a final visual inspection of each dispersion arm was warranted. In this respect any line feature in the four grating arms for each source had to be consistently present, otherwise we suppressed that particular bandpass in the dispersion. The rates in Table 1 are calculated from the dispersed spectra after all cleaning steps were completed.
3 General Source Properties
3.1 Optical Properties
Physical parameters of very young PMS stars are hard to determine as at that young stage much of the central star is still enshrouded in natal circumdisk material. This means that accurate determinations of extinction and accretion luminosities are difficult. A summary of possible biases in the age determination of young PMS stars can be found in Soderblom et al. (2014). The standard for ONC members was set by a study by Hillenbrand (1997), which was exclusively used in the COUP analysis (Preibisch et al., 2005). A more recent improved multi-color optical survey provided updated extinction values and effective temperatures for a variety of ONC stars (Da Rio et al., 2010) (see also Herczeg & Hillenbrand 2014). The study by Da Rio et al. (2010) produced a new Hertzsprung-Russell diagram of the ONC population. Using the tracks calculated by Siess, Dufour & Forestini (2000), this study provided new values for physical parameters such as AV, accretion luminosity fractions Lacc/Ltot, masses M⋆ and stellar age astar. The values for the six stars in our sample are summarized in Table 2. For the stellar ages we also include the Hillenbrand (1997) results, ah97, for reference purposes.
| Name | log Teff | log L⋆ | AV | log Lacc/L⋆ | M⋆ | R⋆ | log a⋆ | log ah97 |
|---|---|---|---|---|---|---|---|---|
| [K] | [yr] | [yr] | ||||||
| MT Ori | 3.66 | 1.08 | 1.89 | -0.76 | 1.99 | 8.2 | 5.6 | 6.2 |
| LQ Ori | 3.60 | 0.82 | 0.46 | -2.42 | 0.70 | 7.7 | 4.8 | 6.0 |
| Par1842 | 3.75 | 0.64 | 2.84 | -0.37 | 1.56 | 3.3 | 7.0 | 6.4 |
| V1399Ori | 3.71 | 0.81 | 1.61 | -0.74 | 2.28 | 4.6 | 6.4 | 6.4 |
| V1229 Ori | 3.72 | 0.86 | 2.98 | -0.45 | 2.22 | 5.0 | 6.5 | 6.5 |
| V348 Ori | 3.72 | 0.91 | 2.97 | -0.68 | 2.33 | 4.7 | 6.5 | 6.3 |
The effective temperatures for all six stars range from 4000 K (LQ Ori) to about 5300 K (V348 Ori), which puts these stars currently into the G/K type category. Except for LQ Ori, the stars still produce a significant amount of luminosity from active accretion with fractions between 20 and 40 . Masses and ages have ben determined from PMS tracks provided by the model from Siess, Dufour & Forestini (2000), which gives a mass range between 0.7 and 2.3 and ages between 7 yr and 1 yr. Most accurate knowledge of these two quantities is essential because they provide the stellar radii we need to interprete the coronal emissions results.
3.2 X-Ray Properties from the COUP Study
The sources in this sample are the X-ray brightest stars within a 1.5’ radius around the Orion Trapezium. The source selection is purely based on their presence in the optimal field of view (FOV) of the Chandra HETG spectrometer. The X-ray properties of these stars as determined from the COUP dataset are listed in Table 3 and more of their global properties are shown in Getman et al. (2005) and Preibisch et al. (2005). The COUP properties of our sample are affected by photon pileup up to and in all the cases mitigating steps had to be taken in the COUP analysis. Absorption columns were found to be significantly lower than in the bulk of X-ray sources ranging between 1 cm-2 and 2 cm-2. The spectra were fitted by a two temperture plasma model yielding average temperatures of 8 K and 1.9 K, up to over a factor two lower than most other COUP souces (Preibisch et al., 2005). Emissivities are 2.6 cm-3 and 5.5 cm-3 and comparable to the entire COUP sample.
| Name | COUP | Spec. Type | RA | Dec | log Nh | kT1 | kT2 | log EM1 | log EM2 | log Lx |
|---|---|---|---|---|---|---|---|---|---|---|
| (cm-2) | (keV) | (keV) | (cm-3) | (cm-3) | (erg s-1 ) | |||||
| MT Ori | 932 | K2-K4 | 05 35 17.94 | -05 22 45.5 | 21.17 | 0.76 | 1.63 | 54.8 | 55.1 | 32.18 |
| LQ Ori | 394 | K2V | 05 35 10.73 | -05 23 44.6 | 20.00 | 0.68 | 1.71 | 54.0 | 54.1 | 31.32 |
| Par 1842 | 689 | G7-G8 | 05 35 15.23 | -05 22 55.7 | 20.85 | 0.64 | 1.64 | 54.2 | 54.8 | 31.82 |
| V1399 Ori | 1130 | G8-K0 | 05 35 21.04 | -05 23 49.0 | 21.28 | 0.71 | 1.51 | 54.4 | 54.4 | 31.67 |
| V1229 Ori | 965 | G8-K0 | 05 35 18.35 | -05 22 37.4 | 21.25 | 0.64 | 1.63 | 54.4 | 54.8 | 31.89 |
| V348 Ori | 724 | G8-K0 | 05 35 15.62 | -05 22 56.4 | 20.46 | 0.80 | 1.45 | 54.3 | 54.6 | 31.73 |
3.3 X-Ray Fluxes from HETG
We fit the spectra with a two component plasma model using the Astrophysical Plasma Emission Database APED 222http://www.atomdb.org (Smith et al., 2001) (Foster et al., 2012). In this first fit we do not constrain parameters such as abundance or absorption, but model the continuum as accurately as possible. This first fit already provides reliable spectral fluxes and luminosities. The values shown in Table 4 are the stellar surface fluxes and surface integrated luminosities for a distance of 450 pc. We use the latter distance in order to directly compare the results to published COUP data. The actual distance toward the ONC has recently been determined to 412 pc (Reid et al., 2009). As done in Preibisch et al. (2005) the stellar X-ray flux is defined as a surface flux and is the luminosity divided by the stellar surface area.
| Name | NH | T1 | T2 | EM1 | EM2 | Fx | Lx |
|---|---|---|---|---|---|---|---|
| (1) | [MK] | [MK] | (2) | (2) | (3) | (4) | |
| MT Ori | 1.35 | 11.00 | 39.24 | 1.2 | 6.6 | 20.2 | 8.4 |
| LQ Ori | 0.00 | 9.39 | 39.10 | 1.4 | 3.4 | 13.8 | 5.0 |
| Par 1842 | 0.51 | 11.09 | 37.50 | 0.7 | 2.3 | 46.0 | 3.1 |
| V348 Ori | 0.83 | 11.04 | 45.23 | 0.9 | 3.3 | 35.4 | 4.6 |
| V1229 Ori | 0.84 | 10.34 | 36.41 | 0.8 | 3.0 | 25.5 | 3.9 |
| V1399 Ori | 0.72 | 11.21 | 37.96 | 1.0 | 3.0 | 31.8 | 4.3 |
(1) 1021 cm-2 (2) 1054 cm-3 (3) 106 erg cm-2 s-1 (4) 10 erg s-1
The most luminous PMS star in the sample is MT Ori with 8.4 erg s-1 , the least luminous star is 3.1 erg s-1 , but all luminosities are lower than deduced in the COUP analysis. The ratio of X-ray to bolometric luminosity is log Lx/Lbol = -2.770.08 and very similar for all sources. Detected X-ray fluxes range between 1 erg cm-2 s-1 and 3 erg cm-2 s-1 . For the luminosities we corrected these fluxes for the absorption column. The stellar X-ray surface fluxes (Fx in Tab. 4) were then determined by dividing these luminosities by the stellar surface area using stellar radii associated with the model parameters in Table 2 and Siess, Dufour & Forestini (2000) tracks.
3.4 Variability
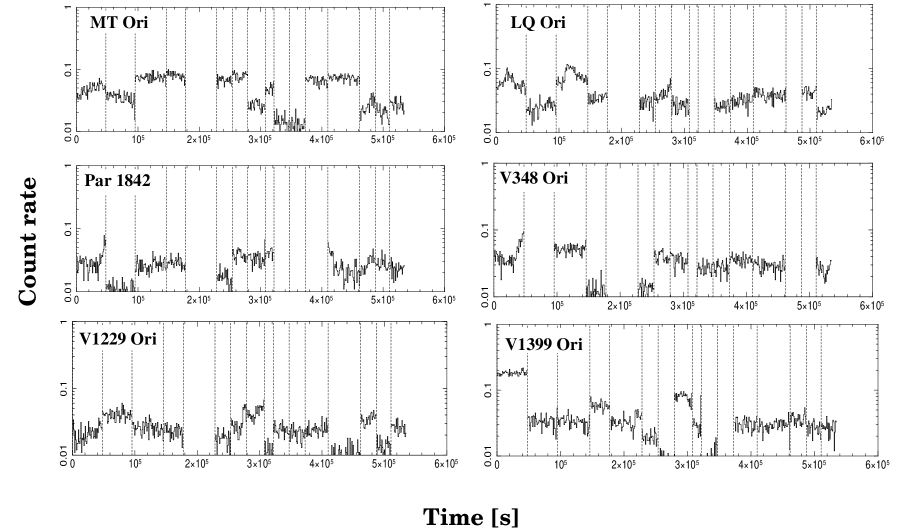
In order to determine source variability we use only the rate deduced from the first order HETG spectra in order to avoid any biases from pileup in the zero order point sources. The light curves are shown in Fig. 1. The 1st order count rates are plotted for all observation segments, which in the light curves are separated by dotted lines. The observing times of each segment thus appear on a continuous scale even though the segments are weeks, months, or even years apart. Some segments do not show data, this does not mean that there is no source flux but merely that we do not have valid data coverage after the confusion analysis. The total observing time is 5.85 s.
We do not observe any significant flaring activity in each of the observing segments. The sources appear persistent in most observing segments with limited short term flux variations. Notable rate variations of a few factors on time scales of a few hours appear in LQ Ori and V1399 Ori. The larger changes in flux appear in between observations. The largest change between observations appears in V1399 Ori with almost a factor 10 difference in mean flux per observation. There might be flare onsets in the the first segments of Par 1842 and V348 Ori, but these appear at the end of the observations and are thus hard to classify as a flare. Note that even in the COUP sample these sources do not have a flare history (Getman et al., 2008).
4 Spectral Analysis
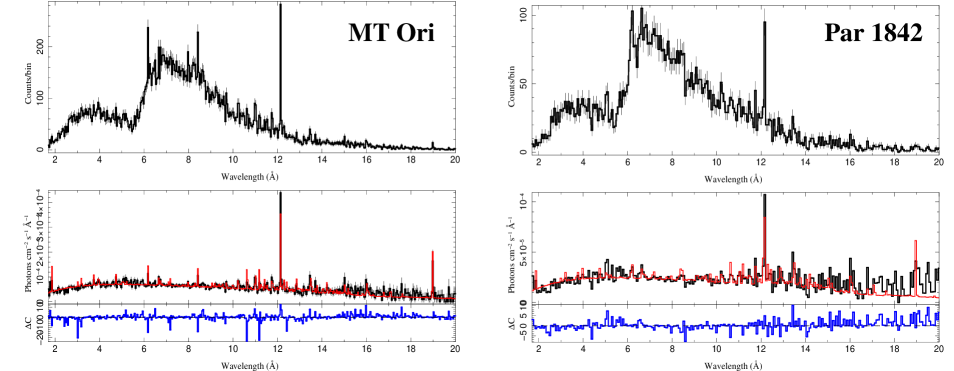
The modeling of the spectra and the X-ray line emission is done in several steps. The models used in the analysis are two temperature APED model spectra for the overall spectral analysis and local continua and Gaussian functions for the emission line analysis. A two temperature model became necessary and sufficient since a one temperature unconstrained fit produced strong residuals and some unfeasible abundance parameters and models with more temperature components did not appear statistically significant. Hence the two temperature APED models are the most consistent way to fit the spectra of all six sources. Spectra and fit models are shown in Figs. 2 and 4.
![[Uncaptioned image]](/html/1503.04366/assets/x4.png)
Unfolded two temperature APED fits of the combined 1st order HETG spectra of four of the Orion sources.
4.1 Abundance Line Ratios
Most of the power of the HETG spectra comes from the detection of distinct X-ray line emission. The measurement of K-shell line properties puts significant constraints on the physical nature of the emitting plasma. Collisional plasmas at temperatures above 106 K emit K-shell lines from all major cosmic abundant elements in the available wavelength range from 1.7 to 25 Å of the HETG spectrometer. In each spectrum we detect over 100 X-ray lines of which about 70 are very weak Fe lines. In all the spectra the lines appear unresolved and )match the expected locations (see also Huenemoerder et al. (2003) with no apparent shifts and line broadenings.
| Line | MT Ori | LQ Ori | Par 1842 | V348 Ori | V229 Ori | V1399 Ori |
|---|---|---|---|---|---|---|
| (1) | (1) | (1) | (1) | (1) | (1) | |
| Ar XVIII L | 0.80 | 0.34 | 0.19 | 0.04 | 0.03 | 0.19 |
| Ar XVII r | 1.08 | 0.28 | 0.52 | 0.22 | 0.21 | 0.31 |
| S XVI L | 0.75 | 0.43 | 0.37 | 0.43 | 1.48 | 0.38 |
| S XV r | 1.17 | 0.58 | 0.99 | 0.48 | 0.38 | 0.57 |
| S XV f | 0.70 | 0.64 | 0.45 | 0.30 | 0.58 | 0.39 |
| Si XIV L | 1.60 | 1.28 | 0.98 | 1.26 | 1.14 | 1.45 |
| Si XIII r | 1.45 | 0.65 | 0.66 | 0.72 | 1.04 | 1.03 |
| Si XIII f | 0.95 | 0.52 | 0.32 | 0.43 | 0.42 | 0.75 |
| Mg XII L | 1.87 | 0.80 | 0.47 | 0.61 | 0.92 | 1.10 |
| Mg XI r | 0.27 | 0.32 | 0.26 | 0.77 | 0.55 | 0.71 |
| Mg XI i | 0.76 | 0.35 | 0.03 | 0.13 | 0.26 | 0.42 |
| Mg XI f | 0.20 | 0.00 | 0.33 | 0.29 | 0.27 | 0.47 |
| Ne X L | 24.12 | 20.06 | 8.86 | 11.59 | 12.64 | 8.33 |
| Ne IX r | 4.33 | 4.20 | 2.64 | 2.27 | 2.40 | 1.12 |
| Ne IX i | 0.83 | 0.84 | 0.85 | 1.52 | 1.07 | 0.30 |
| Ne IX f | 2.42 | 1.73 | 1.74 | 1.11 | 2.07 | 1.03 |
| O VIII L | 16.28 | 29.59 | 5.21 | 0.20 | 2.38 | 8.28 |
| O VII r | 6.01 | 0.20 | 7.65 | 2.55 | 0.00 | 4.94 |
| O VII i | 3.01 | 0.20 | 4.14 | 6.35 | 12.81 | 2.37 |
| O VII f | 7.17 | 3.70 | 5.01 | 3.54 | 0.20 | 13.19 |
| N VII L | 6.42 | 4.99 | 0.00 | 0.00 | 6.17 | 8.36 |
(1) 10-6 photons cm-2 s-1
The HETG band covers most abundant non-iron H-like lines and He-like line triplets except for C and in most cases N. Measured line fluxes are shown in Table 5. Many lines, specifically for the He-like triplets appear spurious or we only see upper limits. The upper limit line flux in our sample is about 2 photons cm-2 s-1. For high Z He-like triplets such as Ar, S, and Si we only see a blend and significantly model the resonance and forbidden line components. The detection of higher Z lines from Ca and Fe are more rare.
Ratios of the line fluxes are used to determine a common abundance distribution with a first goal to constrain the APED plasma model fits. Here we utilize temperature insensitive abundance ratios as used by Drake, Testa & Hartmann (2005); Drake & Testa (2005); Liefke et al. (2008), and further developed by Huenemoerder et al. (2013), which read as
| (1) |
where are abundances of element i and j, the line fluxes (in photons cm-2 s-1) of the corresponding H-like ions, the resonance line components of the corresponding He-like line triplets. The coefficients ao, a1, and a2 were determined from APED and are listed in Huenemoerder et al. (2013) assuming abundances of Anders & Grevesse (1989).
The temperature insensitive abundance ratios we calculate from this procedure are listed in Table 6 and plotted in Fig. 4.1. There are more recent and updated distributions such as the one from Grevesse & Sauval (1998) and Asplund et al. (2009). The differences, however, are well within the uncertainties of the X-ray abundance ratios and we did not re-scale the values to the most recent distribution (Asplund et al., 2009).
![[Uncaptioned image]](/html/1503.04366/assets/x5.png)
Measured abundance ratios for Orion sources. The symbols mean: circle(Ne/Mg); cross (Mg/Si); square (Si/S); trangle (S/O); diamond (Ne/O); star (S/Ar). Added are the values from the sun (Grevesse & Sauval, 1998) and the ISM (Wilms, Allen & McCray, 2000)
The average value of these ratios for each ratio type was the basis to construct a set of abundances and associated uncertainties. These were used to constrain the abundance parameters for O, Ne, Mg, Si, S, and Ar during the APED plasma fits below. We also compare these ratios to the values expected from the Sun (Grevesse & Sauval, 1998) and the ISM (Wilms, Allen & McCray, 2000). We observe that some values such as Mg/Si or Ne/Mg or Si/S align fairly well with the Sun and the ISM, S/O or Ne/O or S/Ar are significantly different indicating anomlies with the oxygen and/or neon abundances. In our case O viiwas only poorly detected, however. The abundance of Fe was not included in this procedure for the lack of K-shell lines and ratio coefficients. Here we only can adjust the abundance during the APED fits.
| Name | Ne/Mg | Mg/Si | Si/S | S/O | Ne/O | S/Ar |
|---|---|---|---|---|---|---|
| MT Ori | 10.24.8 | 0.70.2 | 0.60.2 | 0.41.3 | 11.37.5 | 0.50.2 |
| LQ Ori | 12.76.4 | 0.60.2 | 0.80.4 | 3.02.7 | 2.01.8 | 0.80.5 |
| Par 1842 | 7.43.3 | 0.40.1 | 0.40.2 | – | – | 0.90.6 |
| V348 Ori | 4.51.6 | 0.40.3 | 0.90.5 | – | – | 1.41.0 |
| V1229 Ori | 5.61.8 | 0.50.2 | 0.50.3 | 0.10.1 | 14.913.4 | 2.42.2 |
| V1399 Ori | 3.01.1 | 0.60.2 | 1.00.4 | – | – | 0.90.6 |
| Ori E | 1.70.3 | 1.00.1 | 1.20.2 | 1.41.0 | 4.92.8 | |
| Sun | 3.16 | 1.10 | 1.91 | 0.02 | 0.14 | 4.12 |
| ISM | 3.46 | 1.35 | 1.51 | 0.03 | 0.18 | 4.79 |
4.2 R-Ratios from He-like Triplets
In collisionally ionized plasmas the He-like line triplets are sensitive to density and external UV fields. He-like line triplets consist of resonance (r), intercombination (i), and forbidden (f) line components. At increasing collisional plasma densities the meta-stable f-line component depopulates into the i-line components. A similar effect appears by the influence of far-UV photons matching the energy difference between the f- and i-lines.
In the absence of a strong UV radiation field, the flux ratio () of the two lines is sensitive to the density of the plasma. Coronal plasmas are considered low density plasmas with electron/ion densities below the order of 1011 cm-3, while plasmas in accretion columns can reach 1014 cm-3 (Kastner et al., 2002). He-like triplets of O, Ne, and Mg ions are sensitive to this range. In general, R-ratios significantly below 4.5 indicate densities significantly exceeding 1010 cm-3 (Testa, Drake & Peres, 2004). For neon, ratios significantly below 3.8 indicate densities significantly exceeding 1011 cm-3. And last, but not least, for magnesium, ratios significantly below 2.8 indicate densities significantly exceeding 1012 cm-3. However, even though many R-ratios in our sources are below these limits, in nearly all but a few cases the result is not very significant because of the low statistic in the lines. At this stage the uncertainties do not allow us to discern from the low density limit.
![[Uncaptioned image]](/html/1503.04366/assets/x6.png)
APED plasma fits of the Ne ixtiplet regions in the six Orion sources .
Figure 4.2 shows the Ne ix triplet region for all sources. Of all the lower Z triplets the Ne ix triplets appear more prominently in our spectra than the Mg xi and O vii triplets, also likely due to a neon overabundance. Weak He-like line strengths are likely due to the high plasma temperatures these spectra, which favor resonance line strengths. This can be seen in Figure 4.2, where in all sources the Ne ix resonance line dominates the bandpass. The Ne ix bandpass in Figure 4.2 was fit with the lower temperature APED plasma component and the results shows that a plasma of low density ( cm-3) fits the region well within the limited statistics.
4.3 Column Densities
The broadband plasma fits produce unusually low column densities, some with values well below expectations from the COUP analysis, suggested values from observed optical extinction, and suggestions from previous analysis of the massive stars in the ONC (Schulz et al., 2001; Gagné et al., 2005) which suggest columns of at least 2.9 cm-2. Columns can be estimated from optical extinction via (Predehl & Schmitt, 1995)
![[Uncaptioned image]](/html/1503.04366/assets/x7.png)
The column densities as predicted from optical extinction AV versus the final columns found in the plasma model fits. The bold line indicates the expectation of the two values being the same.
| (2) |
where AV is the extinction (see Table 2) and NH is the X-ray column in units of 1021 cm-2. Figure 4.3 shows the columns from optical extinction AV versus the measured X-ray columns. Here we used the columns from the APED model fits. These columns are significantly lower than the one expected from extinction.
We have also determined line-of-sight absorption from line fluxes of approximately known intrinsic ratios. Once emission lines are from a single ion, the ratios are determined by the atomic data, and to a weaker extent, on the plasma temperature distribution. If these intrinsic ratios are known, then the observed ratios are determined by the absorption function, which then can be inverted to give the column density. We used the H-like Lyman-like series with O viii () and () lines. The Ly- like line, however, is blended with Fe xviii (lower and upper transition configurations of – ).
Using another Fe xviii line at (a doublet; – ), we can break the degeneracy (Testa et al., 2004, 2007). We have three measured fluxes comprised of 4 lines, with two known ratios (an Fe xviii ratio, and the O viii ratio). The other unknown is the absorbing column. This constitutes five equations with five unknowns, so we can solve for . The abundances are not a parameter since we are ultimately using the ratios of identical ions.
The system is non-linear (since the absorption function is exponential), so we solved this numerically. We used the “phabs” function from XSPEC (Arnaud, 1996) and the emissivities of AtomDB (Foster et al., 2012). We show an example fit to the relevant MT Ori spectral region in Figure 4.3.
![[Uncaptioned image]](/html/1503.04366/assets/x8.png)
The MT Ori region from which we derived the absorbing column from emission line ratios. The fit function was a constant plus four Gaussian functions. The lines of interest are Fe xviii , O viii , and the unresolved blend of Fe xviii and O viii. We also included a resolved blend of Fe xviii in order to get a better flux of the unresolved blend.
Given the weakness of the Å line, we performed a Monte-Carlo analysis in which we perturbed the line fluxes according to their uncertainties (assuming Gaussian distributions). Distributions of the column density were then obtained for realizations. We did this for the PMS stars in this sample as well as for the more massive ONC stars, and for two bright, unabsorbed objects, Gem and HR 1099 (Huenemoerder et al., 2013). We also added a distributon for the sum of the Orion PMS sample stars. The Orion PMS stars consistently yield a most probable value of . The “control” stars (Gem and HR 1099) yielded much lower values of about – which is consistent as they are expected to be consistent with almost . Figure 4.3 shows the distributions obtained for the set of Orion stars analyzed. The peaks of line ratio distribution is mostly consistent with the columns from the broadband analysis, LQ Ori appears a little bit higher but the 90 uncertainties align well with the propabilites just below the peak. We conclude that the columns in the Orion stars in this sample are indeed very low.
![[Uncaptioned image]](/html/1503.04366/assets/x9.png)
The fits to the collection of stars, as determined from Monte-Carlo realizations for each star.
4.4 APED Fits: Temperatures and Abundance
Broadband fits of all spectra were performed in several steps. The first step involved a restricted fit using a first set of abundance settings obtained from the temperature insensitive line ratios. The uncertainties in the set are large and allowed the fit considerable freedom. In consecutive steps we manually adjusted single elements during the fits in order to minimize residuals which appeared in the He-like and H-like lines. For the final distibution we calculated uncertainty limits for all values. The final abundance distribution for the fits then yields the following values with respect to solar (Anders & Grevesse, 1989): O (0.195), Ne (0.718), Mg (0.085), Si (0.153), S (0.225), Ar (0.524), Fe (0.058).
Multi temperature components did not produce statistically superior solutions with respect to two temperature models. The final two temperature fits are shown in Fig. 2 and Fig. 4 and the parameters are shown in Tab. 4. The scatter on most spectra is very large above 20 Å and for the final APED fits we limited the bandpass to 1.8 and 20 Å. The data bins were grouped to the size of 0.04 Å in the brightest and 0.08 Å in the weakest source for display purposes. For the fits, each spectrum had 941 independent data bins, each bin had the size of one MEG resolution element (0.021 Å).
The resulting X-ray plasma properties we measure in our sample of six sources, i.e. emissivities and temperatures, generally agree well with the overall COUP sample trends in Preibisch et al. (2005). This is, however, not true for the source parameters measured in COUP (Getman et al., 2005). A comparison of Table 3 with Table 4 shows that fluxes and emissivities are overestimated and temperatures significantly lower in the COUP data, which likely adds to the scatter in the COUP results.
5 Results and Discussion
5.1 Flux and Luminosity
Even though the limited number of sources in this sample does not allow for any statistical trend analysis, we can point out some differences and similarities between these sources. There are some differences in the overall luminosity, the weakest source Par 1842 has 3.1 erg s-1 , the brightest source MT Ori has 8.4 erg s-1 . The spread increases when we compare the surface flux, i.e. the X-ray luminosity divided by the stellar surface area. Figure 5.2 shows the surface flux with respect to the listed ages from Da Rio et al. (2010), which indicates that in the age range up to 10 MK we observe a substantial increase in coronal activity. This trend is implicitely reflected when estimating coronal loop sizes, in this case using , where is the volume emission measure, a coronal density of 1011 cm-3, and the loop size. This is a very simplistic estimate, we here also just assume a filling factor of unity and similar densities, but it shows that these sizes also increase with age, The fact that surface normalized X-ray fluxes increase with age for CTTS in the ONC has been reported by COUP, but for lower mass stars (Preibisch & Feigelson, 2005) up to 1 but with no significant effect for 1 - 2 stars. Here stars range from 0.7 to 2.3 and the effect is highly significant. One should take the case of LQ Ori with caution, however, its age determination of Myr is unrealistically low and not supported by models, but based on the data Da Rio et al. (2010) it is still likely younger than MT Ori.
5.2 Column Densities and Extinction
Except for LQ Ori all sources in the sample are affected by substantial amounts of extinction (Tab. 2), which is not unusual and even expected towards the ONC. In ROSAT studies Predehl & Schmitt (1995) investigated the relation of X-ray column density and optical extinction and found a quite robust relationship (Eq. 2) specifically valid for columns above 1021 cm-2. However it was developed for long range line of sights with gas and dust distributed over vast distances. In the case of Orion we have the situation that extinction is local to the dust in the ONC and its sources, while the X-ray column reflects absorption towards Orion and is likely gas dominated. In other words, there must be a different offset than in Eq. 2 due to local dust, which is not observed in the X-ray column. Such an offset in AV is clearly visible in Fig. 4.3.
However, such interpretations have to be viewed with caution. In star forming regions the extinction is indeed local and the extinction law might differ from the properties in the interstellar medium (ISM). In particular, the properties of dust grains, which cause the optical extinction, are expected to change as the star forming regions evolves. In the initial cool starless cores temperatures are much lower and densities much higher than in the ISM, favoring dust formation, while later the intense radiation from the newly-formed stars will evaporate smaller dust grains. Observationally, one way to probe this regime is to compare the X-ray absorption with the optical extinction . X-ray absorption is caused by the total column density (gas and dust) of heavy ions and is expressed as the equivalent hydrogen column density, assuming some standard set of abundances. On the other hand, the optical extinction is dominated by the dust column density and also depends on the dust grain size distribution. Vuong et al. (2003) compared and for six star forming regions, including the ONC. For the Oph star forming region they find an significantly below the ISM value and they interpret this as a sign that the cloud material in Oph has a lower metal abundance than the ISM, consistent with recent solar abundance measurements. Alternatively, grain growth can increase the amount of extinction per unit mass until the grains reach about 1 m in size (Ormel et al., 2011). Vuong et al. (2003) have only a few data points with a large scatter in the ONC, which are roughly consistent with an ISM-like ratio, but in our data (Fig. 5) we see that all targets have an ratio significantly below the ISM value, in line with the Vuong et al. (2003) result for Oph. In fact, low values are seen in several low-mass star forming regions, e.g. NGC 1333 (Winston et al., 2010), and IRAC 20050+2720 (Günther et al., 2012). Confusingly, previous studies of high-mass star forming regions (RCW 38: Wolk et al. (2006); RCW 108: Wolk et al. (2008)) tend to find ISM-like ratios. It should be noted, however, that the studies cited above all use CCD spectra to measure and that there often is an ambiguity between the amount of cool plasma and the absorbing column density, such that a high column density and a large amount of cool plasma or a low column density with no absorption provide and equally good fit. In our study we break this degeneracy through the use of high-resolution grating spectroscopy. Wolk et al. (2008) used a similar approach for older, but still accreting CTTS in low-mass star forming regions and found consistently high ratios, indicating gas-rich material. They speculated that some of their sources could be seen through the accretion column, which would be dust-depleted due to the stellar irradiation.
We are left with a complex picture where the dust content, grain growth, and abundance in the circumstellar matter and the ISM all influence the observed ratio and their respective influence in the sightline to a specific target cannot be disentangled. For our six targets in the ONC, the total extinction is low, so there cannot be much cloud material in the line of sight. Given that the objects are all very young, some circumstellar matter with evolved dust grains and possibly a low metal abundance can explain the observed ratios.
![[Uncaptioned image]](/html/1503.04366/assets/x10.png)
The stellar surface X-ray flux versus stellar age.
5.3 Plasma Densities and Accretion
The fact that we cannot use observed R-ratios because of our limiting statistics at this stage is unfortunate, but one also has to put their value for our star sample into perspective. At these high plasma temperatures even for the lower temperature component, the He-like triplets are not only difficult to observe, but we would not see much contribution from accretion shock plasmas in these sources. These stars have simply not contracted enough to support sufficiently high infall velocities, which range from as low as 150 km s-1 in LQ Ori to about 350 km s-1 in Par 1842. For our predictions we use the values in Table 2 and a simple model from Calvet & Gullbring (1998). For example, in order to ionize the plasma up to Mg xi temperatures above about 2 MK are necessary, which requires infall velocities above 800 km s-1. This cannot be the case here and we would not expect signatures from accretion activity.
Even though our fits of the Ne ix regions are consistent with a low density plasma, we are statistically limited to rule out higher density plasmas. These might be observed in specific coronal environments at the basis of strong coronal loops involving small emitting volumes and high temperatures (Sanz-Forcada, Brickhouse & Dupree, 2003; Testa, Drake & Peres, 2004) or coronal heating of dense and flared inner accretion disk regions (Drake & Orlando, 2010; Drake et al., 2009; Dullemond & Monnier, 2010; Dullemond et al., 2007). Magnetic confinement as outlined by Gagné et al. (2005) might be a possibility in these type of interactions as well.
In the following subsections we dicuss how these issues fare with individual sources and how these properties compare with other PMS stars and results from the COUP sample.
5.4 Individual Sources
MT Ori is the X-ray brightest low-mass PMS star in our sample and with a surface temperature of 4600 K currently a K2 - K4 spectral type (Da Rio et al., 2010). The latter study determines a contribution of about 13 of the total luminosity from accretion. At an age of about 0.5 Myr (see Tab. 2), one might expect more from accretion in a 2 CTTS. The ratio of the emission measures of the two temperature components yields a fraction of 18 for the lower temperature component. An accretion fraction would be consistent with the low optical accretion luminosity, however, the estimated infall velocity of 250 km s-1 is too low to allow for K-shell ionization of matter with atomic number larger than O vii. We should thus not expect low R-ratios from an infall accretion shock for Ne ix and Mg xi.
The total X-ray luminosity is very high leading to a log Lx/Lbol of about -2.7, above the saturation limit of -3 for fast rotators (e.g. Vilhu (1984); Vilhu & Walter (1987)) and well above the median value of -3.7 for TTS with unknown periods in COUP data. However, the surface X-ray flux is the 2nd lowest in the sample, due to the fact that the stellar surface area is the largest in the sample. The lightcurve shows the source persistently bright at levels varying by a factor of 8. From the average total emissivity we project average coronal loop sizes of about 10 of the stellar radius assuming coronal densities of 1011 cm-3. Getman et al. (2008) found a typical flare in the COUP dataset and estimate loop sizes of about 1.1 cm, which is only 30 larger. Note, the estimated loop sizes use a model by Reale & Micela (1998), which depends on the square root of the observed flare temperature. However, because of pileup problems (see Sect. 4.4) this temperature is about a factor two lower in the COUP dataset and the true sizes are larger by a factor .
LQ Ori is the second X-ray brightest low-mass PMS star in our sample and classified as a K2 V dwarf. Da Rio et al. (2010) find less than 1 of the optical luminosity due to accretion, which for a 0.6 star at an age of the order of 0.1 Myrs is highly unusual. Ages this low are not supported by most model calculations and we expect LQ Ori to be somewhat older. The fraction of the low temperature component is almost 40 indicating the potential for some accretion to produce X-rays. However, the case for X-rays from accretion in LQ Ori is even worse than for MT Ori as predicted infall velocities do not even favor much ionization up to O vii. LQ Ori also does not appear to be a particularly dusty environment, extinction is extremely low in this star and this is backed up by a very low column density allowing to record even a strong N VII Lα line. log Lx/Lbol is slightly lower than the one in MT Ori, but still well above -3. But similar to MT Ori we estimate an average coronal loop size of about 10 of the stellar radius. A incomplete flare in the COUP data provided about 2.5 times the size (Getman et al., 2008).
Par 1842 is the oldest star in the sample according to Da Rio et al. (2010) with an age of 10 Myr. Its determined luminosity fraction from accretion is the highest in the sample. The low temperature component produces about 30 of the total emission measure, and while models predict infall velocities of the order of 350 km s-1 allowing for both, ionizations up to O vii and Ne ix but not to Mg xi are feasible. The X-ray luminosity is the lowest of all stars, but its surface flux the highest, indicating that this star is actually coronally most active. Consequently from the total emission measure we estimate average loop sizes of over 20 of the stellar radius. One flare in the COUP data, which was classified as a slow rise event, gave a loop limit over 10 times larger (5 cm) indicating that this flare was a giant event (Getman et al., 2008),
V348 Ori, V1229 Ori, V1399 Ori have very similar optical properties in terms of surface temperature, mass, radius, and age (Da Rio et al., 2010). Overall this is also true for their X-ray properties. The optical luminosity from accretion (see Table 2), however, varies by about a factor two between V1229 Ori, V348 Ori and V1399 Ori likely indicating that accretion rates vary by factors independent of system parameters. R-ratios in all three sources show reduced values and the presence of cooler dense plasma from accretion cannot be ruled out. The case here is similar to the one for Par 1842, ionizations in the accretion shock plasma might favor O vii or Ne ix but not Mg xi. log Lx/Lbol is also above -3 and average coronal loop sizes are of the order of 20 of the stellar radius. No flares were detected in the COUP sample (Getman et al., 2008).
5.5 Comparison with other T Tauri stars
There are few detailed studies of young CTTS exhibiting dominant coronal properties other than the Orion studies. High resolution X-ray studies dealing with young PMS stars at various evolutionary stages have been conducted by Audard et al. (2005) for V987 Tau, RY Tau, and LkCa 21, or by Robrade & Schmitt (2006) for the four CTTS BP Tau, CR Cha, SU Aur, and TW Hya. Perhaps the most prominent non-Orion example from these samples is SU Aur. It was found that coronal emission is the dominant source of X-ray activity in this star with most emissions between 20 - 50 MK and the coolest component at around 8 MK. Due to absorption, the O VII triplet is not observed. Shukla (2009) find R-ratios of Mg and Ne that limit plasma densities to less than 1012 cm-3 and conclude a dominant coronal nature. This is very similar to what we find for the ONC sources, except for the fact that ONC sources appear significantly more luminous. Consequently SU Aur appears below the Orion source data points in Fig. 5.2.
Most PMS coronal sources are classified as weak lined T Tauri Stars (WTTS). Here the IR-excess from a prominent accretion disk has vanished and we do not expect any accretion activity. X-ray emissions are considered to entirely be of some form of coronal origin. Prime examples are HD 98800 in the TW Hya association (Kastner et al., 2004) and V987 Tau in the Taurus-Auriga region (Strassmeier & Rice, 1998). These non-flaring states of WTTS are well described by either a one temperature component or a weak hot and dominant very hot component. The case of V987 Tau is of interest because its age is 2 -3 Myr (Furlan et al., 2006; Damiani & Micela, 1995). Andrews & Williams (2005) found a disk mass of indicating that accretion has ceased in this system. Shukla (2009) estimate R-ratios of Mg and Ne that limit plasma densities to less than 1012 cm-3, however for a very weak cool component. In Fig. 5.2 V987 Tau appears even further below the Orion stars and SU Aur (Siwak et al., 2011; Audard et al., 2005), which is likely a consequence of its much earlier spectral type.
5.6 Abundances in the ONC
The ONC as an ensemble of coeval stars allows to study details in the chemical composition of these stars and the cluster. Coronal chemical compositions are often different from stellar photospheric and interstellar compositions (Feldman, 1992; Testa, 2010). Most of these differences relate to depletion effects with respect to the first ionization potential (FIP). The solar corona has more elements with low FIPs such as Mg, Si, Fe, while coronally active stars seem to have more higher FIP elements such as O, Ne, Ar. Figure 5.6 compares the average abundance ratios of the Orion stars with various studies. Solar photospheric ratios (Grevesse & Sauval, 1998; Asplund et al., 2009) seem to be quite in agreement with abundances from B-stars (Asplund et al., 2009) and B-stars in Orion (Nieva & Simón-Díaz, 2011). A study of the upper solar atmosphere at 106 K seems to also differ significantly from the Orion ratios. The ratios for the Orion stars seem to agree with most of these studies only for the Ne/Mg, Mg/Si, and Si/S ratios, while significant differences can be found with respect to the S/O, Ne/O, and S/Ar ratios. This indicates that there are likely discrepancies with at least the neon and oxygen abundance. Enhanced neon has been observed in X-ray spectra of other stars than the Sun (see Drake & Testa 2005 and reference therein). Besides enhanced neon, the very high Ne/O ratio could also indicate depletion of oxygen. Given that column densities are not extraordinarily high and that we observe the N vii line in some cases shows that there could be a depletion of oxgyen in the Orion spectra. This can have several reasons ranging from the fact that spectra at these high temperatures mostly generate H-like O viii lines, but also due to the large extinction values, which indictate that these CTTS are likely quite dusty and oxygen is depleted into dust grains (Drake, Testa & Hartmann, 2005).
![[Uncaptioned image]](/html/1503.04366/assets/x11.png)
The average abundance ratios for our Orion sources (circles) in comparison with various studies. The symbols mean: star (Grevesse & Sauval (1998)); cross (Asplund et al. (2009)); triangle (B-stars from Asplund et al. (2009)); diamond (Nieva & Simón-Díaz (2011), S and Ar from Asplund et al. (2009)); square (Feldman & Widing (2003)).
Figure 5.6 shows a similar comparison but now involving stellar active coronae. Here we used two studies, one for a set of fast rotating M dwarfs (Liefke et al., 2008) and two active coronal K stars (Huenemoerder et al., 2013). Even though for some ratios the uncertainties are still large and there are large variations within Orion sources there is a very good agreement with ratios of coronally active sources. Even the Ne/O ratio with its quite large uncertainties seems more consistent with coronal souces (Huenemoerder et al., 2013; Drake, Testa & Hartmann, 2005) than with solar values (Asplund et al., 2009). The comparison of Fig. 5.6 and Fig 5.6 thus highlights that elemental abundances in stellar photospheres differ from stellar coronae. This difference in abundances is still an unsolved problem.
The measured abundance ratios also show that they are insensitive to a range of very high coronal temperatures but sensitive to a more global temperature range. However, exactly this difference between photospheric and coronal abundances can work in favor as a diagnostic probe for coronal structures (see Laming 2012; Laming & Hwang 2009; Sanz-Forcada, Brickhouse & Dupree 2003, testa2015). In our Orion sample we are still far from doing so given the current statistical limitations in the X-ray line fluxes.
Abundances of iron could not be included in the line ratio study but from the spectral plasma fits they appear consistently low in all Orion sources. Low Fe abundances are also found in active stellar coronae (Huenemoerder et al., 2013) but also in X-ray spectra of the Orion Trapesium such as the intermediate mass binary Ori E (Huenemoerder et al., 2013) and the massive stars Ori C and Ori A (Schulz et al., 2003, 2006). However, in all these cases that observed plasma is likely of also coronal origin. Other studies of Orion (Nieva & Simón-Díaz, 2011) and the solar neighborhood do not support such an iron abundance deficit, pointing once again to chemical fractionation effects in the outer stellar atmosphere.
![[Uncaptioned image]](/html/1503.04366/assets/x12.png)
The average abundance ratios for our Orion sources (circles) in comparison with various M dwarfs with active coronae (Liefke et al., 2008). The symbols mean: cross (YY Gem); square (AU Mic); trangle (EV Lac); diamond (AD Leo); star (Proxima Cen); filled circle ( Gem); filled square (HR 1099).
6 Conclusions
We observed some of the youngest CTTS in the ONC with ages between 0.1 and 10 Myr. All stars are very bright in X-rays with luminosities significantly above 1031 erg s-1 and ratios of X-ray to bolometric luminosity of the order of -2.8. The X-ray surface flux increases significantly with young age even for stellar masses above 1.5 together with average coronal loop sizes indicating an increase in coronal activity during the CTTS phase. The column densities towards the X-ray sources are lower than expected from measured extinction values and lower than previously determined for the central massive star Ori C, likely due to high local gas-to-dust ratios. The X-ray spectra are too hot to allow for significant R-ratio determinations with current statistics, but on average the He-like triplets are consistent with typical densities of coronal plasmas. Average abundance ratios are also consistent with coronally active stars underlining the coronal nature of the observed X-ray emission. The preliminary results of young coronally active PMS stars in this analysis demonstrate the incredible potential of observing the ONC stars with the Chandra HETG to study details of the coronal evolution of CTTS.
References
- Anders & Grevesse (1989) Anders, E., & Grevesse, N., 1989, Geochim. Cosmochim. Acta, 53, 197
- Andrews & Williams (2005) Andrews, S. M., & Williams, J. P., 2005, ApJ, 631, 1134
- Argiroffi, Maggio & Peres (2007) Argiroffi, C., Maggio, A., & Peres, G., 2007, A&A, 465, L5
- Arnaud (1996) Arnaud, K. A., 1996, in Astronomical Data Analysis Software and Systems V, ed. G. H. Jacoby, J. Barnes, Vol. 101, 17
- Asplund et al. (2009) Asplund, M., Grevesse, N., Sauval, A. J., & Scott, P., 2009, ARA&A, 47, 481
- Audard et al. (2007) Audard, M., Briggs, K. R., Grosso, N., Güdel, M., Scelsi, L., Bouvier, J., & Telleschi, A., 2007, A&A, 468, 379
- Audard et al. (2005) Audard, M., Skinner, S. L., Smith, K. W., Güdel, M., & Pallavicini, R., 2005, in 13th Cambridge Workshop on Cool Stars, Stellar Systems and the Sun, ed. F. Favata, G. A. J. Hussain, B. Battrick, Vol. 560, 411
- Bally, O’Dell & McCaughrean (2000) Bally, J., O’Dell, C. R., & McCaughrean, M. J., 2000, AJ, 119, 2919
- Calvet & Gullbring (1998) Calvet, N., & Gullbring, E., 1998, ApJ, 509, 802
- Canizares et al. (2005) Canizares, C. R., et al., 2005, PASP, 117, 1144
- Da Rio et al. (2010) Da Rio, N., Robberto, M., Soderblom, D. R., Panagia, N., Hillenbrand, L. A., Palla, F., & Stassun, K. G., 2010, ApJ, 722, 1092
- Damiani & Micela (1995) Damiani, F., & Micela, G., 1995, ApJ, 446, 341
- den Boggende et al. (1978) den Boggende, A. J. F., Mewe, R., Gronenschild, E. H. B. M., Heise, J., & Grindlay, J. E., 1978, A&A, 62, 1
- Drake et al. (2009) Drake, J. J., Ercolano, B., Flaccomio, E., & Micela, G., 2009, ApJ, 699, L35
- Drake & Orlando (2010) Drake, J. J., & Orlando, S., 2010, ApJ, 720, L195
- Drake & Testa (2005) Drake, J. J., & Testa, P., 2005, Nature, 436, 525
- Drake, Testa & Hartmann (2005) Drake, J. J., Testa, P., & Hartmann, L., 2005, 627, L149
- Dullemond et al. (2007) Dullemond, C. P., Hollenbach, D., Kamp, I., & D’Alessio, P., 2007, Protostars and Planets V, 555–572
- Dullemond & Monnier (2010) Dullemond, C. P., & Monnier, J. D., 2010, ARA&A, 48, 205
- Feigelson & Decampli (1981) Feigelson, E. D., & Decampli, W. M., 1981, ApJ, 243, L89
- Feigelson et al. (2005) Feigelson, E. D., et al., 2005, ApJS, 160, 379
- Feldman (1992) Feldman, U., 1992, Phys. Scr, 46, 202
- Feldman & Widing (2003) Feldman, U., & Widing, K. G., 2003, Space Sci. Rev., 107, 665
- Foster et al. (2012) Foster, A. R., Ji, L., Smith, R. K., & Brickhouse, N. S., 2012, ApJ, 756, 128
- Furlan et al. (2006) Furlan, E., et al., 2006, ApJS, 165, 568
- Gagne, Caillault & Stauffer (1995) Gagne, M., Caillault, J.-P., & Stauffer, J. R., 1995, ApJ, 445, 280
- Gagné et al. (2005) Gagné, M., Oksala, M. E., Cohen, D. H., Tonnesen, S. K., ud-Doula, A., Owocki, S. P., Townsend, R. H. D., & MacFarlane, J. J., 2005, ApJ, 628, 986
- Getman et al. (2008) Getman, K. V., Feigelson, E. D., Broos, P. S., Micela, G., & Garmire, G. P., 2008, ApJ, 688, 418
- Getman et al. (2005) Getman, K. V., et al., 2005, ApJS, 160, 319
- Giacconi et al. (1972) Giacconi, R., Murray, S., Gursky, H., Kellogg, E., Schreier, E., & Tananbaum, H., 1972, ApJ, 178, 281
- Grevesse & Sauval (1998) Grevesse, N., & Sauval, A. J., 1998, Space Sci. Rev., 85, 161
- Günther et al. (2006) Günther, H. M., Liefke, C., Schmitt, J. H. M. M., Robrade, J., & Ness, J.-U., 2006, A&A, 459, L29
- Günther et al. (2012) Günther, H. M., et al., 2012, AJ, 144, 101
- Herczeg & Hillenbrand (2014) Herczeg, G. J., & Hillenbrand, L. A., 2014, ApJ, 786, 97
- Hillenbrand (1997) Hillenbrand, L. A., 1997, AJ, 113, 1733
- Huenemoerder et al. (2003) Huenemoerder, D. P., Canizares, C. R., Drake, J. J., & Sanz-Forcada, J., 2003, ApJ, 595, 1131
- Huenemoerder et al. (2013) Huenemoerder, D. P., Phillips, K. J. H., Sylwester, J., & Sylwester, B., 2013, ApJ, 768, 135
- Huenemoerder et al. (2009) Huenemoerder, D. P., Schulz, N. S., Testa, P., Kesich, A., & Canizares, C. R., 2009, ApJ, 707, 942
- Kastner et al. (2004) Kastner, J. H., Huenemoerder, D. P., Schulz, N. S., Canizares, C. R., Li, J., & Weintraub, D. A., 2004, ApJ, 605, L49
- Kastner et al. (2002) Kastner, J. H., Huenemoerder, D. P., Schulz, N. S., Canizares, C. R., & Weintraub, D. A., 2002, ApJ, 567, 434
- Laming (2012) Laming, J. M., 2012, ApJ, 744, 115
- Laming & Hwang (2009) Laming, J. M., & Hwang, U., 2009, ApJ, 707, L60
- Liefke et al. (2008) Liefke, C., Ness, J.-U., Schmitt, J. H. M. M., & Maggio, A., 2008, A&A, 491, 859
- Muench et al. (2002) Muench, A. A., Lada, E. A., Lada, C. J., & Alves, J., 2002, ApJ, 573, 366
- Nieva & Simón-Díaz (2011) Nieva, M.-F., & Simón-Díaz, S., 2011, A&A, 532, A2
- Ormel et al. (2011) Ormel, C. W., Min, M., Tielens, A. G. G. M., Dominik, C., & Paszun, D., 2011, A&A, 532, A43
- Predehl & Schmitt (1995) Predehl, P., & Schmitt, J. H. M. M., 1995, A&A, 293, 889
- Preibisch & Feigelson (2005) Preibisch, T., & Feigelson, E. D., 2005, ApJS, 160, 390
- Preibisch et al. (2005) Preibisch, T., et al., 2005, ApJS, 160, 401
- Reale & Micela (1998) Reale, F., & Micela, G., 1998, A&A, 334, 1028
- Reid et al. (2009) Reid, M. J., Menten, K. M., Brunthaler, A., Zheng, X. W., Moscadelli, L., & Xu, Y., 2009, ApJ, 693, 397
- Rho et al. (2004) Rho, J., Ramírez, S. V., Corcoran, M. F., Hamaguchi, K., & Lefloch, B., 2004, ApJ, 607, 904
- Robberto et al. (2010) Robberto, M., Soderblom, D. R., Scandariato, G., Smith, K., Da Rio, N., Pagano, I., & Spezzi, L., 2010, AJ, 139, 950
- Robrade & Schmitt (2006) Robrade, J., & Schmitt, J. H. M. M., 2006, A&A, 449, 737
- Sanz-Forcada, Brickhouse & Dupree (2003) Sanz-Forcada, J., Brickhouse, N. S., & Dupree, A. K., 2003, ApJS, 145, 147
- Schmitt et al. (2005) Schmitt, J. H. M. M., Robrade, J., Ness, J.-U., Favata, F., & Stelzer, B., 2005, A&A, 432, L35
- Schulz et al. (2001) Schulz, N. S., Canizares, C., Huenemoerder, D., Kastner, J. H., Taylor, S. C., & Bergstrom, E. J., 2001, ApJ, 549, 441
- Schulz et al. (2003) Schulz, N. S., Canizares, C., Huenemoerder, D., & Tibbets, K., 2003, ApJ, 595, 365
- Schulz et al. (2000) Schulz, N. S., Canizares, C. R., Huenemoerder, D., & Lee, J. C., 2000, ApJ, 545, L135
- Schulz et al. (2006) Schulz, N. S., Testa, P., Huenemoerder, D. P., Ishibashi, K., & Canizares, C. R., 2006, ApJ, 653, 636
- Shukla (2009) Shukla, S., 2009, Ph.D. thesis, Pennsylvania State University
- Siess, Dufour & Forestini (2000) Siess, L., Dufour, E., & Forestini, M., 2000, A&A, 358, 593
- Siwak et al. (2011) Siwak, M., Rucinski, S. M., Matthews, J. M., Kuschnig, R., Guenther, D. B., Moffat, A. F. J., Sasselov, D., & Weiss, W. W., 2011, MNRAS, 415, 1119
- Skrutskie et al. (2006) Skrutskie, M. F., et al., 2006, AJ, 131, 1163
- Smith et al. (2001) Smith, R. K., Brickhouse, N. S., Liedahl, D. A., & Raymond, J. C., 2001, ApJ, 556, L91
- Soderblom et al. (2014) Soderblom, D. R., Hillenbrand, L. A., Jeffries, R. D., Mamajek, E. E., & Naylor, T., 2014, Protostars and Planets VI, 219–241
- Strassmeier & Rice (1998) Strassmeier, K. G., & Rice, J. B., 1998, A&A, 339, 497
- Telleschi et al. (2007) Telleschi, A., Güdel, M., Briggs, K. R., Audard, M., & Palla, F., 2007, A&A, 468, 425
- Testa (2010) Testa, P., 2010, Space Sci. Rev., 157, 37
- Testa, Drake & Peres (2004) Testa, P., Drake, J. J., & Peres, G., 2004, ApJ, 617, 508
- Testa et al. (2004) Testa, P., Drake, J. J., Peres, G., & DeLuca, E. E., 2004, ApJ, 609, L79
- Testa et al. (2007) Testa, P., Drake, J. J., Peres, G., & Huenemoerder, D. P., 2007, ApJ, 665, 1349
- Townsley et al. (2011) Townsley, L. K., et al., 2011, ApJS, 194, 1
- Vilhu (1984) Vilhu, O., 1984, A&A, 133, 117
- Vilhu & Walter (1987) Vilhu, O., & Walter, F. M., 1987, ApJ, 321, 958
- Vuong et al. (2003) Vuong, M. H., Montmerle, T., Grosso, N., Feigelson, E. D., Verstraete, L., & Ozawa, H., 2003, A&A, 408, 581
- Wilms, Allen & McCray (2000) Wilms, J., Allen, A., & McCray, R., 2000, ApJ, 542, 914
- Winston et al. (2010) Winston, E., et al., 2010, AJ, 140, 266
- Wolk et al. (2002) Wolk, S. J., Bourke, T. L., Smith, R. K., Spitzbart, B., & Alves, J., 2002, ApJ, 580, L161
- Wolk et al. (2006) Wolk, S. J., Spitzbart, B. D., Bourke, T. L., & Alves, J., 2006, AJ, 132, 1100
- Wolk et al. (2008) Wolk, S. J., Spitzbart, B. D., Bourke, T. L., Gutermuth, R. A., Vigil, M., & Comerón, F., 2008, AJ, 135, 693