Fermi surface instabilities in CeRh2Si2 at high magnetic field and pressure
Abstract
We present thermoelectric power (TEP) studies under pressure and high magnetic field in the antiferromagnet CeRh2Si2 at low temperature. Under magnetic field, large quantum oscillations are observed in the TEP, , in the antiferromagnetic phase. They suddenly disappear when entering in the polarized paramagnetic (PPM) state at pointing out an important reconstruction of the Fermi surface (FS). Under pressure, increases strongly of at low temperature near the critical pressure , where the AF order is suppressed, implying the interplay of a FS change and low energy excitations driven by spin and valence fluctuations. The difference between the TEP signal in the PPM state above Hc and in the paramagnetic state (PM) above Pc can be explained by different FS. Band structure calculations at stress that in the AF phase the contribution at the Fermi level (EF) is weak while it is the main contribution in the PM domain. By analogy to previous work on CeRu2Si2, in the PPM phase of CeRh2Si2 the contribution at will drop.
pacs:
71.18.+y, 71.27.+a, 72.15.Jf, 75.30.KzI Introduction
The interplay between spin fluctuations, valence fluctuations and charge ordering with Fermi surface (FS) instabilities is a key point in the understanding of quantum criticality in itinerant electronic systems. Heavy fermion materials are important examples as their low renormalized characteristic temperature gives the opportunity to switch for example from long range antiferromagnetic (AF) to paramagnetic (PM) ground states under moderate pressure () of a few GPa and to recover, by applying magnetic field (), a polarized paramagnetic state (PPM) above the AF-PM transition at Löhneysen et al. (2007). An additional particularity is that the magnetically polarized phase at is often associated with the possibility of a FS reconstruction. This is characteristic of a polarized paramagnetic phase with a FS quite different from the PM ones. Up to now, the CeRu2Si2 series is the fingerprint example of these phenomena Flouquet (2005); Aoki et al. (2014). Here we present the effects of an on the thermoelectric power (TEP) of the compound CeRh2Si2 with the aim to observe the response on a system where a FS instability under pressure is well established by previous de Haas van Alphen (dHvA) experiments Araki et al. (2001, 2002); Abe et al. (1998) and where the magnetic structure of the AF phase has been fully determined Kawarazaki et al. (2000).
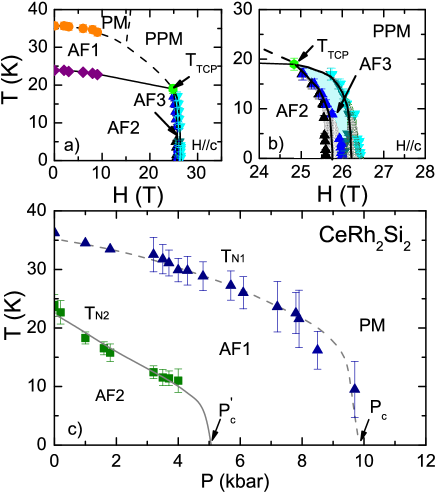
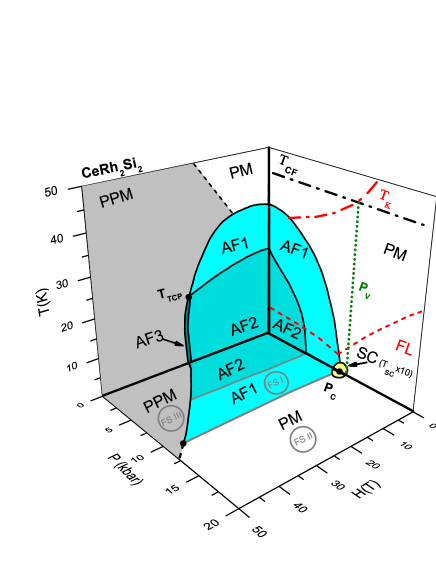
Figure 1 represents the main features of the CeRh2Si2 (, , ) phase diagram as measured from our TEP. On cooling at and , CeRh2Si2 shows a first AF1 transition at K characterized by the wave vector =(, , 0). The magnetic structure is changing at =25 K and in the second AF2 phase, an additional wave vector =(, , ) appearsKawarazaki et al. (2000). The sublattice magnetization () per Ce atoms is near 1.5 and the Sommerfeld coefficient extrapolated at K is only 23 mJmol-1K-2. However if the system would not order magnetically, the entropy balance at suggests an extrapolation of for the PM phase near 400 mJK-2mol Graf et al. (1997, 1998). CeRh2Si2 belongs to the heavy fermion compounds with the occurrence of strong magnetic correlations by developing a large molecular field Knafo et al. (2010) which is at the origin of the drop of the term of the specific heat. Another interesting feature is that the dominant Ising character with aligned along the axis governs the magnetic structure properties while the Pauli susceptibility in low field is almost isotropic as if there is a decoupling between Ising local moments and the behavior of the itinerant electronsSettai et al. (1997).
The AF2 phase disappears under pressure at kbar while the AF1 phase is suppressed at kbar Graf et al. (1997); Araki et al. (2001). Under magnetic field the AFM is suppressed (for K) by a cascade of first order transitions AF2 AF3 PPM with two critical metamagnetic fields =25.7 T and =26 T Settai et al. (1997); Abe et al. (1997). As the AF3 phase exists in a narrow magnetic field domain, the main focus will be given later by the change between the AF and PPM phases. Various macroscopic measurements show that at high magnetic field above , the PPM ground state differs from the PM ones Knafo et al. (2010). Up to now, high magnetic field FS studies have been restricted to the AF phase, i.e to , and FS measurements have been mainly performed under pressure with in the basal plane Araki et al. (2001). Under pressure FS reconstructions have been observed at and Kawarazaki et al. (2000); Movshovich et al. (1996); Boursier (2005). A rough interpretation suggests a localized description of the electrons below and an itinerant description above Araki et al. (2001).
II Experimental details
High quality single crystals of CeRh2Si2 were grown using the Czochkralski method in a tetra-arc furnace. Single crystal ingots were oriented by Laue photograph and were cut by a spark cutter. No heat treatment was done for the present samples. The sample quality was checked by resistivity measurements. The residual resistivity ratio (RRR) is in the range from 30 to 100. The highest quality sample was used for quantum oscillations measurements.
The TEP study was performed with in order to reach the PPM regime at . The experiment was performed in longitudinal (thermal gradient axis) and transversal configurations ( axis). scans were done with a conventional superconducting magnet ( T) and with a resistive magnet at the LNCMI laboratory ( T). Zero magnetic field measurements under pressure were performed in a piston cylinder cell. Details of the experimental realization of the high pressure experiment can be found in Ref. Palacio Morales, .
III Results
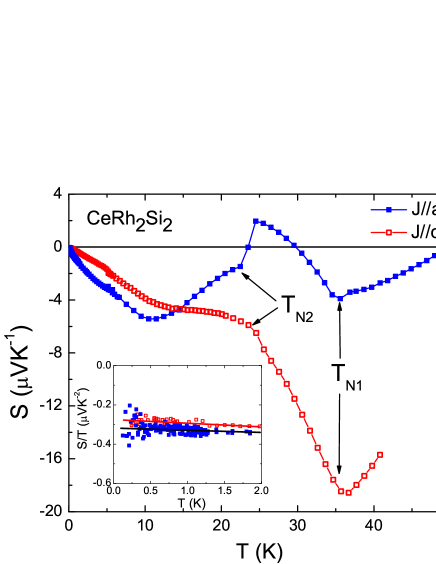
Figure 2 shows the temperature dependance of TEP at ambiant pressure for both, and configuration, at . In both configurations the TEP shows abrupt changes in the dependence at the magnetic transitions. At very low temperature below K, the TEP is mainly isotropic while a strong anisotropy is detected above . The inset of Fig. 2 shows the temperature variation of below K. In agreement with the small value of the Sommerfeld coefficient , is rather weak for an heavy fermion compound. Furthermore, the usual positive value of as K observed for many Ce based heavy fermion compounds is not recovered. Clearly, the creation of new small Brillouin zones and its associated FS reconstruction modify the band structure and thus the energy derivative of the density of states which is directly linked to the TEP signal. As discussed below the Ce- contribution to the density of states at the Fermi level is weak in the AF phase.
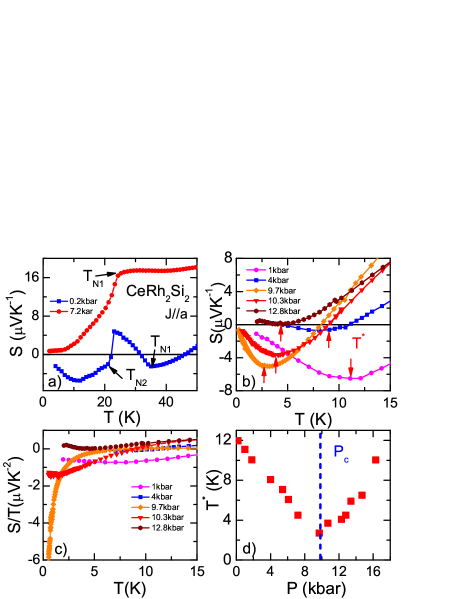
A strong variation of the TEP under pressure is observed notably close to and . Typical curves are presented in Fig. 3a). From the marked signature of at and , the () phase diagram of CeRh2Si2 was drawn in Fig. 1 in good agreement with previous measurements Araki et al. (2002); Kawarazaki et al. (2000); Movshovich et al. (1996); Boursier (2005). and at low temperature for different pressures are represented in figure 3b) and c) respectively. The extremely large value of for for =9.7 kbar reflects the proximity to the critical pressure . The entrance in a coherent regime is marked initially by a well defined minimum at . In Fig. 3d) the strong decrease of (extracted from in Fig. 3b)) is a manifestation of critical fluctuations near .
The pressure dependances of the TEP at 10 K and 3 K are illustrated in Fig. 4a). Below 0.8 kbar, rather similar values of are obtained, however in the critical regime (8-13 kbar) large differences exist between K and K in agreement with the occurrence of a deep negative minimum on cooling close to . In this pressure range, the characteristic electronic energy drops on approaching as clearly observed in the decrease of (Fig. 3d)) and in the shrinking of the low temperature domain (at lower than 8 K) where the Fermi liquid resistivity is detected Boursier (2005).
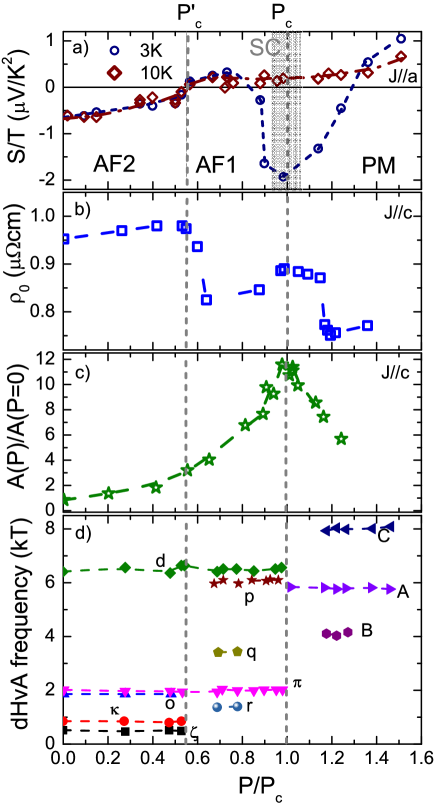
Furthermore in Fig. 4, different anomalies detected are recorded in the dependence of different quantities: b) the residual resistivity , c) the coefficient Araki et al. (2002) and d) the dHvA frequencies Araki et al. (2001). The signatures of the TEP at and corresponds to clear changes in the residual resistivity and dHvA frequencies. The inelastic term of the resistivity has a marked maximum while in Ref. Boursier, 2005 a plateau has been reported. Further experiments must solve the origin in the resistivity anomalies detected near for and Araki et al. (2002).
This shows that electronic fluctuations (mainly spin fluctuations) are detected far below . The important observation in the TEP is the switch of from a negative to a positive value at , the deep negative minimum at and the recovery of the common positive sign of the TEP for Ce heavy fermion compounds above . The drastic change of around is clearly associated with the large FS reconstruction detected at (Fig. 4 d)). At least the rather large pressure width of the anomaly ( GPa) coincides with the enhancement of the coefficient. CeRh2Si2 is thus a key example of the consequence of the interplay between electronic fluctuations (as we will discuss spin and valence fluctuations) at and a FS instability.
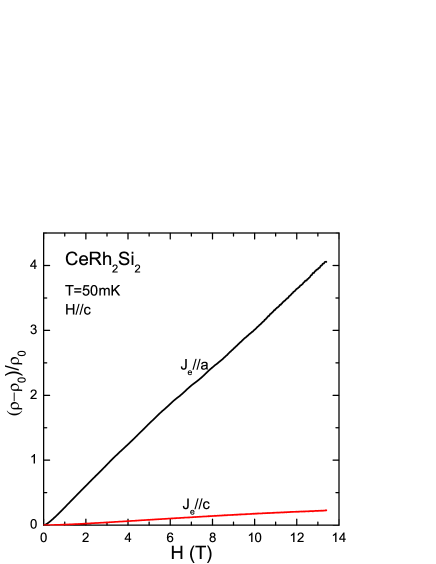
Let us now focus on the field dependance of TEP at . As in this multi-band heavy fermion system the signal of one subband is weighted by their respective electrical conductivity Barnard (1972), large magnetoresistivity may reveal different signatures. In our case, for the transversal configuration, an excellent crystal was used with RRR while for the longitudinal configuration a crystal with only RRR was measured. Figure 5 emphasizes the large magnetoresistivity detected for the by comparison to the ones.
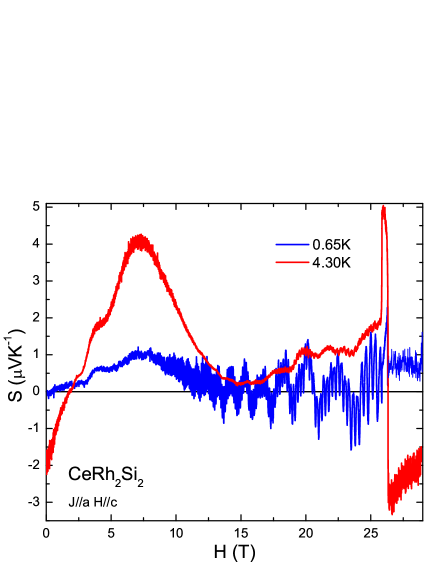
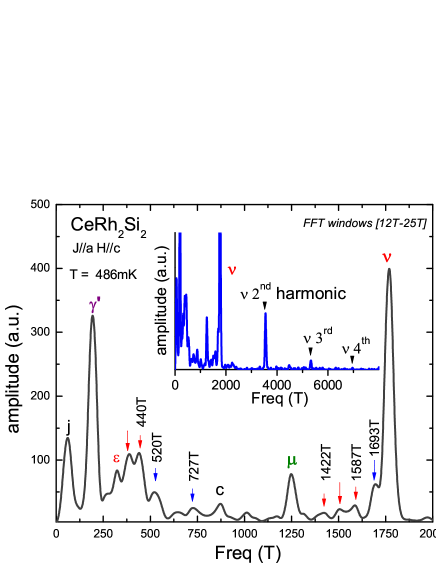
The consequence in TEP is that, for the transverse configuration, features associated with the entrance in the collision-less regime were observed already for K, as shown by the observation of large quantum oscillations in the TEP for the transverse configuration up to 4.3 K (see Fig. 6). Surprisingly, already at K for T quantum oscillations are detected up to T while no quantum oscillations signal is detected above . To get information of the FS properties of CeRh2Si2, we performed a Fast Fourier Transform (FFT) of the Seebeck signal. The spectrum for the AF2 phase of CeRh2Si2 for the highest quality sample (transverse configuration) is represented on figure 7. No oscillations have been observed in the spectrum for the AF3 and PPM phases above . The higher harmonic content of the TEP oscillations imparts a characteristic sawtooth shape to the oscillations up to the harmonics of has been observed. The frequencies in the TEP signal and those reported previously from dHvA experiments Araki et al. (2001) are listed in table 1. The frequencies detected in TEP are in good agreement with those from dHvA, although TEP measurements cannot detect the low frequencies of the FS of the AF2 state. Similarly, the various masses extracted from the TEP branches Palacio Morales are similar to the ones obtained in the dHvA experiments Araki et al. (2001): the measured effective masses go from 0.64 m0 for the branch to 5 m0 for the branch Araki et al. (2001); Abe et al. (1998). However, TEP additional frequencies have been detected corresponding to orbits of the AF2 FS which have been never detected except for frequencies close to 387 T and 1505 T which correspond to a magnetic breakdown Palacio Morales . Careful analysis of the FS determination in relation with new band structure calculation will be presented separately. Experimental studies of the TEP quantum oscillations can be found in Ref. Palacio Morales, .
| Frequencies of the phase (T) | ||
|---|---|---|
| branches | dHvA (Ref. Araki et al., 2001) | |
| T | T | |
| l | ||
| k | ||
| j | ||
| c | ||
| a | ||
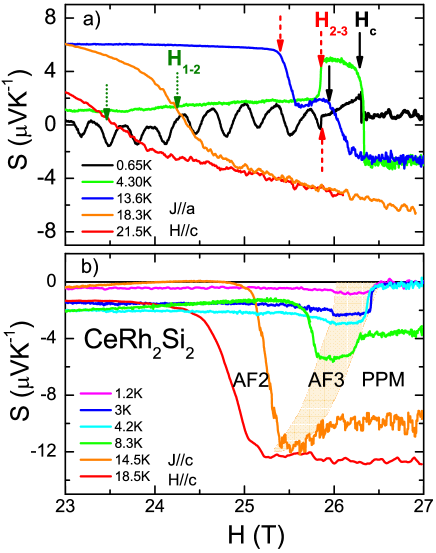
As shown in Fig. 8, the transitions AF2-AF3 and AF3-PPM are characterized by a rapid change in the absolute value of the TEP coefficient and by an hysteric behavior confirming the first order nature of the transitions. Moreover, these transitions show a change of TEP in the low temperature regime. At the lowest temperature ( K), shows large quantum oscillations up to the AF2-AF3 transition at =25.7 T. At the AF3-PPM transition at T a very sharp drop of appears. A higher temperature ( K), drops sharply at and . For =17 K, the transition, AF1-PPM, becomes broad with no hysteresis and the broadening marks the suppression of the AF order with a second order transition. For the longitudinal configuration, see Fig. 8 b), the evolution of the AF3 phase, can also be observed. The collapse of the AF3 phase occurs at . The (, ) phase diagrams determined with these different anomalies (with c and ) are in excellent agreement as can be seen in Fig.1. Knafo et al. (2010); Settai et al. (1997); Abe et al. (1997), the slight difference in the position of the AF2 boundary is only due to the difficulty to select precisely the anomalies above .
IV Discussion
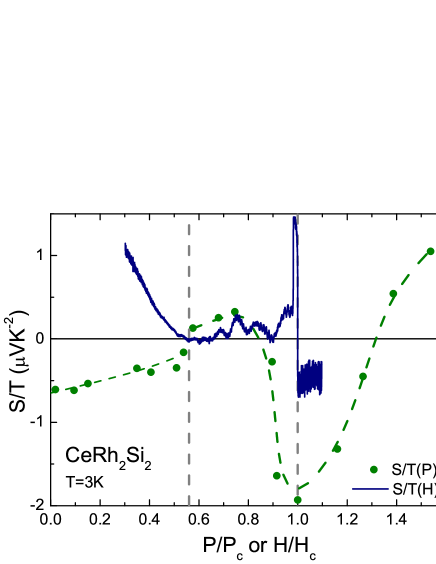
Drastic changes of the TEP are observed on crossing and . Figure 9 shows at K the respective and dependence of as function of the reduced parameters and . The large width of the anomaly across contrasts with the sharp feature of the field scan at . In magnetic field scans, two main features occur: i) the disappearance of the quantum oscillations above pointing out major FS change connected with the unfolding of the Brillouin zone, ii) a step in the macroscopic signal reflecting clearly the strong metamagnetic transition at (magnetization jump per Ce atom) coupled with a strong change of dominant heat carriers. Under pressure, the quantum phase transition at is marked by a broad negative signature directly linked with anomalies in the residual resistivity, in the Hall effect Boursier (2005), and in the dependance of the sublattice magnetization which drastically collapses. Evidence is given from thermal expansion measurements Villaume et al. (2008) that the quantum phase transition at is weakly first order. Also the domain of the dependence of the resistivity does not shrink to zero as predicted and observed for AF second order quantum critical pointLöhneysen et al. (2007): a dependence of is observed for all pressures Araki et al. (2002); Boursier (2005).
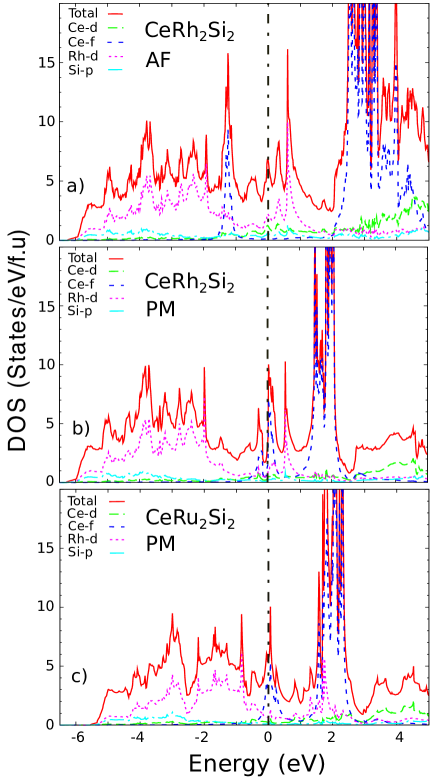
The first order nature of the transition at appears in good agreement with the drastic change of the FS reported in dHvA experiments Araki et al. (2001). Far below , at ambient pressure, the electrons are considered to be localized as no main contribution appears at the Fermi level. De facto the angular dependence of the large dHvA frequencies can be explained by those of LaRh2Si2. Due to the magnetic order, the magnetic Brillouin zone is 8 times smaller than that of body centered tetragonal Brillouin zone. The density of states, calculated by an LDA+U method with the U=5eV in the framework of full potential linearized augmented plane wave (FLAPW) method are represented on Fig. 10. We performed the calculations with self-consistently determining the charge density and the density matrices for the nonmagnetic state and with assuming Ce-f1 occupation for the orbital of the density matrices for the magnetic state, taking the eight CeRh2Si2 formula magnetic unit cell for the 4q-magnetic order with the proper magnetic alignmentKawarazaki et al. (2000). For the 4q-AF state, there is no direct contribution from the Ce- states at the FS but in the PM state the states are now located around the Fermi level and have large contribution to the FS. This new approach opens the possibility to understand the FS topology with an initial itinerant picture by incorporating the large molecular field () created by the robust AF (concomitant large and ) and the creation of a new Brillouin zone. Let us point out that the PM density of states of CeRh2Si2 is quite similar to the one obtained for CeRu2Si2; the extension of the calculation for CeRu2Si2 to strong magnetic polarization shows that in CeRu2Si2 a deep shift of the level from the FS occurs above its metamagnetic transitionSuzuki and Harima (2010).
It is appealing to propose that the sign change of at 3 K right at marks the switch from a localized to an itinerant nature of the electrons as it was proposed for a Kondo latticeHoshino and Kuramoto (2013) inside the AF domain with the particularity of very low energy strong local fluctuations driven by a Lifshitz transition. Experimental evidences for such a scenario have been reported for the system CeRu2(SixGe1-x)2 Aoki et al. (2014). However, as shown in Fig. 4d) no drastic change of dHvA frequencies has been observed and the and branches are almost not affected at . The branch has not been observed above . These small differences in the observed branches below and above seem to reflect the Brillouin zone change between the AF1 and AF2 phases due to the different ordering vectors. Furthermore, there is no signature of energy decrease of the excitations in TEP. As the transition AF2-AF1 is of first order at Araki et al. (2001); Knafo et al. (2010), the possibility of additional electronic Lifshitz transition at remains. There is strong deviation from resistivity behavior at but it can be explained in the frame of AF2-AF1 inhomogeneous mixingBoursier (2005). In addition, there is no doubt that above the new FS is in agreement with itinerant quasiparticles.
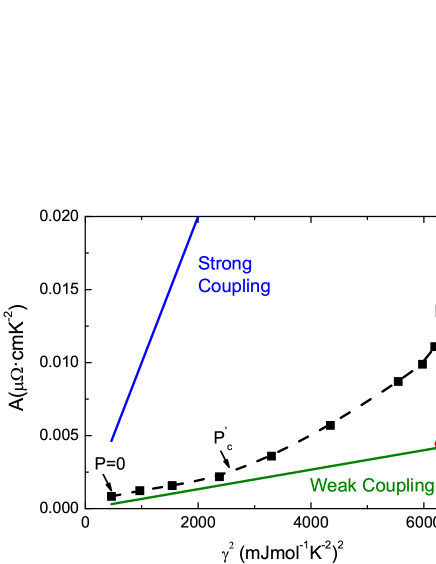
At , CeRh2Si2 is very close to enter in the mixed valence regime, i.e close to the characteristic valence pressure Flouquet (2005); Watanabe and Miyake (2013). Proofs of this proximity are given (i) by the decrease of the magnetic anisotropy (the maximum of the susceptibility ratio between c and a axis varying from 6 at to already 2 at 0.098 GPa) Mori et al. (1999), (ii) by the strong variation of the thermal expansion ratio (going from 0.23, 0.73 and 1 for =0.041, 0.077 and 0.104 GPa) Villaume et al. (2008), (iii) by the weak value of the Kadowaki Woods (KW) ratio on both sides of . The KW ratio is drawn in Fig.11 taking the value from Ref. Araki et al., 2002 and from Ref. Graf et al., 1997, respectively. In the case of strong coupling (Ce level degeneracy N=2), is predicted to reach cm(Kmole/mJ)2 while in the case of weak coupling (N=6 full Ce degeneracy) the ratio is reduced by an order of magnitude ( )Miyake et al. (1989); Tsujii et al. (2005). Due to the large strength of Hint for and the low contribution of the localized component at the Fermi level, is near the weak coupling limit. Strong increase of KW ratio is observed on approaching , but on increasing slightly the pressure above , tends again towards the weak coupling case. Let us just note that for the case of YbRh2Si2 (discussed later) a strong coupling is observed Gegenwart et al. (2008). The main difference in CeRh2Si2 is that the interplay of rather comparable Kondo and AF correlations restores a local Ce picture with well resolved crystal field levels Willers et al. (2012). But on increasing pressure, assuming a invariance of the bare crystal field (with characteristic energy ), the concomitant increase of the Kondo energy and collapse of AF interactions leads to quench the full angular momentum via the Kondo coupling: the crystal field is no more efficient to operate. Nevertheless, further high pressure measurements, far above , must be performed to fully validate this hypothesis.
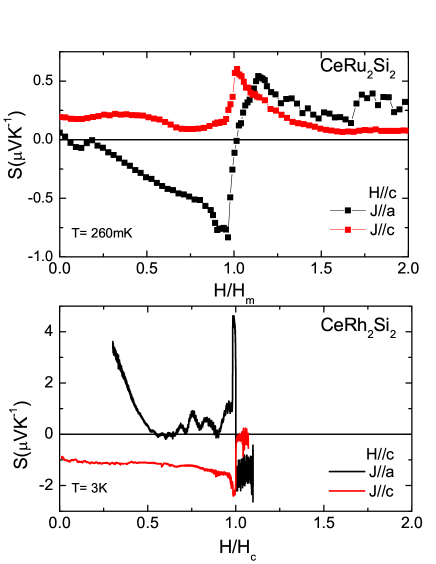
It is worthwhile to compare the TEP signal of CeRh2Si2 with the one of CeRu2Si2 as this system, already in the PM state at ( GPa), is a reference in the study of pseudometamagnetic phenomena. Pseudomagnetism in CeRh2Si2 appears above for a magnetic field (40 T close to Pc Hamamoto et al. (2000)). can be interpreted as a crossover continuation of the metamagnetic field Flouquet (2005); Amato et al. (1989); Pourret et al. (2014). Expanding the volume via La or Ge dopings leads to recover AF long range order and first order metamagnetism under magnetic field Flouquet (2005); Aoki et al. (2014). We will focus here on the difference in magnetic response of the undoped pure lattice. At ambient pressure at the metamagnetic field T, the Sommerfeld coefficient of CeRh2Si2 reaches 80 mJmole-1K-2 while CeRu2Si2 at reaches a value of mJmole-1K-2. We notice that the factor 10 between the values is related to the ratio of their relevant energies, then we can compare their TEP response taking into account this factor 10 in temperature analysis.. Figure 12 shows the longitudinal and transverse TEP responses of CeRu2Si2 at 290 mK by comparison to the CeRh2Si2 ones at 3 K. At in CeRu2Si2 a drastic change of the FS has been reported Aoki et al. (2014, 1995); Julian et al. (1994) and is associated with a strong increase of and right at preserving a quasi constant ratio. Due to the large magnetoresistivity anisotropy, the transverse and longitudinal signals have opposite sign response at . However, the metamagnetic transitions present quite similar width, 2T, for transverse and longitudinal configurations. This width is quite larger than the width detected for CeRh2Si2 at ( 0.02). Comparing to UCoAl that presents a first order metamagnetic transition from PM to FM, we notice that a sharp change of at the transition also occurs in this compound Palacio-Morales et al. (2013). Thus, the TEP signal in CeRh2Si2 at is clearly governed by the strong first order nature of the metamagnetic transition while the FS crossover detected at in CeRu2Si2 is characteristic of a sole Lifshitz transition.
These new CeRh2Si2 data lead to emphasize its difference with the isostructural Yb compound YbRh2Si2. Previous discussions can be found in refs. Knebel et al., 2006; Boursier et al., 2008. In case of CeRh2Si2 there is no divergence of or coefficient at or . Such phenomena have been reported for the Yb heavy fermion system YbRh2Si2 (T mK) as the magnetic field is swept through the AF phase transition ( T along the easy axis)Gegenwart et al. (2008); Si et al. (2001); Steglich et al. (2014). Kondo breakdown has been involved in this system with the new idea of local quantum criticality with fluctuations between small and large FS. Although a signature of a FS change has been observed in Hall effect Paschen et al. (2004) no corresponding variation in the TEP can be detected on approaching for Machida et al. (2012). However a Lifshitz transition appears at T as the magnetic polarization reaches a critical value Pfau et al. (2013); Pourret et al. (2013); Boukahil et al. (2014). The common feature of the anomaly at in YbRh2Si2 and here at the first order transition of CeRh2Si2 at is the crossing through a critical value of electronic polarization. Indeed, this mechanism may imply metamagnetism (case of CeRu2Si2) or not (case of YbRh2Si2).
Recently the observation of the itinerant nature of electrons in YbRh2Si2 in the PM phase above at zero magnetic field Güttler et al. (2014) (in good agreement with previous dHvA experiments Rourke et al. (2008); Knebel et al. (2006)) leads to a strong suspicion on the switch of the localization to describe the quantum phase transition. A new approach is so called strong coupling theory of heavy fermion criticality Abrahams et al. (2014), the basic phenomena being that critical spin fluctuations of the AF wave vector induces fluctuations at small with the consequence of diverging effective mass over the whole FS.
In the weak coupling case of CeRh2Si2, the switch from itinerant to localized picture is driven by the onset of the AF order and its associated Brillouin zone change. The consequence on YbRh2Si2 is still an open question as the magnetic structure has not been determined yet. CeRh2Si2 presents the additional property to lose its magnetic anisotropy under pressure presumably on entering in the mixed valence regime while in YbRh2Si2 the change of the anisotropy on entering in the trivalent regime seems to occur only above 90 kbar Knebel et al. (2006). As emphasized at in CeRh2Si2 the intersite magnetic coupling () is higher or comparable to the Kondo energy. In YbRh2Si2 it is quite the opposite however the trivalent configuration can be stabilized enough to present very low energy excitation and at the end in the mK range to order magnetically since the 13 electrons of the shell () are strongly localized by comparison to the caseFlouquet and Harima (2009).
V Conclusion
Figure 13 shows the suggested (, , ) phase diagram for CeRh2Si2 obtained from TEP measurements. The (, , ) lines as well as the (, , ) ones have been determined by TEP measurements. Due to the first order nature of the quantum phase transition at , the Fermi liquid (FL) temperature below which FL law is obeyed is finite at ( 2 K). The lines drawn on the (, , ) planes (using partly Ref. Knafo et al., 2010) are possible guesses with terminating at a critical end point with a continuation by a cross over line above . Another possibility, as it happens for the system Ce(Rh0.92Ru0.08 )2Si2 Machida et al. (2013), will be the collapse of at and thus a decoupling between and . In this phase diagram, the superconducting (SC) domain glued on is represented; the SC territory appears quite narrow. Clearly, it is necessary to revisit the SC properties.
Our main message is that AF, PM and PPM phases have three different FS. As with scan in high magnetic field ( for and for ) no phase transition is expected, no modification of the FS topology may occur in the PPM domain. As discussed for the pseudometamagnetism of CeRu2Si2 Miyake and Ikeda (2006); Daou et al. (2006); Suzuki and Harima (2010), an itinerant description on CeRh2Si2 close to whatever is the strength of the magnetic field seems a sound approach. To confirm the validity of our conclusions, new experiments must be realized. For example at , inelastic neutron scattering measurements on single crystal will confirm or not if the intersite magnetic coupling overpasses the Kondo energy and will establish if the crystal field excitations are dispersionless. Further high pressure experiments far above will validate or not our proposal of the proximity of and . The loss of the Ising character on crossing must be confirmed by microscopic measurements. By high energy spectroscopy experiments, the pressure evolution of the trivalent occupancy number (nf) should be determined as well as the crystal structure. A recent advance is a precise determination of the FS at zero pressure in both PM () and AF () by ARPES Vyalikh . Furthermore, dHvA signal change at on entering in the PPM phase has been recently observed directly Sheikin2013.
We thank H. Harima, D. Vyalikh, Y. Ōnuki, S. Araki and P. Wölfle for many useful discussions. This work has been supported by the French ANR (projects PRINCESS), the ERC (starting grant NewHeavyFermion), ICC-IMR, KAKENHI, REIMEI, the EuromagNET II (EU contract no. 228043), LNCMI-CNRS is member of the European Magnetic Field Laboratory (EMFL).
References
- Löhneysen et al. (2007) H. Löhneysen, A. Rosch, M. Vojta, and P. Wölfle, Rev. Mod. Phys. 79, 1015 (2007).
- Flouquet (2005) J. Flouquet, Progress in Low Temperature Physics (Elsevier, Amsterdam, 2005) pp. Vol. 15, Chap. 2, 139.
- Aoki et al. (2014) H. Aoki, N. Kimura, and T. Terashima, J. Phys. Soc. Jpn. 83, 072001 (2014).
- Araki et al. (2001) S. Araki, R. Settai, T. C. Kobayashi, H. Harima, and Y. Ōnuki, Phys. Rev. B 64, 224417 (2001).
- Araki et al. (2002) S. Araki, M. Nakashima, and R. Settai, J. Phys. Condens. Matter 14, L377 (2002).
- Abe et al. (1998) H. Abe, H. Kitazawa, and H. Aoki, J. Phys, Soc. Jpn. 67, 1852 (1998).
- Kawarazaki et al. (2000) S. Kawarazaki, M. Sato, Y. Miyako, N. Chigusa, K. Watanabe, N. Metoki, Y. Koike, and M. Nishi, Phys. Rev. B 61, 4167 (2000).
- Graf et al. (1997) T. Graf, J. D. Thompson, M. F. Hundley, R. Movshovich, Z. Fisk, and D. Mandrus,R. A. Fisher, and N. E. Phillips, Phys. Rev. Lett. 78, 3769 (1997).
- Graf et al. (1998) T. Graf, M. F. Hundley, R. Modler, R. Movshovich, J. D. Thompson, D. Mandrus, R. A. Fisher, and N. E. Phillips, Phys. Rev. B 57, 7442 (1998).
- Knafo et al. (2010) W. Knafo, D. Aoki, D. Vignolles, B. Vignolle, Y. Klein, C. Jaudet, A. Villaume, C. Proust, and J. Flouquet, Phys. Rev. B 81, 094403 (2010).
- Settai et al. (1997) R. Settai, A. Misawa, S. Araki, M. Kosaki, K. Sugiyama, T. Takeuchi, K. Kindo, Y. Haga, E. Yamamoto, and Y. Ōnuki, J. Phys. Soc. Jpn. 66, 2260 (1997).
- Abe et al. (1997) H. Abe, H. Suzuki, H. Kitazawa, T. Matsumo, and G. Kido, J. Phys, Soc. Jpn. 66, 2525 (1997).
- Movshovich et al. (1996) R. Movshovich, T. Graf, D. Mandrus, J. D. Thompson, J. L. Smith, and Z. Fisk, Phys. Rev. B 53, 8241 (1996).
- Boursier (2005) R. Boursier, Ph.D. thesis, Université Grenoble Alpes (2005).
- (15) A. Palacio Morales, PhD. Thesis, Université Grenoble Alpes (2014) .
- Barnard (1972) R. D. Barnard, Thermoelectricity in Metals and Alloys (Taylor & Francis, London, 1972).
- Villaume et al. (2008) A. Villaume, D. Aoki, Y. Haga, G. Knebel, R. Boursier, and J. Flouquet, J. Phys.: Cond. Mat. 20, 015203 (2008).
- Suzuki and Harima (2010) M.-T. Suzuki and H. Harima, J. Phys. Soc. Jpn. 79, 024705 (2010).
- Hoshino and Kuramoto (2013) S. Hoshino and Y. Kuramoto, Phys. Rev. Lett. 111, 026401 (2013).
- Watanabe and Miyake (2013) S. Watanabe and K. Miyake, J. Phys. Soc. Jpn. 82, 083704 (2013).
- Mori et al. (1999) H. Mori, N. Takeshita, N. Mo, and Y. Uwatoko, Physica B 261, 259 (1999).
- Miyake et al. (1989) K. Miyake, T. Matsuura, and C. Varma, Solid State Commun. 71, 1149 (1989).
- Tsujii et al. (2005) N. Tsujii, H. Kontani, and K. Yoshimura, Phys. Rev. Lett. 94, 057201 (2005).
- Gegenwart et al. (2008) P. Gegenwart, Q. Si, and F. Steglich, Nature Phys. 4, 186 (2008).
- Willers et al. (2012) T. Willers, D. T. Adroja, B. D. Rainford, Z. Hu, N. Hollmann, P. O. Körner, Y.-Y. Chin, D. Schmitz, H. H. Hsieh, H.-J. Lin, C. T. Chen, E. D. Bauer, J. L. Sarrao, K. J. McClellan, D. Byler, C. Geibel, F. Steglich, H. Aoki, P. Lejay, A. Tanaka, L. H. Tjeng, and A. Severing, Phys. Rev. B 85, 035117 (2012).
- Hamamoto et al. (2000) T. Hamamoto, K. Kindo, T. C. Kobayashi, Y. Uwatoko, S. Araki, R. Settai, and Y. Ōnuki, Physica B 282, 281 (2000).
- Amato et al. (1989) A. Amato, D. Jaccard, J. Sierro, P. Haen, P. Lejay, and J. Flouquet, J. Low Temp. Phys. 77, 195 (1989).
- Pourret et al. (2014) A. Pourret, D. Aoki, M. Boukahil, J.-P. Brison, W. Knafo, G. Knebel, S. Raymond, M. Taupin, Y. Ōnuki, and J. Flouquet, J. Phys. Soc. Jpn. 83, 061002 (2014).
- Aoki et al. (1995) H. Aoki, M. Takashita, S. Uji, T. Terashima, K. Maezawa, R. Settai, and Y. Ōnuki, Physica B 206-207, 26 (1995).
- Julian et al. (1994) S. Julian, F. Tautz, G. McMullan, and G. Lonzarich, Physica B 199-200, 63 (1994).
- Palacio-Morales et al. (2013) A. Palacio-Morales, A. Pourret, G. Knebel, T. Combier, D. Aoki, H. Harima, and J. Flouquet, Phys. Rev. Lett. 110, 116404 (2013).
- Knebel et al. (2006) G. Knebel, R. Boursier, E. Hassinger, G. Lapertot, P. G. Niklowitz, A. Pourret, B. Salce, J. P. Sanchez, I. Sheikin, P. Bonville, H. Harima, and J. Flouquet, J. Phys. Soc. Jpn. 75, 114709 (2006).
- Boursier et al. (2008) R. Boursier, A. Villaume, G. Lapertot, D. Aoki, G. Knebel, and J. Flouquet, Physica B 403, 726 (2008).
- Si et al. (2001) Q. Si, S. Rabello, K. Ingersent, and J. L. Smith, Nature 413, 804 (2001).
- Steglich et al. (2014) F. Steglich, H. Pfau, S. Lausberg, S. Hamann, P. Sun, U. Stockert, M. Brando, S. Friedemann, C. Krellner, C. Geibel, S. Wirth, S. Kirchner, E. Abrahams, and Q. Si, J. Phys. Soc. Jpn. 83, 061001 (2014).
- Paschen et al. (2004) S. Paschen, T. Lühmann, S. Wirth, P. Gegenwart, O. Trovarelli, C. Geibel, F. Steglich, P. Coleman, and Q. Si, Nature 432, 881 (2004).
- Machida et al. (2012) Y. Machida, K. Tomokuni, C. Ogura, K. Izawa, K. Kuga, S. Nakatsuji, G. Lapertot, G. Knebel, J.-P. Brison, and J. Flouquet, Phys. Rev. Lett. 109, 156405 (2012).
- Pfau et al. (2013) H. Pfau, R. Daou, S. Lausberg, H. R. Naren, M. Brando, S. Friedemann, S. Wirth, T. Westerkamp, U. Stockert, P. Gegenwart, C. Krellner, C. Geibel, G. Zwicknagl, and F. Steglich, Phys. Rev. Lett. 110, 256403 (2013).
- Pourret et al. (2013) A. Pourret, G. Knebel, T. D. Matsuda, G. Lapertot, and J. Flouquet, J. Phys. Soc. Jpn. 82, 053704 (2013).
- Boukahil et al. (2014) M. Boukahil, A. Pourret, G. Knebel, D. Aoki, Y. Ōnuki, and J. Flouquet, Phys. Rev. B 90, 075127 (2014).
- Güttler et al. (2014) M. Güttler, K. Kummer, S. Patil, M. Höppner, A. Hannaske, S. Danzenbächer, M. Shi, M. Radovic, E. Rienks, C. Laubschat, C. Geibel, and D. V. Vyalikh, Phys. Rev. B 90, 195138 (2014).
- Rourke et al. (2008) P. M. C. Rourke, A. McCollam, G. Lapertot, G. Knebel, J. Flouquet, and S. R. Julian, Phys. Rev. Lett. 101, 237205 (2008).
- Abrahams et al. (2014) E. Abrahams, J. Schmalian, and P. Wölfle, Phys. Rev. B 90, 045105 (2014).
- Flouquet and Harima (2009) J. Flouquet and H. Harima, arXiv:0910.3110 (2009).
- Machida et al. (2013) Y. Machida, K. Izawa, D. Aoki, G. Knebel, A. Pourret, and J. Flouquet, J. Phys. Soc. Jpn. 82, 054704 (2013).
- Miyake and Ikeda (2006) K. Miyake and H. Ikeda, J. Phys. Soc. Jpn. 75, 033704 (2006).
- Daou et al. (2006) R. Daou, C. Bergemann, and S. R. Julian, Phys. Rev. Lett. 96, 026401 (2006).
- (48) D. V. Vyalikh, To be published .
- (49) I. Sheikin, To be published and Habilitation, Université Grenoble Alpes (2013) .