Correlations between promoter activity and its nucleotide positions in spacing region
Abstract
Transcription is one of the essential processes for cells to read genetic information encoded in genes, which is initiated by the binding of RNA polymerase to related promoter. Experiments have found that the nucleotide sequence of promoter has great influence on gene expression strength, or promoter activity. In synthetic biology, one interesting question is how we can synthesize a promoter with given activity, and which positions of promoter sequence are important for determining its activity. In this study, based on recent experimental data, correlations between promoter activity and its sequence positions are analyzed by various methods. Our results show that, except nucleotides in the two highly conserved regions, box and box, influences of nucleotides in other positions are also not neglectable. For example, modifications of nucleotides around position in spacing region may change promoter activity in a large scale. The results of this study might be helpful to our understanding of biophysical mechanism of gene transcription, and may also be helpful to the design of synthetic cell factory.
I Introduction
In cells, generic information is transcribed from DNA template to messenger RNAs (mRNAs) by RNA polymerase (RNAP) through a series of complex processes, called transcription. The key step that starts transcription is the binding of RNAP to a special nucleotide sequence in DNA, which usually lies to the upstream of transcription start site of the gene, and is called promoter Mulligan1984 ; Ross1993RNApromoter ; Cheetham1999RNApromoter ; Campbell2002 . Experimental data show that expression strength of corresponding gene, or protein production rate, is greatly influenced by the nucleotide sequence of promoter Hawley1983Nature ; Ruhdal1998LibrarySpacer ; Jensen1998 . Therefore, it is important for synthetic biology and genetic engineering to choose appropriate promoter to achieve needed expression strength. Meanwhile, experiments also find that the activity of a promoter does not change with genes it expresses Alper2005LibraryReuse ; Mutalik2013Reuse ; Cox2007Reuse ; Barnard2007Reuse . It means that a promoter with strong activity in expression of one gene can always express other genes in relatively high strength. Therefore, it is biologically meaningful to establish promoter libraries with promoter strength (or activity) changing in a large scale, as those have been experimentally done in Jensen1998 ; Mey2007LibraryNearby ; Alper2005LibraryReuse ; Rud2006Library ; Rhodius2012 ; Lu2012 ; Wu2013 . Meanwhile, in order to understand the regulation mechanism of promoter in gene expression, various nucleotide sequence dependent models are also designed, which are expected to be applicable in real cells Kiryu2005Support ; Rhodius2010OtherPredict ; Kinney2010Regulatory ; Brewster2012Plos ; Li2014 .
For a constitutive promoter, i.e. its activity is not influenced by transcription factors, the initiation rate of transcription is mainly determined by RNAP binding rate to corresponding promoter. As almost all previous theoretical studies about promoter activity, this study assumes that the RNAP binding rate depends only on the nucleotide sequence of promoter. It has been found that, in E. coli, promoters include two highly conserved hexamers, which are usually called box and box, and they are essential to promoter activity Hawley1983Nature ; Ross1993RNApromoter ; Ruhdal1998LibrarySpacer . In some theoretical models, only nucleotides in these two regions, as well as the discriminator region and transcription start region, are considered in detail. While for the spacing region between and boxes, only the length of it is assumed to contribute to promoter activity as a model penalty term. Rhodius2010OtherPredict . However, recent experimental data presented in Wu2013 show that promoter activity also changes with the nucleotide types in spacing region.
Although in some theoretical studies, nucleotides in the spacing region are also included explicitly, correlations between sequence positions in spacing region and promoter activity are not discussed Jensen1998 ; Ruhdal1998LibrarySpacer ; Kiryu2005Support ; Kinney2010Regulatory ; Brewster2012Plos . In this study, based on promoter libraries given in Wu2013 ; Mutalik2013Reuse , these correlations are calculated by various methods. Here, large values of correlation mean that promoter activity changes greatly with nucleotide type at this position, while small values of correlation mean that promoter activity is insensitive to the nucleotide type at this position. Our results show that, except sequence positions around the box and box, nucleotides at positions , , and , which lie in the spacing region, play important roles in determining promoter activity. On the contrary, nucleotides at positions and seem to be of no significance.
II Results
The importance of nucleotide hexamers in box and box of a promoter has been discussed previously Dehaseth1998 ; Hawley1983Nature ; Djordjevic2011 . The main aim of this study is to find which positions in spacing region are important for promoter activity. In other words, modifications of nucleotides in these positions may change expression strength greatly. To achieve this, a linear model is designed to describe the relationship between nucleotide sequence and promoter activity, which is based on basic principles of statistical physics and the assumption that the strength of gene expression is proportionate to RNAP binding rate to promoter (see Sec. III).
For the data from Wang’s study group Wu2013 , promoter sequences are only different in spacing region, i.e. from position to . So in our analysis, only nucleotides in spacing region are considered. The data obtained by Mutalik et al in Mutalik2013Reuse consist of three groups, which are denoted by mpl, rpl, and pilot. But in no matter which group of them, nucleotide hexamers in box and box are not fixed. Therefore, nucleotide sequence from position to are considered in our analysis. For each promoter, the length of its spacing region is 17.
The relationship between nucleotide sequence and promoter activity is described by three mer models with . Here mer model assumes that promoter activity can be determined by all adjacent nucleotide groups, and at each sequence position , there are altogether variables, which consist of all permutations of nucleotides A, T, G, C, and , where “” means that the corresponding nucleotide is missed. Due to the large number of variables, partial least squares (PLS) regression is used in calculations. To improve model accuracy, 10-fold cross-validation is used in the PLS regression (see Sec. III).
For each group of experimental data of promoter strength obtained in Wu2013 ; Mutalik2013Reuse , model coefficient values related to each sequence position can be obtained by PLS regression with 10-fold cross validation. We calculate their variance and range (defined as the difference between their maximum and minimum), which are regarded as two criteria of influence of the corresponding sequence position to promoter activity. The main difference between variance and range is that, variance is the average value of deviations of model coefficient values from their average while the range only describes their variation range.
The main aim of this study is to analyze the correlation between sequence position, especially those in spacing region, and promoter activity by using all the four data groups in Wu2013 ; Mutalik2013Reuse . But the scales of variances and ranges obtained from the four data groups with three versions of mer model are different. If operating on these values directly, the information in small scale values will be absorbed by that in large scale values, and therefore they influence will be weakened inappropriately. To avoid this, we turn all variances and ranges into so-called scores by following method. We sort positions from 1 to 35 (17 for Wang’s data) by their variances (or ranges) in descending order. The position ranked th is scored (scored for Wang’ data). So far, for each data group, based on the variance and range of the three mer models, six scores can be obtained. For convenience, scores obtained by the variance and range of mer model are denoted by and respectively. At the same time, another score based on F-statistic can be obtained by the following idea. If promoter activity depends greatly on a position, then the precision of corresponding model with this position neglected will be low. So its 10-fold cross-validation error will be large. Using this 10-fold cross-validation error and by the same method as discussed above, one new score can be obtained for each sequence position, which is denoted by for simplicity. Note that, in calculations of score , the 10-fold cross-validation errors are obtained by mer model.
For each group of data, we have altogether seven scores. For Wang’s data, the score of position in spacing region ranges from 1 to 17, while for other three groups of data, the score ranges from 1 to 35. To place all scores in the same level, linear transformations are applied to each of the 28 scores such that for each score, its minimal and maximal values corresponding to sequence positions in spacing region are 0 and 100 respectively. See Table SI-SIV in supplemental for the processed data.
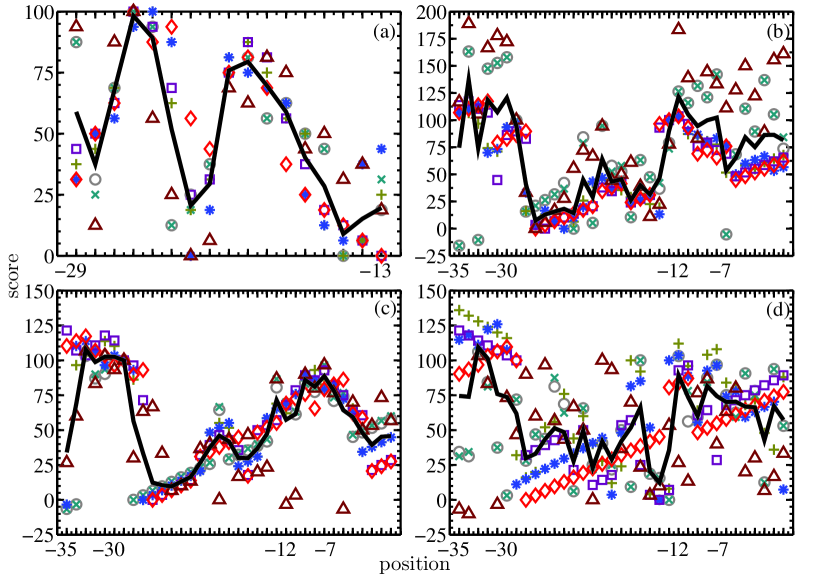
Due to the differences of strains and measurement methods used in different experiments Wu2013 ; Mutalik2013Reuse , correlations between sequence position and promoter activity obtained from different data may be different. The seven scores as well as their average obtained from each data group are plotted in Figs. 1(a-d), see also Table SI,SII,SIII,SIV for the score details supplemental . Where x-axis shows the promoter sequence position, and y-axis shows the corresponding score. To distinguish the scores and their average, different markers and colors are used in Figs. 1(a-d), which are listed at the bottom of Fig. 1. The average scores obtained from data groups mpl, rpl, and pilot measured in Mutalik2013Reuse , see the thick black lines in Figs. 1(c-d), show that the box and box are the most important regions, while the spacing region (the region between and boxes) is the least important region. Which is consistent with previous experimental observations. The scores of spacing region positions near these two boxes are also high. For data groups Wang, mpl, and rpl, positions around also have high scores. However, according to data Wang, positions around get higher scores than those around position . For data pilot, average score oscillates in spacing region and reaches its maximum at position . The average scores listed in Table SV (see supplemental ) show that, for data Wang, the four most important positions in spacing region are , and the four least important positions are . For data mpl, the most important position in spacing region is , and the least important position is . For data rpl, the most important positions in spacing region are , while the least important positions are . Finally, for data pilot, the most important positions in spacing region are , and the least important positions are , and .
In the following, we will use three methods to put all the 28 scores together to find the most/least relevant positions in spacing region, which are expected to be generally true in any E. coli strain. One straight-forward method is to calculate the weighted average of the four average scores obtained from the four data groups, with sample numbers as the weights. The sample numbers for data Wang, mpl, rpl, and pilot are 35, 69, 113, and 154 respectively. Since the sequence length of promoters in Wang’s data is different from those in data mpl, rpl, and pilot. We only average the four average scores in spacing region, i.e. from position to position . In other regions, the overall average is obtained by the three data groups mpl, rpl, and pilot. All the 28 scores and their average value are plotted in Fig. 2(c). These plots show that, generally, the and boxes are more important for determining promoter activity, while the spacing region is the least relevant region. From the average scores listed in Table SV (see supplemental ), we found that, except the two positions which are adjacent to or boxes, the most important positions in spacing region are and , while the least relevant positions are and . For convenience, this method to calculate the average score is call weighted score method (WSM).
The second method to find the correlation of sequence position in spacing region to promoter activity is called four partitions method (FPM). Since for each data group, the sequence positions in spacing region are divided into four relevant groups, important group, sub-important group, sub-unimportant group, and unimportant group. In this method, sequence positions in spacing region are firstly sorted in descending order according to their average scores. Then the first five positions are assigned to the important group, and the rest 12 positions are assigned to the other three groups in turn, with four positions in each group, see Table SVII supplemental . Then for each sequence position, we count the number of times it lies in the four relevant groups, see columns 2 to 5 in Table SIX supplemental . According to this method, position , which is adjacent to the box, is the most important position in spacing region because it is assigned to important group three times and assigned to sub-important group one time. The important positions in spacing region which are not adjacent to or boxes are and , and the most unimportant positions are and .
The third method to discuss the correlation between sequence position and promoter activity is called signed-rank and rank-sum method (SRRSM). In which, according to the seven scores from each data group, the sequence positions are divided into three groups by Wilcoxon signed-rank test and Wilcoxon rank-sum test (see Sec. III), see Table SVIII in supplemental . According to these tests, the score of any position in the first group is larger than that of any position in the third group with significance level . For any position in spacing region, the number of times that it lies in given group is listed in Table SX supplemental . Which shows that the most important positions are , , , , and , while the most unimportant position is .
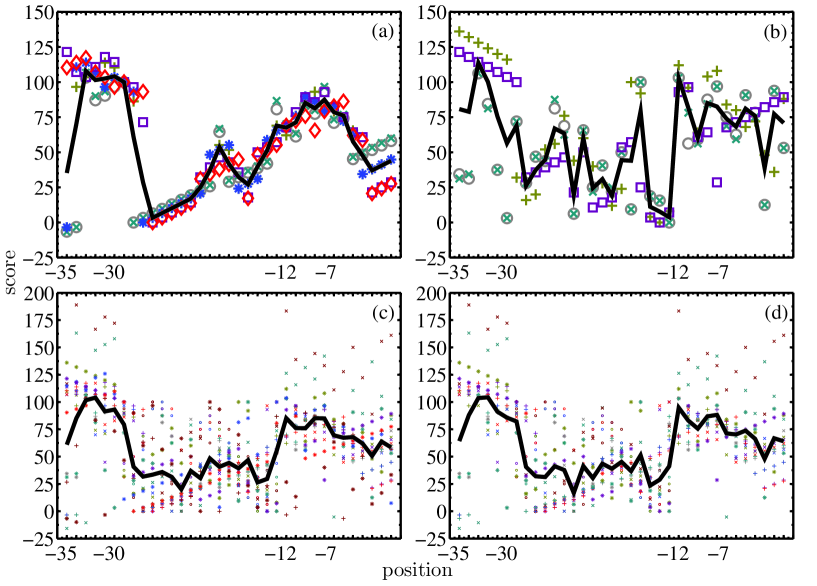
The reason that we used seven different ways to calculate position score for each data group is that, generally, sort results of sequence positions obtained by different scoring methods are not the same, but we cannot know which one of them is more reasonable. In previous discussion, we simply used their average to sort sequence positions in spacing region of promoter. Another method to deal with this problem is to use data clustering method to exclude the scores that are much different from others. Or in other words, we only keep and average the scores that give similar sort results, and exclude the ones that the sort results obtained by them are peculiar (see Sec. III). Since we are mainly interested in the relevant of sequence positions in spacing region, in data clustering process only scores of the spacing region positions are used. The results of clustering are plotted in Figs. S1 (a,b,c,d) supplemental . In this study, scores with clustering distance larger than 0.55 will be excluded. For data Wang and mpl, no score is excluded. For data rpl, only the score is excluded. While for data pilot, only scores , and are kept.
Through data clustering with distance criterion 0.55, there is no change for data Wang and mpl. The new average scores of data rpl and pilot, obtained by averaging only the survival scores (scores with distance less than 0.55), are plotted in Fig. 2(a) and Fig. 2(b) respectively. See also Table SVI in supplemental for their detailed values. Fig. 2(a) shows that, for data rpl, except the positions adjacent to or boxes, position is the most important one, while position is the most unimportant one. But for data pilot, the most important position is , and the most unimportant positions are . All the 23 survival scores and their weighted average, with sample numbers as weights, are plotted in Fig. 2(d). The sorted sequence positions in spacing region obtained by the data clustering method are listed in Table SVI supplemental . This clustering method gives that, except the positions adjacent to or boxes, the most important and unimportant positions in spacing region are , and respectively. This method is denoted by CWSM.
The four partitions method can also be modified by using data clustering process, which is denoted by CFPM. The new four partitions of the four data groups are listed in Table SVII (see supplemental ), and the number of times that sequence position lies in given partition is summarized in Table SIX supplemental , which shows that positions , , and are important while the positions and are unimportant. Similarly, the results of data clustering version of SRRSM (denoted by CSRRSM) are listed in Table SVIII and Table SX supplemental . Where the results for data group pilot are not presented since there are only four survival scores which are not enough to get reliable results from Wilcoxon signed-rank test or Wilcoxon rank-sum test. The results in Table SX show that positions , , , and are more important, while position seems to be unimportant supplemental .
Finally, the importances of sequence positions in spacing region obtained from the six methods are summarized in Table 1 supplemental . It can be found that, in the region between position and , positions , , and play special roles in promoter activity. On the contrary, positions and seem to be of no significance. Here we neglect positions , , , and because they are too closed to the or boxes.
III Methods
III.1 The mer models
Let be gene expression strength. According to basic principles of statistical physics and the assumption that strength of gene expression is proportional to attachment rate of RNA polymerase (RNAP) to the upstream promoter, we have
| (1) |
where is the energy barrier of RNAP attachment to promoter. is the Boltzmann constant. is absolute temperature, and in this study, (37∘C) is used. The constant depends on all other experimental conditions such as the concentration of RNAP, the speed of transcription elongation and termination, as well as the speed of the following translation process. Therefore, the value of will be different for data measured in different experiments.
We assume that the energy barrier can be completely determined by the nucleotide sequence of promoter Li2014 . The simplest way to establish this relationship is to assume that each sequence position contributes to independently and additively, and can be given by the following linear combination,
| (2) |
in which is the set of sequence positions, and is the nucleotide at position ( means the nucleotide at position is missing). For data group Wang Wu2013 ,
| (3) |
while for data groups mpl, rpl, and pilot Mutalik2013Reuse ,
| (4) |
If the expression of is replaced by
| (5) |
i.e. the total energy barrier is completely determined by all adjacent nucleotide groups of length 2, then we get the mer model. Finally, if
| (6) |
then the corresponding model is called mer model.
The mer model (1,2) can be reformulated as follows
| (7) |
where , for , is defined as follows
| (8) |
For each promoter sample, its nucleotide sequence corresponds to a vector . Values of and can be determined from measured data through partial least square regression (PLSR). Similarly, from the mer model and mer model, we obtained
| (9) |
and
| (10) |
respectively. Where
| (11) |
Note that, the sample numbers of data groups Wang, mpl, rpl, and pilot are 35, 69, 113, and 154 respectively. But the number of unknown variables in the above mer models may be very larger. For example, the mer model for data group Wang includes variables, and the mer model for data groups mpl, rpl, and pilot includes variables. This is why this study uses PLSR but not LSR as usual.
To avoid overfitting, the number of principal components in PLSR is determined by 10-fold cross-validation. The promoter samples in each data group are randomly divided into 10 groups for 100 times. For each given number of principal components, we calculated the cross-validation error of each division, and then take their average as the cross-validation error of this component number. The error we used in this study is given by , where is the predicted strength of gene expression. The number of principal components will be accepted when the corresponding cross-validation error reaches its minimal value. Finally, model coefficients are determined by all promoter samples in corresponding data group through PLSR with the previously determined principal component number.
III.2 Scores corresponding to variance and range of model coefficients
All scores of each sequence position are calculated from its related model coefficients. For the mer models, the related coefficients of position are the coefficients of , for . For the mer models, the related model coefficients for position (or for data Wang) are the coefficients of and , for . The related coefficients for positions and are the coefficients of and , respectively. Similarly, for data group Wang, the related model coefficients for positions and are the coefficients of and , respectively. Finally, for the mer models, the related model coefficients for position (or for data Wang) are the coefficients of , , and . The model coefficients related to position are the coefficients of . The ones related to position are the coefficients of and . The ones related to position are the coefficients of and , and the ones related to position are the coefficients of . For data group Wang, the model coefficients related to positions can be obtained similarly. Here, . From these related model coefficients, the variance and range in mer model can be obtained as described in section II.
III.3 Scores corresponding to F-statistic
For the mer model given in Eq. (7), if the contribution to promoter activity from the nucleotide at position is excluded, it will become
| (12) |
From this modified model, a new principal component number of optimal PLSR can be found, together with a new optimal cross-validation error. By ranking sequence positions according to the descending order of these optimal cross-validation errors, the score can then be obtained as described in Sec. II.
III.4 Wilcoxon signed-rank test and Wilcoxon rank-sum test
Suppose that, for each data group, the seven scores of each sequence position are independent and identically distributed random variables, then we can use Wilcoxon signed-rank test and Wilcoxon rank-sum test to show if the scores of a given position are significantly larger than those of others under a given significance . In this study, is used, and each pair of sequence positions is tested by these two methods. The difference between two positions is regarded to be significant if at least one of the two tests is significant. All sequence positions are then divided into three partitions such that any position in the first partition has significantly larger score than that of any one in the third partition. See Table SVIII in supplemental for the results of partition. Finally, the importance of position can then be analyzed by the three partitions for the four data groups as described in Sec. II.
III.5 Data clustering
For the seven score vectors of each data group (see columns 2-8 in Tables SI-SIV supplemental ), data clustering is performed by following methods. The distance between any two score vectors and is defined as , with to be the correlation coefficient. Firstly, distance between any two score vectors is calculated. The two closest score vectors are then clustered and replaced by their average, which is considered as a new point but with weight 2 in the following calculation of average. Repeat this process until all score vectors are clustered together. In this study, two score vectors will be regarded to be in the same class if the distance between them is shorter than 0.55, see Fig. S1 in supplemental . In other words, the correlation between them is larger than 0.45. Only score classes which include more than one score are consider, and the ones include only one score are excluded. Our calculations show that, for any one of the four data groups which used in this study, there exists only one effective data class. For such a special case, the above data clustering process is equivalent to an excluding process.
IV Remark and discussion
It seems that the largest and smallest (negative) coefficients in various mer models are also reasonable evaluation criterions of sequence position importance. But it is not the case. For example, when model coefficients related to one sequence position are all very large, the corresponding correlation between this position and promoter activity may be not significant if their variance is very small. Since for such cases, the promoter activity is not sensitive to the nucleotide type in this position. In fact, one of the main aims of this study is to find that, in the synthesis process of promotor, the nucleotide in which positions should be chosen more carefully to achieve needed promoter activity, and the influence of nucleotide type in which positions can be neglectable. In other words, a sequence position has strong correlation with promoter activity means that, if the nucleotide in this position is not chosen properly, the promoter activity may vary in a large scale.
Except the correlation between single sequence position and promoter activity, we have also tried to analyze the importance of adjacent sequence position groups, i.e. tried to find which position groups (with two or three adjacent positions) are important for determining promoter activity, and which ones are not. However, for these complex cases, only the mer models for can be used. Therefore, there are only four or even two kinds of scores for each data group, which are not enough to get reliable results about the position importance. Therefore, the corresponding results are not shown in the study.
To analyze the importance of sequence positions in spacing region, in the initial stage of this study, we have tried to group the promoters in data groups mpl, rpl, and pilot by their box and box. Since after this pretreatment, in each group, the nucleotide sequences in box and box are the same, so the sequence positions in spacing region can be scored easily. However, after this grouping, sample numbers of each subgroups are usually too small (usually less than 10) to get reliable results. Meanwhile, it is also unreliable if we only consider the spacing region positions but neglect the difference in and boxes. Therefore, in this study, all sequence positions, including the ones in spacing region, and boxes, and the discriminator region, are scored simultaneously, though only the normalized ones in spacing region are finally used.
In summary, the correlation between promoter sequence positions in spacing region, especially from position to , and its activity is discussed based on three mer models. From the data presented in Wu2013 , we found that position in promoter sequence is the most important one to determine promoter activity. While the data groups mpl and rpl presented in Mutalik2013Reuse show that position is the most important one, and data group pilot in Mutalik2013Reuse shows position is the most important. These differences may be caused by the different E. coli strains used in experiments. To find the most important/unimportant positions that might be generally true for any E. coli strain, three methods, WSM, FPM, and SRRSM, are used to integrate all the 28 scores obtained from four data groups. The results suggest that positions around display strong correlations with promoter activity, while the nucleotide type at position is almost irrelevant to promoter activity. Meanwhile, three modified methods are also used in the analysis, in which scores are firstly clustered to exclude the peculiar ones. But similar results are obtained, see Table 1 in supplemental .
Acknowledgements.
This study was supported by the Natural Science Foundation of China (Grant No. 11271083), and the National Basic Research Program of China (National “973” program, project No. 2011CBA00804).References
- (1) Martin E.Mulligan, Diane K.Hawley, Robert Entriken, and William R.McClure. Escherichia coli promoter sequences predict in vitro RNA polymerase selectivity. Nucleic Acids Research, 12:789–800, 1984.
- (2) Wilma Ross, Khoosheh K. Gosink, Julia Salomon, Kazuhiko Igarashi, Chao Zou, Akira Ishihama, Konstantin Severinov, and Richard L. Gourse. A third recognition element in bacterial promoters: DNA binding by the alpha subunit of RNA polymerase. Science, 262(5138):1407–1413, November 1993.
- (3) Graham M. T. Cheetham, David Jeruzalmi, and Thomas A Steitz. Structural basis for initiation of transcription from an RNA polymerase promoter complex. Nature, 399:80–83, May 1999.
- (4) Elizabeth A. Campbell, Oriana Muzzin, Mark Chlenov, Jing L. Sun, C. Anders Olson, Oren Weinman, Michelle L. Trester-Zedlitz, , and Seth A. Darst. Structure of the bacterial RNA polymerase promoter specificity subunit. Molecular Cell, 9:527–539, 2002.
- (5) Diane K. Hawley and William R. McClure. Compilation and analysis of Escherichia coli promoter DNA sequences. Nucleic Acids Research, 11(8):2237–2255, 1983.
- (6) Peter Ruhdal Jensen and Karin Hammer. The sequence of spacers between the consensus sequences modulates the strength of prokaryotic promoters. Applied and Environmental Microbiology, 64(1):82–87, January 1998.
- (7) Peter Ruhdal Jensen and Karin Hammer. Artificial promoters for metabolic optimization. Biotechnology and Bioengineering, 58:191–195, December 1998.
- (8) Hal Alper, Curt Fischer, Elke Nevoigt, and Gregory Stephanopoulos. Tuning genetic control through promoter engineering. Proc. Natl. Acad. Sci. USA, 102(36):12678–12683, August 2005.
- (9) Vivek K Mutalik, Joao C Guimaraes, Guillaume Cambray, Colin Lam, Marc Juul Christoffersen, Quynh-Anh Mai, Andrew B Tran, Morgan Paull, Jay D Keasling, Adam P Arkin, and Drew Endy. Precise and reliable gene expression via standard transcription and translation initiation elements. Nature Methods, 10(4):354–360, April 2013.
- (10) Robert Sidney Cox, Michael G Surette, and Michael B Elowitz. Programming gene expression with combinatorial promoters. Molecular Systems Biology, 3:145, November 2007.
- (11) India G. Hook-Barnard and Deborah M. Hinton. Transcription initiation by mix and match elements: flexibility for polymerase binding to bacterial promoters. Gene Regulation and Systems Biology, 1:275–293, December 2007.
- (12) Marjan De Mey, Jo Maertens, Gaspard J Lequeux, Wim K Soetaert1, and Erick J Vandamme. Construction and model-based analysis of a promoter library for E. coli: an indispensable tool for metabolic engineering. BMC Biotechnology, 7(34), June 2007.
- (13) Ida Rud, Peter Ruhdal Jensen, Kristine Naterstad, and Lars Axelsson. A synthetic promoter library for constitutive gene expression in lactobacillus plantarum. Microbiology, 152(4):1011–1019, April 2006.
- (14) Virgil A. Rhodius, Vivek K. Mutalik, and Carol A. Gross. Predicting the strength of UP-elements and full-length E. coli promoters. Nucleic Acids Research, 40:2907–2924, 2012.
- (15) Jiao Lu, Jinlei Tang, Yi Liu, Xinna Zhu, Tongcun Zhang, and Xueli Zhang. Combinatorial modulation of galP and glk gene expression for improved alternative glucose utilization. Appl Microbiol Biotechnol, 93:2455–2462, 2012.
- (16) Yuanqing Wu, Yuanyuan Zhang, Ran Tu, Hao Liu, and Qinhong Wang. Construction of synthetic promoters for Escherichia coli and application in the biosynthesis of cis,cis-muconic acid. Chinese Journal of Biotechnology, 29(6):760–771, June 2013.
- (17) Hisanori Kiryu, Taku Oshima, and Kiyoshi Asai. Extracting relations between promoter sequences and their strengths from microarray data. Bioinformatics, 21(7):1062–1068, April 2005.
- (18) Virgil A. Rhodius and Vivek K. Mutalik. Predicting strength and function for promoters of the Escherichia coli alternative sigma factor, . Proc. Natl. Acad. Sci. USA, 107(7):2854–2859, February 2010.
- (19) Justin B. Kinney, Anand Murugan, Jr Curtis G. Callan, and Edward C. Cox. Using deep sequencing to characterize the biophysical mechanism of a transcriptional regulatory sequence. Proc. Natl. Acad. Sci. USA, 107(20):9158–9163, May 2010.
- (20) Robert C. Brewster, Daniel L. Jones1, and Rob Phillips. Tuning promoter strength through RNA polymerase binding site design in Escherichia coli. PLoS Computational Biology, 8(12):e1002811, December 2012.
- (21) Jingwei Li and Yunxin Zhang. Relationship between promoter sequence and its strength in gene expression. Eur. Phys. J. E, 37:86, 2014.
- (22) The supplementary materials including ten tables and one figure (URL to be provided by the journal).
- (23) P. L. Dehaseth, M. L. Zupancic, and M. T. Record Jr. RNA polymerase-promoter interactions: the comings and goings of RNA polymerase. Journal of Bacteriology, 180:3019–3025, 1998.
- (24) Marko Djordjevic. Redefining Escherichia coli promoter elements: motif as a complement of the motif. Journal of Bacteriology, 193:6305–6314, 2011.
| WSM | CWSM | FPM | CFPM | SRRSM | CSRRSM | |
|---|---|---|---|---|---|---|
| Important | -20 -19 -18 -17 -16 | -16 | -20 -19 | -20 -19 | -20 -19 -18 -16 | -20 -19 -18 |
| Unimportant | -23 -15 | -23 -15 | -23 -15 | -23 -15 | -23 | -23 |