A multilayer surface detector for ultracold neutrons
Abstract
A multilayer surface detector for ultracold neutrons (UCNs) is described. The top 10B layer is exposed to vacuum and directly captures UCNs. The ZnS:Ag layer beneath the 10B layer is a few microns thick, which is sufficient to detect the charged particles from the 10B(n,)7Li neutron-capture reaction, while thin enough that ample light due to and 7Li escapes for detection by photomultiplier tubes. A 100-nm thick 10B layer gives high UCN detection efficiency, as determined by the mean UCN kinetic energy, detector materials and others. Low background, including negligible sensitivity to ambient neutrons, has also been verified through pulse-shape analysis and comparisons with other existing 3He and 10B detectors. This type of detector has been configured in different ways for UCN flux monitoring, development of UCN guides and neutron lifetime research.
keywords:
Ultracold neutrons , Multilayer surface detector , 10B nanometer thin film , neutron detection efficiency , low background1 Introduction
Detection of ultracold neutrons (UCNs), or neutrons with kinetic energies less than about 300 neV (1 neV = 10-9 eV), is much like detection of thermal neutrons. That is, the same neutron-capture reactions, such as 3He(n, p)3H, 6Li(n,)3H, 10B(n, )7Li and 157Gd(n,)158Gd, are used to turn neutrons into charged particles or -rays [1, 2, 3, 4, 5, 6]. The charged particles and -rays released from the capture reactions have kinetic energies ranging from hundreds of keV to a few MeV and can be readily detected using gas ionization chambers or scintillators.
Detection of UCNs, unlike detecting thermal neutrons, is sensitive to the surface conditions, gravity, magnetic fields and ambient gas conditions. All of these factors can modify UCN velocities and therefore alter inelastic scatterings of UCNs as well as UCN capture or absorption. Sensitivity of UCNs to gravity, magnetic fields, material structures and phases of matter provides opportunities to probe these forces or material structures with a precision that is inaccessible to methods using charged particles. On the other hand, it is a common UCN detector challenge to reduce non-UCN background in all of the measurements since a.) UCN counting rates are typically low and the UCN signals are similar to background signals, in particular background neutron signals that can come from upscattered UCNs, thermal and higher energy neutrons; b.) Production of UCNs using either nuclear reactors or accelerators also generates higher energy neutrons and -rays that easily outnumber the UCN population.
The UCN absorption mean free path () is given by [7, 8, 9]
| (1) |
where the neutron absorption time () in solid 10B is independent of the neutron velocity () and can be calculated from thermal neutron absorption cross section, 3842 barn for the (n,) process, = 9.0 ns. Here is the solid density of 10B and the neutron thermal velocity. For UCNs at 4.4 m/s, nm. The de Broglie wavelength of UCN () is longer than [10],
| (2) |
where is in nm, the kinetic energy of the neutron () in neV and the velocity of the neutron () in m/s. For a UCN with a kinetic energy of 100 neV or a velocity of 4.4 m/s, nm.
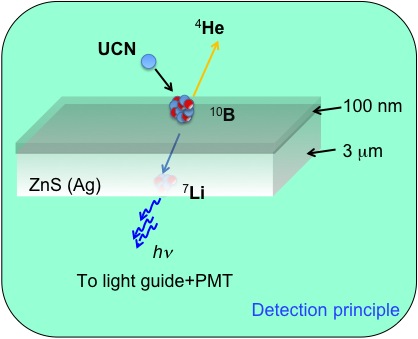
We describe a multilayer surface detector for UCNs based on 10B thin-film capture of neutrons. The top 10B layer is exposed to vacuum and directly captures UCNs. The ZnS:Ag luminescent layer is beneath the 10B layer. The effective ZnS layer thickness measured using a 148Gd source is a few microns thick, which is sufficient to stop the charges from the 10B(n,)7Li neutron-capture reaction while thin enough that light due to and 7Li escapes for detection by photomultiplier tubes. The average 10B film thickness does not exceed 300 nm.
Below we first present the working principle of the detector and some relevant material properties, followed by some details of the detector design and construction. Next, we describe detector operation, detector performance, and correlate the detector performance with 10B-film characterization. The losses of efficiency are discussed towards the end, leaving room for further efficiency improvement through better understanding of the surface texture.
2 Detection principle and material properties
The working principle of the detector is illustrated in Fig. 1. The detector design takes several lengths into account: UCN capture length (), and 7Li ion ranges () in solid 10B and ZnS, and light attenuation in ZnS and light-guide. Compared with gas-based detectors, using only solid components in the detector removes the need for a material window. Compared with bulk 7Li- or 10B-doped scintillators for thermal neutrons, a 100-nm thick thin-film coating is sufficient since is only 40 nm for UCNs at 4.4 m/s. An ideal UCN detection efficiency up to 95% is expected for a film thickness of 3, or about 120 nm. When the UCN reflection from the 10B coated ZnS:Ag surface is taken into account, the efficiency can be reduced further by more than 20% due to reflection, as shown below.
The ion ranges in 10B and ZnS are calculated using the Stopping and Range of Ions in Matter (SRIM) code [11] and summarized in Table 1. Since the ion ranges are many times the 10B film thickness , the charged particle energy losses in the 10B are small, except for ions that move at large angles with respect to the surface normal. For the 0.84 MeV 7Li, the full ion stopping in 10B only occurs when the angle is greater than , or about 86 degrees for nm. The corresponding loss of detection efficiency is about 3% due to the 0.84 MeV 7Li loss alone. The total efficiency loss for the two branching ratios and both and 7Li in the 10B layer is
| (3) |
for a flat uniform 10B layer thickness . The values of ’s are given in Table 1. For nm, %.
| Ion | Energy | Range in 10B | Range in ZnS |
|---|---|---|---|
| (probability, ) | (, MeV) | (, m) | (, m) |
| (47%) | 1.47 | 3.5 | 4.2 |
| (3%) | 1.78 | 4.4 | 5.1 |
| 7Li (47%) | 0.84 | 1.8 | 2.3 |
| 7Li (3%) | 1.02 | 2.1 | 2.5 |
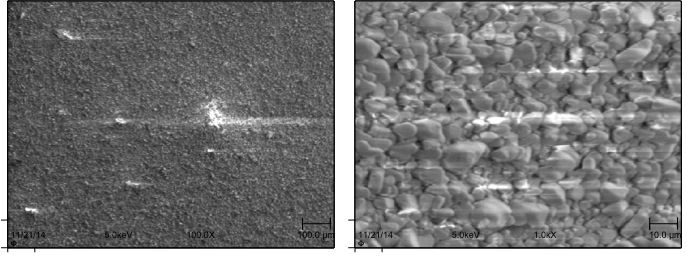
ZnS:Ag coated acrylic acetate sheets (around 120 µm thick) were obtained commercially [12] and used as the substrates for 10B thin-film coating. According to the vendor, a transparent thermo-setting adhesive is applied to the acetate surface for ZnS:Ag bonding, so the ZnS:Ag facing the 10B is not coated with any adhesive. The ZnS:Ag powder is 16 µm on average. Scanning electron microscope measurements of a lightly 10B-coated ZnS, Fig. 2, indicates the size dispersion of the ZnS powder, which also determines the surface roughness of the detector.
Undoped ZnS emits light at 333 nm and 349 nm wavelengths, corresponding to the near bandgap energies at 3.55 eV and 3.72 eV respectively [13, 14]. The near-bandgap emissions are strongly self-absorbed. ZnS can be doped in a variety of ways that shift the emission peaks to longer wavelengths and significantly reduce self-absorption [15, 16]. The silver-doped ZnS emits blue light that peaks around 450 nm, with a characteristic decay time around 200 ns. According to Knoll [3], the relative light yield in ZnS:Ag due to stopping is about 130% of NaI(Tl) (3.8104 Photons/MeV), i.e., the light yield is 4.9 104 photons/MeV. Based on the data sheets from Eljen Technology as well as Leo [17], the light yield of is 300% of anthracene (1.74104 photons/MeV), or 5.2104 photons/MeV. Their reports agree within 10%. The absolute light yield for the present work is not quantified; so we use the previous data to estimate the light yield for the two different ’s to be 7.4 104 photons (1.47 MeV) and 9.0 104 photons (1.78 MeV) respectively.
3 Detector design and construction
Highly enriched elemental 10B ( 99 wt%) in powder form was obtained from Ceradyne Boron Products. The 10B powder was placed in a carbon crucible and an electron-beam melted and evaporated the 10B onto the ZnS screens. The distance between the crucible and the ZnS screen was about half a meter, sufficient to maintain the acrylic acetate sheets below 50oC without any active cooling. A quartz microbalance (in-situ) and a small sapphire witness plate (offline) were used together to monitor the coating thickness.
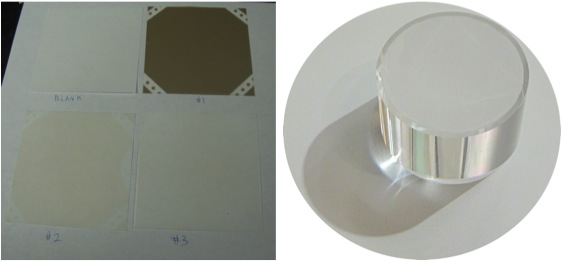
A few examples of the 10B-coated ZnS:Ag screens are shown in Fig. 3a. The darkest color one (upper right) corresponds to a thick 10B coating exceeding 200 nm. The thinner coatings are shown on the lower left and lower right. A blank ZnS:Ag screen is shown on the upper left for comparison.
Two types of detectors have been built. In Fig. 3b, one of the lightly coated screens is cut to fit within the diameter of an acrylic lightguide. The screen is glued (Dow Corning Sylgard 184 Silicone Elastomer) to the lightguide. To remove the trapped air in the glue, the freshly glued screen is vacuum pumped down at a rate of 0.6 l/s for one to two hours, until no visible bubbles exist in the silicone layer.
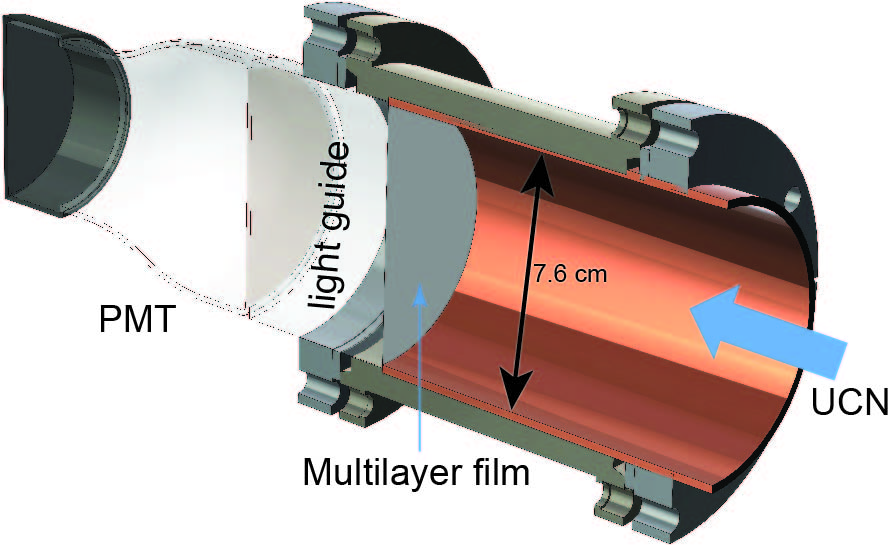
A 7.6-cm (3′′) diameter photomultiplier (PMT) is coupled to the ZnS-screen-covered light-guide to form a detector as shown in Fig. 4. A rubber O-ring about 2.5 cm from the ZnS screen provides the vacuum seal. Half of the lightguide is inside the vacuum, the other half is outside the vacuum. This type of detector has been used for UCN flux monitoring, as well as flux studies as a function of height relative to the UCN beamline.
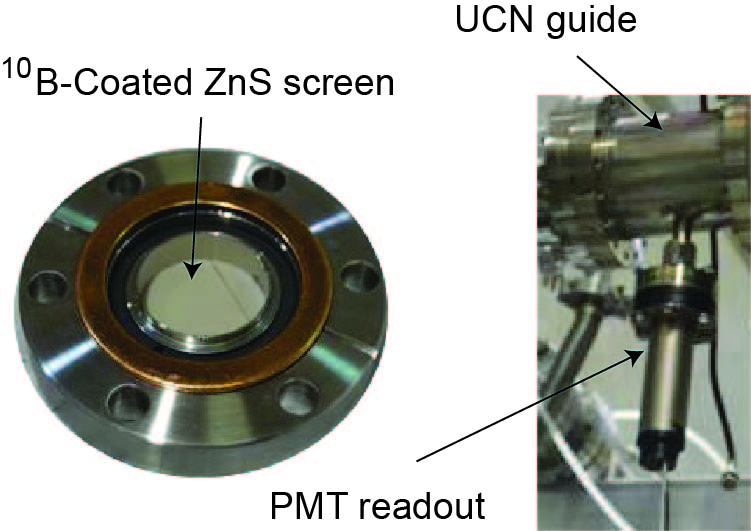
A second type of detector with a smaller 10B area and without an acrylic lightguide is shown in Fig. 5 (Left). The 7-cm (2-3/4′′) diameter conflat flange with a transparent window is used to house a 10B coated ZnS screen. A smaller (2.5 cm in diameter) PMT is then attached to the window from outside the vacuum. The whole detector assemble is attached to a port on a UCN guide, shown in Fig. 5 (Right). This type of detector was used to examine UCN detection efficiency, as well as for UCN transport studies in UCN guides and flux monitoring.
4 Results and discussion
Since there is ample light due to the and 7Li ion stopping in ZnS:Ag, we could directly digitize the electric pulses from the PMT’s. When an ORTEC 113 scintillation preamplifier was used (set to 0 input capacitance), we could reduce the PMT DC bias by up to 600 volts from -1.6 to -1.8 kV to -1.0 to -1.2 kV. Most of the data were taken using an FADC-based waveform digitizer described in a previous work [18].
4.1 Pulse height spectra
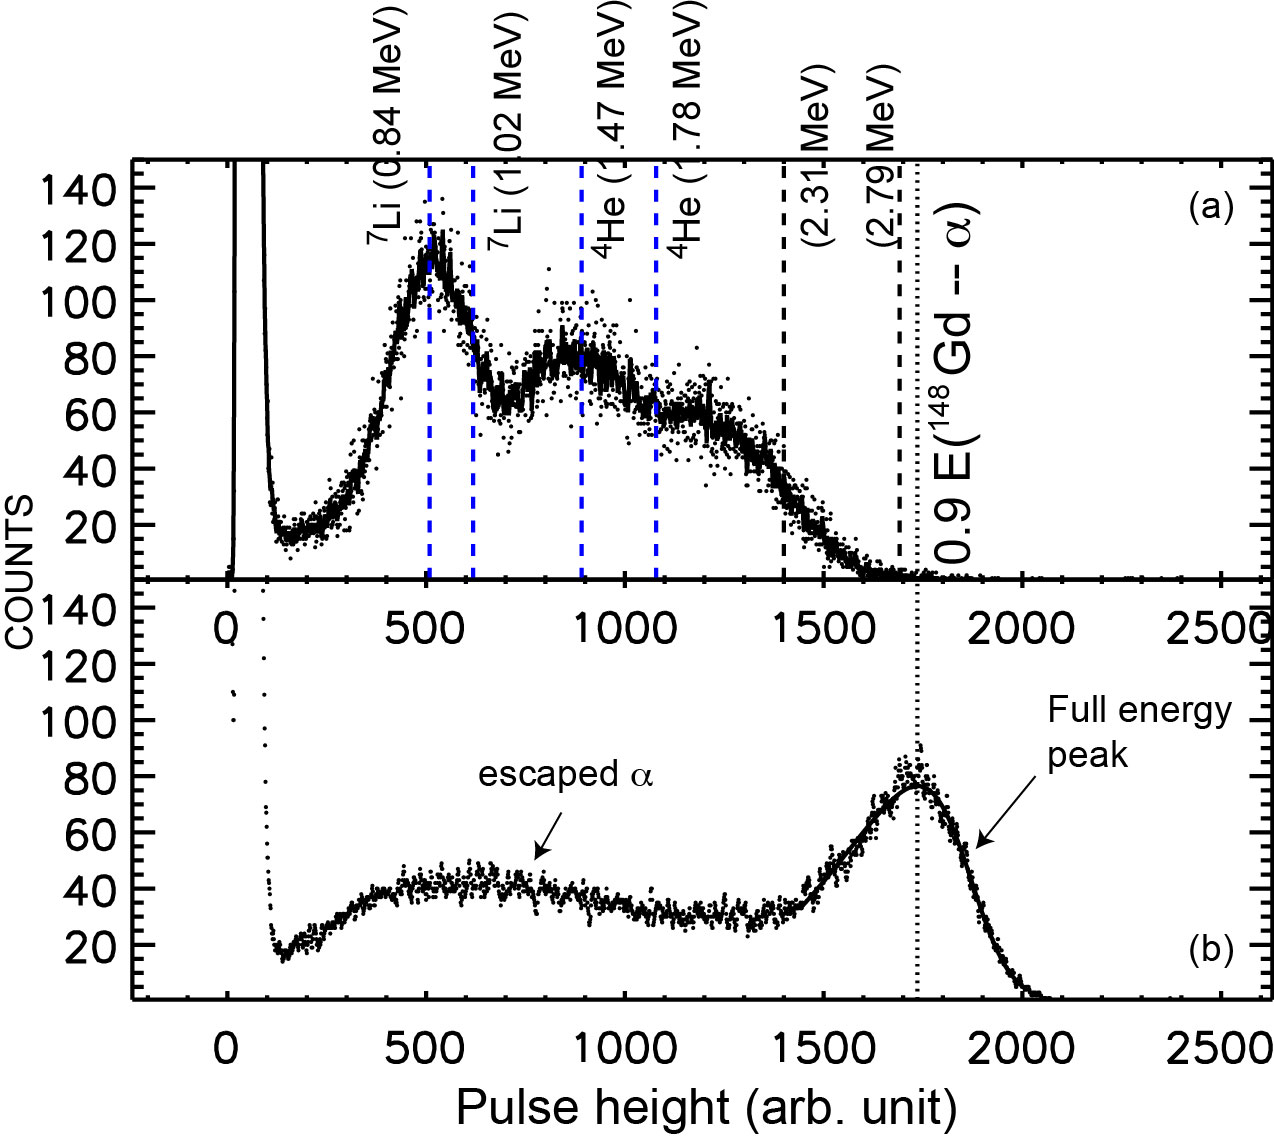
A typical pulse height spectrum (PHS) of a 10B-coated ZnS:Ag UCN detector with a lightguide is shown in Fig. 6a. The energy scale was calibrated using a 148Gd source (3.182 MeV). The PMT bias was at -1.7 kV. No ORTEC 113 scintillator preamp was used and the PMT output was digitized directly. The 7Li (0.84 MeV) peak stands out because the ion has the shortest range and the width of the peak is narrow due to the small straggling. A significant fraction of the signals appears above the 1.78 MeV (only about 3% is expected). This is attributed to the surface roughness as discussed in Fig. 2 above. The average 10B coating (film 3, this number is based on the order of film deposition) was measured to be 3.40 0.04 nm using an optical profilometer. Since the surface roughness is greater than the 10B coating thickness, as well as the stopping ranges of and 7Li in ZnS, both charge particles can be stopped in ZnS simultaneously if the charge particles leave the surface at an angle.
For energy calibration, the 148Gd peak was fit by a skewed Gaussian function [19],
| (4) |
with
| (5) |
| (6) |
and
| (7) |
The fitting parameters for the 3.182 MeV 148Gd are , , , , . The same skewed Gaussian function can also be used to fit the 0.84 MeV 7Li peak. The fitting parameters for 0.84 MeV 7Li are , , , , . The fact that the skewness parameter is positive indicates that the 0.84 MeV 7Li pulse shape is distorted by the nearby 1.02 MeV 7Li and 1.47 MeV .
The UCN-induced signals are also separated from most of the lower-amplitude background to the left ( 200 on the horizontal scale), which is attributed to the light leaks from the UCN guide side. When the detector is gated off to the UCN guide, the UCN spectrum disappears and the low-amplitude background is also reduced significantly, as shown in Fig. 7.

4.2 Film thickness and efficiency
We used the second detector configuration, similar to Fig. 5, to characterize the UCN detection efficiency as a function of 10B film thickness. A 3He gas detector [4] was used to normalize the film signals. Since the film areas were irregular, we placed a TPX screen (Polymethylpentene, Mitsui Chemicals) with a small hole ( 6 mm diameter) in front of each film to limit the UCN flux to the same film area. UCNs that missed the hole were absorbed or upscattered to higher energies. The normalized UCN efficiency as a function of the average 10B film thickness is summarized in Fig. 8. The film thickness was measured using a Zygo 3D optical surface profiler (NewView 7300). Because of the roughness of the ZnS surfaces, we used films deposited on sapphire witness plates (wafer grade) for thickness measurements.

.
4.3 Impurities in the 10B films
E-beam deposition took place in an ambient pressure Torr, which could introduce impurities to the 10B films through physical (adsorption) and chemical (4B+3O 2B2O3) processes. Ar ion sputtering and X-ray photoelectron spectroscopy (XPS) were combined to measure the impurity concentrations as a function of film depth. Some Ar contamination was observed from the XPS spectra, Fig. 9. The film (#11) has a thickness of 269.82.9 nm from the optical profilometer measurement.
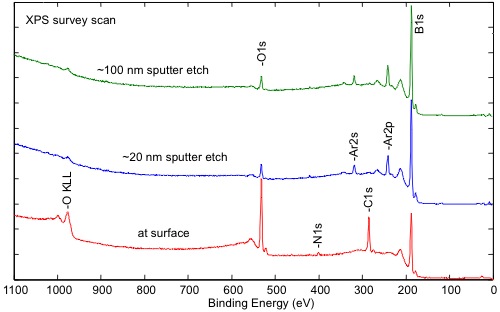
The sputtering profile data indicates that a surface transition layer is 20 nm in thickness. XPS spectrum at 20 nm is similar to the XPS spectrum at 100 nm. The bulk of the thin film shows 95% atomic B, 1% atomic C, and about 3.5% atomic O. The B2O3 layer is about 2.3 nm thick on the top of the B metal. The topmost hydrocarbon layer (paraffin equivalent) is about 0.5 nm thick. Little carbon contamination was observed for this sample. Higher carbon concentration (%) was observed in another sample, indicating that the crucible contamination can be controlled if the boron stock in the crucible is monitored closely during deposition.
4.4 Detection efficiency losses
In addition to reduced detection efficiency due to charged particle stopping in the 10B layer, = 5% for 120-nm thick film as discussed above, other losses of detection efficiency come from coherent and incoherent scattering of UCN in the 10B layer. Multiple scattering effects such as reabsorption of scattered UCNs are neglected. We consider two limits. In the upper limit, we neglect the interference of coherently scattered UCNs. The UCN detection efficiency () is given by
| (9) |
for a film thickness of . We use the subscript ‘=0’ for 10B, and for other impurities such as 11B, 16O, etc. is the atomic fraction of the th element and the corresponding number density. = cm-3. is the absorption cross section due to 10B. is the total cross section or the sum of absorption, coherent and incoherent scattering cross sections. In a pure 10B film, the ratio of the absorption cross section to the total cross section is 99.9%. Therefore the scattering loss is insignificant compared to transmission loss. For sufficiently thick film , above 95% detection efficiency can be obtained. Impurities increase the scattered UCN loss. When the film is contaminated by 3.5% of oxygen (mainly 16O with = 4.232 barn) and 1% of carbon ( = 5.551 barn), the ratio of 10B absorption to the total UCN attenuation is still 99.9%.
In the lower detection limit, the interaction of UCNs with the absorbing surface is approximated by a complex Fermi potential [8, 9]. Here r indicates the position-dependence of the potential due to, for example, surface roughness and the position-dependent nuclear compositions of the surface. We follow the same sign convention for as in [9]. For unpolarized UCNs interacting with an unpolarized surface, is given by the number density of different nuclei and their corresponding bound coherent scattering length .
Neglecting the surface roughness, a flat pure 10B surface has = -3.4 neV, = 36.3 neV, corresponding to the coherent scattering length of fm for 10B [20]. When the film is contaminated by 3.5% of oxygen (mainly 16O with fm) and 1% of carbon (mainly 12C wtih fm), the imaginary part of the Fermi potential remains the same (assuming that the 10B density remains the same, which is likely an over estimate). The real part of the Fermi potential becomes positive, 5.8 neV. We can estimate the single-bounce UCN loss due to reflection for a smooth flat surface using the formula given in [21],
| (10) |
where . is given by
| (11) |
and . Here is the incident UCN energy, the neutron rest mass, and the neutron incident angle with respect to the surface normal. By using Eq. (10), we have assumed that the 10B thickness is much greater than the neutron absorption length, which is valid for film thickness 100 nm. Otherwise, needs to be modified into a form that is algebraically more complex, which can also be found in [21].
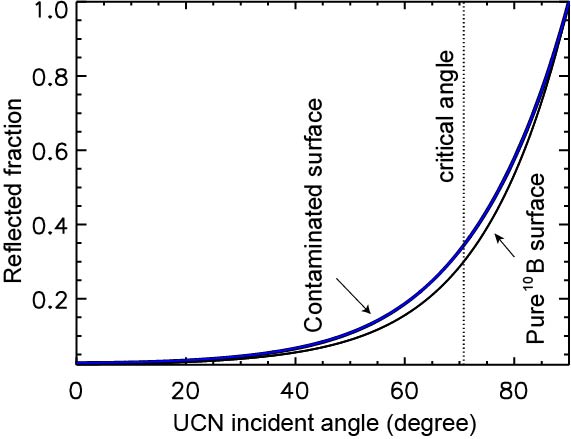
The reflected UCN fraction as a function of incident angle is plotted in Fig. 10 for the mean UCN energy of 53.5 neV. The critical angle, as in the cases of non-absorbing surface, or , is given by , or 70.8 degrees. For non-absorbing surfaces, at incident angles greater than the critical angle, . For the highly absorbing 10B surface, we notice that for . In Eq. (11), does not vanish due to finite . Because of surface roughness, however, the incident angle is not well defined. The mean reflectivity averaged over the incident angles is . The averaged UCN reflectivity for a pure 10B surface is 26.5%. For a slightly contaminated surface it is 29.0%. This relatively small difference between a pure 10B surface and a slightly contaminated surface is mainly due to the reduction in for . The measurements in Fig. 8 indicate that the UCN detection efficiency is rather insensitive to impurities of a few percent, consistent with Fig. 10. The discrepancy in efficiency loss between the single-particle scattering model Eq. (9) and the optical model will be studied by examining the effects of surface roughness.
5 Conclusions
We have demonstrated a multilayer surface detector for ultracold neutrons (UCNs). No gas is used in the detector and the UCNs are directly captured by a 10B surface. The spectra measured from UCN captures on the 10B-films consist of primarily 0.84 MeV 7Li and 1.47 MeV , as well as a significant fraction of signals which are attributed to dual-charge (7Li and together) stopping due to the uneven ZnS surface. Ambient neutron background count rate was observed to be less than 0.1 Hz (for the 10B surface area of 39.2 cm2 and the film thickness of 3.4 nm) using pulse-shape discrimination. This type of detector has been configured in several ways for UCN flux monitoring, development of UCN guides, UCN lifetime measurement [22] and UCN-induced fission research [23]. Further work is needed to understand the effects of surface roughness on the detection efficiency.
Acknowledgments This work was funded by the LDRD program of Los Alamos National Laboratory.
References
- [1] R. Stedman, Rev. Sci. Instrum. 31 (1960) 1156.
- [2] P. Convert, J. B. Forsyth (Eds.), Position-sensitive detection of thermal neutrons, Academic Press, 1983.
- [3] G. F. Knoll, Radiation Detection and Measurement, 3rd Edition, John Wiley & Sons, 2000.
- [4] C. L. Morris, et al., Nucl. Intrum. Meth. A 599 (2009) 248–250.
- [5] D. J. Dalvat, C. L. Morris, et al., Nucl. Intrum. Meth. A 691 (2012) 109–112.
- [6] T. Jenke, G. Cronenberg, H. filter, et al., Nucl. Intrum. Meth. Phys. Res. A 732 (2013) 1–8.
- [7] L. D. Landau, E. M. Lifshitz, Quantum Mechanics, non-relativistic theory, 2nd Edition, Pergamon Press, 1965.
- [8] V. K. Ignatovich, The Physics of Ultracold Neutrons, Oxford University Press, 1990.
- [9] R. Golub, D. J. Richardson, S. K. Lamoreaux, Ultra-cold neutrons, Taylor & Francis group, 1991.
- [10] G. L. Squires, Introduction to the Theory of Thermal Neutron Scattering, Dover, 1996.
- [11] J. F. Ziegler, http://www.srim.org/ (2012).
- [12] http://ebay.com/catalog/show/251579600644/.
- [13] F. A. Kröger, H. J. Vink, J. Chem. Phys. 22 (1954) 250–252.
- [14] Q. Xiong, et al., Nano. Lett. 4 (2004) 1663.
- [15] C. Feldman, T. Jüstel, C. R. Ronda, P. J. Schmidt, Adv. Func. Mat. 13(7) (2003) 511–516.
- [16] Y. Q. Li, et al., Appl. Phys. Lett. 88 (2006) 013115.
- [17] W. R. Leo, Techniques for Nuclear and Particle Physics Experiments, Springer-Verlag, 1994.
- [18] Z. Wang, C. L. Morris, F. E. Gray, et al., Nucl. Intrum. Meth. Phys. Res. A 703 (2013) 91–97.
- [19] A. O’Hagan, T. Leonard, Biometrika 63 (1976) 201–202.
- [20] http://www.ncnr.nist.gov/resources/n-lengths/.
- [21] J. Lekner, Theory of Reflection, Martinus Nijhoff Publishers, 1987.
- [22] D. J. Dalvat, et al., Phys. Rev. C 89 (2014) 052501.
- [23] L. J. Broussard, in Plutonium Futures, The Science 2014, Las Vegas, NV, (unpublished) (7–12 Sep. 2014).