Generalized Spatial Modulation in Indoor Wireless Visible Light Communication
Abstract
In this paper, we investigate the performance of generalized spatial modulation (GSM) in indoor wireless visible light communication (VLC) systems. GSM uses light emitting diodes (LED), but activates only of them at a given time. Spatial modulation and spatial multiplexing are special cases of GSM with and , respectively. We first derive an analytical upper bound on the bit error rate (BER) for maximum likelihood (ML) detection of GSM in VLC systems. Analysis and simulation results show that the derived upper bound is very tight at medium to high signal-to-noise ratios (SNR). The channel gains and channel correlations influence the GSM performance such that the best BER is achieved at an optimum LED spacing. Also, for a fixed transmission efficiency, the performance of GSM in VLC improves as the half-power semi-angle of the LEDs is decreased. We then compare the performance of GSM in VLC systems with those of other MIMO schemes such as spatial multiplexing (SMP), space shift keying (SSK), generalized space shift keying (GSSK), and spatial modulation (SM). Analysis and simulation results show that GSM in VLC outperforms the other considered MIMO schemes at moderate to high SNRs; for example, for 8 bits per channel use, GSM outperforms SMP and GSSK by about 21 dB, and SM by about 10 dB at BER.
Keywords – Visible light communication, MIMO techniques, SMP, SSK, GSSK, SM, GSM, BER analysis.
I Introduction
The radio frequency (RF) spectrum used in industrial, scientific and medical radio bands and telecommunication radio bands are crowded with various wireless communication systems. Recently, optical wireless communication technology, where information is conveyed through optical radiations in free space in outdoor and indoor environments, is emerging as a promising complementary technology to RF communication technology. While communication using infrared wavelengths has been in existence for quite some time [1],[2], more recent interest centers around indoor communication using visible light wavelengths [3],[4]. A major attraction in indoor visible light communication (VLC) is the potential to simultaneously provide both energy-efficient lighting as well as high-speed short-range communication using inexpensive high-luminance light-emitting diodes (LED). Several other advantages including no RF radiation hazard, abundant VLC spectrum at no cost, and very high data rates make VLC increasingly popular. For example, a 3 Gbps single-LED VLC link based on OFDM has been reported recently [5]. Also, multiple-input multiple-output (MIMO) techniques, which are immensely successful and popular in RF communications [6],[7], can be employed in VLC systems to achieve improved communication efficiencies [8],[9],[10]. In particular, it has been shown that MIMO techniques can provide gains in VLC systems even under line-of-sight (LOS) conditions which provide only little channel differences [9]. Our new contribution in this paper is the investigation of generalized spatial modulation (GSM), an attractive MIMO transmission scheme, in the context of VLC. Such a study, to our knowledge, has not been reported before.
In the context of VLC systems, MIMO techniques including spatial multiplexing (SMP), space shift keying (SSK), generalized space shift keying (GSSK), and spatial modulation (SM) have been investigated in the literature [9]-[16]. In SMP, there are LEDs at the transmitter and all of them are activated simultaneously in a given channel use, such that symbols from a positive real-valued -ary pulse amplitude modulation (PAM) alphabet are sent in a channel use [9]. Thus, the transmission efficiency in SMP is bits per channel use (bpcu). In SSK, there are LEDs, out of which only one will be activated in a given channel use [11]. The LED to be activated is chosen based on information bits. Only the index of this active LED will convey information bits, so that the transmission efficiency is bpcu. This means that a large number of LEDs is needed to achieve high transmission efficiencies in SSK. That is, since , the number of LEDs required in SSK is exponential in the transmission efficiency . On the other hand, SSK has the advantage of having no interference, since only one LED will be active at any given time and the remaining LEDs will be OFF. GSSK is a generalization of SSK, in which out of LEDs will be activated in a given channel use, and the indices of the active LEDs will convey information bits [12]-[14]. Since there are possibilities of choosing the active LEDs, the transmission efficiency in GSSK is given by bpcu.
SM is similar to SSK (i.e., one out of LEDs is activated and this active LED is chosen based on information bits), except that in SM a symbol from a positive real-valued -ary PAM alphabet is sent on the active LED. So, the transmission efficiency in SM is bpcu. A comparative study of SMP and SM in VLC systems has shown that, for the same transmission efficiency, SM outperforms SMP under certain geometric conditions [9].
Like the generalization of SSK to GSSK, it is possible to generalize SM. That is, activate out of LEDs in a given channel use, and, on each active LED, send a symbol from a positive real-valued -ary PAM alphabet . Such a scheme, referred to as generalized spatial modulation (GSM), then has a transmission efficiency of bpcu. Note that both SM and SMP become special cases of GSM for and , respectively. GSM in the context of RF communications has been investigated in the literature [17]-[20]. However, GSM in the context of VLC systems has not been reported so far. Our contribution in this paper attempts to fill this gap. In particular, we investigate, through analysis and simulations, the performance of GSM in comparison with other MIMO schemes including SMP, SSK, GSSK, and SM. Our performance study reveals favorable results for GSM compared to other MIMO schemes.
The rest of this paper is organized as follows. In Sec. II, we present the considered indoor VLC system model. In Sec. III, we present the GSM scheme for VLC. In Sec. IV, we derive an upper bound on the bit error probability of GSM for maximum likelihood (ML) detection in VLC. In Sec. V, we present a detailed performance comparison between GSM and other MIMO schemes in VLC. Finally, conclusions are presented in Sec. VI.
II System model
Consider an indoor VLC system with LEDs (transmitter) and photo detectors (receiver). We assume that the LEDs have a Lambertian radiation pattern [2],[21]. In a given channel use, each LED is either OFF or emits light of some positive intensity , where is the set of all possible intensity levels. An LED which is OFF is considered to send a signal of intensity zero. Let denote the transmit signal vector, where the th element of is . Let denote the optical MIMO channel matrix, given by
| (1) |
where is the channel gain between th LED and th photo detector, and . As in [9], we consider only the line-of-sight (LOS) paths between the LEDs and the photo detectors, and assume no time-dispersion (because of negligible path delay differences between LEDs and photo detectors). From [2], the LOS channel gain is calculated as (see Fig. 1 for the definition of various angles in the model)
| (2) |
where is the angle of emergence with respect to the th source (LED) and the normal at the source, is the mode number of the radiating lobe given by
is the half-power semiangle of the LED [21], is the angle of incidence at the th photo detector, is the area of the detector, is the distance between the th source and the th detector, FOV is the field of view of the detector, and
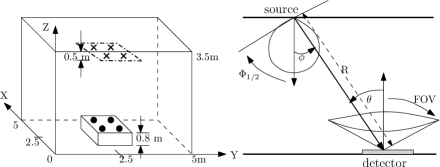
The LEDs and the photo detectors are placed in a room of size 5m5m3.5m as shown in Fig. 1. The LEDs are placed at a height of 0.5m below the ceiling and the photo detectors are placed on a table of height 0.8m. Let denote the distance between the LEDs and denote the distance between the photo detectors (see Fig. 2). We choose as 0.6m and as 0.1m. For example, when , the placement of LEDs and photo detectors is depicted in Figs. 2(a),2(b). When , the placement of LEDs is depicted in Fig. 2(c).


Assuming perfect synchronization, the received signal vector at the receiver is given by
| (3) |
where is an -dimensional vector with exactly non-zero elements such that each element in belongs to , is the responsivity of the detector [22] and is the noise vector of dimension . Each element in the noise vector is the sum of received thermal noise and ambient shot light noise, which can be modeled as i.i.d. real AWGN with zero mean and variance [1]. The average received signal-to-noise ratio (SNR) is given by
| (4) |
where , and is the th row of .
III GSM in VLC systems
In GSM, information bits are conveyed not only through modulation symbols sent on active LEDs, but also through indices of the active LEDs. In each channel use, the transmitter selects out of LEDs to activate. This selection is done based on information bits. Each active LED emits an -ary intensity modulation symbol , where is the set of intensity levels given by [9]
| (5) |
where and is the mean optical power emitted. Therefore, the total number of bits conveyed in a channel use in GSM is given by
| (6) |
Let denote the GSM signal set, which is the set of all possible GSM signal vectors that can be transmitted. Out of the possible LED activation patterns111LED activation pattern is a -tuple of the indices of the active LEDs in any given channel use., only activation patterns are needed for signaling.
Example 1: Let and . In this configuration, the number of bits that can be conveyed through the LED activation pattern is = 2 bits. Let the number of intensity levels be , where and . This means that one bit on each of the active LED is sent through intensity modulation. Therefore, the overall transmission efficiency is 4 bpcu. In each channel use, four bits from the incoming bit stream are transmitted. Of the four transmitted bits, the first two correspond to the LED activation pattern and the next two bits correspond to the intensity levels of the active LEDs. This GSM scheme is illustrated in Fig. 3, where the first two bits ‘01’ choose the active LEDs pair and the second two bits ‘10’ choose the intensity levels , where LED 1 emits intensity , LED 3 emits intensity , and the other LEDs remain inactive (OFF). In this example, we require only 4 activation patterns out of possible activation patterns. So the GSM signal set for this example can be chosen as follows:

Example 2: Let and . To achieve a transmission efficiency of 8 bpcu, we need four intensity levels , . In this case, we need only 16 activation patterns out of possible activation patterns. The choice of these activation patterns will determine the performance of the GSM system, since choosing a particular activation pattern can alter the minimum Euclidean distance between any two GSM signal vectors and for a given , which is given by
| (7) |
Similarly, the average Euclidean distance between any two vectors and for a given is given by
| (8) |
Optimum placement of LEDs in a square grid
Since in (7) and in (8) influence the link performance, we use them as the metrics based on which the optimum placement of LEDs is chosen. Specifically, we choose the placement of the LEDs at the transmitter such that the and of the placement are maximized over all possible placements, as follows. We first choose the placement(s) for which the is maximum. For placement of LEDs in a grid, we enumerate all possible LED placements in the grid and compute the in (7) for all these placements and choose the one with the maximum . If there are multiple placements for which is maximum, we then compute as per (8) for these placements and choose the one with the maximum . For example, for the system parameters specified in Table I and a required transmission efficiency of 8 bpcu (using ), the best placement of LEDs in a grid that maximizes and is shown in Fig. 4(a). Likewise, the best LED placements for systems with (, 5 bpcu), (, 8 bpcu), (, 8 bpcu), and (, 8 bpcu) in a grid are as shown in Figs. 4(b),(c),(d),(e), respectively.
| Length | 5m | |
| Room | Width () | 5m |
| Height () | 3.5m | |
| Height from the floor | 3m | |
| Elevation | ||
| Transmitter | Azimuth | |
| Mode number, | 1 | |
| 0.6m | ||
| Height from the floor | 0.8m | |
| Elevation | ||
| Receiver | Azimuth | |
| Responsivity, | 0.75 Ampere/Watt | |
| FOV | ||
| 0.1m |

IV Performance analysis of GSM in VLC
In this section, we derive an upper bound on the bit error rate (BER) of ML detection for GSM in indoor VLC systems. The ML detection rule for GSM in the VLC system model described in the previous section is given by
| (9) |
IV-A Upper bound on BER
Consider the system model in (3). Normalizing the elements of the noise vector to unit variance, the received vector in (3) becomes
| (10) |
and the ML detection rule in (9) can be rewritten as
| (11) |
Assuming that the channel matrix is known at the receiver, the pairwise error probability (PEP) – probability that the receiver decides in favor of the signal vector when was transmitted – can be written as
| (12) | |||||
Define . We can see that is a Gaussian r.v. with mean and variance . Therefore, (12) can be written as
| (13) |
Define . An upper bound on the BER for ML detection can be obtained using union bound as
| (14) | |||||
where is the Hamming distance between the bit mappings corresponding to the signal vectors and . Similar BER upper bounds for other MIMO modulation schemes like SMP and SM have been derived in [9],[10]. We will see in the numerical results section next (Sec. IV-B) that the BER upper bound for GSM in (14) is tight at moderate to high SNRs.
IV-B Numerical results
In this section, we present numerical results which illustrate the tightness of the analytical bound in comparison with the simulated BER under different system parameter settings. The VLC system parameters considered are listed in Table I. We fix the number of photo detectors at the receiver to be throughout.
IV-B1 Comparison of upper bound and simulated BER
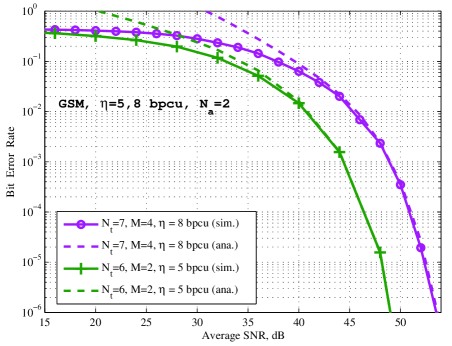
In Fig. 5, we plot the simulated BER along with the upper bound in (14) for GSM with ML detection in VLC systems with , , , bpcu, and , , , bpcu. The placement of LEDs for these two configurations is done over a grid as depicted in Figs. 4(b),(c), respectively. From the BER plots in Fig. 5, it can be seen that the derived upper bound on BER is very tight at moderate to high SNRs, thus validating the analysis.
IV-B2 Comparison of different GSM configurations for fixed
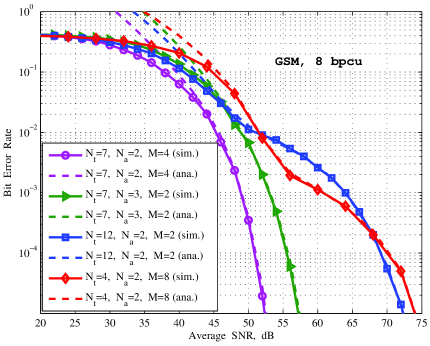
Here, we compare the BER performance of four different GSM configurations, all having the same transmission efficiency of 8 bpcu. These configurations are: System-1 with , System-2 with , System-3 with , and System-4 with . The placement of LEDs for these configurations is done over a grid as depicted in Figs. 4(a),(c),(d),(e), respectively. The simulated BER as well as the analytical upper bound on the BER for these four configurations are plotted in Fig. 6. From Fig. 6, it can be seen that System- configuration achieves the best BER performance among all the four systems considered, and System-3 achieves the next best performance. The performance of System-1 and System-4 are quite poor, particularly at high SNRs. The reason for this relative performance behavior can be attributed to the fact that System-2 has the largest and values, and that Systems-1 and System-4 have lower and values, which are illustrated in Table II. Also, note that System-2 and System-3 have equal number of LEDs. But System-3 sees more interference due to higher number of active LEDs, and this results in the poor performance of System-3 compared to that of System-2, despite System-3 having a lower-order modulation alphabet (). In System-4, the average distance between the active LEDs is smaller, and, hence, the channel correlation is higher. This results in the poor performance of System-4. System-1 has the poorest performance because of the modulation order is the highest compared to other systems, and it has the smallest and values. The plots in Fig. 6 also show that the bound is very tight at moderate to high SNRs.
| System | GSM configuration | ||
|---|---|---|---|
| 1 | |||
| 2 | |||
| 3 | |||
| 4 |
IV-B3 Performance of GSM for varying
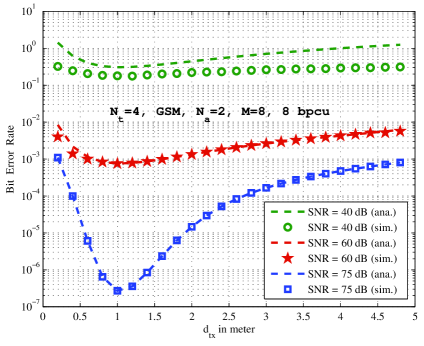
Here, we present the BER performance of GSM in VLC as a function of the spacing between the LEDs () by fixing other system parameters. Figure 7 presents the BER performance of GSM as a function of in VLC with bpcu, for different values of SNR = 75 dB, 60 dB, 40 dB. It can be observed from Fig. 7 that there is an optimum spacing which achieves the best BER performance; below and above this optimum spacing, the BER performance gets worse. The optimum is found to be 1m in Fig. 7. This optimum spacing can be explained as follows. On the one hand, the channel gains get weaker as increases. This reduces the signal level received at the receiver, which is a source of performance degradation. On the other hand, the channel correlation also gets weaker as is increased. This reduced channel correlation is a source of performance improvement. These opposing effects of weak channel gains and weak channel correlations for increasing leads to an optimum spacing.
IV-B4 Performance of GSM for varying
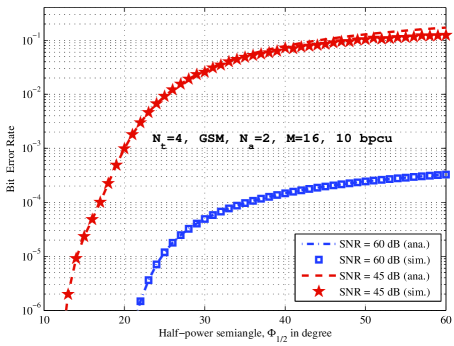
Here, we present the effect of varying the half-power semiangle () on the BER performance of GSM in VLC. In Fig. 8, we present the BER as a function of in a VLC system bpcu, and . BER versus plots for SNR = 45 dB, 60 dB are shown. It can be observed that the BER performance is good for small half-power semiangles, and it degrades as the half-power semiangle is increased. This is because, fixing all other system parameters as such and decreasing increases the mode number, and hence the channel gain. This increased channel gain for decreasing is one reason for improved BER at small . Another reason is that the channel correlation decreases as decreases. This decreased channel correlation also leads to improved performance at small .
V Performance comparison of GSM with other MIMO schemes in VLC
In this section, we compare the performance of GSM with those of other MIMO schemes including SMP, SSK, GSSK, and SM, for the same transmission efficiency. In all cases, optimum placement of LEDs in a grid is done based on maximizing and , as described in Sec. III.
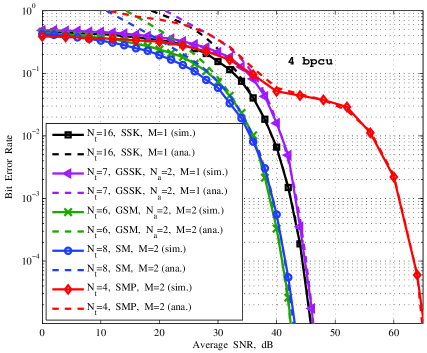
In Fig. 10, we present the BER performance of SMP, SSK, GSSK, SM, and GSM, all having a transmission efficiency of bpcu. A GSM system with which uses only 4 activation patterns chosen out of activation patterns and gives 4 bpcu is considered. The optimum placement of LEDs for this GSM system is as shown in Fig. 9(a). The other MIMO schemes with 4 bpcu transmission efficiency considered for comparison are: SMP: , LEDs placement as in Fig. 4(a), SSK: , LEDs placement as in Fig. 2(c), i.e., one LED on each of the grid point, GSSK: , LEDs placement as in Fig. 9(b), and SM: , LEDs placement as in 4(a). From Fig. 10, it can be seen that SM outperforms SMP, which is due to spatial interference in SMP. It is also observed that SM performs better than SSK and GSSK. This is because SSK has more LEDs and hence the and in SSK are smaller than those in SM. Also, in GSSK, 2 LEDs are activated simultaneously leading to spatial interference, and this makes GSSK to perform poorer than SM. Both SSK and GSSK perform better than SMP, due to the dominance of spatial interference in SMP. It is further observed that GSM performs almost the same as SM, with marginally inferior performance at low SNRs (because of the effect of spatial interference in GSM) and marginally better performance at high SNRs (because of better and in GSM).
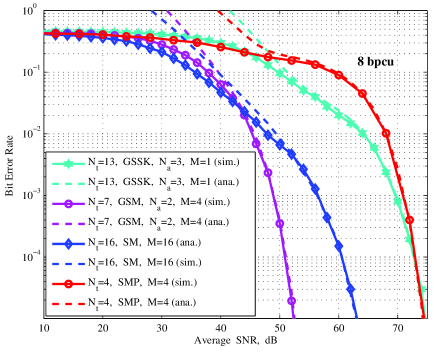
The performance advantage of GSM over SM at high SNRs is substantial at 8 bpcu transmission efficiency (about 10 dB advantage at BER), which is illustrated in Fig. 11. Figure 11 compares the performance of the following systems, all having 8 bpcu efficiency: SMP: , LEDs placement as in 4(a), GSSK: , LEDs placement as in 9(c), SM: , LEDs placement as in 2(c), and GSM: , LEDs placement as in 4(c). From Fig. 11, it is observed that GSM achieves the best performance among the considered schemes at moderate to high SNRs (better by about 10 dB compared to SM, and by about 25 dB compared to GSSK and SMP at BER). The reason for this is as explained in the performance comparison in Fig. 10.

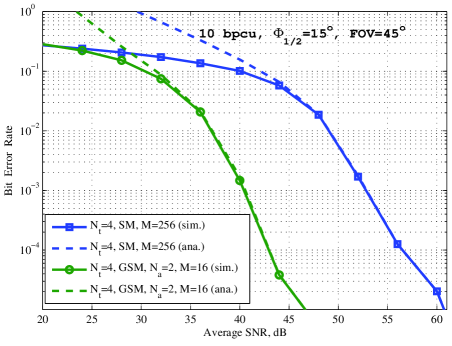
In Fig. 12, we compare the BER performance of SM and GSM in VLC, both having the same bpcu, , and . The SM and GSM system parameters are: SM: , and GSM: . The placement of LEDs in both cases is as in Fig. 4(a). It is observed that GSM significantly outperforms SM (by about 25 dB at BER). This performance advantage of GSM over SM can be attributed to the following reasons. The channel matrix becomes less correlated for , which results in less spatial interference in GSM. Despite the presence of multiple active LEDs () and hence spatial interference in GSM, to achieve 10 bpcu transmission efficiency, GSM requires a much smaller-sized modulation alphabet compared to that required in SM . The better power efficiency in a smaller-sized modulation alphabet compared to a larger-sized alphabet dominates compared to the degrading effect of spatial interference due to , making GSM to outperform SM.
VI Conclusions
We investigated the performance of GSM, an attractive MIMO transmission scheme, in the context of indoor wireless VLC. More than one among the available LEDs are activated simultaneously in a channel use, and the indices of the active LEDs also conveyed information bits in addition to the information bits conveyed by the intensity modulation alphabet. To our knowledge, such a study of GSM in VLC has not been reported before. We derived an analytical upper bound on the BER of GSM with ML detection in VLC. The derived bound was shown to be very tight at moderate to high SNRs. The channel gains and channel correlations influenced the GSM performance such that the best BER is achieved at an optimum LED spacing. Also, the GSM performance in VLC improved as the half-power semi-angle of the LEDs is decreased. We compared the BER performance of GSM with those of other MIMO schemes including SMP, SSK, GSSK and SM. Analysis and simulation results revealed favorable performance for GSM compared to other MIMO schemes.
References
- [1] J. M. Kahn and J. R. Barry, “Wireless infrared communications,” Proceedings of the IEEE, vol. 85, no. 2, pp. 265-298, Feb. 1997.
- [2] J. Barry, J. Kahn, W. Krause, E. Lee, and D. Messerschmitt, “Simulation of multipath impulse response for indoor wireless optical channels,” IEEE J. Sel. Areas in Commun., vol. 11, no. 3, pp. 367-379, Apr. 1993.
- [3] H. Elgala, R. Mesleh, and H. Haas, “Indoor optical wireless communication: potential and state-of-the-art,” IEEE Commun. Mag., vol. 49, no. 9, pp. 56-62, Sep. 2011.
- [4] D. O’Brien, “Visible light communications: challenges and potential,” Proc. IEEE Photon. Conf., pp. 365-366, Oct. 2011.
- [5] D. Tsonev, H. Chun, S. Rajbhandari, J. J. D. McKendry, D. Videv, E. Gu, M. Haji, S. Watson, A. E. Kelly, G. Faulkner, M. D. Dawson, H. Haas, and D. O’Brien, “A 3-Gb/s single-LED OFDM-based wireless VLC link using a gallium nitride LED,” IEEE Photonics Tech. Lett., vol. 26, no. 7, pp. 637-640, Jan. 2014.
- [6] D. Tse and P. Viswanath, Fundamentals of Wireless Communication, Cambridge Univ. Press, 2005.
- [7] A. Chockalingam and B. S. Rajan, Large MIMO Systems, Cambridge Univ. Press, Feb. 2014.
- [8] T. Q. Wang, Y. A. Sekercioglu, and J. Armstrong, “Analysis of an optical wireless receiver using a hemispherical lens with application in MIMO visible light communications,” J. Lightwave Tech., vol. 31, no. 11, pp. 1744-1754, Jun. 2013.
- [9] T. Fath and H. Haas, “Performance comparison of MIMO techniques for optical wireless communications in indoor environments,” IEEE Trans. Commun., vol. 61, no. 2, pp. 733-742, Feb. 2013.
- [10] N. A. Tran, D. A. Luong, T. C. Thang, and A. T. Pham, “Performance analysis of indoor MIMO visible light communication systems,” Proc. IEEE ICCE 2014, pp. 60-64, Jul. 2014.
- [11] Y. Gong, L. Ding, Y. He, H. Zhu, and Y. Wang, “Analysis of space shift keying modulation applied to visible light communications,” Proc. IETICT 2013, pp. 503-507, Apr. 2013.
- [12] W. Popoola, E. Poves, and H. Haas, “Generalised space shift keying for visible light communication,” Proc. Intl. Symp. on Commun. Systems, Networks and Digital Signal Processing (CSNDP 2012), pp. 1-4, Jul. 2012.
- [13] W. O. Popoola, E. Poves, and H. Haas, “Error performance of generalised space shift keying for indoor visible light communications,” IEEE Trans. Commun., vol. 61, no. 5, pp. 1968-1976, May 2013.
- [14] W. O. Popoola and H. Haas, “Demonstration of the merit and limitation of generalised space shift keying for indoor visible light communications,” J. Lightwave Tech., vol. 32, no. 10, pp. 1960-1965, May 2014.
- [15] R. Mesleh, R. Mehmood, H. Elgala, and H. Haas, “Indoor MIMO optical wireless communication using spatial modulation,” Proc. IEEE ICC 2010, pp. 1-5, May 2010.
- [16] R. Mesleh, H. Elgala, and H. Haas, “Optical spatial modulation,” IEEE/OSA J. Optical Commun. and Networking, vol. 3, no. 3, pp. 234-244, Mar. 2011.
- [17] A. Younis, N. Serafimovski, R. Mesleh, and H. Haas, “Generalized spatial modulation,” Proc. Asilomar Conf. on Signals, Systems and Computers, pp. 1498-1502, Nov. 2010.
- [18] J. Fu, C. Hou, W. Xiang, L. Yan, and Y. Hou, “Generalised spatial modulation with multiple active transmit antennas,” Proc. IEEE GLOBECOM 2010 Workshops, pp. 839-844, Dec. 2010.
- [19] J. Wang, S. Jia, and J. Song, “Generalised spatial modulation system with multiple active transmit antennas and low complexity detection scheme,” IEEE Trans. Wireless Commun., vol. 11, no. 4, pp. 1605-1615, Apr. 2012.
- [20] T. Datta and A. Chockalingam, “On generalized spatial modulation,” Proc. IEEE WCNC 2013, pp. 2716-2721, Apr. 2013.
- [21] F. R. Gfeller and U. Bapst, “Wireless in-house data communication via diffuse infrared radiation,” Proceedings of the IEEE, vol. 67, no. 11, pp. 1474-1486, Nov. 1979.
- [22] L. Zeng, D. O’Brien, H. Le Minh, K. Lee, D. Jung, and Y. Oh, “Improvement of date rate by using equalization in an indoor visible light communication system,” Proc. IEEE ICCSC 2008, pp. 678-682, May 2008.