kxl014 \gridframeN\cropmarkN
Fundamental constraints on the abundances of chemotaxis proteins
Abstract
Flagellated bacteria, such as Escherichia coli, perform directed motion in gradients of concentration of attractants and repellents in a process called chemotaxis. The E. coli chemotaxis signaling pathway is a model for signal transduction, but it has unique features. We demonstrate that the need for fast signaling necessitates high abundances of the proteins involved in this pathway. We show that further constraints on the abundances of chemotaxis proteins arise from the requirements of self-assembly, both of flagellar motors and of chemoreceptor arrays. All these constraints are specific to chemotaxis, and published data confirm that chemotaxis proteins tend to be more highly expressed than their homologs in other pathways. Employing a chemotaxis pathway model, we show that the gain of the pathway at the level of the response regulator CheY increases with overall chemotaxis protein abundances. This may explain why, at least in one E. coli strain, the abundance of all chemotaxis proteins is higher in media with lower nutrient content. We also demonstrate that the E. coli chemotaxis pathway is particularly robust to abundance variations of the motor protein FliM.Correspondence: afbitbol@princeton.edu, wingreen@princeton.edu
Introduction
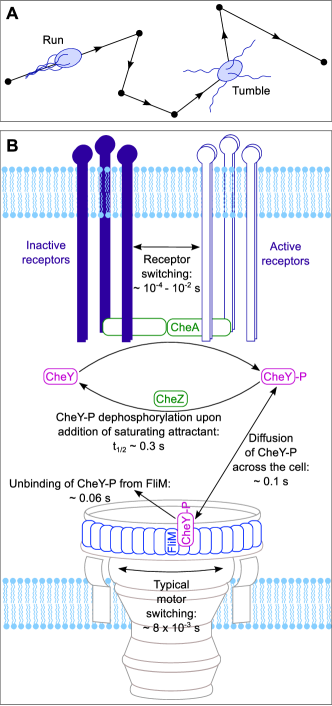
Flagellated bacteria such as Escherichia coli are able to move up concentration gradients of chemical attractants, and down gradients of repellents, in a process called chemotaxis (1). The motion of these bacteria comprises periods of straight swimming called “runs”, and random changes of direction called “tumbles”. Run lengths are modulated to yield a three-dimensional random walk biased toward the preferred direction (2). Runs occur when flagella rotate counterclockwise and bundle together, while tumbles occur when one or more rotate clockwise and disrupt the bundle (3).
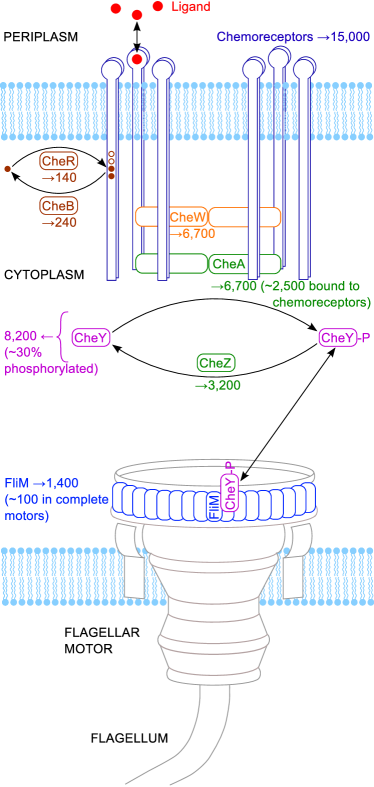
In E. coli, transmembrane chemoreceptors form large and highly ordered arrays at the cell poles. Chemoreceptors are organized into trimers of dimers, and linked by CheW and CheA into a honeycomb lattice (4, 5, 6, 7), with a 6:1:1 receptor:CheA:CheW stoichiometry in terms of monomers (7). Receptors control the activity of the histidine kinase CheA, which phosphorylates the cytoplasmic response-regulator protein CheY. Phosphorylated CheY (CheY-P) binds to FliM in the flagellar motor to induce clockwise rotation and tumbles. CheA also phosphorylates and activates CheB, a deaminase/methylesterase, that together with the methyltransferase CheR, reversibly modifies specific residues on the receptors to produce adaptation, i.e., to return to a baseline activity level when chemoeffector concentrations stay constant (8, 9, 10). Upon an increase in the concentration of chemoattractant, the activity of CheA decreases, which leads to fewer tumbles. Conversely, upon a decrease in the concentration of chemoattractant, the activity of CheA increases, yielding more tumbles. This biases the cell’s motion toward climbing the gradient of chemoattractant.
E. coli chemotaxis is a model for signal transduction, and is a member of the family of two-component signaling systems that enable bacteria to sense and respond to various features of their environment (11, 12, 9). However, the chemotaxis pathway has unique features. First, chemotaxis calls for very fast response times. We demonstrate that this requirement necessitates high abundances of chemotaxis proteins. Second, chemotaxis involves large-scale multi-protein complexes, namely flagellar motors (13, 14) and chemoreceptor arrays (4, 5, 6, 7). We show that the consequent self-assembly requirements impose additional constraints on the abundances of chemotaxis proteins. Because of these specific constraints, we hypothesize that chemotaxis proteins will be more highly expressed than their homologs in other pathways. Published data are consistent with this prediction, but more data would be required to definitively confirm it. In addition, using a model of the chemotaxis pathway, we show that the gain of the chemotaxis pathway at the level of CheY-P increases with overall chemotaxis protein abundances. This is consistent with the fact that artificially overexpressing chemotaxis proteins in a concerted manner increases chemotactic efficiency, measured by a swarm assay (15). Moreover, it may help explain why the abundance of all the chemotaxis proteins can be up to nine-fold higher in nutrient-poor versus rich medium (16). We also demonstrate that the pathway is particularly robust to abundance variations of the motor protein FliM, in line with other robustness features of the chemotaxis pathway (17, 18, 19, 15).
Models and methods
Chemotaxis pathway model
We model the E. coli chemotaxis signaling pathway by the following system of ordinary differential equations for the average cellular concentrations of each protein in the pathway:
| (1) | ||||
| (2) | ||||
| (3) | ||||
| (4) | ||||
| (5) | ||||
| (6) | ||||
| (7) | ||||
| (8) | ||||
| (9) | ||||
| (10) |
Here, concentrations are denoted by square brackets, and total concentrations by “tot”. Phosphorylated species are denoted by “-P”, and complexes by a dot between the two species names (e.g., ). The first five equations express conservation of matter for each protein, while the other ones convey the kinetics of the chemical reactions in the pathway. These reactions are depicted in Eqs. S1-S8 of the Supporting Material.
We focus on the adapted state of the pathway and on its initial response to attractant or repellent, without explicitly modeling the slower dynamics of adaptation. In the adapted state, the active fraction of CheA is modeled as (20):
| (11) |
which follows if CheR methylates inactive receptors and CheB-P demethylates active receptors. This active fraction is taken into account in the system of differential equations in Eqs. 1-10 through the reduction of the time-averaged autocatalytic rate of CheA from to (see Eq. 6), as in Ref. (21).
Parameter values.
We use experimentally-determined values for the reaction rates in Eqs. 1-11, except for and (Table S1). Indeed, while the reaction rates for CheY-P dephosphorylation by CheZ have been measured in vitro in the absence of CheA (22), it is known that CheZ binds to CheA-short, a translational variant of CheA that cannot autophosphorylate, and that this binding significantly activates CheZ (23, 24, 25). We thus adjusted and in order to obtain a fraction of CheZ bound to CheY-P of , consistent with in vivo FRET measurements in the adapted steady state (21, 26).
We use the average copy numbers of each chemotaxis protein per cell measured in Ref. (16) for strain RP437 in rich medium for all proteins but FliM, and those in Refs. (27, 28) for FliM, also in rich medium (Fig. 1). Importantly, the autocatalytic rate of the histidine kinase CheA is increased about 100-fold when CheA is in complex with chemoreceptors and CheW (29), so only CheA in signaling complexes has significant kinase activity. Receptors are limiting (16, 30) for signaling complexes with a 6:1:1 receptor:CheA:CheW stoichiometry (7). Hence, we consider that the total number of CheA proteins per cell that can be active (setting ) is one-sixth the total number of receptor monomers. It is also observed that less than 30% of FliM is found in complete flagellar motors (27, 31, 28), and that only 16% is in the soluble fraction (31), while more than 25% of FliM (31, 28), probably all the rest, is found in partially assembled structures (see Supporting Material). Isolated FliM molecules have a much lower affinity for CheY-P than FliM in motors, with a dissociation constant of 27 (32) versus 3.5 (33, 21, 34, 35), which leads us to disregard isolated FliM. In the absence of any data to the contrary, we assume that CheY-P binds FliM in partly and fully-assembled motors with the same affinity. For each chemotaxis pathway protein, we derive the corresponding effective total cellular concentration using the standard E. coli cell volume of 1.4 fL (21, 15) (Table S2).
Numerical solution.
We solve Eqs. 1-11 at steady state numerically using ‘NSolve’ (Wolfram Mathematica). The initial response to saturating attractant (or repellent) is obtained by abruptly decreasing the CheA active fraction to 0 (or increasing it to 1) from its adapted value. Hence, we solve Eqs. 1-10 numerically with (or 1), with the adapted concentrations as initial conditions, using ‘NDSolve’ (Wolfram Mathematica).
Pathway gain.
We are interested in the gain of the chemotaxis pathway. The input is the active fraction of CheA, which directly depends on receptor states and hence on chemoeffector concentrations. We consider two different outputs: the concentration of phosphorylated CheY, and the fraction of FliM molecules bound to CheY-P, with corresponding gains defined by
| (12) |
and
| (13) |
In practice, gains in the linear-response regime are computed for the pre-adaptation response to a 1% increase of the CheA active fraction from its adapted value determined by Eq. 11.
Results
Fast response imposes constraints on the abundances of chemotaxis proteins
Chemotactic trajectories are composed of straight “runs” and random changes of directions or “tumbles” (Fig. 2A). The mean run time of E. coli cells under adapted conditions is about one second (36). Hence, in practice, cells must make a decision whether to change direction in less than a second. The observed timescale of response to a saturating attractant is seconds (21). Fig. 2B shows the timescales of the different molecular events involved in this response. The longest one is the dephosphorylation time of the cellular pool of CheY-P by the phosphatase CheZ (21). Here, we show that this timescale implies lower bounds on the dissociation constant of FliM and CheY-P and on the abundances of several proteins in the chemotaxis pathway.
The CheY-P molecules bound to FliM proteins need to unbind and to be dephosphorylated within this 0.3 s for the pool of CheY-P to reflect the current chemoeffector concentration, thus ensuring an appropriate response. The unbinding timescale is , where is the dissociation rate of FliM and CheY-P (see Eq. 8), so implies . Since the binding of FliM and CheY-P is diffusion-limited, i.e. as fast as it can be, with a rate constant (21, 42), the dissociation constant of FliM and CheY-P must satisfy . In reality, (33, 21, 34, 35), and the associated unbinding timescale is 0.06 s. Hence, our lower bound on is satisfied.
In the adapted state, the fraction of FliM molecules that are bound to CheY-P should be in the intermediate range, in order to respond readily to both increases and decreases of the free CheY-P concentration . Assuming an adapted , which is in the lower range of the region where the motor can switch rotation direction (21), we obtain , and , where we used the total FliM concentration in Table S2 (see Methods and Models). Hence, the total cellular concentration of CheY-P is . Note that here we do not take into account the CheY-P that are bound to CheZ and thus essentially sure to be dephosphorylated (since , see Table S1). In practice, about 30% of CheY is phosphorylated (36), yielding (using the total CheY concentration in Table S2). Hence, our lower bound on is satisfied, with the actual value being only twice as large.
We now focus on the dephosphorylation of CheY-P, whose steady-state rate is (Eq. 9)
| (14) |
The whole cellular pool of non-CheZ-bound CheY-P, with concentration , needs to be dephosphorylated within 0.3 s. Using the minimal values of and calculated above and rate constants in Table S1, this requirement yields . Note that using the experimental values for and from Ref. (22), which disregard CheZ activation by CheA-short, gives a similar result: . Experiments yield (Table S2), so here too, our lower bound is satisfied, with the actual value being less than twice as large.
For turnover to occur within 0.3 s, ensuring that reflects the current chemoeffector concentration, the whole cellular pool of non-CheZ-bound CheY-P also needs to be (re)phosphorylated within this time. Phosphotransfer from CheA-P to CheY being very fast, the limiting step is CheA autophosphorylation (43). Hence, the steady-state CheY phosphorylation rate is simply (Eq. 6). Using the minimal values of and of calculated above, and (Table S1), we obtain . The total concentration of CheA in arrays (determined from the receptor concentration and the stoichiometry, see Models and methods and Table S2), , is substantially larger than this lower bound. This hints at a low active fraction , consistent with previous estimates, which range from a few percent (21, 44) to about 30% (45, 26).
Hence, the requirements of fast signaling impose lower bounds on the cellular concentrations of CheY-P, CheZ, and active CheA, as well as on the dissociation constant of CheY-P and FliM. These lower bounds are satisfied by experimental values, and are consistent with a low adapted CheA active fraction.
Pathway model accounts for observed concentrations and response times
While the above simple arguments enabled us to derive constraints on the abundances of chemotaxis proteins, a more detailed comparison to observed concentrations and response times requires a mathematical model. Here we present results from the pathway model given by Eqs. 1-11. Similar models have been productively employed previously to investigate various aspects of the chemotaxis network (18, 21, 15, 46). Our focus is on the impact of protein abundances on gain.
The adapted steady-state of the chemotaxis pathway is obtained by solving Eqs. 1-11 at steady-state with the parameter values in Tables S1 and S2 (see Models and methods). It yields , in agreement with Ref. (33), and a proportion of phosphorylated CheY-P of 31%, in agreement with Ref. (36). Besides, we obtain a fraction of FliM molecules that are bound to CheY-P of 41% in the adapted state, which is in the functional range where the flagellar motor is able to switch (21). We also obtain a fraction of active CheA of 25% in the adapted state, within the range of previous estimates (21, 44, 45, 26).
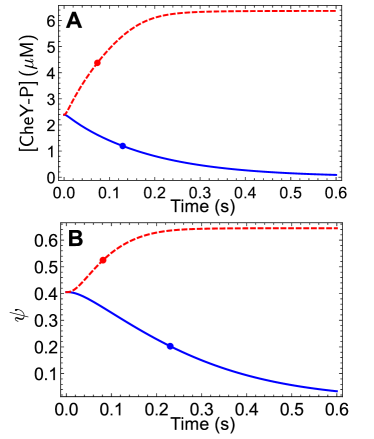
The initial (pre-adaptation) response of the pathway to instantaneous addition of saturating attractant (or repellent) is obtained by solving Eqs. 1-10 with the adapted steady-state concentrations as initial conditions, setting the CheA active fraction to 0 (or 1) (see Models and methods). Upon addition of attractant, is found to decrease to 0 with a half-time of 0.13 s, and the fraction of FliM proteins bound to CheY-P decreases with a half-time of 0.23 s (Fig. 3). This is in reasonable agreement with Ref. (21), where the half-time for the decay of CheY-P bound to FliM, observed experimentally by FRET, is 0.32 s. Note that the difference between the timescales obtained for and for from our pathway model indicates that the unbinding time of CheY-P from FliM is not negligible, contrary to the usual assumption (21). Addition of repellent yields a faster response, with half-times of 0.07 s and 0.08 s for the respective increases of and of (Fig. 3). This is in reasonable agreement with the experimental value of 0.03 s for the half-time of the increase of (21). Response to saturating repellent is faster because it relies on CheY phosphorylation by CheA, which is very fast when , while CheY-P dephosphorylation is limiting in response to attractant (Fig. 2).
The good agreement of the model with observations, obtained by adjusting only and to match the fraction of CheZ bound to CheY-P (see Models and methods), encourages us to further study the model’s implications.
Effect of a concerted increase of protein abundances
The overall abundances of chemotaxis signaling proteins (Che proteins and chemoreceptors) are variable across E. coli strains and growth conditions, but relative proportions are well-conserved (16). Strikingly, these proteins are more highly expressed in minimal medium than in rich medium (16). When the abundances of chemotaxis signaling proteins were varied in a concerted fashion (15), the chemotactic efficiency of cells (measured by a swarm assay) was found to increase sharply up to wild-type abundance, and then to continue increasing much more gradually while progressively leveling off. Here, to mimic the experiment of Ref. (15), we vary the abundances of CheA, CheY, CheZ, CheB and CheR, while keeping their proportions and the FliM abundance fixed, as in Table S2. (We checked that varying the abundance of FliM in a concerted fashion with the rest does not affect our conclusions.) Solving our pathway model Eqs. 1-11 in the adapted steady state, we find that when protein abundances are increased, and both increase sharply up to about reference abundances, and the increase then progressively levels off (Fig. 4A). Our reference abundances (one-fold in Fig. 4) correspond to those measured in Ref. (16) for strain RP437 in rich medium (see Models and methods and Table S2).
The effect of a concerted variation of protein abundances on was previously modeled in Ref. (18). Our results (Fig. 4A) are mostly consistent with Ref. (18), but using one adaptation model Ref. (18) obtained a maximum in versus fold abundance. In our framework too, modifying details of the adaptation model (Eq. 11) can result in such a maximum, but above one-fold expression (for realistic parameter values), so our main conclusions are not affected. In Ref. (15), clockwise bias was found to be monotonic versus concerted fold expression, which is consistent with our results (Fig. 4A). Building on a similar framework to Ref. (18), we include CheZ saturation by CheY-P, which has now been measured (21, 26), and we discuss FliM occupancy and gain, and provide analytical insight for simple regimes.
For reference abundances and higher, the steady-state phosphorylated fraction of CheA is very small, because of the rapidity of phosphotransfer from CheA-P to CheY (43). In this “fast phosphotransfer regime”, it is possible to solve analytically a simplified version of the pathway (see Supporting Material): if the auto-phosphorylation rate of CheA is less than the maximal dephosphorylation rate of CheY-P by CheZ, i.e. if
| (15) |
then
| (16) |
and is given by Eq. S20. These expressions only depend on abundance ratios, on kinetic rate constants, and on , which converges to a constant value at high abundances (see Supporting Material). Hence, in the high-abundance limit, these steady-state values of and , which arise from the equilibration of phosphorylation and dephosphorylation of CheY, converge to plateaus invariant to concerted variations of the overall abundances. Conversely, if the condition in Eq. 15 is violated, CheZ is saturated, and increases with overall abundances. The conditions for the fast phosphotransfer regime are satisfied with the standard abundances used here and with higher overall abundances (see Supporting Material). The plateaus of (Eq. 16) and (Eq. S20) are indicated by thin lines in Fig. 4A.
In the opposite limit of low abundances, two-molecule encounters become unlikely, including the binding of CheY to CheA-P, so the phosphorylated fraction of CheA becomes high, and only a small fraction of CheZ and of FliM are bound to CheY-P. Using the simplified pathway model presented in the Supporting Material, we show that if and , then
| (17) |
Hence, in the low-abundance limit, grows in proportion with the overall abundances of the Che proteins. The same is true for (Eq. S29). The low-abundance asymptotes Eqs. 17 and S29 are plotted as thin dotted lines in Fig. 4A.
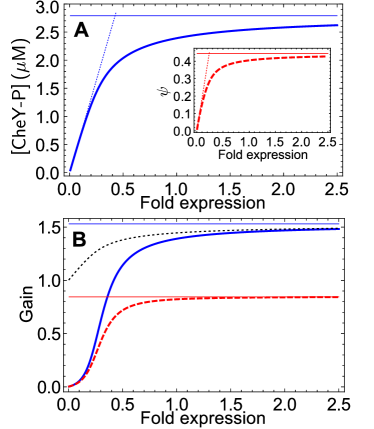
Our pathway model also yields the gain of the pathway at the level of the response regulator. This gain grows with overall abundance of chemotaxis proteins, and plateaus in the high-abundance limit (Fig. 4B). The corresponding asymptotic value can be determined analytically within the simplified pathway model in the fast-phosphotransfer regime: (Eq. 12) can be obtained from Eq. 16. It yields
| (18) |
which becomes independent of overall abundances as converges to its high-abundance limit. Besides, in this regime, it can be shown that (see Supporting Material). Thus, the gain in arises from the saturation of the phosphatase CheZ by CheY-P: increasing the active fraction of CheA increases phosphotransfer to CheY, and hence , but this increase is larger than that of because, at the same time, CheZ becomes more saturated, reducing the rate of dephosphorylation of CheY-P (see also Ref. (47)). In Fig. 4B, the thin horizontal blue line represents the plateau for (Eq. 18), and the dotted curve shows : at sufficiently high abundances, it closely approximates the gain derived from numerical solution of the full pathway. Similarly, (Eq. 13) can be determined analytically within the simplified pathway model in the fast-phosphotransfer regime (Eq. S24, thin horizontal red line in Fig. 4B).
We conclude that the gain in CheY-P increases with overall abundances, up to about reference levels. Moreover, chemotactic signaling is robust with respect to concerted overexpression of the chemotaxis proteins (see also Ref. (15)), as remains lower than , so that remains in the functional range, below the threshold value (about 0.57) above which the motor only rotates clockwise (21).
Effect of separately varying the concentration of each protein in the pathway
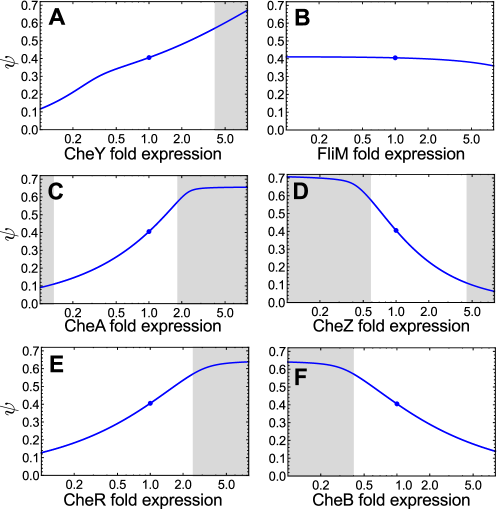
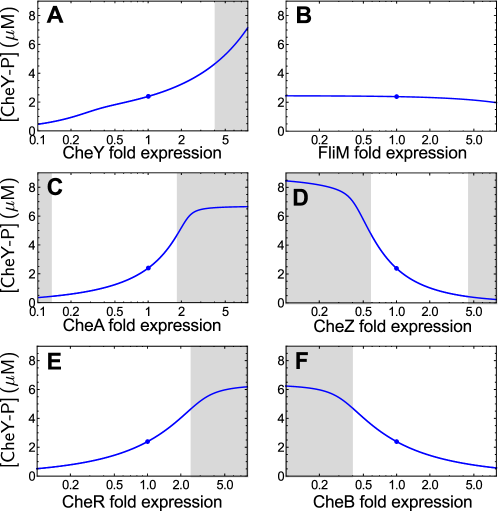
To study the effect of varying the abundance of each protein separately on the adapted steady state of the pathway, we separately varied CheY, FliM, CheA, CheZ, CheR, or CheB abundances, while keeping the abundances of all others fixed (values in Table S2). Specifically, we calculated the gains and (Fig. 5), as well as the fraction of FliM molecules bound to CheY-P (Fig. S2) and the concentration of free CheY-P (Fig. S3).
The effect on of protein abundance variations was investigated in Ref. (18). In addition to the differences mentioned above, this previous study did not include FliM, but included CheW and receptors. Our results (Fig. S3) are consistent with those of Ref. (18) for abundance variations of CheY, CheZ, CheR, and CheB. However, Ref. (18) obtained a weak maximum of upon CheA abundance variation, arising from their model of CheA interactions with CheW and receptors. We focus on gain, and on the stability of the pathway to FliM abundance variation, which were not included in Ref. (18).
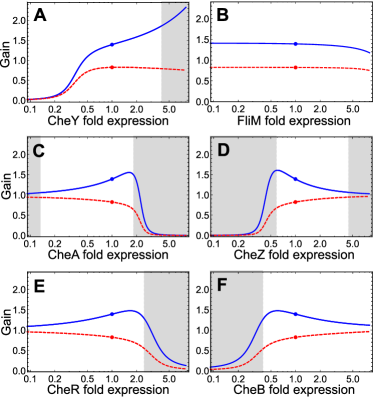
Fig. 5 shows that the gain of the chemotaxis pathway is robust to moderate individual variations of the abundances of each protein. Variations of are even weaker than those of , due to the mitigating effect of FliM saturation by CheY-P.
Fig. 5A shows that increases with CheY abundance. Indeed, increased CheY abundance (at constant total CheB and CheA levels) results in less CheB phosphorylation, due to competition for CheA-P. Reduced in turn results in an increase of the adapted (Eq. 11), and hence of and (Fig. S2A). Higher (at constant total CheZ level) means that CheZ becomes more saturated, increasing (see above). Consistently, in the fast phosphotransfer regime, Eq. 18 shows that is an increasing function of , which itself increases with CheY abundance, for the above-mentioned reasons.
Fig. 5B shows that the gains are almost independent of the abundance of FliM, and Fig. S2B shows that the same is true for . In addition, solving our simplified pathway model in the fast phosphotransfer regime gives expressions for , for , and for the gains that are entirely independent of FliM abundances (Eqs. 16 and S20, 18 and S24). This robustness of the pathway to FliM abundance variation arises from the fact that, in contrast to the free CheY-P molecules, the ones that are bound to FliM cannot be dephosphorylated by CheZ (they can auto-dephosphorylate, but this process is much slower than dephosphorylation by CheZ). This is analogous to the case of transcription factors studied in Ref. (48): if transcription factors (or in our case CheY-P) can be degraded (or in our case dephosphorylated) only when they are not bound to their DNA targets (bound to FliM), then the concentration of non-bound transcription factors is independent of the number of DNA targets (FliM molecules).
In Fig. 5C, features a weak maximum at about two-fold abundance of CheA. Increasing CheA abundance raises the level of phosphorylation of CheY, which yields an increase of (Fig. S2C), and moreover increases saturation of CheZ, which increases . However, once the CheA abundance is so high that almost all CheY is phosphorylated and almost all CheZ is saturated, increasing primarily increases and not : hence, in this regime, the gain decreases with CheA abundance. The maximum in is smoothed out in due to FliM saturation (Fig. 5C).
Increasing CheZ abundance has the opposite effect of increasing CheA abundance, since these two enzymes have an antagonistic role in the pathway. Accordingly, features a weak maximum at about 0.5-fold abundance of CheZ (Fig. 5D), with decreasing when CheZ abundance increases (Fig. S2D). Increasing CheR abundance yields an increase of the active fraction of CheA (Eq. 11). Hence, it is effectively similar to increasing CheA abundance (Figs. 5E and S2E). Finally, increasing CheB abundance has the opposite effect, i.e. a similar effect to increasing CheZ abundance (Figs. 5F and S2F).
Discussion
Fast signaling requirements impose strong constraints on the chemotaxis pathway
The chemotaxis pathway is a member of the family of two-component signaling systems that enable bacteria to sense and respond to various features of their environment. This pathway is widely studied as a model signaling system. However, it faces specific constraints. Chemotaxis regulates cell swimming with response times of a fraction of a second. Longer response timescales would directly increase the lag between detection of a chemoeffector concentration and change in motion, with potentially deleterious consequences in extreme environments (e.g. in steep repellent gradients), but also in fast-changing ones. The latter case could be particularly important evolutionarily as motility peaks at the entry into stationary phase, when bacteria are competing for scarce resources (49). In contrast, the output of most other two-component systems lies in transcriptional regulation (11, 12, 9). These systems feature overall in vivo response times of minutes to hours (50), and their signaling involves phosphorylation reactions with in vitro timescales of minutes (51).
We have shown that the requirements of fast signaling impose lower bounds on the dissociation constant between CheY-P and FliM, and hence on CheY-P abundance, as well as on CheZ, and CheA abundances. These lower bounds are satisfied by experimental values, giving the right order of magnitude for , CheY-P, and CheZ, and indicating a low active fraction of CheA in the adapted state. In practice, our pathway model gives in the adapted state, within the range of previous estimates, which vary from a few percent (21, 44) to about 30% (45, 26). Note that similar constraints might exist on the abundance of CheR and CheB, since they control the dynamics of adaptation (19). However, rapidity constraints are less obvious on the adaptation timescales than on the fast response timescales studied here.
Several other features of the chemotaxis pathway reflect a pressure towards rapidity. First, the existence of a dedicated phosphatase for the response regulator CheY, which is uncommon for two-component systems, suggests the importance of fast turnover of the CheY-P pool. Second, CheA is an extremely fast histidine kinase: when incorporated in signaling complexes containing chemoreceptors and CheW, the autocatalytic rate of CheA is for E. coli (52, 53, 54) and Salmonella typhimurium (29), which makes it four to five orders of magnitude faster than other kinases in two-component systems (Table S3). Another possible signature of the pressure towards rapidity is that the response timescale of the chemotaxis pathway is only slightly larger than the diffusion time of CheY-P across the cytoplasm (Fig. 2B), estimated using measured diffusion coefficients (40, 41) and a characteristic cell size of . Hence, the response of the chemotaxis pathway is almost as fast as it can be. Note that our model, which focuses on average concentrations, should slightly underestimate response timescales due to the neglect of diffusion. Thus, a full spatial model (55) should yield slightly more stringent lower bounds on protein abundances.
One can wonder why the adapted CheA active fraction is low () while CheA is pushed towards extremely high rapidity of autophosphorylation. Ref. (44) shows that a low makes the dynamics of the pathway response robust to slowly varying multiplicative noise. The pathway output is assumed to be proportional to , with the proportionality factor fluctuating, but more slowly than the response timescales of the pathway. In Ref. (44), the output is chosen to be the fraction of CheZ bound to CheY-P, which is measurable by FRET. The noisy proportionality factor then involves the ratio of total CheA abundance to total CheZ abundance (see Eq. S18). The robustness of the dynamics to such multiplicative noise arises from the fact that at low , the signal amplification at the receptor level is exponential, via the Boltzmann factor for CheA to be in its active state (44). Since rapidity constraints imply , requiring in addition an adapted implies , which is only times lower than the experimental value. Note that this would also entail a lower bound on receptor concentration of , given the stoichiometry of the array.
Since the requirement of fast signaling calls for high abundances of chemotaxis proteins, it follows that these protein levels should be higher than in homologous systems with different outputs. Many bacteria with chemotaxis pathways similar to that of E. coli (56), and for which similar timescales are expected (57), possess multiple gene clusters encoding Che proteins. Some of these paralogs regulate twitching motility based on type IV pili, while others are involved in very different cellular functions, such as development, biofilm formation, cell morphology, cell-cell interactions, and flagellar biosynthesis (56, 58). In the Supporting Material, we compare expression of the Che proteins involved in chemotaxis to the expression of those from paralog clusters, in five different bacteria (Pseudomonas aeruginosa, Vibrio cholerae, Caulobacter crescentus, Sinorhizobium meliloti, Rhodobacter sphaeroides), using data from published microarray studies. We find that homologous non-chemotactic genes are significantly less expressed (at the mRNA level) than the ones actually involved in chemotaxis (Tables S4-S8), with the exception of the CheY involved in twitching motility in P. aeruginosa, which might also be subject to rapidity constraints (see Supporting Material).
It is also interesting to compare the cellular abundances of CheA and CheY to those of the histidine kinases (HKs) and response regulators (RRs) in other two-component signaling systems. Table S9 provides such a comparison for E. coli. The protein abundance data come from several published studies and show significant variability, which may be explained by differences in media, growth phases, strains, and techniques, and the comparison should thus be taken with caution. However, it appears that CheA proteins are orders of magnitude more highly expressed than all the other HKs for which data are available (Table S9). The comparison is less striking for CheY, since it does not appear to be particularly highly expressed among RRs in the data from Ref. (59), but the protein abundance measured in Ref. (16) is much higher, and would place CheY among the most highly expressed RRs (Table S9). While in E. coli, CheA and CheY are expressed at comparable levels (16), a number of other RRs are one or two orders of magnitude more highly expressed than their cognate HKs (Table S9). In two-component systems with bifunctional HKs that also dephosphorylate their cognate RRs, high RR abundances enable the level of phosphorylated RR to be insensitive to variations in the HK and RR abundances (60, 61). The E. coli chemotaxis pathway is different since it possesses a dedicated phosphatase, CheZ. However, the condition for obtaining a plateau of at high abundances (Eq. 15) and the corresponding adapted value of (Eq. 16) both depend on the ratio of CheZ to CheA abundances, which may fluctuate. Additional mechanisms provide robustness with respect to this ratio. First, CheZ is activated upon interaction with CheA-short (23, 24), and most phosphatase activity takes place at the receptor arrays (25), which keeps phosphatase activity coupled to kinase abundance. Second, CheZ oligomerizes in the presence of CheY-P (62), and this increases its activity (63). Finally, the dependence of on (Eq. 11), together with the competition between CheB and CheY for CheA-P, are thought to couple kinase and phosphatase activities since CheZ and CheY abundances are strongly coupled (44).
Hence, high chemotaxis protein abundances appear to arise from the specific rapidity constraints on the chemotaxis pathway. Supporting this view, we note that chemotaxis protein abundances similar to those in E. coli are found in the Gram positive bacterium Bacillus subtilis, which has even more chemoreceptors (64).
Self-assembly requirements yield additional constraints
Apart from the constraint of fast signaling, the chemotaxis pathway is also unusual among two-component systems in that it involves two types of large self-assembled multiprotein complexes: the chemoreceptor arrays, which allow for signal amplification via cooperativity (45, 8, 30, 65), and the rotary flagellar motors, which enable the cell to swim. The self-assembly requirements of these complexes also contribute constraints on the abundances of chemotaxis proteins.
First, inclusion in receptor arrays increases the autocatalytic rate of CheA by two orders of magnitude (29), so only CheA in arrays is functionally relevant (see Models and methods, and Table S2). However, overall cellular proportions reveal a significant excess of CheA with respect to the precise 6:1:1 receptor:CheA:CheW stoichiometry of the receptor arrays (7); for instance, overall proportions are 2.2:1:1 for strain RP437 in rich medium (16). Ref. (30) shows that overexpressing receptors up to -fold wild-type level at native CheA level leads to a stronger response to repellent, i.e. to a stronger kinase activity, which shows that CheA is strongly in excess in these conditions too. Besides, in vitro assembly of receptors alone leads to the formation of non-functional structures, called zippers, while adding CheA and CheW in excess to stoichiometric array proportions yields arrays (7). Hence, in E. coli, the correct self-assembly of the receptor arrays seems to require an excess of CheA. Note however that overall cellular proportions appear to be different in B. subtilis, but this bacterium also expresses soluble (non-transmembrane) chemoreceptors (64).
Second, self-assembly of the flagellar motor appears to constrain the abundance of the protein FliM. In the motor, FliM forms a ring of subunits (28) which bind CheY-P to mediate switching of the direction of motor rotation. Studies (27, 31, 21, 28) reveal that only a small fraction of FliM (), is part of complete motors (see Supporting Material, esp. Table S10). Nevertheless, underexpression and overexpression experiments indicate that FliM constitutes a limiting resource for proper motor assembly (27). Consistent with this observation, more than 25% of FliM is found in partially assembled structures (31, 28), with only about 16% of FliM copies free in the cytoplasm (31). Since it is likely that FliM in partially assembled structures binds CheY-P with an affinity comparable to FliM in complete motors, these additional FliM contribute to the lower bound on the total cellular concentration of CheY-P, , yielding the second term, which accounts for 23% of the total CheY-P lower bound. Hence, motor self-assembly requirements on FliM abundance provide a separate lower bound on CheY-P abundance only a factor of lower than our complete lower bound, which involves the actual value of .
Since FliM is in excess of the requirement for complete motors, one can ask if the FliM level is constrained by signaling requirements. However, our study demonstrates that the gain, as well as the output of the pathway, are very robust to variations of the abundance of FliM (Fig. 5B). The gene encoding FliM does not belong to either of the meche and mocha operons that encode the Che proteins (15, 66, 10). Hence, FliM expression levels are likely to feature non-negligible abundance fluctuations with respect to other proteins in the pathway, making robustness to FliM abundance variations a useful feature.
Gain and cooperativity are increased by a concerted increase of protein abundances
The abundances of chemotaxis proteins were measured in two different E. coli strains considered wild-type for chemotaxis, in both rich and minimal growth media, in Ref. (16). Strikingly, chemotaxis proteins tend to be more expressed in minimal medium than in rich medium. While this increase is modest for the reference strain RP437, where Che protein abundances increase from 1 fold to 1.1 fold, it is very strong for strain OW1, where Che protein abundances increase 9.4 times, from 0.22 fold to 2.0 fold.
Proportions are well-conserved despite this high variability of abundances (16). The Che proteins are expressed from two adjacent operons in the E. coli genome, the meche operon, which encodes CheR, CheB, CheY, CheZ, as well as two types of chemoreceptors, and the mocha operon, which encodes CheA and CheW (15, 66, 10). Both meche and mocha operons are in the same regulon: they are under transcriptional control of the sigma factor and of the anti-sigma factor FlgM (15). In addition to this transcriptional coupling, these genes also feature translational coupling (66). This enables the expression levels of the Che proteins to be correlated and their proportions to be stable (15, 10). In Ref. (15), where the abundances of chemotaxis proteins were varied in a concerted fashion by modulating the expression of FlgM, the chemotactic efficiency of cells (measured by a swarm assay) was found to increase sharply up to about wild-type abundance, and then to keep increasing much more gradually while progressively leveling off.
We find that the gain at the level of the response regulator CheY-P increases substantially for concerted increases of the abundances up to about reference levels, and more moderately above reference levels, reaching a plateau in the high-abundance limit. This dependence of the gain on protein abundances (Fig. 4B) is consistent with the swarm assay results of Ref. (15). Gain is a crucial quantity since drift velocity in a shallow chemoeffector gradient is proportional to gain (46). Moreover, an increase of the gain could further sensitize cells to small changes of attractant concentration (45), which may be beneficial in poor media. This effect is strong for strain OW1, where we find that the gain in is increased by a factor in minimal medium vs. rich medium (even more if the small variations in abundance ratios (16) are accounted for). The small gain obtained for 0.22-fold abundance, corresponding to the expression level for strain OW1 in rich medium (Fig. 4B) arises from the small non-phosphorylated CheY reserve in this case (only of total CheY in adapted conditions), which entails a small response to an increase of . Note in addition that CheY and CheZ abundances in strain OW1 in minimal medium are smaller than our lower bounds derived from rapidity constraints, indicating slower response times.
In addition to the increase of gain, receptor overexpression has been shown to increase cooperativity among receptors by increasing the size of receptor signaling teams (67, 30, 65). This additional cooperativity can also increase sensitivity to low attractant concentrations. Together, these increases of sensitivity help explain why the proteins of the chemotaxis pathway are overexpressed in minimal medium compared to rich medium (16), despite the cost of additional protein expression.
Author contributions
Designed research: AFB and NSW; performed research: AFB; wrote the paper: AFB and NSW.
Acknowledgments
AFB thanks Sophia Hsin-Jung Li for helpful discussions.
This work was supported in part by National Institutes of Health Grant R01 GM082938 and National Science Foundation Grant PHY-1305525. AFB acknowledges the support of the Human Frontier Science Program.
SUPPORTING MATERIAL
1 Chemotaxis pathway model: chemical reactions and parameter values
The chemical reactions corresponding to our E. coli chemotaxis pathway model in Eqs. 1-10 of the main text are:
| (S1) | |||
| (S2) | |||
| (S3) | |||
| (S4) | |||
| (S5) | |||
| (S6) | |||
| (S7) | |||
| (S8) |
As in the main text, phosphorylated species are denoted by “-P”, and complexes by a dot between the two species names (e.g., ). Eq. S1 corresponds to autophosphorylation of the histidine kinase CheA, and the fraction of active CheA is accounted for by an effective reduction of the autocatalytic rate from to . Eq. S2 and Eq. S3 represent phosphotransfer from CheA-P to CheY and CheB, respectively. Eq. S4 expresses dephosphorylation of the phosphorylated response regulator CheY-P by the phosphatase CheZ, and Eq. S5 the (much slower) auto-dephosphorylation of CheY-P. Similarly, Eq. S6 corresponds to auto-dephosphorylation of the complex, and Eq. S8 to auto-dephosphorylation of CheB-P. Finally, Eq. S7 represents the binding of the phosphorylated response regulator CheY-P to the FliM protein, which is a part of the flagellar motor, as well as their unbinding.
The values of the rate constants used are presented in Table S1, and the values of the effective total cellular concentrations are presented in Table S2. These concentration values are used as references when abundances are varied in model calculations.
| Constant | Value | Notes and references |
|---|---|---|
| 20 /s | (52, 53, 54) | |
| 40 /s/M | (43) | |
| 15 /s/M | (68, 69) | |
| 2.3 /s/M | Adjusted; 5.6 /s/M in the absence of CheA (22). | |
| 0.04 /s | in the absence of CheA (22) | |
| 12.3 /s | Adjusted; 4.9 /s in the absence of CheA (22). | |
| 0.04 /s | (70, 71, 72) | |
| 5 /s/M | Diffusion-limited (21, 42). | |
| 18 /s | From (33, 21, 34, 35) and . | |
| 0.37 /s | (73, 74) | |
| 0.12 /s | For S. typhimurium CheR (75). | |
| 0.29 /s | (76) |
| Protein | Total concentration (M) | Notes and references |
|---|---|---|
| CheA | 2.97 | 1/6 of the chemoreceptor concentration, 17.8 M (16). |
| CheY | 9.73 | (16) |
| CheZ | 3.80 | (16) |
| CheB | 0.28 | (16) |
| CheR | 0.17 | (16) |
| FliM | 1.43 | (27, 28). The 16% of FliM that are free (31) are discounted. |
2 Simplified pathway model
2.1 Assumptions and model
The full pathway model, corresponding to the chemical reactions in Eqs. S1-S8, is written in Eqs. 1-10 in the main text. Here, we present an analytically tractable simplified version for steady state. Our simplifying assumptions are the following:
-
•
With regard to CheA-P levels, we neglect phosphotransfer to CheB with respect to phosphotransfer to CheY, i.e., we assume (see Eq. 6). Indeed, the total concentration of CheY is much larger than that of CheB (Table S2), and in addition (Table S1). Moreover, CheY-P is dephosphorylated much faster than CheB-P, due to the existence of the dedicated phosphatase CheZ, so its turnover is much faster.
-
•
We treat the active fraction of CheA as a parameter, without explicitly relating it to the CheB-P concentration (e.g., as in Eq. 11). Thanks to this simplification, and to the previous one, CheB decouples from the rest of the system, and can thus be ignored.
-
•
We neglect auto-dephosphorylation of CheY-P, as it is much slower than dephosphorylation by CheZ.
-
•
We neglect auto-dephosphorylation of CheY-P in the complex , as it is much slower than dissociation of this complex (, see Table S1).
-
•
We neglect dissociation in the complex , as it is much slower than dephosphorylation (, see Table S1).
Under these assumptions, at steady state (i.e., when all time derivatives vanish), the pathway model in Eqs. 1-10 becomes:
| (S9) | ||||
| (S10) | ||||
| (S11) | ||||
| (S12) | ||||
| (S13) | ||||
| (S14) | ||||
| (S15) | ||||
| (S16) |
In this system, Eqs. S13-S15 simply express the equality of the phosphorylation and dephosphorylation speeds of CheY at steady state.
2.2 Fast phosphotransfer limit
Given the rapidity of phosphotransfer from CheA-P to CheY at standard cellular concentrations (43), a relevant limit is the “fast phosphotransfer limit”, where CheA-P very rapidly undergoes phosphotransfer. In this limit,
| (S17) |
The simplified system Eqs. S9-S16 can be solved analytically in the fast phosphotransfer limit, yielding successively:
| (S18) | ||||
| (S19) | ||||
| (S20) |
One necessary condition for the fast phosphotransfer limit to apply is that obtained under it (see Eq. S18) should be smaller than . This gives the following condition on the active fraction of CheA:
| (S21) |
In other words, to be in the fast phosphotransfer regime, the velocity of the autophosphorylation of CheA needs to be slower than the maximal velocity of the dephosphorylation of CheY-P by CheZ. Eqs. S19-S20 show that, in the fast phosphotransfer limit, both and , which can be considered as the outputs of the pathway, depend only on the kinetic rates, on the active fraction of CheA, and on the ratio of the total concentrations of CheZ and CheA. Hence, if is constant, both and are invariant to concerted variation of the abundances of all the proteins in the pathway, keeping the abundance ratios constant (as in Ref. (15)).
These results can be used to obtain the gain for the simplified pathway in the fast phosphotransfer limit. The gain in , defined in Eq. 12, can be obtained from Eq. S19 by differentiating with respect to , yielding
| (S22) |
Using Eqs. S11 and S18, we can express this gain as
| (S23) |
This expression demonstrates that the gain in arises from saturation of the phosphatase CheZ. Similarly, the gain in , defined in Eq. 13, can be obtained from Eq. S20 by differentiating with respect to , yielding
| (S24) |
2.3 Comparison with results from the full pathway
The validity of the fast phosphotransfer limit in Eq. S17, and of the assumptions in our simplified pathway model (see above), can be tested against the results from the full pathway. We find that the results agree well at reference expression levels and higher of the chemotaxis signaling proteins, for the parameter values used here (kinetic rates in Table S1 and abundance ratios equal to those in Table S2).
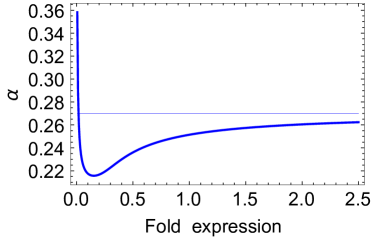
In our full pathway model, is coupled to the rest of the pathway through (see Eq. 11). Solving the full pathway yields as a function of the expression level of all chemotaxis signaling proteins (Fig. S1). At high expression levels, reaches a plateau. The asymptotic value of at high expression levels can be calculated within the fast-phosphotransfer limit of our simplified pathway. For this, we express as a function of , using Eq. 5 and Eq. 10 at steady state, and use the solutions of the simplified pathway in the fast phosphotransfer limit for . We then use Eq. 11 together with this expression for in order to solve for . In the limit of high abundances (keeping abundance ratios constant), this amounts to solving a second-degree equation, which yields the asymptotic value of . With the parameter values used here (kinetic rates in Table S1 and abundance ratios equal to those in Table S2), we obtain , close to the value obtained for 2.5-fold overexpression from the full pathway model (Fig. S1).
Hence, the results from our simplified pathway model in the fast phosphotransfer limit are relevant at high abundances, and account for the observed plateaus of and in Fig. 4A, and of the gain in Fig. 4B. Using the high-abundance asymptotic value , Eq. S19 yields , and Eq. S20 yields . These values are close to those obtained for high overexpression (specifically, , and for 2.5-fold overexpression, see Fig. 4A). Similarly, Eq. S22 yields here, and Eq. S24 yields , extremely close to the values obtained for high overexpression (Fig. 4B). These asymptotic high-abundance values from our simplified pathway model in the fast phosphotransfer limit are plotted as thin lines in Fig. 4A-B. In addition, the CheZ concentration from the full pathway solution is used to plot the ratio in Eq. S23, which is the dotted line in Fig. 4B. It gives a good approximation to the actual gain in for sufficiently high abundances, of order one-fold and above.
2.4 Low-abundance limit
While the fast phosphotransfer regime is the relevant one for standard cellular abundances and higher, the pathway’s behavior is very different in the limit of low abundances. Indeed, since autophosphorylation of CheA is autonomous, while phosphotransfer to CheY involves a two-molecule encounter between CheA-P and CheY, the fraction of phosphorylated CheA becomes high in the limit of low overall abundances. More precisely, if , then Eq. S13 ensures that
| (S25) |
Provided that and that , small proportions of CheZ and of FliM are bound to CheY-P. We obtain, using Eqs. S15 and S16,
| (S26) | ||||
| (S27) |
In this regime, if in addition , whic implies that a small fraction of CheY-P is bound to CheZ (see Eq. S26), Eqs. S14 and S15 yield
| (S28) |
Given that we vary the overall abundances of CheA, CheY, CheZ, CheB, and CheR, while keeping their proportions and the FliM abundance fixed (see main text), Eq. S28 shows that in the low-abundance limit, grows in proportion to the overall abundances of the Che proteins (indeed it shows that ).
Eqs. S27 and S28 yield an expression for in this limit:
| (S29) |
These asymptotic low-abundance expressions from our simplified pathway model are plotted as thin dotted lines in Fig. 4A.
Note that here, we have just studied the low-abundance limit of our simplified pathway model. In practice, additional effects might come into play, for instance the formation of the chemoreceptor array and of the flagellar motor would likely be impaired at too low abundances.
3 Effect of a variation of the level of each protein of the pathway
The effect of varying the level of each protein of the chemotaxis pathway is discussed in the main text, and Fig. 5 shows how the gain is affected by these individual variations of protein levels. Here, we present results regarding the direct outputs of the pathway, namely the adapted fraction of FliM proteins bound to CheY-P (Fig. S2) and the adapted free CheY-P concentration, (Fig. S3).
These results, especially Fig. S3, enable a direct comparison with Ref. (18), where was considered, but not the gain of the pathway.
4 Comparison of the autocatalytic rates of different histidine kinases
Table S3 lists experimental values from the literature for the autocatalytic rates of different histidine kinases involved in bacterial two-component signaling systems. CheA is much faster than all of these, with an autocatalytic rate in E. coli (77) and in S. typhimurium (29) when isolated, and in S. typhimurium (29) when in complex with chemoreceptors and CheW.
| Organism | Function | Histidine kinase | (/s) | Ref. |
|---|---|---|---|---|
| Enterococcus faecium | Antibiotic resistance | VanS | (78) | |
| Bacillus subtilis | Sporulation | KinA | (79) | |
| Bacillus subtilis | Cold shock response | DesK | (80) | |
| Thermotoga maritima | HpkA | (81) | ||
| Streptococcus pneumoniae | Virulence, etc. | WalKSpn (C)-His | (82) | |
| Streptococcus pneumoniae | Virulence, etc. | WalKSpn (N)-Sumo | (82) | |
| Escherichia coli | Response to nitrite | NarX | (83) | |
| Escherichia coli | Response to nitrate | NarQ | (83) | |
| Synechocystis | Light signaling system | Cph1 holo | (84) | |
| Synechocystis | Light signaling system | Cph1 apo | (84) | |
| Myxococcus xanthus | Aggregation; sporulation | RodK | (85) |
5 Expression levels of various paralogs of the chemotaxis gene clusters
Here, we compare the expression levels of che genes actually involved in chemotaxis to those of non-chemotactic che genes in bacteria that have multiple che gene clusters in their genome. For this comparison, we use data from published microarray studies.
5.1 Pseudomonas aeruginosa
The genome of P. aeruginosa includes four main clusters of che genes (56). Among these, two are involved in chemotaxis, with one, PA1456-1464 (+ PA3348-3349 containing cheR), being essential for chemotaxis, and the second one (PA0180-0173) being non-essential. Ref. (86) showed that strains deleted for the latter cluster exhibit positive chemotactic response (to peptone and phosphate). In Ref. (87), this cluster was found to be required for an optimal chemotactic response (in addition to the main cluster), but the authors state that they cannot exclude that its major output is some other function. Among the two remaining clusters, one (PA0408-0415) is involved in twitching motility based on type IV pili (88), and the last one (PA3708-3702) regulates biofilm formation through modulation of c-diGMP levels (89).
In Ref. (90), a microarray analysis of P. aeruginosa was conducted to study its response to hydrogen peroxide. The full microarray data are available both in the absence (control) and in the presence of hydrogen peroxide. Table S4 corresponds to the microarray results (i.e., the abundance of mRNA) in the control data, for cheY, cheA, cheW, cheR, and cheB from all chemotaxis clusters. It gives the ratio of the expression levels of the genes from the main chemotaxis cluster to those of the corresponding genes from each other cluster.
*Note that the response regulator encoded by the biofilm-associated cluster, WspR, is classified as non-CheY (56).
| Chemotaxis II | Twitching | Biofilm formation | |
| PA0180-0173 | PA0408-0415 | PA3708-3702 | |
| cheY | 0.22 | 5.34 (2) | 0.22* |
| cheA | 0.09 | 0.93 | 0.23 |
| cheW (2) | 0.02 | 0.58 (2) | 0.24 (2) |
| cheR | 0.15 | 0.52 | 0.21 |
| cheB | 0.02 | 0.30 | 0.31 |
Table S4 shows that genes from the main chemotaxis cluster are significantly more highly expressed than those of the second cluster involved in chemotaxis. They are also more expressed than genes from the biofilm-associated one. However, the cheA and cheW genes from the twitching-associated cluster have similar levels of expression as those of the main chemotaxis cluster, and the two copies of cheY in the twitching-associated cluster are together five times more expressed than the cheY involved in chemotaxis. This twitching motility-associated che gene cluster is known to modulate the activity of an adenylate cyclase involved in virulence, and to have additional roles in transcriptional regulation, but this pathway is complex and not fully elucidated yet (58). Chemosensing for directed twitching motility (on surfaces) has to be fast as in swimming, and the twitching-motility system is known to mediate chemotaxis towards phospholipids (91). Hence, the abundance of these motility-associated proteins might partly arise from rapidity constraints, as in the case of swimming chemotaxis. In addition, Ref. (88) suggests a possible role of (one of) the CheYs of this system as a phosphate sink (as in the chemotaxis systems of Rhodobacter sphaeroides, which include no CheZ): this might explain the very high expression of the two cheY genes in the P. aeruginosa twitching motility-associated cluster.
Notably, the main chemotaxis cluster is the only one that includes CheZ, whose role is to dephosphorylate CheY rapidly.
5.2 Vibrio cholerae
The genome of V. cholerae includes three main clusters of che genes (56). Among these, only one, VC2059-2065 (+ VC2201-2202 containing cheR) is involved in chemotaxis. The functions of the other two clusters (VC1394-1406 and VCA1088-1096) are not known yet. In fact, neither deletion nor overexpression of the genes in these clusters has been found to produce any detectable phenotype (92).
In Ref. (93), the transcriptome of V. cholerae was studied both for bacteria grown in vitro and during intraintestinal growth (in the latter case, the bacteria were harvested from rabbit ileal loops). The full microarray data are available in both of these conditions. Table S5(a) and (b) gives the ratio of the expression levels of the genes from the actual chemotaxis cluster to those of the corresponding genes from each other cluster, calculated from the microarray data of Ref. (93).
| (a) | VC1394-1406 | VCA1088-1096 |
|---|---|---|
| cheY | 0.45 (2) | 0.29 |
| cheA | 0.70 | 0.25 |
| cheW | 0.30 | 0.53 (2) |
| cheR | 0.63 | 0.62 |
| cheB | 0.14 | 0.20 |
| (b) | VC1394-1406 | VCA1088-1096 |
|---|---|---|
| cheY | 0.22 (2) | 0.11 |
| cheA | 0.89 | 0.10 |
| cheW | 0.16 | 0.42 (2) |
| cheR | 0.33 | 0.44 |
| cheB | 0.14 | 0.24 |
In spite of some variability between conditions, the data in Table S5 consistently show that the actual chemotaxis cluster is more expressed than the other two che gene clusters. Here too, the actual chemotaxis cluster is the only one that includes CheZ, whose role is to dephosphorylate CheY rapidly.
5.3 Caulobacter crescentus
C. crescentus has two different che gene clusters, and only one of them is known to be involved in chemotaxis. Here we compare the expression levels of the second che cluster (CCNA00625-00634) to those of the genes involved in chemotaxis (CCNA00439-00450). Ref. (94) investigated gene expression in different phases of the cell cycle of C. crescentus, and reported a full microarray study of C. crescentus in these different phases.
| CCNA00625-00634 | |||||
|---|---|---|---|---|---|
| SW | ST | EPD | PD | LPD | |
| cheY (3) | 0.24 (3) | 1.17 (3) | 0.10 (3) | 0.06 (3) | 0.14 (3) |
| cheA | Below detection level | Below detection level | 0.03 | 0.03 | 0.04 |
| cheW | 0.17 | 0.11 | 0.06 | 0.06 | 0.06 |
| cheR | 0.27 | 1.00 | 0.13 | 0.06 | 0.14 |
| cheB | 0.02 | Below detection level | 0.01 | 0.02 | 0.02 |
5.4 Sinorhizobium meliloti
S. meliloti has two different che gene clusters, and only one of them is known to be involved in chemotaxis. There are also two isolated cheW genes (one being close to an MCP-coding gene). Here we compare the expression levels of the second chemotaxis cluster (SMa1550-1561) to those of the genes of the main cluster involved in chemotaxis (SMc03004-03012). We do not consider the isolated cheW gene because it is not known whether it is involved in chemotaxis. Ref. (95) investigated the influence of antimicrobial nodule-specific cysteine-rich peptides, and reported full microarray study of S. meliloti.
*Note that the response regulator encoded by the second cluster, CheO, is classified as non-CheY (56).
| SMa1550-1561 (10 min) | SMa1550-1561 (30 min) | |
|---|---|---|
| cheY (2) | 0.52∗ | 0.78∗ |
| cheA | 0.33 | 0.31 |
| cheW | 0.30 | 0.27 |
| cheR | 0.54 | 0.57 |
| cheB | 0.30 | 0.27 |
5.5 Rhodobacter sphaeroides
R. sphaeroides has three different che gene clusters, and two of them are known to be involved in chemotaxis. There is in addition one isolated cheY, which is also essential to chemotaxis. Here we compare the expression levels of the third che cluster to those of the genes involved in chemotaxis. Ref. (96) investigated the role of a protein in the iron metabolism of R. sphaeroides, and reported full microarray studies of R. sphaeroides in different conditions. Here we report the results obtained for the wild-type strain in the presence and in the absence of iron. Similarly, Ref. (97) used microarrays to investigate the role of a light, oxygen, voltage domain protein in blue light-dependent and singlet oxygen-dependent gene regulation in R. sphaeroides and reported full microarray data.
Note that these data are to be interpreted with caution, first because of the complication of R. sphaeroides having two essential chemotaxis systems, and second because the expression level of many of the genes considered here were found to be below the threshold of significance defined in the original publications. Note also that the non-chemotactic che cluster encodes a putative CheX, and that CheX plays the part of a CheY phosphatase in Borrelia burgdorferi (98).
| (a) | RSP2433-2443 (WT+Fe) | RSP2433-2443 (WTFe) |
|---|---|---|
| cheY (3) | 1.40 (3) | 0.53 (3) |
| cheA (3) | 0.04 | 0.01 |
| cheW (3) | Below detection level | 0.04 |
| cheR (2) | 0.09 | 0.25 |
| (b) | RSP2433-2443 (WT) |
|---|---|
| cheY (3) | 0.92 (3) |
| cheA (3) | 0.34 |
| cheW (3) | 0.13 |
| cheR (2) | 0.30 |
6 Expression levels of genes coding for two-component systems in E. coli
The genome of E. coli comprises 29 sensor histidine kinases and 32 response regulators involved in two-component signaling systems (99, 12), which are involved in the cell’s sensing and response to its environment. It is interesting to compare the expression levels of the chemotaxis genes to those of other two-component signaling systems. In Table S9, we present the number of protein copies per cell for the histidine kinases and response regulators of various two-component systems in E. coli. The variability across estimates from different studies may be explained by the differences in media, growth phases, and strains of E. coli, which are known to yield significant variations of abundances (16, 100, 101), and also perhaps by the different techniques used:
-
•
In Ref. (59), the proteome of E. coli was quantified at the single-cell level using single-molecule fluorescence, thanks to a yellow-fluorescent-protein fusion library. E. coli BW25993 cells were grown in LB media and then inoculated into M9 media supplemented with glucose, amino acids, and vitamins. The optical density was 0.1-0.5.
-
•
Ref. (101) used mass spectrometry (more precisely, emPAI) to quantify the abundance of proteins in E. coli, focusing mostly on cytoplasmic proteins. E. coli MC4100 cells were grown in rich or minimum medium to exponential phase (optical density 0.4), but the datasets obtained with the two different media were combined in the final analysis.
-
•
Ref. (102) used the emPAI technique as Ref. (101), but this work also quantified the abundances of membrane proteins, first extracting them with the aid of a removable phase transfer surfactant (PTS). In this reference, E. coli BW25113 cells were grown in LB medium and harvested at stationary phase.
-
•
Ref. (16) used quantitative immunoblotting, focusing only on chemotaxis proteins. Several conditions were studied. Here we report the values obtained for strain RP437 in Tryptone broth (rich medium) with cells grown to an optical density of 0.5.
-
•
Ref. (100) focused on the levels of EnvZ and OmpR proteins using quantitative Western blot analysis. The E. coli strain used was MC4100. The values reported here were obtained during exponential growth in L-broth medium.
| Two-component system | Histidine kinase | Response regulator | ||||||
|---|---|---|---|---|---|---|---|---|
| (Histidine kinase / response regulator) | (59) | (101) | (102) | Other | (59) | (101) | (102) | Other |
| CheA/ CheY: Chemotaxis | 6,700 (16) | 12 | 8,200 (16) | |||||
| EnvZ / OmpR: Osmolarity sensing | 1.3 | 100 (100) | 81 | 613 | 238 | 3,500 (100) | ||
| NarX / NarL: Response to nitrite | 1.3 | 229 | 522 | |||||
| PhoR / PhoB: Phosphate regulation | 11 | |||||||
| EvgS / EvgA: Drug resistance | 5 | 82 | 198 | 26 | ||||
| CusS / CusR: Copper response | 2 | 1.4 | ||||||
| YedV / YedW | 3 | 0.8 | 1.5 | |||||
| KdpD / KdpE: Potassium transport | 9 | 6/0.7 | 6 | |||||
| BaeS / BaeR | 12 | 167 | ||||||
| HydH / HydG | 1 | |||||||
| PhoQ / PhoP: Response to magnesium | 7 | 1.2 | 786 | 113 | ||||
| BasS / BasR: Polymyxin resistance | 0.7 | 1.3 | 65 | |||||
| CpxA / CpxR: Response to cell envelope stress | 1.8 | 33 | 664 | 316 | ||||
| TorS / TorR | 3 | |||||||
| DcuS / DcuR | 1.1 | 0.6 | ||||||
| RcsC / RcsB: Capsular synthesis | 9 | 1.1 | 369 | 1,490 | 597 | |||
| CitA / CitB | 1 | |||||||
| ArcB / ArcA: Respiratory control | 56 | 100 | 32/1.5 | 2,660 | 550 | |||
| BarA / UvrY: Hydrogen peroxide sensitivity | 2 | 1.3 | 29 | 18 | ||||
7 Cellular localization of the protein FliM
The protein FliM is a constituent of the cytoplasmic ring of the rotor that mediates rotation-direction switching in response to binding of CheY-P. Several studies reveal that only a small fraction of FliM is part of complete motors (Table S10):
-
•
In Ref. (27), the relative abundances of FliM in the membrane and cytoplasmic fractions were estimated by lysing the cells and separating the membranes from the cytoplasm by centrifugation. It was found that 1,100 copies of FliM out of 1,400, i.e., 78% of FliM copies, were in the cytoplasmic fraction, and thus not in complete motors.
-
•
In Ref. (28), the abundance and localization of FliM were studied by fluorescence microscopy. There were 24 6 spots, corresponding to assemblies of multiple FliM, per cell. The distribution of the number of molecules per spot showed two peaks, one at 32 molecules (in agreement with previously measured numbers of FliM per flagellar motor) accounting for about 40% of the spots, and one at 18 molecules, which may correspond to partly assembled cytoplasmic rings, accounting for about 45% of the spots (28). The remaining of the spots fell outside these peaks, corresponding to structures not independently resolved. Hence, of the FliM in spots were part of full cytoplasmic rings. In addition, background fluorescence showed the presence of FliM molecules not associated with spots, and the total number of FliM copies per cell was estimated to be . These data yield a fraction from to of FliM copies that may actually be inside full cytoplasmic rings. In other words, of FliM copies were outside complete motors. Besides, a fraction from to of FliM copies appeared to belong to partly assembled rings.
-
•
In Ref. (31) (which studied S. typhimurium while the other references studied E. coli), whole-cell lysates were separated into three fractions by sedimentation: % of FliM was found to be in the soluble fraction and was thus not part of motors. Gel filtration enabled separation of the larger basal body structures into full flagellar motors and incomplete precursors. Among these large structures, about 31% of the FliM was found to be part of precursors. At the end of their analysis, the authors also stated that “about half of FliM remained unaccounted for [in the gel filtration results], suggesting that FliM may form presently uncharacterized, particulate aggregates in addition to being part of flagellar basal bodies”. They suggested that those correspond to “dissociable FliM assembly intermediates that either get stuck on or elute very late from the column”, thus not appearing in the gel filtration results. Combining this, we may estimate that a fraction of FliM copies is not part of complete motors.
| Organism | Total per cell | Outside complete motors | In partly-assembled structures | Ref. |
|---|---|---|---|---|
| E. coli | 1,400 200 | 78% | Not evaluated | (27) |
| E. coli | 1,450 360 | 69-77% | 25-34% | (28) |
| S. typhimurium | 1,640 300 | 76% | 31-81% | (31) |
We can also estimate the number of FliM that actually belong to functional flagella. In wild-type E. coli, Ref. (27) reports on average 2.6 flagella per cell, and Ref. (3) reports about flagella per cell. In S. typhimurium, there are about 6-10 flagella per cell (103). Studies of the stoichiometry of the motor report FliM copies per motor (31, 13) (in S. typhimurium), and about 32 (28) (in E. coli). This would give a number of order 100 FliM that actually belong to functional flagella in E. coli (about 7%), and about 300 in S. typhimurium (about 18%). This is even less than what would be expected from the results above (Table S10), especially for E. coli. This difference may indicate that some complete or almost complete cytoplasmic rings or motors do not belong to flagella. These might be in the last stages of assembly.
In spite of the high fraction of FliM that are not in functional flagellar motors, the number of flagella per cell increases when FliM is (not too highly) overexpressed, which indicates that FliM constitutes a limiting resource in flagellar assembly (27). Besides, underexpression of FliM reduces the number of flagella per cells and their efficiency. Consistently, in Ref. (21), the number of FliM per cell necessary for optimum motility was about 4900 (about 3.5 times higher than in the wild-type cells), and only about of these FliM were found in functional or incomplete flagellar motors (note that these FliM were fluorescently labeled).
Recent work indicates that the FliM proteins present in motors exchange with the cytoplasmic pool, and that the number of FliM per motor is variable (28, 104, 105, 35). The number of FliM copies per motor depends on the concentration of CheY-P (104), through the direction of rotation of the motor (105). This allows for adaptation of the motor to the concentration of CheY-P, by shifting the range of CheY-P concentration over which the clockwise bias of the motor changes (104), which is very narrow (35). The fraction of FliM that exchanges depends on the direction of rotation too (105). Hence, cytoplasmic FliM seems to have a function in motor adaptation.
References
- Adler (1966) Adler, J., 1966. Chemotaxis in Bacteria. Science 153:708–716.
- Berg and Brown (1972) Berg, H. C., and D. A. Brown, 1972. Chemotaxis in Escherichia coli analyzed by three-dimensional tracking. Nature 239:500–504.
- Turner et al. (2000) Turner, L., W. S. Ryu, and H. C. Berg, 2000. Real-time imaging of fluorescent flagellar filaments. J. Bacteriol. 182:2793–2801.
- Kentner and Sourjik (2006) Kentner, D., and V. Sourjik, 2006. Spatial organization of the bacterial chemotaxis system. Curr. Opin. Microbiol 9:619–624.
- Briegel et al. (2009) Briegel, A., D. R. Ortega, E. I. Tocheva, K. Wuichet, Z. Li, S. Chen, A. Muller, C. V. Iancu, G. E. Murphy, M. J. Dobro, I. B. Zhulin, and G. J. Jensen, 2009. Universal architecture of bacterial chemoreceptor arrays. Proc. Natl. Acad. Sci. U.S.A. 106:17181–17186.
- Briegel et al. (2012) Briegel, A., X. Li, A. M. Bilwes, K. T. Hughes, G. J. Jensen, and B. R. Crane, 2012. Bacterial chemoreceptor arrays are hexagonally packed trimers of receptor dimers networked by rings of kinase and coupling proteins. Proc. Natl. Acad. Sci. U.S.A. 109:3766–3771.
- Briegel et al. (2014) Briegel, A., M. L. Wong, H. L. Hodges, C. M. Oikonomou, K. N. Piasta, M. J. Harris, D. J. Fowler, L. K. Thompson, J. J. Falke, L. L. Kiessling, and G. J. Jensen, 2014. New insights into bacterial chemoreceptor array structure and assembly from electron cryotomography. Biochemistry 53:1575–1585.
- Hazelbauer et al. (2007) Hazelbauer, G. L., J. J. Falke, and J. S. Parkinson, 2007. Bacterial chemoreceptors: high-performance signaling in networked arrays. Trends Biochem. Sci. 33:9–19.
- Hazelbauer and Lai (2010) Hazelbauer, G. L., and W. C. Lai, 2010. Bacterial chemoreceptors: providing enhanced features to two-component signaling. Curr. Opin. Microbiol. 13:124–132.
- Sourjik and Wingreen (2012) Sourjik, V., and N. S. Wingreen, 2012. Responding to chemical gradients: bacterial chemotaxis. Curr. Opin. Cell Biol. 24:262–268.
- Goulian (2010) Goulian, M., 2010. Two-component signaling circuit structure and properties. Curr. Opin. Microbiol. 13:184–189.
- Krell et al. (2010) Krell, T., J. Lacal, A. Busch, H. Silva-Jimenez, M. E. Guazzaroni, and J. L. Ramos, 2010. Bacterial sensor kinases: diversity in the recognition of environmental signals. Annu. Rev. Microbiol. 64:539–559.
- Macnab (2003) Macnab, R. M., 2003. How bacteria assemble flagella. Annu. Rev. Microbiol. 57:77–100.
- Sowa and Berry (2008) Sowa, Y., and R. M. Berry, 2008. Bacterial flagellar motor. Q. Rev. Biophys. 41:103–132.
- Kollmann et al. (2005) Kollmann, M., L. Løvdok, K. Bartholome, J. Timmer, and V. Sourjik, 2005. Design principles of a bacterial signalling network. Nature 438:504–507.
- Li and Hazelbauer (2004) Li, M., and G. L. Hazelbauer, 2004. Cellular stoichiometry of the components of the chemotaxis signaling complex. J. Bacteriol. 186:3687–3694.
- Barkai and Leibler (1997) Barkai, N., and S. Leibler, 1997. Robustness in simple biochemical networks. Nature 387:913–917.
- Levin et al. (1998) Levin, M. D., C. J. Morton-Firth, W. N. Abouhamad, R. B. Bourret, and D. Bray, 1998. Origins of individual swimming behavior in bacteria. Biophys. J. 74:175–181.
- Alon et al. (1999) Alon, U., M. G. Surette, N. Barkai, and S. Leibler, 1999. Robustness in bacterial chemotaxis. Nature 397:168–171.
- Meir et al. (2010) Meir, Y., V. Jakovljevic, O. Oleksiuk, V. Sourjik, and N. S. Wingreen, 2010. Precision and kinetics of adaptation in bacterial chemotaxis. Biophys. J. 99:2766–2774.
- Sourjik and Berg (2002a) Sourjik, V., and H. C. Berg, 2002. Binding of the Escherichia coli response regulator CheY to its target measured in vivo by fluorescence resonance energy transfer. Proc. Natl. Acad. Sci. U.S.A. 99:12669–12674.
- Silversmith et al. (2008) Silversmith, R. E., M. D. Levin, E. Schilling, and R. B. Bourret, 2008. Kinetic characterization of catalysis by the chemotaxis phosphatase CheZ. Modulation of activity by the phosphorylated CheY substrate. J. Biol. Chem. 283:756–765.
- Wang and Matsumura (1996) Wang, H., and P. Matsumura, 1996. Characterization of the CheAS/CheZ complex: a specific interaction resulting in enhanced dephosphorylating activity on CheY-phosphate. Mol. Microbiol. 19:695–703.
- O’Connor and Matsumura (2004) O’Connor, C., and P. Matsumura, 2004. The accessibility of cys-120 in CheA(S) is important for the binding of CheZ and enhancement of CheZ phosphatase activity. Biochemistry 43:6909–6916.
- Vaknin and Berg (2004) Vaknin, A., and H. C. Berg, 2004. Single-cell FRET imaging of phosphatase activity in the Escherichia coli chemotaxis system. Proc. Natl. Acad. Sci. U.S.A. 101:17072–17077.
- Shimizu et al. (2010) Shimizu, T. S., Y. Tu, and H. C. Berg, 2010. A modular gradient-sensing network for chemotaxis in Escherichia coli revealed by responses to time-varying stimuli. Mol. Syst. Biol. 6:382.
- Tang and Blair (1995) Tang, H., and D. F. Blair, 1995. Regulated underexpression of the FliM protein of Escherichia coli and evidence for a location in the flagellar motor distinct from the MotA/MotB torque generators. J. Bacteriol. 177:3485.
- Delalez et al. (2010) Delalez, N. J., G. H. Wadhams, G. Rosser, Q. Xue, M. T. Brown, I. M. Dobbie, R. M. Berry, M. C. Leake, and J. P. Armitage, 2010. Signal-dependent turnover of the bacterial flagellar switch protein FliM. Proc. Natl. Acad. Sci. U.S.A. 107:11347–11351.
- Levit et al. (1999) Levit, M. N., Y. Liu, and J. B. Stock, 1999. Mechanism of CheA protein kinase activation in receptor signaling complexes. Biochemistry 38:6651–6658.
- Endres et al. (2008) Endres, R. G., O. Oleksiuk, C. H. Hansen, Y. Meir, V. Sourjik, and N. S. Wingreen, 2008. Variable sizes of Escherichia coli chemoreceptor signaling teams. Mol. Syst. Biol. 4:211.
- Zhao et al. (1996) Zhao, R., C. D. Amsler, P. Matsumura, and S. Khan, 1996. FliG and FliM Distribution in the Salmonella typhimurium Cell and Flagellar Basal Bodies. J. Bacteriol. 178:258–265.
- McEvoy et al. (1999) McEvoy, M. M., A. Bren, M. Eisenbach, and F. W. Dahlquist, 1999. Identification of the binding interfaces on CheY for two of its targets, the phosphatase CheZ and the flagellar switch protein FliM. J. Mol. Biol. 289:1423–1433.
- Cluzel et al. (2000) Cluzel, P., M. Surette, and S. Leibler, 2000. An ultrasensitive bacterial motor revealed by monitoring signaling proteins in single cells. Science 287:1652–1655.
- Sagi et al. (2003) Sagi, Y., S. Khan, and M. Eisenbach, 2003. Binding of the chemotaxis response regulator CheY to the isolated, intact switch complex of the bacterial flagellar motor: lack of cooperativity. J. Biol. Chem. 278:25867–25871.
- Yuan and Berg (2013) Yuan, J., and H. C. Berg, 2013. Ultrasensitivity of an adaptive bacterial motor. J. Mol. Biol. 425:1760–1764.
- Alon et al. (1998) Alon, U., L. Camarena, M. G. Surette, B. Aguera y Arcas, Y. Liu, S. Leibler, and J. B. Stock, 1998. Response regulator output in bacterial chemotaxis. EMBO J. 17:4238–4248.
- Skoge et al. (2011) Skoge, M., Y. Meir, and N. S. Wingreen, 2011. Dynamics of cooperativity in chemical sensing among cell-surface receptors. Phys. Rev. Lett. 107:178101.
- Lan et al. (2012) Lan, G., P. Sartori, S. Neumann, V. Sourjik, and Y. Tu, 2012. The energy-speed-accuracy tradeoff in sensory adaptation. Nat Phys 8:422–428.
- Bai et al. (2010) Bai, F., R. W. Branch, D. V. Nicolau, T. Pilizota, B. C. Steel, P. K. Maini, and R. M. Berry, 2010. Conformational spread as a mechanism for cooperativity in the bacterial flagellar switch. Science 327:685–689.
- Elowitz et al. (1999) Elowitz, M. B., M. G. Surette, P. E. Wolf, J. B. Stock, and S. Leibler, 1999. Protein mobility in the cytoplasm of Escherichia coli. J. Bacteriol. 181:197–203.
- Nenninger et al. (2010) Nenninger, A., G. Mastroianni, and C. W. Mullineaux, 2010. Size dependence of protein diffusion in the cytoplasm of Escherichia coli. J. Bacteriol. 192:4535–4540.
- Northrup and Erickson (1992) Northrup, S. H., and H. P. Erickson, 1992. Kinetics of protein-protein association explained by Brownian dynamics computer simulation. Proc. Natl. Acad. Sci. U.S.A. 89:3338–3342.
- Mayover et al. (1999) Mayover, T. L., C. J. Halkides, and R. C. Stewart, 1999. Kinetic characterization of CheY phosphorylation reactions: comparison of P-CheA and small-molecule phosphodonors. Biochemistry 38:2259–2271.
- Neumann et al. (2014) Neumann, S., L. Løvdok, K. Bentele, J. Meisig, E. Ullner, F. S. Paldy, V. Sourjik, and M. Kollmann, 2014. Exponential signaling gain at the receptor level enhances signal-to-noise ratio in bacterial chemotaxis. PLoS ONE 9:e87815.
- Sourjik and Berg (2002b) Sourjik, V., and H. C. Berg, 2002. Receptor sensitivity in bacterial chemotaxis. Proc. Natl. Acad. Sci. U.S.A. 99:123–127.
- Oleksiuk et al. (2011) Oleksiuk, O., V. Jakovljevic, N. Vladimirov, R. Carvalho, E. Paster, W. S. Ryu, Y. Meir, N. S. Wingreen, M. Kollmann, and V. Sourjik, 2011. Thermal robustness of signaling in bacterial chemotaxis. Cell 145:312–321.
- van Albada and Rein ten Wolde (2009) van Albada, S. B., and P. Rein ten Wolde, 2009. Differential Affinity and Catalytic Activity of CheZ in E. coli Chemotaxis. PLoS Comp. Biol. 5:e1000378.
- Burger et al. (2010) Burger, A., A. M. Walczak, and P. G. Wolynes, 2010. Abduction and asylum in the lives of transcription factors. Proc. Natl. Acad. Sci. U.S.A. 107:4016–4021.
- Celani and Vergassola (2010) Celani, A., and M. Vergassola, 2010. Bacterial strategies for chemotaxis response. Proc. Natl. Acad. Sci. U.S.A. 107:1391–1396.
- Rosenfeld et al. (2002) Rosenfeld, N., M. B. Elowitz, and U. Alon, 2002. Negative autoregulation speeds the response times of transcription networks. J. Mol. Biol. 323:785–793.
- Yamamoto et al. (2005) Yamamoto, K., K. Hirao, T. Oshima, H. Aiba, R. Utsumi, and A. Ishihama, 2005. Functional characterization in vitro of all two-component signal transduction systems from Escherichia coli. J. Biol. Chem. 280:1448–1456.
- Levit et al. (2002) Levit, M. N., T. W. Grebe, and J. B. Stock, 2002. Organization of the receptor-kinase signaling array that regulates Escherichia coli chemotaxis. J. Biol. Chem. 277:36748–36754.
- Francis et al. (2002) Francis, N. R., M. N. Levit, T. R. Shaikh, L. A. Melanson, J. B. Stock, and D. J. DeRosier, 2002. Subunit Organization in a Soluble Complex of Tar, CheW, and CheA by Electron Microscopy. J. Biol. Chem. 277:36755–36759.
- Shrout et al. (2003) Shrout, A. L., D. J. Montefusco, and R. M. Weis, 2003. Template-directed assembly of receptor signaling complexes. Biochemistry 42:13379–13385.
- Lipkow et al. (2005) Lipkow, K., S. S. Andrews, and D. Bray, 2005. Simulated diffusion of phosphorylated CheY through the cytoplasm of Escherichia coli. J. Bacteriol. 187:45–53.
- Wuichet and Zhulin (2010) Wuichet, K., and I. B. Zhulin, 2010. Origins and diversification of a complex signal transduction system in prokaryotes. Sci. Signal. 3:ra50.
- Stocker et al. (2008) Stocker, R., J. R. Seymour, A. Samadani, D. E. Hunt, and M. F. Polz, 2008. Rapid chemotactic response enables marine bacteria to exploit ephemeral microscale nutrient patches. Proc. Natl. Acad. Sci. U.S.A. 105:4209–4214.
- He and Bauer (2014) He, K., and C. E. Bauer, 2014. Chemosensory signaling systems that control bacterial survival. Trends Microbiol. 22:389–398.
- Taniguchi et al. (2010) Taniguchi, Y., P. J. Choi, G. W. Li, H. Chen, M. Babu, J. Hearn, A. Emili, and X. S. Xie, 2010. Quantifying E. coli proteome and transcriptome with single-molecule sensitivity in single cells. Science 329:533–538.
- Russo and Silhavy (1993) Russo, F. D., and T. J. Silhavy, 1993. The essential tension: opposed reactions in bacterial two-component regulatory systems. Trends Microbiol. 1:306–310.
- Batchelor and Goulian (2003) Batchelor, E., and M. Goulian, 2003. Robustness and the cycle of phosphorylation and dephosphorylation in a two-component regulatory system. Proc. Natl. Acad. Sci. U.S.A. 100:691–696.
- Blat and Eisenbach (1996) Blat, Y., and M. Eisenbach, 1996. Oligomerization of the Phosphatase CheZ Upon Interaction with the Phosphorylated Form of CheY. J. Biol. Chem. 271:1226–1231.
- Blat and Eisenbach (1998) Blat, Y., and M. Eisenbach, 1998. Regulation of Phosphatase Activity in Bacterial Chemotaxis. J. Mol. Biol. 284:1191–1199.
- Cannistraro et al. (2011) Cannistraro, V. J., G. D. Glekas, C. V. Rao, and G. W. Ordal, 2011. Cellular stoichiometry of the chemotaxis proteins in Bacillus subtilis. J. Bacteriol. 193:3220–3227.
- Hansen et al. (2010) Hansen, C. H., V. Sourjik, and N. S. Wingreen, 2010. A dynamic-signaling-team model for chemotaxis receptors in Escherichia coli. Proc. Natl. Acad. Sci. U.S.A. 107:17170–17175.
- Løvdok et al. (2009) Løvdok, L., K. Bentele, N. Vladimirov, A. Muller, F. S. Pop, D. Lebiedz, M. Kollmann, and V. Sourjik, 2009. Role of translational coupling in robustness of bacterial chemotaxis pathway. PLoS Biol. 7:e1000171.
- Sourjik and Berg (2004) Sourjik, V., and H. C. Berg, 2004. Functional interactions between receptors in bacterial chemotaxis. Nature 428:437–441.
- Stewart et al. (2000) Stewart, R. C., K. Jahreis, and J. S. Parkinson, 2000. Rapid phosphotransfer to CheY from a CheA protein lacking the CheY-binding domain. Biochemistry 39:13157–13165.
- Pontius et al. (2013) Pontius, W., M. W. Sneddon, and T. Emonet, 2013. Adaptation dynamics in densely clustered chemoreceptors. PLoS Comput. Biol. 9:e1003230.
- Silversmith et al. (2001) Silversmith, R. E., J. G. Smith, G. P. Guanga, J. T. Les, and R. B. Bourret, 2001. Alteration of a nonconserved active site residue in the chemotaxis response regulator CheY affects phosphorylation and interaction with CheZ. J. Biol. Chem. 276:18478–18484.
- Stewart and VanBruggen (2004) Stewart, R. C., and R. VanBruggen, 2004. Phosphorylation and binding interactions of CheY studied by use of Badan-labeled protein. Biochemistry 43:8766–8777.
- Thomas et al. (2008) Thomas, S. A., J. A. Brewster, and R. B. Bourret, 2008. Two variable active site residues modulate response regulator phosphoryl group stability. Mol. Microbiol. 69:453–465.
- Kentner and Sourjik (2009) Kentner, D., and V. Sourjik, 2009. Dynamic map of protein interactions in the Escherichia coli chemotaxis pathway. Mol. Syst. Biol. 5:238.
- Stewart (1993) Stewart, R. C., 1993. Activating and inhibitory mutations in the regulatory domain of CheB, the methylesterase in bacterial chemotaxis. J. Biol. Chem. 268:1921–1930.
- Simms et al. (1987) Simms, S. A., A. M. Stock, and J. B. Stock, 1987. Purification and characterization of the S-adenosylmethionine:glutamyl methyltransferase that modifies membrane chemoreceptor proteins in bacteria. J. Biol. Chem. 262:8537–8543.
- Barnakov et al. (2002) Barnakov, A. N., L. A. Barnakova, and G. L. Hazelbauer, 2002. Allosteric enhancement of adaptational demethylation by a carboxyl-terminal sequence on chemoreceptors. J. Biol. Chem. 277:42151–42156.
- Tawa and Stewart (1994) Tawa, P., and R. C. Stewart, 1994. Kinetics of CheA autophosphorylation and dephosphorylation reactions. Biochemistry 33:7917–7924.
- Wright et al. (1993) Wright, G. D., T. R. Holman, and C. T. Walsh, 1993. Purification and characterization of VanR and the cytosolic domain of VanS: a two-component regulatory system required for vancomycin resistance in Enterococcus faecium BM4147. Biochemistry 32:5057–5063.
- Grimshaw et al. (1998) Grimshaw, C. E., S. Huang, C. G. Hanstein, M. A. Strauch, D. Burbulys, L. Wang, J. A. Hoch, and J. M. Whiteley, 1998. Synergistic kinetic interactions between components of the phosphorelay controlling sporulation in Bacillus subtilis. Biochemistry 37:1365–1375.
- Trajtenberg et al. (2010) Trajtenberg, F., M. Grana, N. Ruetalo, H. Botti, and A. Buschiazzo, 2010. Structural and enzymatic insights into the ATP binding and autophosphorylation mechanism of a sensor histidine kinase. J. Biol. Chem. 285:24892–24903.
- Foster et al. (2004) Foster, J. E., Q. Sheng, J. R. McClain, M. Bures, T. I. Nicas, K. Henry, M. E. Winkler, and R. Gilmour, 2004. Kinetic and mechanistic analyses of new classes of inhibitors of two-component signal transduction systems using a coupled assay containing HpkA-DrrA from Thermotoga maritima. Microbiology 150:885–896.
- Gutu et al. (2010) Gutu, A. D., K. J. Wayne, L. T. Sham, and M. E. Winkler, 2010. Kinetic characterization of the WalRKSpn (VicRK) two-component system of Streptococcus pneumoniae: dependence of WalKSpn (VicK) phosphatase activity on its PAS domain. J. Bacteriol. 192:2346–2358.
- Noriega et al. (2008) Noriega, C. E., R. Schmidt, M. J. Gray, L. L. Chen, and V. Stewart, 2008. Autophosphorylation and dephosphorylation by soluble forms of the nitrate-responsive sensors NarX and NarQ from Escherichia coli K-12. J. Bacteriol. 190:3869–3876.
- Psakis et al. (2011) Psakis, G., J. Mailliet, C. Lang, L. Teufel, L. O. Essen, and J. Hughes, 2011. Signaling kinetics of cyanobacterial phytochrome Cph1, a light regulated histidine kinase. Biochemistry 50:6178–6188.
- Rasmussen et al. (2006) Rasmussen, A. A., S. Wegener-Feldbrugge, S. L. Porter, J. P. Armitage, and L. Søgaard-Andersen, 2006. Four signalling domains in the hybrid histidine protein kinase RodK of Myxococcus xanthus are required for activity. Mol. Microbiol. 60:525–534.
- Hong et al. (2004) Hong, C. S., M. Shitashiro, A. Kuroda, T. Ikeda, N. Takiguchi, H. Ohtake, and J. Kato, 2004. Chemotaxis proteins and transducers for aerotaxis in Pseudomonas aeruginosa. FEMS Microbiol. Lett. 231:247–252.
- Ferrandez et al. (2002) Ferrandez, A., A. C. Hawkins, D. T. Summerfield, and C. S. Harwood, 2002. Cluster II che genes from Pseudomonas aeruginosa are required for an optimal chemotactic response. J. Bacteriol. 184:4374–4383.
- Whitchurch et al. (2004) Whitchurch, C. B., A. J. Leech, M. D. Young, D. Kennedy, J. L. Sargent, J. J. Bertrand, A. B. Semmler, A. S. Mellick, P. R. Martin, R. A. Alm, M. Hobbs, S. A. Beatson, B. Huang, L. Nguyen, J. C. Commolli, J. N. Engel, A. Darzins, and J. S. Mattick, 2004. Characterization of a complex chemosensory signal transduction system which controls twitching motility in Pseudomonas aeruginosa. Mol. Microbiol. 52:873–893.
- Hickman et al. (2005) Hickman, J. W., D. F. Tifrea, and C. S. Harwood, 2005. A chemosensory system that regulates biofilm formation through modulation of cyclic diguanylate levels. Proc. Natl. Acad. Sci. U.S.A. 102:14422–14427.
- Chang et al. (2005) Chang, W., D. A. Small, F. Toghrol, and W. E. Bentley, 2005. Microarray analysis of Pseudomonas aeruginosa reveals induction of pyocin genes in response to hydrogen peroxide. BMC Genomics 6:115.
- Miller et al. (2008) Miller, R. M., A. P. Tomaras, A. P. Barker, D. R. Voelker, E. D. Chan, A. I. Vasil, and M. L. Vasil, 2008. Pseudomonas aeruginosa twitching motility-mediated chemotaxis towards phospholipids and fatty acids: specificity and metabolic requirements. J. Bacteriol. 190:4038–4049.
- Nishiyama et al. (2012) Nishiyama, S., D. Suzuki, Y. Itoh, K. Suzuki, H. Tajima, A. Hyakutake, M. Homma, S. M. Butler-Wu, A. Camilli, and I. Kawagishi, 2012. Mlp24 (McpX) of Vibrio cholerae implicated in pathogenicity functions as a chemoreceptor for multiple amino acids. Infect. Immun. 80:3170–3178.
- Xu et al. (2003) Xu, Q., M. Dziejman, and J. J. Mekalanos, 2003. Determination of the transcriptome of Vibrio cholerae during intraintestinal growth and midexponential phase in vitro. Proc. Natl. Acad. Sci. U.S.A. 100:1286–1291.
- Fang et al. (2013) Fang, G., K. D. Passalacqua, J. Hocking, P. M. Llopis, M. Gerstein, N. H. Bergman, and C. Jacobs-Wagner, 2013. Transcriptomic and phylogenetic analysis of a bacterial cell cycle reveals strong associations between gene co-expression and evolution. BMC Genomics 14:450.
- Tiricz et al. (2013) Tiricz, H., A. Szucs, A. Farkas, B. Pap, R. M. Lima, G. Maroti, E. Kondorosi, and A. Kereszt, 2013. Antimicrobial nodule-specific cysteine-rich peptides induce membrane depolarization-associated changes in the transcriptome of Sinorhizobium meliloti. Appl. Environ. Microbiol. 79:6737–6746.
- Peuser et al. (2012) Peuser, V., B. Remes, and G. Klug, 2012. Role of the Irr protein in the regulation of iron metabolism in Rhodobacter sphaeroides. PLoS ONE 7:e42231.
- Metz et al. (2012) Metz, S., A. Jager, and G. Klug, 2012. Role of a short light, oxygen, voltage (LOV) domain protein in blue light- and singlet oxygen-dependent gene regulation in Rhodobacter sphaeroides. Microbiology (Reading, Engl.) 158:368–379.
- Motaleb et al. (2005) Motaleb, M. A., M. R. Miller, C. Li, R. G. Bakker, S. F. Goldstein, R. E. Silversmith, R. B. Bourret, and N. W. Charon, 2005. CheX is a phosphorylated CheY phosphatase essential for Borrelia burgdorferi chemotaxis. J. Bacteriol. 187:7963–7969.
- Oshima et al. (2002) Oshima, T., H. Aiba, Y. Masuda, S. Kanaya, M. Sugiura, B. L. Wanner, H. Mori, and T. Mizuno, 2002. Transcriptome analysis of all two-component regulatory system mutants of Escherichia coli K-12. Mol. Microbiol. 46:281–291.
- Cai and Inouye (2002) Cai, S. J., and M. Inouye, 2002. EnvZ-OmpR interaction and osmoregulation in Escherichia coli. J. Biol. Chem. 277:24155–24161.
- Ishihama et al. (2008) Ishihama, Y., T. Schmidt, J. Rappsilber, M. Mann, F. U. Hartl, M. J. Kerner, and D. Frishman, 2008. Protein abundance profiling of the Escherichia coli cytosol. BMC Genomics 9:102.
- Masuda et al. (2009) Masuda, T., N. Saito, M. Tomita, and Y. Ishihama, 2009. Unbiased quantitation of Escherichia coli membrane proteome using phase transfer surfactants. Mol. Cell Proteomics 8:2770–2777.
- Rosu and Hughes (2006) Rosu, V., and K. T. Hughes, 2006. sigma28-dependent transcription in Salmonella enterica is independent of flagellar shearing. J. Bacteriol. 188:5196–5203.
- Yuan et al. (2012) Yuan, J., R. W. Branch, B. G. Hosu, and H. C. Berg, 2012. Adaptation at the output of the chemotaxis signalling pathway. Nature 484:233–236.
- Lele et al. (2012) Lele, P. P., R. W. Branch, V. S. Nathan, and H. C. Berg, 2012. Mechanism for adaptive remodeling of the bacterial flagellar switch. Proc. Natl. Acad. Sci. U.S.A. 109:20018–20022.